Abstract
The spodium–π bonding between MX2 (M = Zn, Cd, and Hg; X = Cl, Br, and I) acting as a Lewis acid, and C2H2/C2H4 acting as a Lewis base was studied by ab initio calculations. Two types of structures of cross (T) and parallel (P) forms are obtained. For the T form, the X–M–X axis adopts a cross configuration with the molecular axis of C≡C or C=C, but both of them are parallel in the P form. NCI, AIM, and electron density shifts analyses further, indicating that the spodium–π bonding exists in the binary complexes. Spodium–π bonding exhibits a partially covalent nature characterized with a negative energy density and large interaction energy. With the increase of electronegativity of the substituents on the Lewis acid or its decrease in the Lewis base, the interaction energies increase and vice versa. The spodium–π interaction is dominated by electrostatic interaction in most complexes, whereas dispersion and electrostatic energies are responsible for the stability of the MX2⋯C2F2 complexes. The spodium–π bonding further complements the concept of the spodium bond and provides a wider range of research on the adjustment of the strength of spodium bond.
1. Introduction
Spodium bond (SpB) [1] refers to the net attractive interaction between a Group 12 element and an electron-rich atom. SpB plays a crucial role in supramolecular chemistry [2,3,4,5,6,7] and crystal engineering [8,9]. For example, a 2D supramolecular polymeric of [Hg2L(N3)4]n prepared with Hg(CH3COO)2, NaN3, and 1,2-bis(pyridin-2-ylmethylene)hydrazine, non-covalent interactions, including spodium bonding, have a defining structure-guiding role. Two new dinuclear Zn(II) complexes [5] were synthesized and characterized. By using a combination of Bader’s quantum theory of ‘‘atoms in molecules’’ (QTAIM) and noncovalent interaction (NCI) method analyses, intramolecular SpBs were characterized and differentiated from coordination bonds [5]. What is more, there is already evidence on the existence and relevance of SpB in biological systems [10,11]. The evidence of spodium bonds in tetrahedral Zn-binding sites [10] demonstrates that Zn SpB’s are abundant and might be involved in protein structures and enzyme inhibition. The strength of three protein models’ SpB interactions in biologically relevant metalloenzymes [11] was estimated by using a combination of QTAIM and NCI plot index computational tools.
After the concept of SpB was proposed, the related experimental and theoretical studies were reported rapidly [12,13,14,15,16,17,18,19,20,21,22]. The non-covalent SpB between the tetracoordinated molecules MX2L2 (M = Zn, Cd, Hg; X = Cl, Br, I; L = thiourea) and the electron-donating molecules is different from the coordination bonds (anti-bonding Sp–ligand orbital involved). The HgCl2⋯L dimers (where L = ClR, SR2, PR3 families) were explored to unveil the nature of the linear coordinated spodium bonds [12]. In addition, the ability of the HgX2 (X = Cl, Br, I) dimer to establish secondary Hg⋯X contacts (spodium bond) and Hg⋯Hg was described [9,13]. The structures, intermolecular interactions, and the spectral variations in the mixtures containing a wide range of compositions (1:3 to 1:14 in molar ratios) of ethanol and ZnCl2 was explored to shed light on understanding the properties of the deep eutectic solvents formed by them [14]. What is more, the bi-coordinated molecules ZnX2 interact with either a carbene [15,16] or carbodiphosphorane [15] carbon atom, resulting in a C⋯Zn bond. Compared with the beryllium bond, the C⋯Zn bond is not much different than the beryllium bond, and both have a significant covalent contribution [15]. The planar MCl3− (M = Zn, Cd, Hg) anions containing a negative π-hole region form a complex with the CN− anion [17] or one another MX3− [18,19]. The anion⋯anion spodium bonds and crystal packing forces attribute to some crystal structures [18]. In addition, the SpB coexists simultaneously with other non-covalent interactions in the same system. For example, Liu et al. explored the cooperativity between SpB and pnicogen [20]/chalcogen [21]/tetrel bonds [22] in ternary complexes, and these interactions are strengthened by each other. Accordingly, the electron donors are lone pair electrons and carbenes.
Usually, the π system (ethyne and ethene) is one the candidate electron donor and participates in the σ/π–hole interactions [23,24,25], such as the aerogen bond [24], hydrogen bond [26,27,28,29,30], lithium bond [31,32,33], beryllium bond [34], sodium bond [35], magnesium bond [36], regium bond [37,38,39,40], triel bond [41], tetrel bond [42,43], pnictogen bond [44], chalcogen bond [45], halogen bond [46], and so on [47,48,49]. Wang et al. [50] provided some experimental evidence for the zinc−diborene π interactions in complexes of Zn(II)/Cd(II) with diborene. However, there is no theoretical research on the spodium bonds involved in π systems.
Hence, in this paper, we first study the interaction between MX2 (M=Zn, Cd, and Hg; X = Cl, Br, and I) and C2H2/C2H4 to explore the dependence of spodium bonding strength on the nature of the M atom and the hybridization of π molecular as well as to unveil the origin of a spodium bond. MX2 is a well-known linear molecule which has a large positive electrostatic potential generated on the waist of the Group 12 atom. C2H2 and C2H4 have a negative electrostatic potential region above and below the C=C/C≡C. Thus, there should be a strong attraction interaction between them. Considering the stronger electron-withdrawing ability of the F atom and the stronger electron-donating ability of the Li atom, the H atoms in C2H2 are replaced with –F and –Li, and the corresponding systems were used to study substitution effects on the interactions. What is more, we utilize sp-hybridized C2H2 and sp2-hybridized C2H4 interacted with MX2 to explore the hybridization effect.
2. Theoretical Methods
The second-order Møller–Plesset (MP2) perturbation theory [51] has been a good method for studying intermolecular interactions [24,39,52,53,54,55,56]. Furthermore, the MP2 method was adopted to study spodium bonds [1,18,20,21]. All complexes were optimized using MP2 perturbation theory with aug-cc-pVTZ basis sets [57,58]. Moreover, for iodine, zinc, chromium, and mercury atoms, the aug-cc-pVTZ-PP basis set was adopted to account for relativistic effects. Two types of structures of the cross (T) and parallel (P) forms were obtained. The frequency analysis at the same computational level was applied to affirm that the optimized geometries corresponded to the ground-state stationary points. It is worth noting that for ethyne and ethane complexes, the global minima corresponded to the P form, while the T form was a transition state with 1 imaginary frequency. The interaction energy was defined as the difference between the energy of the complex and the energies of the monomers with their geometries taken from the complex. Using the counterpoise method proposed by Boys and Bernardi [59], the interaction energy was corrected for the basis set superposition error (BSSE). All calculations were performed using Gaussian 09 package [60]. The interaction energy was also analyzed at the MP2/aug-cc-pVTZ (PP) level by the localized molecular orbital energy decomposition analysis (LMOEDA) method [61] with GAMESS program [62]. The total interaction energy can be decomposed into 5 components: electrostatic (ES); exchange (EX); repulsion (REP); polarization (POL); and dispersion (DISP) energies.
Molecular electrostatic potentials (MEPs) on the 0.001 electronsbohr−3 contour of the electronic density were calculated with the Multiwfn [63] at the MP2/aug-cc-pVTZ(PP) level. To obtain a deeper insight into the interaction nature of these complexes in the light of charge transfer and orbital interactions, we performed natural bond orbital (NBO) [64] analyses included in Gaussian 09. Quantum theory of “atoms in molecules” (QTAIM) analysis [65] was performed with the Multiwfn [63] to obtain topological parameters of the bond critical point (BCP), including electron density (ρ), its Laplacian (▽2ρ), and total energy density (H). Since the electron density is at a maximum at the nuclei, the localization of maxima enables the identification of atomic positions. The first-order saddle points between the maxima are usually known as bond critical points (BCPs) [34,65]. The wavefunctions were used to perform topological analyses for these complexes, including non-covalent interaction (NCI). NCI maps were plotted with the VMD program [66]. NCI involves the reduced density gradient (RDG) and the electron density (ρ). RDG is defined as:
3. Results and Discussion
3.1. Molecular Electrostatic Potential of Monomers
Molecular electrostatic potential (MEP) is a very effective method for predicting the possibility of intermolecular interactions, which could ascertain the most appropriate interaction region of each monomer [12,20,67,68,69]. Figure 1 depicts the MEP maps of ZnBr2 and π systems. It is evident that the most positive MEP (Vmax) was generated on the waist of Zn atom in ZnBr2, which was similar to the rest of the MX2 monomers (M = Zn, Cd, Hg; X=Cl, Br, I), and the most negative MEP (Vmin) was between two carbons in the π systems. There should be a strong attraction between the M atom and a π system. The values of Vmax and Vmin for monomers are collected in Table 1. It is immediate that for the MX2 with the same M and different halogen atoms, the value of Vmax on the M atom increased in the order of I < Br < Cl; and for the ones with the same halogen atom, Vmax became more positive in the order of Hg < Zn < Cd, likely due to the 4d series moderate polarizability and primogenic repulsion from inner core d-electrons [70,71]. This indicates that the value of Vmax on M atom became more positive as the halogen was less polarizable. The Vmin of sp2-hybridized ethylene was slightly more negative than that in acetylene. For the acetylene system, electron-withdrawing atom F increased the Vmin, and electron-donor atom Li became Vmin more negative.
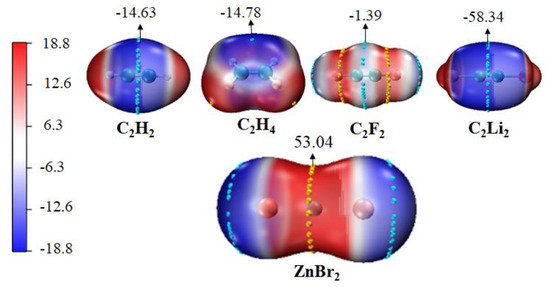
Figure 1.
MEP surfaces of ZnBr2 and π systems at the MP2/aug-cc-pVTZ(PP) level of theory at the 0.001 electrons Bohr−3. Cyan and yellow balls on the surface correspond to Vmin and Vmax, respectively. All are in kcal/mol.

Table 1.
The most positive (Vmax) and negative (Vmin) MEPs on the M atoms and π systems. All in kcal/mol.
3.2. Geometrics and Interaction Energies
The binary complexes between MX2 (M = Zn, Cd, and Hg; X = Cl, Br, and I) and acetylene or ethylene may adopt two different forms depending on the relative orientation of the MX2 subunit with respect to the unsaturated molecule (Figure 2). It should be noted that the T-form complexes are transition states with an imaginary frequency, while P-form complexes are global minima. In MX2⋯C2H2–T or MX2⋯C2H4–T (T form), the X–M–X axis adopts a cross configuration (θ is 82°–83°) with the molecular axis of C≡C or C=C but is parallel (θ = 0°) with the latter in MX2⋯C2H2–P and MX2⋯C2H4–P (P form). These forms are similar to previous work of π–beryllium bonds [34], π–magnesium bonds [36], and aerogen–π bonds [24]. The geometric parameters of these binary complexes and corresponding monomers are shown schematically in Figure 2 and in Figure S1, and the corresponding values are listed in Table 2 and Table S1, together with the interaction energy.
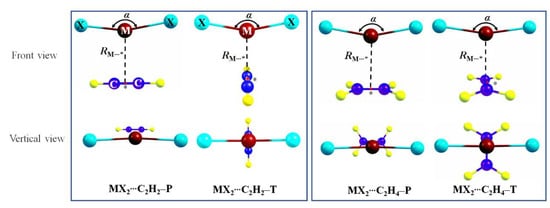
Figure 2.
Schemes of spodium–π bonded binary complexes. Dark red is the M atom (M = Zn, Cd, Hg), cyan is halogen atom X (X = Cl, Br, I), blue is C atom and yellow is H atom. Binding distance RM⋯* between the M in MX2 and the centers of C–C bond in π molecules (* denotes the center of C–C bond). The angle of X–M–X in MX2 is α. Dihedral angle of X–X⋯C–C is marked by θ.
Table 2.
Binding distance (RM⋯* in Å) between the M in MX2 and the centers of C–C bond in π molecules (* denotes the center of C–C bond), M−X (RM–X in Å) and C−C bond length (RC–C in Å) of complexes, X-M-X angle (α in degrees), and dihedral angle of X–X⋯C–C (θ in degrees), and interaction energies (ΔE, kcal/mol) in the complexes.
In all complexes, the MX2 subunit, which is linear for the isolated molecule, becomes nonlinear, with X–M–X angle α between 143° and 176°. We attribute this obvious bending to the charge transfer between the highest π-occupied orbitals of the unsaturated moiety and the lowest unoccupied orbitals of the MX2 moiety. The α in P form is smaller than that in the T form. For example, the α is 149° in ZnBr2⋯C2H2–P and 158° in ZnBr2⋯C2H2–T. This indicates that there is a stronger charge transfer in P form than that in the T form. What is more, the curvature increases with the order Hg, Cd, and Zn, and the bending diminishes with the decrease of halogen atomic number.
The binding distance RM⋯* defined as the distance between the M atom of MX2 and the center of C–C bond in C2H2 or C2H4 is in the wide range of 2.4–3.1 Å, which is longer than that in MCO3 (M = Zn, Cd, Hg)⋯nitrogen-containing bases (HCN, NHCH2, NH3) (1.9–2.2 Å) [20] and ZnX2⋯carbene (2.0–2.2 Å) [15] or (2.12–2.20 Å) [16]. It shows that there is a spodium–π bond between MX2 and C2H2 or C2H4. In general, the RM⋯* becomes shorter in the order of Hg→Cd→Zn. For example, ZnX2⋯C2H2–P (2.387–2.406 Å) is shorter by 0.3 Å than that in CdX2⋯C2H2–P (2.664–2.700 Å) and 0.7 Å in HgX2⋯C2H2–P (3.056–3.145 Å). In addition, with the increase of the halogen atomic number, the RM⋯* increases by 0.04 Å in CdX2⋯C2H2–P and 0.09 Å in HgX2⋯C2H2–P, although it decreases by 0.02 Å in ZnX2⋯C2H2–P. Compared with MX2⋯C2H2–P dimers, the RM⋯* of MX2⋯C2H2–T has an elongation (0.02−0.19 Å) except ZnBr2⋯C2H2–T and ZnI2⋯C2H2–T. The M⋯* distance of MX2⋯C2H4–P shortens by 0.01−0.05 Å than that in MX2⋯C2H2–P. Compared to MX2⋯C2H4–P, the change of RM⋯* in MX2⋯C2H4–T is about ~0.1 Å.
The interaction energies ΔE between MX2 and C2H2 or C2H4 are larger in the order of Hg < Cd < Zn (from −1.37 kcal/mol to −11.68 kcal/mol at the MP2/aug-cc-pVTZ level), although weaker than the interaction energy of MCO3 (M = Zn, Cd, Hg)⋯nitrogen-containing bases (HCN, NHCH2, NH3) complex (−31 kcal/mol to −56 kcal/mol at the MP2/aug-cc-pVTZ level) [20], and dissociation energy of ZnX2⋯carbene (10–79 kcal/mol at the ωB97X-D/6-311++G(2df,2p) level) [15] or (18.5–27.4 kcal/mol at the MN15/6-311+G(d) level) [16]. The ΔE of the Zn-containing binary is 3–6 times that of the Hg-containing binary. The order of ΔE is inconsistent with the order of Vmax value of the electrostatic potential of M (Hg < Zn < Cd). We predict that there are other types of interaction components besides the electrostatic one, which is dominant in the formation of the spodium bond [20]. The coexistence of strong attractive (blue regions), weak attractive (green regions), and strong repulsion (red regions) interactions (Figures S2–S5, in Section 3.5) seems to prove this. In addition, the interaction energies are stronger in the order of I < Br < Cl. This trend of interaction energies could be demonstrated by the electrostatic interactions between the positive MEPs of Zn/Cd/Hg and the negative ones of C2H2 or C2H4. The interaction energy analysis shows that both hybridizations have a small difference as well as. The Vmin of C2H2 (−14.63 kcal/mol) and C2H4 (−14.78 kcal/mol) is similar, which explains the aforementioned phenomenon. It indicates that the carbon hybridization of the Lewis base has a faint effect on the spodium–π bond.
3.3. Substituent Effect
To explore the substitution effect on the spodium–π bond, we replaced the H atom in MX2⋯C2H2–P with F or Li. The interactions in the F-substituted complexes MX2⋯C2F2–P became weaker than that in MX2⋯C2H2–P, characterized by a longer binding distance RM⋯* (~0.5 Å in ZnX2⋯C2F2–P, ~0.3 Å in CdX2⋯C2F2–P, less than 0.1 Å in HgX2⋯C2F2–P) and smaller interaction energy (−0.79 kcal/mol to −3.25 kcal/mol: in the order of Hg < Zn < Cd). This was due to the large electron-withdrawing ability of F, which significantly decreased the negative MEPs of C2F2. As a consequence, the interaction energies between MX2 and C2F2 became weaker, with a long binding distance. The order of interaction energy was consistent with the order of Vmax value on M (Hg < Zn < Cd), and the decreased magnitude of interaction energy in MX2⋯C2F2–P was in the order of Zn (~8 kcal/mol) < Cd (~6 kcal/mol) < Hg (~1 kcal/mol). This confirms the important role of electrostatic interactions in MX2⋯C2F2–P system. In addition, the α close to 180°, and the dihedral angle θ increased from 0° to 33–52°. It indicates that the repulsion interactions decreased. This is illustrated by the original red regions turning orange in Figure S6.
On the contrary, the interaction for MX2⋯C2Li2–P was strengthened with a shorter binding distance and larger interaction energy (approximately 9–20 times). The change of binding distance RM⋯* in MX2⋯C2Li2–P was obvious, shortened by 0.4 Å in ZnX2⋯C2Li2–P, 0.5 Å in CdX2⋯C2Li2–P, 0.9 Å in HgX2⋯C2Li2–P. The shorter binding distance was ascribed to the increase of electrostatic interaction between MX2 and C2Li2, resulting in the more negative MEPs of C2Li2. Compared with MX2⋯C2H2–P, although the increased multiple of interaction energy was ~9 times for ZnX2⋯C2Li2–P, ~10 times for CdX2⋯C2Li2–P, and ~25 times for HgX2⋯C2Li2–P, the interaction energies for MX2⋯C2Li2–P were stronger in the order of Hg < Cd < Zn. What is more, the molecular deformation for MX2⋯C2Li2–P (α: 117–134°) was more significant than that in MX2⋯C2H2–P, which can be chalked up to strong interaction energies. It shows that other forms of interaction components (Figure S7) beyond electrostatic effects also play an important role.
The charge transfer CT in the complexes is presented in Table S2. The negative charge transfer confirms the Lewis acid roles for the MX2 molecules. The charge transfer in ZnX2⋯C2H2–P and CdX2⋯C2H2–P is about −0.06 e and is about −0.02 e for HgX2⋯C2H2–P. F substituents decrease the charge transfer (−0.020 e to −0.043 e) due to their electron-withdrawing nature, whereas the electron donor Li increases the charge transfer (−0.870 e to −1.293 e).
The second-order perturbation energies (E(2)) of spodium–π interaction is analyzed with mainly orbital interaction BDC≡C→LP*M, where BDC≡C denotes the C≡C bonding orbital, and LP*M is the lone pair anti-bonding orbital of the Group 12 atom. Accompanied with these orbital interactions, there occurs a charge transfer from ethyne/ethene to MX2, confirmed by the negative charge on MX2 [15,24]. The Group 12 elements are usually considered to be post-transition or main group elements and are not labeled as transition metals [72]. Using the traditional DCD model [73] cannot interpret well the spodium–π interaction. It is necessary to point out that there are other orbital interactions in the spodium–π interaction. The orbital interactions in HgX2⋯C2H2–P are much weaker than those in CdX2⋯C2H2–P and ZnX2⋯C2H2–P, indicating the partial covalent characteristics of the latter two systems. For the same metal in MX2, E(2) (BDC≡C→LP*M) becomes higher with the increase of X atomic number, which is in the reverse order of the corresponding systems’ interaction energy. We attribute this inconsistency to the coexistence of spodium bond, the X∙∙∙H interactions, and coulomb repulsive interaction.
3.4. AIM
The existence of spodium–π interaction is further characterized with the presence of BCPs between the M atoms and π system (Figure S8). Electron density (ρ), Laplacian (▽2ρ), and total energy density (H) at the intermolecular BCPs of the complexes are listed in Table 3 and Table S3. The ρ value for the spodium–π interaction containing Zn and Cd is about 0.03−0.04 au, which is smaller than that in MCO3 (M = Zn, Cd, Hg)⋯nitrogen-containing bases (HCN, NHCH2, NH3) complex (0.08 au) [20], and of ZnX2 (X = H, Me, Et or F, Cl, Br) with carbenes or carbodiphosphoranes (0.07−0.11 au) [15,16]. For most complexes, the electron density is larger with the increase of the interaction energy. However, this law is not applicable to the Zn containing systems, mainly because of the existence of strong repulsion resulting from the orbital interaction between the Zn–X bonding and C–H bonding of C2H2/C2H4. Hence, the strength of spodium–π bond in most cases can be measured by the topological parameters, particularly the electron density. F substituents prominently decrease the electron density of Zn and Cd systems due to their electron-withdrawing nature, whereas the electron density changes slightly for the system containing Hg. Compared with MX2⋯C2H2–P, the stronger electron donor Li increases the electron density by approximately 2–6 times, reached up to 0.07−0.08 au. The values of ρ increase in the order of Hg < Cd < Zn, which is the same as the order of interaction energies.
Table 3.
Electron density (ρ in au), Laplacian (▽2ρ in au), and total energy density (H in au) at the intermolecular bond critical points (BCPs) in the complexes.
It has been confirmed that the type of interactions can be classified in the light of the sign of ▽2ρ and H [74]. Positive ▽2ρ and H indicate a purely closed-shell interaction. The partially covalent nature can be confirmed by the positive ▽2ρ and negative H [75,76]. For the spodium–π interaction of HgX2⋯C2H2–P, HgX2⋯C2H2–T, and HgX2⋯C2F2–P, HgX2⋯C2H4–P in which Hg is the Lewis acid, both ▽2ρ and H are positive, corresponding to a purely closed-shell interaction. However, the ▽2ρ is positive and the H is negative for the complexes containing Zn and Cd, indicating a partially covalent interaction [74,77,78]. The SpB involving lone pairs [20], anions [18], carbenes, or carbodiphosphoranes [15] are also characterized by a degree of covalence. Thus, in combination with the high interaction energies as discussed above, spodium–π interaction containing Zn and Cd has a partially covalent nature. Both ▽2ρ and H are positive in MX2⋯C2F2–P, corresponding to a purely closed-shell interaction. Positive ▽2ρ and negative H confirm the partially covalent nature interaction for MX2⋯C2Li2–P. This shows that the substituent atoms of π system change the nature of spodium–π interaction.
It is interesting to check the quality of the exponential relationship between the interaction energy ΔE and the binding distance RM⋯*, or the charge transfer CT, or the electron density ρ at the BCP. Three of all (Figure 3a–c) display an exponential relationship with the ΔE, with a correlation coefficient of ~0.99. Thus, they can be used to estimate the change of spodium–π interaction strength. In addition, there is an exponential relationship between CT and ρ (Figure 3d). A greater value of ρ means more charge transfer between MX2 and π systems.
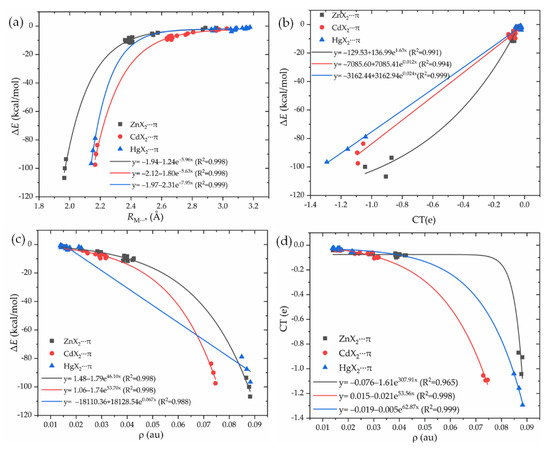
Figure 3.
The relationships between the interaction energy ΔE and the binding distance RM⋯* (a), charge transfer CT (b), or the electron density ρ at the BCP (c), and the relationships between CT and ρ at the bond critical point (d).
3.5. NCI Analyses
Noncovalent interaction analysis (NCI) provides the graphical visualization of the regions where non-covalent interactions occur in real-space, which was capable of distinguishing van der Waals interactions and repulsive steric interactions [79,80]. NCI analysis also offers continuous surfaces through color codes, which is able to recognize the attractive or repulsive nature of the interactions and to decide their relative strength on a qualitative but visual basis. To our knowledge, this technique was carried out for the spodium bond [4,15,16,20]. Thus, we are interested in the deep insights that NCI method can provide for the complexes between MX2 and π systems. NCI analysis for some complexes is depicted in Figure 4, and the analysis for all complexes is shown in Figures S2–S7. The color-mapped isosurfaces and corresponding scatter diagrams of RDG versus sign(λ2)ρ for the investigated complexes are also given.
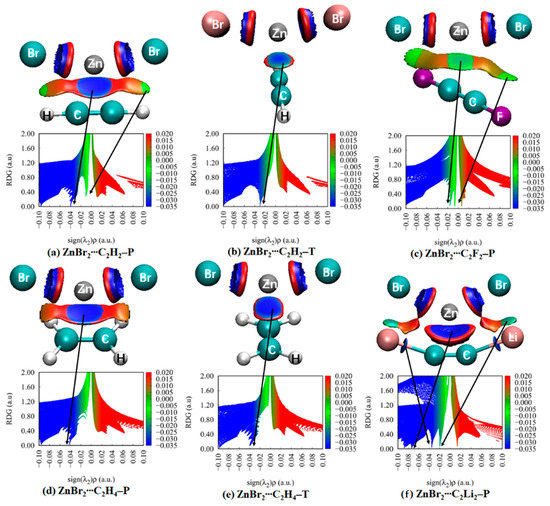
Figure 4.
Plots of the reduced density gradient RDG versus the electron density multiplied by the sign of the second Hessian eigenvalue (sign(λ2)ρ) of the selected binary complexes. NCI maps of the corresponding binary complexes. Blue, green, orange, and red areas correspond to strong attractive, weak attractive, weak repulsive, and strong repulsive interactions, respectively.
In MX2∙∙∙C2H2–P (Figure S2), there are two spikes in the negative value of the abscissa. The more negative one (about −0.04 a.u. for Zn in Figure S2a–c, −0.03 a.u. for Cd in Figure S2d–f, −0.02 a.u. for Hg in Figure S2g–i) represents the spodium–π interaction, characterized by a large blue or green disc. The less negative spike (−0.01 a.u.) is referred to the two regions of weak X∙∙∙H interaction between the H of C2H2 and X of MX2, shown by flakes. Evidently, the weak X∙∙∙H interaction cannot be detected in the AIM but can with the NCI method. The former interaction is evidently stronger than that of the latter. Between the two interactions mentioned above, a red or orange region indicates a repulsive interaction, which accounts for the coulomb repulsive interaction. In MX2∙∙∙C2H2–T (Figure S3), there is only one spike in the negative value of the abscissa representing spodium–π interaction. Moreover, the spike in MX2∙∙∙C2H2–T is less negative than that in the P form. It indicates that the spodium–π interaction in the P form is stronger than that in the T form. For MX2∙∙∙C2H4–P (Figure S4), the spodium–π spike (−0.02 a.u. to −0.04 a.u.) and repulsive spike are analogous to MX2∙∙∙C2H2–P. The spike of X∙∙∙H interactions disappears in ZnX2∙∙∙C2H4–P (Figure S4a–c) and CdX2∙∙∙C2H4–P (Figure S4d–e) and appears in HgX2∙∙∙C2H4–P (Figure S4f–g). For MX2∙∙∙C2H4–T (Figure S5), the spodium–π spike and repulsive spike in a narrow region is present, and the X∙∙∙H interactions’ spike is disappeared.
For F-substituted systems, there are similarities with MX2∙∙∙C2H2–P. The MX2∙∙∙C2F2–P complexes (Figure S6) have two attractive and one repulsive spikes. The spike representing the spodium–π interactions moves to the right direction of the X-axis than that in MX2∙∙∙C2H2–P, indicating the weakening of spodium–π interaction. The X∙∙∙F interactions are also shown (less −0.01 a.u.), which is weaker than the X∙∙∙H interactions in MX2∙∙∙C2H2–P. For the Li system (Figure S7), the spodium–π interaction spike moves to the more negative of the X-axis (−0.06 a.u. to −0.08 a.u.) than MX2∙∙∙C2H2–P, indicating the enhancement of the spodium–π interaction. The X∙∙∙Li interaction spikes are on the −0.02 a.u. Two additional blue discs around −0.04 a.u. between Li and C in C2Li2 indicate attractive interactions.
3.6. Electron Density Shift
Figure 5 illustrates the maps of electron density shifts in the ZnBr2⋯π systems, which are generated by the difference between the density of the optimized complex and the sum of individual monomers in their same internal geometries. The electron density shifts of all complexes are shown in Figures S9–S14. The increases in density arising from the interaction are illustrated in the red regions and losses shown in the blue areas. The most prominent feature is a red region in the interaction space M⋯π and a blue region of density depletion on the M atom. This feature indicates the presence of spodium–π interaction. It is found that there is a buildup of the electron density on the halogen atoms in MX2 and electron loss occurs on the H/F/Li atoms in π systems. This confirms the X⋯H/F/Li interaction. Besides, density depletion is observed on the M–X of MX2. Considering the electron loss on the H/Li atoms in π systems, it provides evidence for the steric interactions between the H/Li atoms and the M–X.
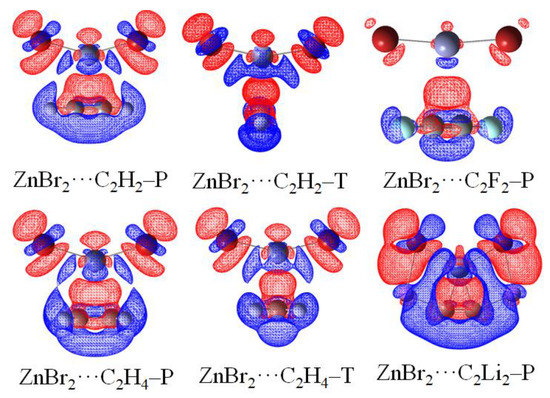
Figure 5.
Electron density shifts of selected binary complexes (iso = ± 0.0008). Red regions indicate increased electron density, while blue regions represent decreased electron density.
3.7. Energy Decomposition
A decomposition of interaction energy provides valuable insight into understanding the physical pictures of all binary complexes. The physical components from GAMESS, including electrostatic (ES), exchange (EX), repulsion (REP), polarization (POL), and dispersion (DISP) energies for some representative complexes, are presented in Table 4. More details are seen in Table S4 and Figure S15. Between MX2 and C2H2/C2H4, the remarkable overlap of molecular orbitals results in a large EX and a much larger REP. The exchange energy is chiefly caused by the overlap of molecular orbitals, and it is more negative in the P form than in the T form. Considering both EX and REP are mutually dependent, the following discussion is not focused on them. For most complexes (Figure S15a–d), the magnitude of ES is more negative than POL and DISP, indicating that the electrostatic interaction is dominant to the total interaction energy of the spodium–π bonding. For Zn/Cd containing complexes, three attractive terms (ES, POL, and DISP) become more negative in the order of DISP < POL < ES, and ES is about twice as much as POL. However, for the Hg complexes, the order is POL < DISP < ES, and POL is nearly equal to DISP. It indicates that the contribution of POL and DISP cannot be ignored. On the other hand, with the variation of halogen substituent for a given Group 12 metal, a little energy difference is found in the energy components, that is, halogen substituents have little effect on the nature of the spodium–π interaction.
Table 4.
Electrostatic energy (ES), exchange energy (EX), repulsion energy (REP), polarization energy (POL), and dispersion energy (DISP) in the selected complexes. All are in kcal/mol.
The strong electron-withdrawing group F (Figure S15e) causes a great reduction of ES and POL, especially in ZnX2⋯C2F2–P and CdX2⋯C2F2–P. In both systems, ES is the most negative, followed by DISP, and POL is the least negative. The ES contribution is comparable with that of DISP. However, in HgX2⋯C2F2–P, the order is DISP > ES > POL, which is inconsistent with that in HgX2⋯C2H2–P, indicating that the DISP contribution is dominant. Interestingly, Li group results in a sharp increase of ES and POL and has a slight effect on DISP. Moreover, the MX2⋯C2Li2–P complexes are dominated by electrostatic energy. The relatively large POL (–80.70 kcal/mol to −119.31 kcal/mol) suggests that the orbitals undergo a significant change in their shapes, a typical character in the formation of covalent bonds, conforming the partially covalent nature of spodium–π interaction in MX2⋯C2Li2–P (Figure S15f). Obviously, the substituent of Lewis acid has a prominent effect on the nature of spodium–π interaction.
3.8. Comparison
There are a number of reports about the interactions including π systems, such as π–hydrogen bond [26,27,28,29,30], π–lithium bond [31,32,33], π–beryllium bond [34], π–triel bond [41], π–tetrel bond [42,43], regium–π bond [37,38,39,40], π–pnictogen bond [44], π–chalcogen bond [45], π–halogen bond [46], aerogen–π bond [24], π–sodium bond [35], π–magnesium bond [36], and so on [47,48,49]. We compare the binding distance and interaction energy of some complexes. In Table 5, the shortest binding distance is ~0.93 Å in π–hydrogen bond, and the longest binding distance is ~3.3 Å in π–tetrel bond. Although the binding distances of both are different, the interaction energies are relatively weak at −2.5 kcal/mol to −2.8 kcal/mol. When different Lewis acids interact with acetylene/ethylene, the strength of interaction can be adjusted. For example, the interaction energy reaches to −11.68 kcal/mol in Cl2Zn⋯C2H4–P (MP2/aug-cc-pVTZ) and even to −58.79 kcal/mol in FAu⋯C2H4 (CCSD(T)/aug-cc-pVTZ//ωB97XD/aug-cc-pVTZ). The value of ΔEregium–π is about five times of ΔEspodium–π, and ΔEspodium–π is about five multiples of ΔEπ–hydrogen at the same calculated level (MP2/aug-cc-pVTZ). It shows that the interaction energies of spodium–π bond are moderate, which is similar to π–magnesium bond.
Table 5.
Binding distance (R in Å) and interaction energy (ΔE in kcal/mol) for some interactions, including π systems.
In addition, we compare the geometric energetic of SpB formed by molecules containing Group 12 atoms and varied molecules, such as lone-pair-containing molecules [1,11,12,14,20], anions [18], carbenes, and carbodiphosphoranes [15], and π systems. Some typical SpB’s examples are listed in Table 6. In these complexes of SpB, the binding distance R is in a range of 1.879–3.616 Å and the interaction energy ranges from −0.79 kcal/mol to −106.75 kcal/mol. The longest distance presents in the anionic dimer (HgCl3−)2 in water medium (3.62 Å), and the interaction energy is only −1.88 kcal/mol [18]. This anionic crystal structure attributes to the noncovalent spodium bonds and crystal packing forces. The interaction energy provides a wide range from −2.2 kcal/mol to −56.68 kcal/mol for the SpB involving lone pair electrons [1,20], which is dominated by electrostatics or polarization [20]. The π systems as a Lewis base participate in the formation of SpB, which further complements the concept of spodium bond. The adjustment of the SpB’s strength in a wider range (−0.79 kcal/mol to −106.75 kcal/mol) is realized.
Table 6.
Binding distance (R in Å) and interaction energy (ΔE in kcal/mol) for some typical examples of spodium bonds.
4. Conclusions
The MX2 as the Lewis acid engages in spodium–π bonds with π systems, and two different binding types (P or T form) are obtained. These complexes between the MX2 (M = Zn, Cd, and Hg; X = Cl, Br and I) and π system were investigated in view of the equilibrium structure, energetics, electrostatic potential, AIM, NCI, and energy decomposition. The total interaction consists of several parts: spodium–π interaction, X⋯H/F/Li weak interaction and repulsion interaction. Spodium–π interaction is the principal, while the other two should not be ignored. Generally, the spodium–π interaction becomes stronger in the order Hg < Cd < Zn. The enhancing effect of the halogen substituent on the MX2 is more prominent in the order of I < Br < Cl. With the increase of electronegativity of the substituents on the Lewis acid, the interaction energies increase. For the Lewis base, the interaction energies decrease with increasing electronegativity of the substituents. The nature of interactions is related to the Group 12 metals and π systems. The spodium–π interaction of complexes containing C2H2 or C2H4 is dominated by electrostatic energy, especially for Zn and Cd with a partially covalent contribution, while a purely closed-shell nature for Hg. In the complexes containing C2F2, dispersion is comparable with that of electrostatic. Even in HgX2⋯C2F2–P, dispersion contribution exceeds that of electrostatic energy. It is worth mentioning that no one plays the sole role. Our results further extend the concept of spodium bond and provide support for the adjustment of the spodium bonds’ strength in a wider range.
Supplementary Materials
The following supporting information can be downloaded at: https://www.mdpi.com/article/10.3390/molecules27092885/s1, Table S1: distances (R, Å) between M in MX2 and the centers of C–C bond in π molecules (* denote the centers of C–C bond), angles of X-M-X in MX2 (α, deg), dihedral angle of X-X⋯C-C (θ, deg), and interaction energy (ΔE, kcal/mol) in the complexes at the MP2/aug-cc-pVTZ level. Table S2: charge transfer (CT, e), second-order perturbation energies (E(2), kcal/mol) and Wiberg bond index (WBI) in the complexes in the complexes at the HF/aug-cc-pVTZ level. Table S3: electron density (ρ, au), Laplacian (▽2ρ, au), and total energy density (H, au) at the intermolecular bond critical points (BCPs) in the complexes at the MP2/aug-cc-pVTZ level. Table S4: electrostatic energy (ES), exchange energy (EX), repulsion energy (REP), polarization energy (POL), and dispersion energy (DISP) in the selected complexes at the MP2/aug-cc-pVTZ level. All are in kcal/mol. Figure S1: the optimized geometries of the MX2 (M = Zn, Cd, Hg; X = Cl, Br, I), C2H2, C2F2, C2Li2, and C2H4 molecules at the MP2/aug-cc-pVTZ level. Figure S2: plots of the reduced density gradient RDG versus the electron density multiplied by the sign of the second Hessian eigenvalue (sign(λ2)ρ) of MX2⋯C2H2–P. NCI maps of the corresponding binary complexes. Blue, green, orange, and red areas correspond to strong attractive, weak attractive, weak repulsive, and strong repulsive interactions, respectively. Figure S3: plots of the reduced density gradient RDG versus the electron density multiplied by the sign of the second Hessian eigenvalue (sign(λ2)ρ) of MX2⋯C2H2–T. NCI maps of the corresponding binary complexes. Figure S4: plots of the reduced density gradient RDG versus the electron density multiplied by the sign of the second Hessian eigenvalue (sign(λ2)ρ) of MX2⋯C2H4–P. NCI maps of the corresponding binary complexes. Figure S5: plots of the reduced density gradient RDG versus the electron density multiplied by the sign of the second Hessian eigenvalue (sign(λ2)ρ) of MX2⋯C2H4–T. NCI maps of the corresponding binary complexes. Figure S6: plots of the reduced density gradient RDG versus the electron density multiplied by the sign of the second Hessian eigenvalue (sign(λ2)ρ) of MX2⋯C2F2–T. NCI maps of the corresponding binary complexes. Figure S7: Pplots of the reduced density gradient RDG versus the electron density multiplied by the sign of the second Hessian eigenvalue (sign(λ2)ρ) of MX2⋯C2Li2–T. NCI maps of the corresponding binary complexes.Figure S8: molecular graphs of spodium–π bonded stable complexes at the intermolecular bond critical points. Figure S9: electron density shifts of the MX2⋯C2H2–P complexes (iso = ±0.0008). Red regions indicate increased electron density, while blue regions represent decreased electron density. Figure S10: electron density shifts of the MX2⋯C2H2–T complexes. Figure S11: electron density shifts of the MX2⋯C2H4–P complexes. Figure S12: Electron density shifts of the MX2⋯C2H4-T complexes. Figure S13: electron density shifts of the MX2⋯C2F2–P complexes. Figure S14: electron density shifts of the MX2⋯C2Li2–P complexes. Figure S15: comparison of electrostatic, polarization, and dispersion energies in the binary complexes.
Author Contributions
Conceptualization, M.G., H.Y., M.F.; data curation, M.G. and Q.Z.; investigation, M.G. and Q.Z; funding acquisition, M.G. and H.Y.; supervision, M.G., H.Y., M.F.; writing—original draft preparation, M.G. and Q.Z.; Software; validation; writing—review and editing, Q.L. All authors have read and agreed to the published version of the manuscript.
Funding
This research was funded by the Jingying Plan of Shandong University of Science and Technology (0104060541022), and Project of Shandong Province Higher Educational Young Innovative Talent Introduction and Cultivation Team (Hydrogen energy chemistry innovation team).
Institutional Review Board Statement
Not applicable.
Informed Consent Statement
Not applicable.
Data Availability Statement
Not applicable.
Conflicts of Interest
The authors declare no conflict of interest.
Sample Availability
Samples of the compounds are not available from the authors.
References
- Bauzá, A.; Alkorta, I.; Elguero, J.; Mooibroek, T.J.; Frontera, A. Spodium Bonds: Noncovalent Interactions Involving Group 12 Elements. Angew. Chem. Int. Ed. 2020, 59, 17482–17487. [Google Scholar] [CrossRef] [PubMed]
- Mahmoudi, G.; Lawrence, S.E.; Cisterna, J.; Cardenas, A.; Brito, I.; Frontera, A.; Safin, D.A. A new spodium bond driven coordination polymer constructed from mercury(II) azide and 1,2-bis (pyridin-2-ylmethylene) hydrazine. New J. Chem. 2020, 44, 21100–21107. [Google Scholar] [CrossRef]
- Mahmoudi, G.; Masoudiasl, A.; Babashkina, M.G.; Frontera, A.; Doert, T.; White, J.M.; Zangrando, E.; Zubkov, F.I.; Safin, D.A. On the importance of π-hole spodium bonding in tricoordinated HgII complexes. Dalton Trans. 2020, 49, 17547–17551. [Google Scholar] [CrossRef] [PubMed]
- Kumar, P.; Banerjee, S.; Radha, A.; Firdoos, T.; Sahoo, S.C.; Pandey, S.K. Role of non-covalent interactions in the supramolecular architectures of mercury(II) diphenyldithiophosphates: An experimental and theoretical investigation. New J. Chem. 2021, 45, 2249–2263. [Google Scholar] [CrossRef]
- Karmakar, M.; Frontera, A.; Chattopadhyay, S.; Mooibroek, T.J.; Bauzá, A. Intramolecular Spodium Bonds in Zn(II) Complexes: Insights from Theory and Experiment. Int. J. Mol. Sci. 2020, 21, 7091. [Google Scholar] [CrossRef]
- Basak, T.; Gomila, R.M.; Frontera, A.; Chattopadhyay, S. Differentiating intramolecular spodium bonds from coordination bonds in two polynuclear zinc(II) Schiff base complexes. CrystEngComm 2021, 23, 2703–2710. [Google Scholar] [CrossRef]
- Gomila, R.M.; Bauzá, A.; Mooibroek, T.J.; Frontera, A. Spodium bonding in five coordinated Zn(II): A new player in crystal engineering? CrystEngComm 2021, 23, 3084–3093. [Google Scholar] [CrossRef]
- Gomila, R.M.; Bauzá, A.; Mooibroek, T.J.; Frontera, A. π-Hole spodium bonding in tri-coordinated Hg(II) complexes. Dalton Trans. 2021, 50, 7545–7553. [Google Scholar] [CrossRef]
- Samie, A.; Salimi, A.; Garrison, J.C. Coordination chemistry of mercury(II) halide complexes: A combined experimental, theoretical and (ICSD & CSD) database study on the relationship between inorganic and organic units. Dalton Trans. 2020, 49, 11859–11877. [Google Scholar]
- Biswal, H.S.; Kumar Sahu, A.; Frontera, A.; Bauzá, A. Spodium Bonds in Biological Systems: Expanding the Role of Zn in Protein Structure and Function. J. Chem. Inf. Model. 2021, 61, 3945–3954. [Google Scholar] [CrossRef]
- Llull, R.; Montalbán, G.; Vidal, I.; Gomila, R.M.; Bauzá, A.; Frontera, A. Theoretical study of spodium bonding in the active site of three Zn-proteins and several model systems. Phys. Chem. Chem. Phys. 2021, 23, 16888–16896. [Google Scholar] [CrossRef] [PubMed]
- Xia, T.; Li, D.; Cheng, L.J. Theoretical analysis of the spodium bonds in HgCl2⋯L (L = ClR, SR2, and PR3) dimers. Chem. Phys. 2020, 539, 110978. [Google Scholar] [CrossRef]
- Echeverría, J.; Cirera, J.; Alvarez, S. Mercurophilic interactions: A theoretical study on the importance of ligands. Phys. Chem. Chem. Phys. 2017, 19, 11645–11654. [Google Scholar] [CrossRef] [PubMed]
- Kalhor, P.; Wang, Y.; Yu, Z. The Structures of ZnCl2-Ethanol Mixtures, a Spectroscopic and Quantum Chemical Calculation Study. Molecules 2021, 26, 2498. [Google Scholar] [CrossRef]
- Jabłoński, M. Study of Beryllium, Magnesium, and Spodium Bonds to Carbenes and Carbodiphosphoranes. Molecules 2021, 26, 2275. [Google Scholar] [CrossRef]
- Jabłoński, M. Theoretical Study of N-Heterocyclic-Carbene-ZnX2 (X = H, Me, Et) Complexes. Materials 2021, 14, 6147. [Google Scholar] [CrossRef]
- Wysokiński, R.; Zierkiewicz, W.; Michalczyk, M.; Scheiner, S. Anion⋯Anion Attraction in Complexes of MCl3− (M=Zn, Cd, Hg) with CN−. ChemPhysChem 2020, 21, 1119–1125. [Google Scholar] [CrossRef]
- Wysokiński, R.; Zierkiewicz, W.; Michalczyk, M.; Scheiner, S. Crystallographic and Theoretical Evidences of Anion⋯Anion Interaction. ChemPhysChem 2021, 22, 818–821. [Google Scholar] [CrossRef]
- Wysokiński, R.; Zierkiewicz, W.; Michalczyk, M.; Scheiner, S. Anionanion (MX3−)2 dimers (M = Zn, Cd, Hg; X = Cl, Br, I) in different environments. Phys. Chem. Chem. Phys. 2021, 23, 13853–13861. [Google Scholar] [CrossRef]
- Liu, N.; Li, Q.Z. Group 12 Carbonates and their Binary Complexes with Nitrogen Bases and FH2Z Molecules (Z=P, As, Sb): Synergism in Forming Ternary Complexes. ChemPhysChem 2021, 22, 1698–1705. [Google Scholar] [CrossRef]
- Liu, N.; Xie, X.; Li, Q. Chalcogen Bond Involving Zinc(II)/Cadmium(II) Carbonate and Its Enhancement by Spodium Bond. Molecules 2021, 26, 6443. [Google Scholar] [CrossRef] [PubMed]
- Liu, N.; Li, Q.; Scheiner, S. Spodium and tetrel bonds involving Zn(II)/Cd(II) and their interplay. Chem. Phys. 2022, 556, 111470. [Google Scholar] [CrossRef]
- Gao, M.; Yang, X.; Cheng, J.B.; Li, Q.Z.; Li, W.Z.; Loffredo, R.E. Interplay between metal⋯π interactions and hydrogen bonds: Some unusual synergetic effects of coinage metals and substituents. ChemPhysChem 2013, 14, 3341–3347. [Google Scholar] [CrossRef] [PubMed]
- Gao, M.; Cheng, J.B.; Li, W.Z.; Xiao, B.; Li, Q.Z. The aerogen–π bonds involving π systems. Chem. Phys. Lett. 2016, 651, 50–55. [Google Scholar] [CrossRef]
- Frontera, A. σ- and π-Hole Interactions. Crystals 2020, 10, 721. [Google Scholar] [CrossRef]
- Tsuzuki, S.; Honda, K.; Uchimaru, T.; Mikami, M.; Tanabe, K. Origin of the Attraction and Directionality of the NH/π Interaction: Comparison with OH/π and CH/π Interactions. J. Am. Chem. Soc. 2000, 122, 11450–11458. [Google Scholar] [CrossRef]
- McDowell, S.A.C. Isotope effects in X–H⋯π type hydrogen-bonded complexes (X = F, Cl or Br). Phys. Chem. Chem. Phys. 2001, 3, 2754–2757. [Google Scholar] [CrossRef]
- Biswal, H.S.; Wategaonkar, S. Sulfur, not too far behind O, N, and C: SH⋯π hydrogen bond. J. Phys. Chem. A 2009, 113, 12774–12782. [Google Scholar] [CrossRef]
- Andersen, J.; Heimdal, J.; Nelander, B.; Wugt Larsen, R. Competition between weak OH⋯π and CH⋯O hydrogen bonds: THz spectroscopy of the C2H2–H2O and C2H4–H2O complexes. J. Chem. Phys. 2017, 146, 194302. [Google Scholar] [CrossRef]
- Wu, Q.Y.; Su, H.; Wang, H.Y.; Wang, H. Ab initio calculations, structure, NBO and NCI analyses of X–H⋯π interactions. Chem. Phys. Lett. 2018, 693, 202–209. [Google Scholar] [CrossRef]
- Yuan, K.; Zhu, Y.; Liu, Y.; Zhang, J.; Lv, L.; Zhang, J. π Type Lithium Bond Interaction between Ethylene, Acetylene, or Benzene and Amido-lithium. Chin. J. Chem. 2009, 27, 697–702. [Google Scholar] [CrossRef]
- Aarabi, M.; Gholami, S.; Grabowski, S.J. Hydrogen and Lithium Bonds-Lewis Acid Units Possessing Multi-Center Covalent Bonds. Molecules 2021, 26, 6939. [Google Scholar] [CrossRef] [PubMed]
- Ammal, S.S.C.; Venuvanalingam, P. π-systems as lithium/hydrogen bond acceptors: Some theoretical observations. J. Chem. Phys. 1998, 109, 9820–9830. [Google Scholar] [CrossRef]
- Villanueva, E.F.; Mó, O.; Yáñez, M. On the existence and characteristics of π-beryllium bonds. Phys. Chem. Chem. Phys. 2014, 16, 17531–17536. [Google Scholar] [CrossRef] [PubMed]
- Li, Z.F.; Zhang, X.T.; Li, H.X.; Zhu, Y.C.; Yang, X.P. Theoretical observations of π-systems as sodium bond donors. Chem. Phys. Lett. 2011, 510, 273–277. [Google Scholar] [CrossRef]
- Li, S.Y.; Wu, D.; Li, Y.; Yu, D.; Liu, J.Y.; Li, Z.R. Insight into structural and π–magnesium bonding characteristics of the X2Mg⋯Y (X = H, F; Y = C2H2, C2H4 and C6H6) complexes. RSC Adv. 2016, 6, 102754–102761. [Google Scholar] [CrossRef]
- Dias, H.V.; Flores, J.A.; Wu, J.; Kroll, P. Monomeric copper(I), silver(I), and gold(I) alkyne complexes and the coinage metal family group trends. J. Am. Chem. Soc. 2009, 131, 11249–11255. [Google Scholar] [CrossRef]
- Frontera, A.; Bauzá, A. Regium-π bonds: An Unexplored Link between Noble Metal Nanoparticles and Aromatic Surfaces. Chem. Eur. J. 2018, 24, 7228–7234. [Google Scholar] [CrossRef]
- Li, H.; Li, Q.Z.; Li, R.; Li, W.Z.; Cheng, J.B. Prediction and characterization of HCCH⋯AuX (X = OH, F, Cl, Br, CH3, CCH, CN, and NC) complexes: A π Au-bond. J. Chem. Phys. 2011, 135, 074304. [Google Scholar] [CrossRef]
- Piña, M.L.N.; Frontera, A.; Bauzá, A. Regium-π Bonds Are Involved in Protein-Gold Binding. J. Phys. Chem. Lett. 2020, 11, 8259–8263. [Google Scholar] [CrossRef]
- Grabowski, S.J. Triel Bonds, π-Hole-π-Electrons Interactions in Complexes of Boron and Aluminium Trihalides and Trihydrides with Acetylene and Ethylene. Molecules 2015, 20, 11297–11316. [Google Scholar] [CrossRef] [PubMed]
- Mani, D.; Arunan, E. The X-C⋯π (X = F, Cl, Br, CN) carbon bond. J. Phys. Chem. A 2014, 118, 10081–10089. [Google Scholar] [CrossRef] [PubMed]
- Grabowski, S.J. Tetrel Bonds with π-Electrons Acting as Lewis Bases-Theoretical Results and Experimental Evidences. Molecules 2018, 23, 1183. [Google Scholar] [CrossRef] [PubMed]
- Chandra, S.; Suryaprasad, B.; Ramanathan, N.; Sundararajan, K. Dominance of unique P⋯π phosphorus bonding with π donors: Evidence using matrix isolation infrared spectroscopy and computational methodology. Phys. Chem. Chem. Phys. 2020, 22, 20771–20791. [Google Scholar] [CrossRef]
- Kong, X.; Zhou, P.-P.; Wang, Y. Chalcogen⋯π Bonding Catalysis. Angew. Chem. Int. Ed. 2021, 60, 9395–9400. [Google Scholar] [CrossRef]
- Li, R.Y.; Li, Z.R.; Wu, D.; Li, Y.; Chen, W.; Sun, C.C. Study of π halogen bonds in complexes C2H4-nFn-ClF (n = 0–2). J. Phys. Chem. A 2005, 109, 2608–2613. [Google Scholar] [CrossRef]
- Dougherty, D.A. The cation-π interaction. Acc. Chem. Res. 2013, 46, 885–893. [Google Scholar] [CrossRef]
- Yamada, S. Cation-π Interactions in Organic Synthesis. Chem. Rev. 2018, 118, 11353–11432. [Google Scholar] [CrossRef]
- Hunter, C.A.; Sanders, J.K.M. The Nature of π-π Interactions. J. Am. Chem. Soc. 1990, 112, 5525–5534. [Google Scholar] [CrossRef]
- Wang, S.R.; Arrowsmith, M.; Braunschweig, H.; Dewhurst, R.D.; Domling, M.; Mattock, J.D.; Pranckevicius, C.; Vargas, A. Monomeric 16-Electron π-Diborene Complexes of Zn(II) and Cd(II). J. Am. Chem. Soc. 2017, 139, 10661–10664. [Google Scholar] [CrossRef]
- Møller, C.; Plesset, M.S. Note on an Approximation Treatment for Many-Electron Systems. Phys. Rev. 1934, 46, 618–622. [Google Scholar] [CrossRef]
- Lopes, K.C.; Pereira, F.S.; Ramos, M.N.; de Araúijo, R.C.M.U. An ab-initio study of the C3H6-HX, C2H4-HX and C2H2-HX hydrogen-bonded complexes with X = F or Cl. Spectrochim. Acta A 2001, 57, 1339–1346. [Google Scholar] [CrossRef]
- Bhattacharyya, S.; Ghosh, S.; Wategaonkar, S. O-H stretching frequency red shifts do not correlate with the dissociation energies in the dimethylether and dimethylsulfide complexes of phenol derivatives. Phys. Chem. Chem. Phys. 2021, 23, 5718–5739. [Google Scholar] [CrossRef] [PubMed]
- Biswal, H.S.; Bhattacharyya, S.; Wategaonkar, S. Molecular-level understanding of ground- and excited-state O-H⋯O hydrogen bonding involving the tyrosine side chain: A combined high-resolution laser spectroscopy and quantum chemistry study. ChemPhysChem 2013, 14, 4165–4176. [Google Scholar] [CrossRef] [PubMed]
- Zeng, Y.L.; Zhang, X.Y.; Li, X.Y.; Zheng, S.J.; Meng, L.P. Ab initio and AIM studies on typical π-type and pseudo-π-type halogen bonds: Comparison with hydrogen bonds. Int. J. Quantum Chem. 2011, 111, 3725–3740. [Google Scholar] [CrossRef]
- Halldin Stenlid, J.; Johansson, A.J.; Brinck, T. σ-Holes and σ-lumps direct the Lewis basic and acidic interactions of noble metal nanoparticles: Introducing regium bonds. Phys. Chem. Chem. Phys. 2018, 20, 2676–2692. [Google Scholar] [CrossRef]
- Pritchard, B.P.; Altarawy, D.; Didier, B.; Gibson, T.D.; Windus, T.L. New Basis Set Exchange: An Open, Up-to-Date Resource for the Molecular Sciences Community. J. Chem. Inf. Model. 2019, 59, 4814–4820. [Google Scholar] [CrossRef]
- Kendall, R.A.; Dunning, T.H.; Harrison, R.J. Electron affinities of the first-row atoms revisited. Systematic basis sets and wave functions. J. Chem. Phys. 1992, 96, 6796–6806. [Google Scholar] [CrossRef]
- Boys, S.F.; Bernardi, F. The calculation of small molecular interactions by the differences of separate total energies. Some procedures with reduced errors. Mol. Phys. 1990, 19, 553–566. [Google Scholar] [CrossRef]
- Frisch, M.J.; Trucks, G.W.; Schlegel, H.B.; Scuseria, G.E.; Robb, M.A.; Cheeseman, J.R.; Scalmani, G.; Barone, V.; Mennucci, B.; Petersson, G.A.; et al. Gaussian 09, Revision D.01; Gaussian, Inc.: Wallingford, CT, USA, 2013. [Google Scholar]
- Su, P.F.; Li, H. Energy decomposition analysis of covalent bonds and intermolecular interactions. J. Chem. Phys. 2009, 131, 014102. [Google Scholar] [CrossRef]
- Barca, G.M.J.; Bertoni, C.; Carrington, L.; Datta, D.; De Silva, N.; Deustua, J.E.; Fedorov, D.G.; Gour, J.R.; Gunina, A.O.; Guidez, E.; et al. Recent developments in the general atomic and molecular electronic structure system. J. Chem. Phys. 2020, 152, 154102. [Google Scholar] [CrossRef] [PubMed]
- Lu, T.; Chen, F.W. Multiwfn: A multifunctional wavefunction analyzer. J. Comput. Chem. 2012, 33, 580–592. [Google Scholar] [CrossRef] [PubMed]
- Reed, A.E.; Curtiss, L.A.; Weinhold, F. Intermolecular interactions from a natural bond orbital, donor-acceptor viewpoint. Chem. Rev. 1988, 88, 899–926. [Google Scholar] [CrossRef]
- Bader, R.F.W. Atoms in Molecules: A Quantum Theory; Oxford University Press: Oxford, UK, 1990. [Google Scholar]
- Humphrey, W.; Dalke, A.; Schulten, K. VMD: Visual molecular dynamics. J. Mol. Graph. 1996, 14, 33–38. [Google Scholar] [CrossRef]
- Politzer, P.; Murray, J.S. σ-Hole Interactions: Perspectives and Misconceptions. Crystals 2017, 7, 212. [Google Scholar] [CrossRef]
- Liu, Z.Y.; Lu, T.; Chen, Q.X. Intermolecular interaction characteristics of the all-carboatomic ring, cyclo [18]carbon: Focusing on molecular adsorption and stacking. Carbon 2021, 171, 514–523. [Google Scholar] [CrossRef]
- Li, Z.D.; Liu, Y.L.; Li, X.M.; Li, Q.Z.; Li, X.Y. Theoretical investigation of the nature of π(B≡B)⋯M interactions in coinage metal π-diborene complexes. New J. Chem. 2021, 45, 13380–13388. [Google Scholar] [CrossRef]
- Joy, J.; Jemmis, E.D. Contrasting Behavior of the Z Bonds in X–Z⋯Y Weak Interactions: Z = Main Group Elements Versus the Transition Metals. Inorg. Chem. 2017, 56, 1132–1143. [Google Scholar] [CrossRef]
- Joy, J.; Jemmis, E.D. Designing M-bond (X–M⋯Y, M = transition metal): σ-hole and radial density distribution. J. Chem. Sci. 2019, 131, 117. [Google Scholar] [CrossRef]
- Zhou, M.; Frenking, G. Transition-Metal Chemistry of the Heavier Alkaline Earth Atoms Ca, Sr, and Ba. Acc. Chem. Res. 2021, 54, 3071–3082. [Google Scholar] [CrossRef]
- Dewar, M.J.S.; Ford, G.P. Relationship between olefinic π complexes and three-membered rings. J. Am. Chem. Soc. 1979, 101, 783–791. [Google Scholar] [CrossRef]
- Rozas, I.; Alkorta, I.; Elguero, J. Behavior of Ylides Containing N, O, and C Atoms as Hydrogen Bond Acceptors. J. Am. Chem. Soc. 2000, 122, 11154–11161. [Google Scholar] [CrossRef]
- Koch, U.; Popelie, P.L.A. Characterization of C-H-O Hydrogen Bonds on the Basis of the Charge Density. J. Phys. Chem. 1995, 99, 9747–9754. [Google Scholar] [CrossRef]
- Arnold, W.D.; Oldfield, E. The Chemical Nature of Hydrogen Bonding in Proteins via NMR: J-Couplings, Chemical Shifts, and AIM Theory. J. Am. Chem. Soc. 2000, 122, 12835–12841. [Google Scholar] [CrossRef]
- Llusar, R.; Beltrán, A.; Andrés, J.; Noury, S.; Silvi, B. Topological Analysis of Electron Density in Depleted Homopolar Chemical Bonds. J. Comput. Chem. 1999, 20, 1517–1526. [Google Scholar] [CrossRef]
- Bianchi, R.; Gervasio, G.; Marabello, D. Experimental electron density analysis of Mn2(CO)10: Metal-metal and metal-ligand bond characterization. Inorg. Chem. 2000, 39, 2360–2366. [Google Scholar] [CrossRef] [PubMed]
- Contreras-Garcia, J.; Johnson, E.R.; Keinan, S.; Chaudret, R.; Piquemal, J.P.; Beratan, D.N.; Yang, W. NCIPLOT: A program for plotting non-covalent interaction regions. J. Chem. Theory Comput. 2011, 7, 625–632. [Google Scholar] [CrossRef] [PubMed]
- Johnson, E.R.; Keinan, S.; Mori-Sanchez, P.; Contreras-Garcia, J.; Cohen, A.J.; Yang, W. Revealing noncovalent interactions. J. Am. Chem. Soc. 2010, 132, 6498–6506. [Google Scholar] [CrossRef]
- An, X.L.; Li, R.; Li, Q.Z.; Liu, X.F.; Li, W.Z.; Cheng, J.B. Substitution, cooperative, and solvent effects on π pnicogen bonds in the FH2P and FH2As complexes. J. Mol. Model. 2012, 18, 4325–4332. [Google Scholar] [CrossRef]
- Nziko Vde, P.; Scheiner, S. S⋯π Chalcogen Bonds between SF2 or SF4 and C-C Multiple Bonds. J. Phys. Chem. A 2015, 119, 5889–5897. [Google Scholar] [CrossRef]
- Zheng, B.S.; Liu, Y.; Wang, Z.X.; Zhou, F.X.; Jiao, Y.C.; Liu, Y.; Ding, X.L.; Li, Q.Z. Comparison of halide donators based on pi⋯M (M = Cu, Ag, Au), pi⋯H and pi⋯halogen bonds. Theor. Chem. Acc. 2018, 137, 179. [Google Scholar] [CrossRef]


Publisher’s Note: MDPI stays neutral with regard to jurisdictional claims in published maps and institutional affiliations. |
© 2022 by the authors. Licensee MDPI, Basel, Switzerland. This article is an open access article distributed under the terms and conditions of the Creative Commons Attribution (CC BY) license (https://creativecommons.org/licenses/by/4.0/).