
Novel Gluten-Free Bread with an Extract from Flaxseed By-Product: The Relationship between Water Replacement Level and Nutritional Value, Antioxidant Properties, and Sensory Quality


Abstract
:1. Introduction
2. Results and Discussion
3. Materials and Methods
3.1. Preparation of Flaxseed Oil Cake Extract (FOCE)
3.2. Preparation of Experimental Gluten-Free Bread
3.3. Characteristics of Experimental GFBs
3.3.1. Determination of the Bread Quality
3.3.2. Evaluation of Bread Crumb Porosity
3.3.3. Instrumental Bread Crumb Color Determination
3.3.4. Determination of the Proximal Chemical Composition and Energy Value
3.3.5. Determination of Mineral Concentration
3.4. Antioxidant Capacity of FOCE and GFBs
3.4.1. Sample Preparation and Antioxidants Extraction
3.4.2. Total Phenolic Content (TPC)
3.4.3. ABTS Assay
3.4.4. DPPH Assay
3.4.5. FRAP Assay
3.4.6. Photochemiluminescence Assay
3.5. Sensory Evaluation
3.6. Statistical Analysis
4. Conclusions
Author Contributions
Funding
Institutional Review Board Statement
Informed Consent Statement
Data Availability Statement
Acknowledgments
Conflicts of Interest
Sample Availability
References
- Ancuţa, P.; Sonia, A. Oil press-cakes and meals valorization through circular economy approaches: A review. Appl. Sci. 2020, 10, 7432. [Google Scholar] [CrossRef]
- Ribeiro, T.B.; Voss, G.B.; Coelho, M.C.; Pintado, M.E. Chapter 33-Food waste and by-product valorization as an integrated approach with zero waste: Future challenges. In Future Foods; Bhat, R.B.T.-F.F., Ed.; Academic Press: Cambridge, MA, USA, 2022; pp. 569–596. ISBN 978-0-323-91001-9. [Google Scholar]
- Sanmartin, C.; Taglieri, I.; Venturi, F.; Macaluso, M.; Zinnai, A.; Tavarini, S.; Botto, A.; Serra, A.; Conte, G.; Flamini, G.; et al. Flaxseed Cake as a Tool for the Improvement of Nutraceutical and Sensorial Features of Sourdough Bread. Foods 2020, 9, 204. [Google Scholar] [CrossRef] [PubMed] [Green Version]
- Nevara, G.A.; Giwa Ibrahim, S.; Syed Muhammad, S.K.; Zawawi, N.; Mustapha, N.A.; Karim, R. Oilseed meals into foods: An approach for the valorization of oilseed by-products. Crit. Rev. Food Sci. Nutr. 2022, 28, 1–14. [Google Scholar] [CrossRef] [PubMed]
- Arrutia, F.; Binner, E.; Williams, P.; Waldron, K.W. Oilseeds beyond oil: Press cakes and meals supplying global protein requirements. Trends Food Sci. Technol. 2020, 100, 88–102. [Google Scholar] [CrossRef]
- Abedini, A.; Alizadeh, M.A.; Mahdavi, A.; Golzan, A.S.; Salimi, M.; Tajdar-Oranj, B.; Hosseini, H. Oilseed Cakes in the Food Industry; A Review on Applications, Challenges, and Future Perspectives. Curr. Nutr. Food Sci. 2022, 18, 1–20. [Google Scholar] [CrossRef]
- Taglieri, I.; Sanmartin, C.; Venturi, F.; Macaluso, M.; Zinnai, A.; Tavarini, S.; Serra, A.; Conte, G.; Flamini, G.; Angelini, L.G. Effect of the Leavening Agent on the Compositional and Sensorial Characteristics of Bread Fortified with Flaxseed Cake. Appl. Sci. 2020, 10, 5235. [Google Scholar] [CrossRef]
- Pojić, M.; Dapčević Hadnađev, T.; Hadnađev, M.; Rakita, S.; Brlek, T. Bread Supplementation with Hemp Seed Cake: A By-Product of Hemp Oil Processing. J. Food Qual. 2015, 38, 431–440. [Google Scholar] [CrossRef] [Green Version]
- Aranibar, C.; Aguirre, A.; Borneo, R. Utilization of a by-product of chia oil extraction as a potential source for value addition in wheat muffins. J. Food Sci. Technol. 2019, 56, 4189–4197. [Google Scholar] [CrossRef]
- Radočaj, O.; Dimić, E.; Tsao, R. Effects of Hemp (Cannabis sativa L.) Seed Oil Press-Cake and Decaffeinated Green Tea Leaves (Camellia sinensis) on Functional Characteristics of Gluten-Free Crackers. J. Food Sci. 2014, 79, C318–C325. [Google Scholar] [CrossRef]
- Kasote, D.M. Flaxseed phenolics as natural antioxidants. Int. Food Res. J. 2013, 20, 27–34. [Google Scholar]
- Mercier, S.; Villeneuve, S.; Moresoli, C.; Mondor, M.; Marcos, B.; Power, K.A. Flaxseed-Enriched Cereal-Based Products: A Review of the Impact of Processing Conditions. Compr. Rev. Food Sci. Food Saf. 2014, 13, 400–412. [Google Scholar] [CrossRef] [PubMed]
- Kajla, P.; Sharma, A.; Sood, D.R. Flaxseed-A potential functional food source. J. Food Sci. Technol. 2015, 52, 1857–1871. [Google Scholar] [CrossRef] [PubMed]
- Kaur, M.; Singh, V.; Kaur, R. Effect of partial replacement of wheat flour with varying levels of flaxseed flour on physicochemical, antioxidant and sensory characteristics of cookies. Bioact. Carbohydr. Diet. Fibre 2017, 9, 14–20. [Google Scholar] [CrossRef]
- Khouryieh, H.; Aramouni, F. Effect of flaxseed flour incorporation on the physical properties and consumer acceptability of cereal bars. Food Sci. Technol. Int. 2013, 19, 549–556. [Google Scholar] [CrossRef] [PubMed] [Green Version]
- Drozłowska, E.; Bartkowiak, A.; Trocer, P.; Kostek, M.; Tarnowiecka-Kuca, A.; Łopusiewicz, Ł. Formulation and Evaluation of Spray-Dried Reconstituted Flaxseed Oil-In-Water Emulsions Based on Flaxseed Oil Cake Extract as Emulsifying and Stabilizing Agent. Foods 2021, 10, 256. [Google Scholar] [CrossRef] [PubMed]
- Conte, P.; Fadda, C.; Piga, A.; Collar, C. Techno-functional and nutritional performance of commercial breads available in Europe. Food Sci. Technol. Int. 2016, 22, 621–633. [Google Scholar] [CrossRef] [PubMed] [Green Version]
- Sabença, C.; Ribeiro, M.; Sousa, T.D.; Poeta, P.; Bagulho, A.S.; Igrejas, G. Wheat/Gluten-Related Disorders and Gluten-Free Diet Misconceptions: A Review. Foods 2021, 10, 1765. [Google Scholar] [CrossRef]
- Gluten-Free Products Market by Type (Bakery Products, Snacks & RTE Products, Condiments & Dressings, Pizzas & Pastas), Distribution Channel (Conventional Stores, Specialty Stores and Drugstores & Pharmacies), Form & Region-Global Forecast to 2025. Available online: https://www.marketsandmarkets.com/Market-Reports/gluten-free-products-market-738.htm (accessed on 16 March 2022).
- Aguiar, E.V.; Santos, F.G.; Krupa-Kozak, U.; Capriles, V.D. Nutritional facts regarding commercially available gluten-free bread worldwide: Recent advances and future challenges. Crit. Rev. Food Sci. Nutr. 2021, 22, 1–13. [Google Scholar] [CrossRef]
- Conte, P.; Fadda, C.; Drabińska, N.; Krupa-Kozak, U. Technological and Nutritional Challenges, and Novelty in Gluten-Free Breadmaking-A Review. Pol. J. Food Nutr. Sci. 2019, 69, 5–21. [Google Scholar] [CrossRef]
- Culetu, A.; Duta, D.E.; Papageorgiou, M.; Varzakas, T. The Role of Hydrocolloids in Gluten-Free Bread and Pasta; Rheology, Characteristics, Staling and Glycemic Index. Foods 2021, 10, 3121. [Google Scholar] [CrossRef]
- Morreale, F.; Garzón, R.; Rosell, C.M. Understanding the role of hydrocolloids viscosity and hydration in developing gluten-free bread. A study with hydroxypropylmethylcellulose. Food Hydrocoll. 2018, 77, 629–635. [Google Scholar] [CrossRef]
- Hager, A.-S.; Arendt, E.K. Influence of hydroxypropylmethylcellulose (HPMC), xanthan gum and their combination on loaf specific volume, crumb hardness and crumb grain characteristics of gluten-free breads based on rice, maize, teff and buckwheat. Food Hydrocoll. 2013, 32, 195–203. [Google Scholar] [CrossRef]
- Ozkoc, S.O.; Seyhun, N. Effect of Gum Type and Flaxseed Concentration on Quality of Gluten-Free Breads Made from Frozen Dough Baked in Infrared-Microwave Combination Oven. Food Bioprocess Technol. 2015, 8, 2500–2506. [Google Scholar] [CrossRef]
- Drozłowska, E.; Bartkowiak, A.; Łopusiewicz, Ł. Characterization of flaxseed oil bimodal emulsions prepared with flaxseed oil cake extract applied as a natural emulsifying agent. Polymers 2020, 12, 2207. [Google Scholar] [CrossRef]
- Drozłowska, E.; Łopusiewicz, Ł.; Mężyńska, M.; Bartkowiak, A. Valorization of flaxseed oil cake residual from cold-press oil production as a material for preparation of spray-dried functional powders for food applications as emulsion stabilizers. Biomolecules 2020, 10, 153. [Google Scholar] [CrossRef] [Green Version]
- Łopusiewicz, Ł.; Bogusławska-Wąs, E.; Drozłowska, E.; Trocer, P.; Dłubała, A.; Mazurkiewicz-Zapałowicz, K.; Bartkowiak, A. The Application of Spray-Dried and Reconstituted Flaxseed Oil Cake Extract as Encapsulating Material and Carrier for Probiotic Lacticaseibacillus rhamnosus GG. Materials 2021, 14, 5324. [Google Scholar] [CrossRef]
- Drozłowska, E.; Bartkowiak, A.; Trocer, P.; Kostek, M.; Tarnowiecka-Kuca, A.; Bienkiewicz, G.; Łopusiewicz, Ł. The influence of flaxseed oil cake extract on oxidative stability of microencapsulated flaxseed oil in spray-dried powders. Antioxidants 2021, 10, 211. [Google Scholar] [CrossRef]
- Pham, L.B.; Wang, B.; Zisu, B.; Adhikari, B. Complexation between flaxseed protein isolate and phenolic compounds: Effects on interfacial, emulsifying and antioxidant properties of emulsions. Food Hydrocoll. 2019, 94, 20–29. [Google Scholar] [CrossRef]
- Krupa-Kozak, U.; Drabińska, N.; Bączek, N.; Šimková, K.; Starowicz, M.; Jeliński, T. Application of Broccoli Leaf Powder in Gluten-Free Bread: An Innovative Approach to Improve Its Bioactive Potential and Technological Quality. Foods 2021, 10, 819. [Google Scholar] [CrossRef]
- Capriles, V.D.; dos Santos, F.G.; Arêas, J.A.G. Gluten-free breadmaking: Improving nutritional and bioactive compounds. J. Cereal Sci. 2016, 67, 83–91. [Google Scholar] [CrossRef]
- Kulai, T.; Rashid, M. Assessment of Nutritional Adequacy of Packaged Gluten-free Food Products. Can. J. Diet. Pract. Res. 2014, 75, 186–190. [Google Scholar] [CrossRef] [PubMed]
- Wu, J.H.Y.; Neal, B.; Trevena, H.; Crino, M.; Stuart-Smith, W.; Faulkner-Hogg, K.; Yu Louie, J.C.; Dunford, E. Are gluten-free foods healthier than non-gluten-free foods? An evaluation of supermarket products in Australia. Br. J. Nutr. 2015, 114, 448–454. [Google Scholar] [CrossRef] [PubMed] [Green Version]
- Chung, M.W.Y.; Lei, B.; Li-Chan, E.C.Y. Isolation and structural characterization of the major protein fraction from NorMan flaxseed (Linum usitatissimum L.). Food Chem. 2005, 90, 271–279. [Google Scholar] [CrossRef]
- Tavarini, S.; Castagna, A.; Conte, G.; Foschi, L.; Sanmartin, C.; Incrocci, L.; Ranieri, A.; Serra, A.; Angelini, L.G. Evaluation of Chemical Composition of Two Linseed Varieties as Sources of Health-Beneficial Substances. Molecules 2019, 24, 3729. [Google Scholar] [CrossRef] [PubMed] [Green Version]
- Morris, D.H. Flax: A Health and Nutrition Primer, 4th ed.; Flax Council of Canada: Winnipeg, MB, Canada, 2007; ISBN 9780969, 607366 0969607369. [Google Scholar]
- Carter, J.F. Potential of flaxseed and flaxseed oil in baked goods and other products in human nutrition. Cereal Foods World 1993, 38, 753–759. [Google Scholar]
- Stone, M.S.; Martin, B.R.; Weaver, C.M. Short-Term RCT of Increased Dietary Potassium from Potato or Potassium Gluconate: Effect on Blood Pressure, Microcirculation, and Potassium and Sodium Retention in Pre-Hypertensive-to-Hypertensive Adults. Nutriemts 2021, 13, 1610. [Google Scholar] [CrossRef]
- Ding, S.; Peng, B.; Li, Y.; Yang, J. Evaluation of specific volume, texture, thermal features, water mobility, and inhibitory effect of staling in wheat bread affected by maltitol. Food Chem. 2019, 283, 123–130. [Google Scholar] [CrossRef]
- Miranda-Ramos, K.C.; Haros, C.M. Combined Effect of Chia, Quinoa and Amaranth Incorporation on the Physico-Chemical, Nutritional and Functional Quality of Fresh Bread. Foods 2020, 9, 1859. [Google Scholar] [CrossRef]
- Collar, C.; Santos, E.; Rosell, C.M. Assessment of the rheological profile of fibre-enriched bread doughs by response surface methodology. J. Food Eng. 2007, 78, 820–826. [Google Scholar] [CrossRef]
- Gan, Z.; Ellis, P.R.; Vaughan, J.G.; Galliard, T. Some effects of non-endosperm components of wheat and of added gluten on wholemeal bread microstructure. J. Cereal Sci. 1989, 10, 81–91. [Google Scholar] [CrossRef]
- Koca, A.F.; Anil, M. Effect of flaxseed and wheat flour blends on dough rheology and bread quality. J. Sci. Food Agric. 2007, 87, 1172–1175. [Google Scholar] [CrossRef]
- Bartkiene, E.; Juodeikiene, G.; Vidmantiene, D. Nutritional quality of fermented defatted soya and flaxseed flours and their effect on texture and sensory characteristics of wheat sourdough bread. Int. J. Food Sci. Nutr. 2012, 63, 722–729. [Google Scholar] [CrossRef] [PubMed]
- Sabanis, D.; Tzia, C. Effect of hydrocolloids on selected properties of gluten-free dough and bread. Food Sci. Technol. Int. 2011, 17, 279–291. [Google Scholar] [CrossRef] [PubMed]
- Drozłowska, E.; Łopusiewicz, Ł.; Mężyńska, M.; Bartkowiak, A. The effect of native and denaturated flaxseed meal extract on physiochemical properties of low fat mayonnaises. J. Food Meas. Charact. 2020, 14, 1135–1145. [Google Scholar] [CrossRef]
- Gallagher, E.; Gormley, T.R.; Arendt, E.K. Crust and crumb characteristics of gluten free breads. J. Food Eng. 2003, 56, 153–161. [Google Scholar] [CrossRef]
- Mokrzycki, W.S.; Tatol, M. Colour difference ∆E-A survey Mokrzycki. Mach. Graph. Vis. 2011, 20, 383–411. [Google Scholar]
- Morris, M.C.; Evans, D.A.; Tangney, C.C.; Bienias, J.L.; Wilson, R.S.; Aggarwal, N.T.; Scherr, P.A. Relation of the tocopherol forms to incident Alzheimer disease and to cognitive change. Am. J. Clin. Nutr. 2005, 81, 508–514. [Google Scholar] [CrossRef]
- Man, S.M.; Stan, L.; Păucean, A.; Chiş, M.S.; Mureşan, V.; Socaci, S.A.; Pop, A.; Muste, S. Nutritional, Sensory, Texture Properties and Volatile Compounds Profile of Biscuits with Roasted Flaxseed Flour Partially Substituting for Wheat Flour. Appl. Sci. 2021, 11, 4791. [Google Scholar] [CrossRef]
- Deng, Q.; Yu, X.; Ma, F.; Xu, J.; Huang, F.; Huang, Q.; Sheng, F. Comparative analysis of the in-vitro antioxidant activity and bioactive compounds of flaxseed in China according to variety and geographical origin. Int. J. Food Prop. 2017, 20, S2708–S2722. [Google Scholar] [CrossRef] [Green Version]
- Kitts, D.D.; Yuan, Y.V.; Wijewickreme, A.N.; Thompson, L.U. Antioxidant activity of the flaxseed lignan secoisolariciresinol diglycoside and its mammalian lignan metabolites enterodiol and enterolactone. Mol. Cell. Biochem. 1999, 202, 91–100. [Google Scholar] [CrossRef]
- Touré, A.; Xueming, X. Flaxseed Lignans: Source, Biosynthesis, Metabolism, Antioxidant Activity, Bio-Active Components, and Health Benefits. Compr. Rev. Food Sci. Food Saf. 2010, 9, 261–269. [Google Scholar] [CrossRef] [PubMed]
- Park, J.B.; Velasquez, M.T. Potential effects of lignan-enriched flaxseed powder on bodyweight, visceral fat, lipid profile, and blood pressure in rats. Fitoterapia 2012, 83, 941–946. [Google Scholar] [CrossRef] [PubMed]
- Lowcock, E.C.; Cotterchio, M.; Boucher, B.A. Consumption of flaxseed, a rich source of lignans, is associated with reduced breast cancer risk. Cancer Causes Control 2013, 24, 813–816. [Google Scholar] [CrossRef]
- Hidalgo, F.J.; Zamora, R. The role of lipids in nonenzymatic browning. Grasas Aceites 2000, 51, 35–49. [Google Scholar] [CrossRef] [Green Version]
- Yilmaz, Y.; Toledo, R. Antioxidant activity of water-soluble Maillard reaction products. Food Chem. 2005, 93, 273–278. [Google Scholar] [CrossRef]
- Zghal, M.C.; Scanlon, M.G.; Sapirstein, H.D. Cellular Structure of Bread Crumb and its Influence on Mechanical Properties. J. Cereal Sci. 2002, 36, 167–176. [Google Scholar] [CrossRef]
- Gutiérrez, C.; Rubilar, M.; Jara, C.; Verdugo, M.; Sineiro, J.; Shene, C. Flaxseed and flaxseed cake as a source of compounds for food industry. J. Soil Sci. Plant Nutr. 2010, 10, 454–463. [Google Scholar] [CrossRef] [Green Version]
- AOAC. Official Methods of Analysis of AOAC International, 18th ed.; Current Through Revision 4; William Horwitz, W., Latimer, G., Jr., Eds.; Association of Official Analytical Chemists: Gaithersburg, MA, USA, 2011; ISBN 0-935584-82-X. [Google Scholar]
- Maclean, W.C.; Harnly, J.M.; Chen, J.; Chevassus-Agnes, S.; Gilani, G.; Livesey, G.; Mathioudakis, B.; Munoz De Chavez, M.; Devasconcellos, M.T.; Warwick, P. Food energy—Methods of analysis and conversion factors. In Food and Nutrition Paper #77, Proceedings of the Food and Agriculture Organization of the United Nations Technical Workshop Report, Rome, Italy, 3–6 December 2002; Agricultural Research Service, US Department of Agriculture: Beltsville, MD, USA, 2003; ISSN 02543-4725. [Google Scholar]
- Horszwald, A.; Andlauer, W. Characterisation of bioactive compounds in berry juices by traditional photometric and modern microplate methods. J. Berry Res. 2011, 1, 189–199. [Google Scholar] [CrossRef] [Green Version]
- Brand-Williams, W.; Cuvelier, M.E.; Berset, C. Use of a free radical method to evaluate antioxidant activity. LWT-Food Sci. Technol. 1995, 28, 25–30. [Google Scholar] [CrossRef]
- Benzie, I.F.F.; Strain, J.J. The Ferric Reducing Ability of Plasma (FRAP) as a Measure of “Antioxidant Power”: The FRAP Assay. Anal. Biochem. 1996, 239, 70–76. [Google Scholar] [CrossRef] [Green Version]
- Zieliński, H.; Zielińska, D.; Kostyra, H. Antioxidant capacity of a new crispy type food products determined by updated analytical strategies. Food Chem. 2012, 130, 1098–1104. [Google Scholar] [CrossRef]
- ISO 8586-1:1993; Sensory Analysis—General Guidance for the Selection, Training and Monitoring of Assessors—Part 1: Selected Assessors. ISO: Geneva, Switzerland, 1993.
- Lawless, H.T.; Heymann, H. Sensory Evaluation of Food–Principles and Practices; Springer: New York, NY, USA, 2010; pp. 473–478. [Google Scholar] [CrossRef]
- ISO/DIS 13299; Sensory Analysis—Methodology—General Guidance for Establishing a Sensory Profile. ISO: Geneva, Switzerland, 1998.
- ISO 8589:1998; Sensory Analysis—General Guidance for the Design of Test Rooms. ISO: Geneva, Switzerland, 1998.


| Control | FOCE25% | FOCE50% | FOCE75% | FOCE100% | |
|---|---|---|---|---|---|
| Moisture (%) | 57.71 a ± 1.08 | 62.04 a ± 1.15 | 61.13 a ± 1.32 | 60.91 a ± 0.94 | 60.46 a ± 1.82 |
| Proteins (g/100 g DM) | 1.30 d ± 0.01 | 1.52 c ± 0.05 | 1.64 c ± 0.07 | 1.84 b ± 0.01 | 2.08 a ± 0.01 |
| Ash (g/100 g DM) | 1.72 a ± 0.08 | 1.72 a ± 0.04 | 1.71 a ± 0.01 | 1.68 a ± 0.04 | 1.77 a ± 0.03 |
| Fat (g/100 g DM) | 2.37 c ± 0.06 | 2.49 c ± 0.02 | 2.60 bc ± 0.05 | 2.79 a ± 0.06 | 2.74 ab ± 0.03 |
| Carbohydrates * (g/100 g DM) | 36.90 a ± 0.05 | 32.23 c ± 0.06 | 32.96 b ± 0.03 | 32.78 b ± 0.05 | 32.90 b ± 0.12 |
| Energy value (kJ) | 737 | 666 | 684 | 692 | 696 |
| Energy value (kcal) | 174 | 157 | 162 | 164 | 165 |
| Control | FOCE25% | FOCE50% | FOCE75% | FOCE100% | |
|---|---|---|---|---|---|
| Specific volume (cm3/g) | 2.39 c ± 0.03 | 2.39 c ± 0.04 | 2.78 b ± 0.03 | 2.87 b ± 0.01 | 3.06 a ±0.09 |
| Bake loss (%) | 12.23 a ± 0.41 | 12.00 a ± 0.15 | 12.17 a ± 0.21 | 12.22 a ± 0.10 | 11.75 a ± 0.41 |
| Density (g/mL) | 0.42 a ± 0.01 | 0.42 a ± 0.01 | 0.35 b ± 0.01 | 0.36 b ± 0.01 | 0.33 c ± 0.01 |
| Height/width ratio | 1.06 b ± 0.03 | 1.06 b ± 0.05 | 1.10 b ± 0.06 | 1.12 b ± 0.06 | 1.22 a ± 0.05 |
| Crumb cells parameters | |||||
| Number of cells (No/cm2) | 28 b ± 4 | 41 a ± 5 | 41 a ± 3 | 44 a ± 1 | 44 a ± 5 |
| Average cells area (mm2) | 6.66 a ± 1.61 | 3.55 b ± 1.03 | 3.91 b ± 0.37 | 4.00 b ± 0.94 | 3.93 b ± 1.33 |
| Average cell perimeter (mm) | 27.61 a ± 0.54 | 15.24 b ± 2.34 | 17.04 b ± 2.20 | 15.50 b ± 1.14 | 13.07 b ± 3.34 |
| Cell circularity (-) | 0.09 b ± 0.01 | 0.20 a ± 0.03 | 0.24 a ± 0.05 | 0.20 a ± 0.03 | 0.26 a ± 0.07 |
| Crumb color | |||||
| L* | 71.29 c ± 1.76 | 71.10 c ± 0.76 | 74.13 b ± 0.68 | 73.67 b ±0.94 | 76.02 a ± 0.91 |
| a* | 1.46 a ± 0.14 | 1.08 d ± 0.15 | 1.13 cd ± 0.04 | 1.26 bc ± 0.09 | 1.31 b ± 0.10 |
| b* | 16.95 b ± 0.81 | 13.86 c ± 0.94 | 17.17 b± 0.44 | 16.83 b ± 1.17 | 18.35 a ±0.59 |
| ΔE | Served as control | 3.12 | 2.86 | 2.39 | 4.93 |
| FOCE | Control | FOCE25% | FOCE50% | FOCE75% | FOCE100% | |
|---|---|---|---|---|---|---|
| TPC (mg GAE/g DM) | 0.162 ± 0.011 | 0.096 b ± 0.004 | 0.203 a ± 0.029 | 0.222 a ± 0.021 | 0.232 a ± 0.009 | 0.234 a ± 0.008 |
| ABTS (µmol TE/g DM) | 1.321 ± 0.035 | 0.792 d ± 0.050 | 0.890 c ± 0.040 | 0.985 bc ± 0.038 | 1.076 ab ± 0.029 | 1.128 a ± 0.010 |
| DPPH (µmol TE/g DM) | 0.987 ± 0.053 | 0.886 ab ± 0.026 | 0.852 b ± 0.030 | 0.863 ab ± 0.040 | 0.882 ab ± 0.044 | 0.945 a ± 0.020 |
| FRAP (µmol TE/g DM) | 0.794 ± 0.013 | 0.435 c ± 0.016 | 0.575 b ± 0.020 | 0.568 b ± 0.011 | 0.731 a ± 0.016 | 0.703 a ± 0.014 |
| ACW (µmol TE/g DM) | N/A | 0.158 b ± 0.009 | 0.147 b ± 0.009 | 0.166 ab ± 0.009 | 0.184 a ± 0.006 | 0.184 a± 0.008 |
| ACL (µmol TE/g DM) | 0.675 ± 0.011 | 0.100 a ± 0.004 | 0.089 b ± 0.002 | 0.091 b ± 0.002 | 0.094 ab ± 0.003 | 0.098 a ± 0.001 |
| PCL * (µmol TE/g DM) | 0.675 | 0.258 | 0.236 | 0.257 | 0.278 | 0.282 |
| Control | FOCE25% | FOCE50% | FOCE75% | FOCE100% | p-Value | ||
|---|---|---|---|---|---|---|---|
| Appearance | beige color | 1.31 b | 1.71 a | 1.73 a | 1.85 a | 1.71 a | 0.0005 |
| pore collocation | 2.57 b | 7.17 a | 7.53 a | 7.57 a | 7.73 a | <0.0001 | |
| pore dimension | 1.41 b | 1.63 ab | 1.81 ab | 2.24 a | 1.98 a | 0.0084 | |
| Odor | acid | 2.35 a | 1.46 ab | 1.48 ab | 1.21 b | 1.23 b | 0.0038 |
| oily | 2.15 a | 2.17 a | 2.27 a | 2.21 a | 2.03 a | 0.9445 | |
| wheat bread | 1.61 a | 2.00 a | 1.79 a | 2.07 a | 2.10 a | 0.2213 | |
| sweet | 1.45 a | 1.42 a | 1.33 a | 1.44 a | 1.49 a | 0.8731 | |
| Texture (manual) | elasticity | 5.3 b | 6.59 a | 6.54 a | 6.51 a | 6.59 a | 0.0018 |
| Texture (in the mouth) | chewiness | 2.23 a | 1.93 a | 1.89 a | 1.82 a | 1.98 a | 0.3161 |
| adhesiveness | 1.67 a | 1.70 a | 1.45 a | 1.45 a | 1.47 a | 0.7294 | |
| moisture | 2.93 a | 2.83 a | 2.89 a | 2.93 a | 2.83 a | 0.9861 | |
| Taste | wheat bread | 1.82 a | 2.16 a | 2.23 a | 2.45 a | 2.18 a | 0.1201 |
| acid | 1.54 c | 2.01 bc | 2.36 abc | 2.69 ab | 3.04 a | 0.0002 | |
| sweet | 1.27 a | 1.87 a | 1.80 a | 1.77 a | 1.82 a | 0.0671 | |
| salty | 0.68 a | 0.45 b | 0.46 b | 0.48 b | 0.42 b | 0.0059 | |
| aftertaste | 2.92 a | 2.76 a | 3.03 a | 2.91 a | 3.27 a | 0.3736 |
| Ingredient (%) | Control | FOCE25% | FOCE50% | FOCE75% | FOCE100% |
|---|---|---|---|---|---|
| Corn starch | 36.7 | 36.7 | 36.7 | 36.7 | 36.7 |
| Potato starch | 8.9 | 8.9 | 8.9 | 8.9 | 8.9 |
| Pectin | 2.2 | 2.2 | 2.2 | 2.2 | 2.2 |
| Sugar | 2.8 | 2.8 | 2.8 | 2.8 | 2.8 |
| Salt | 0.8 | 0.8 | 0.8 | 0.8 | 0.8 |
| Oil | 1.4 | 1.4 | 1.4 | 1.4 | 1.4 |
| Fresh yeast | 2.8 | 2.8 | 2.8 | 2.8 | 2.8 |
| FOCE 1 | - | 11.1 | 22.2 | 33.3 | 44.4 |
| Water | 44.4 | 33.3 | 22.2 | 11.1 | - |
| Attribute | Definition | Scale Edges |
|---|---|---|
| Appearance | ||
| beige color | color intensity (color pattern RAL 075 90 10) | Light–dark |
| pore collocation | visual impression of the arrangement of crumb porous | irregular–regular |
| pore dimension | visual impression of the size of crumb porous | small–big |
| Odor | ||
| acid | characteristic of organic acids | none–very intensive |
| oily | characteristic of sunflower oil | none–very intensive |
| wheat bread | typical for wheat bread | none–very intensive |
| sweet | characteristic to sweet baked products | none–very intensive |
| Texture (manual) | ||
| elasticity | extent to which a product returns to its original length when pushed by a finger | small–big |
| Texture (in the mouth) | ||
| chewiness | multiplicity of chewing allowing to swallow | low–high |
| adhesiveness | degree of adhesiveness perceived while chewing the sample 10 times | low–high |
| moisture | degree of amount of water in the product perceived while chewing the sample 10 times | low–high |
| Taste | ||
| wheat bread | as the corresponding odor (measured in the mouth) | none–very intensive |
| acid | basic taste illustrated by citric acid dissolved in water | none–very intensive |
| sweet | basic taste illustrated by 3% sucrose dissolved in water | none–very intensive |
| salty | basic taste illustrated by 3% NaCl dissolved in water | none–very intensive |
| aftertaste | lingering sensation after swallowing the sample | none–very intensive |
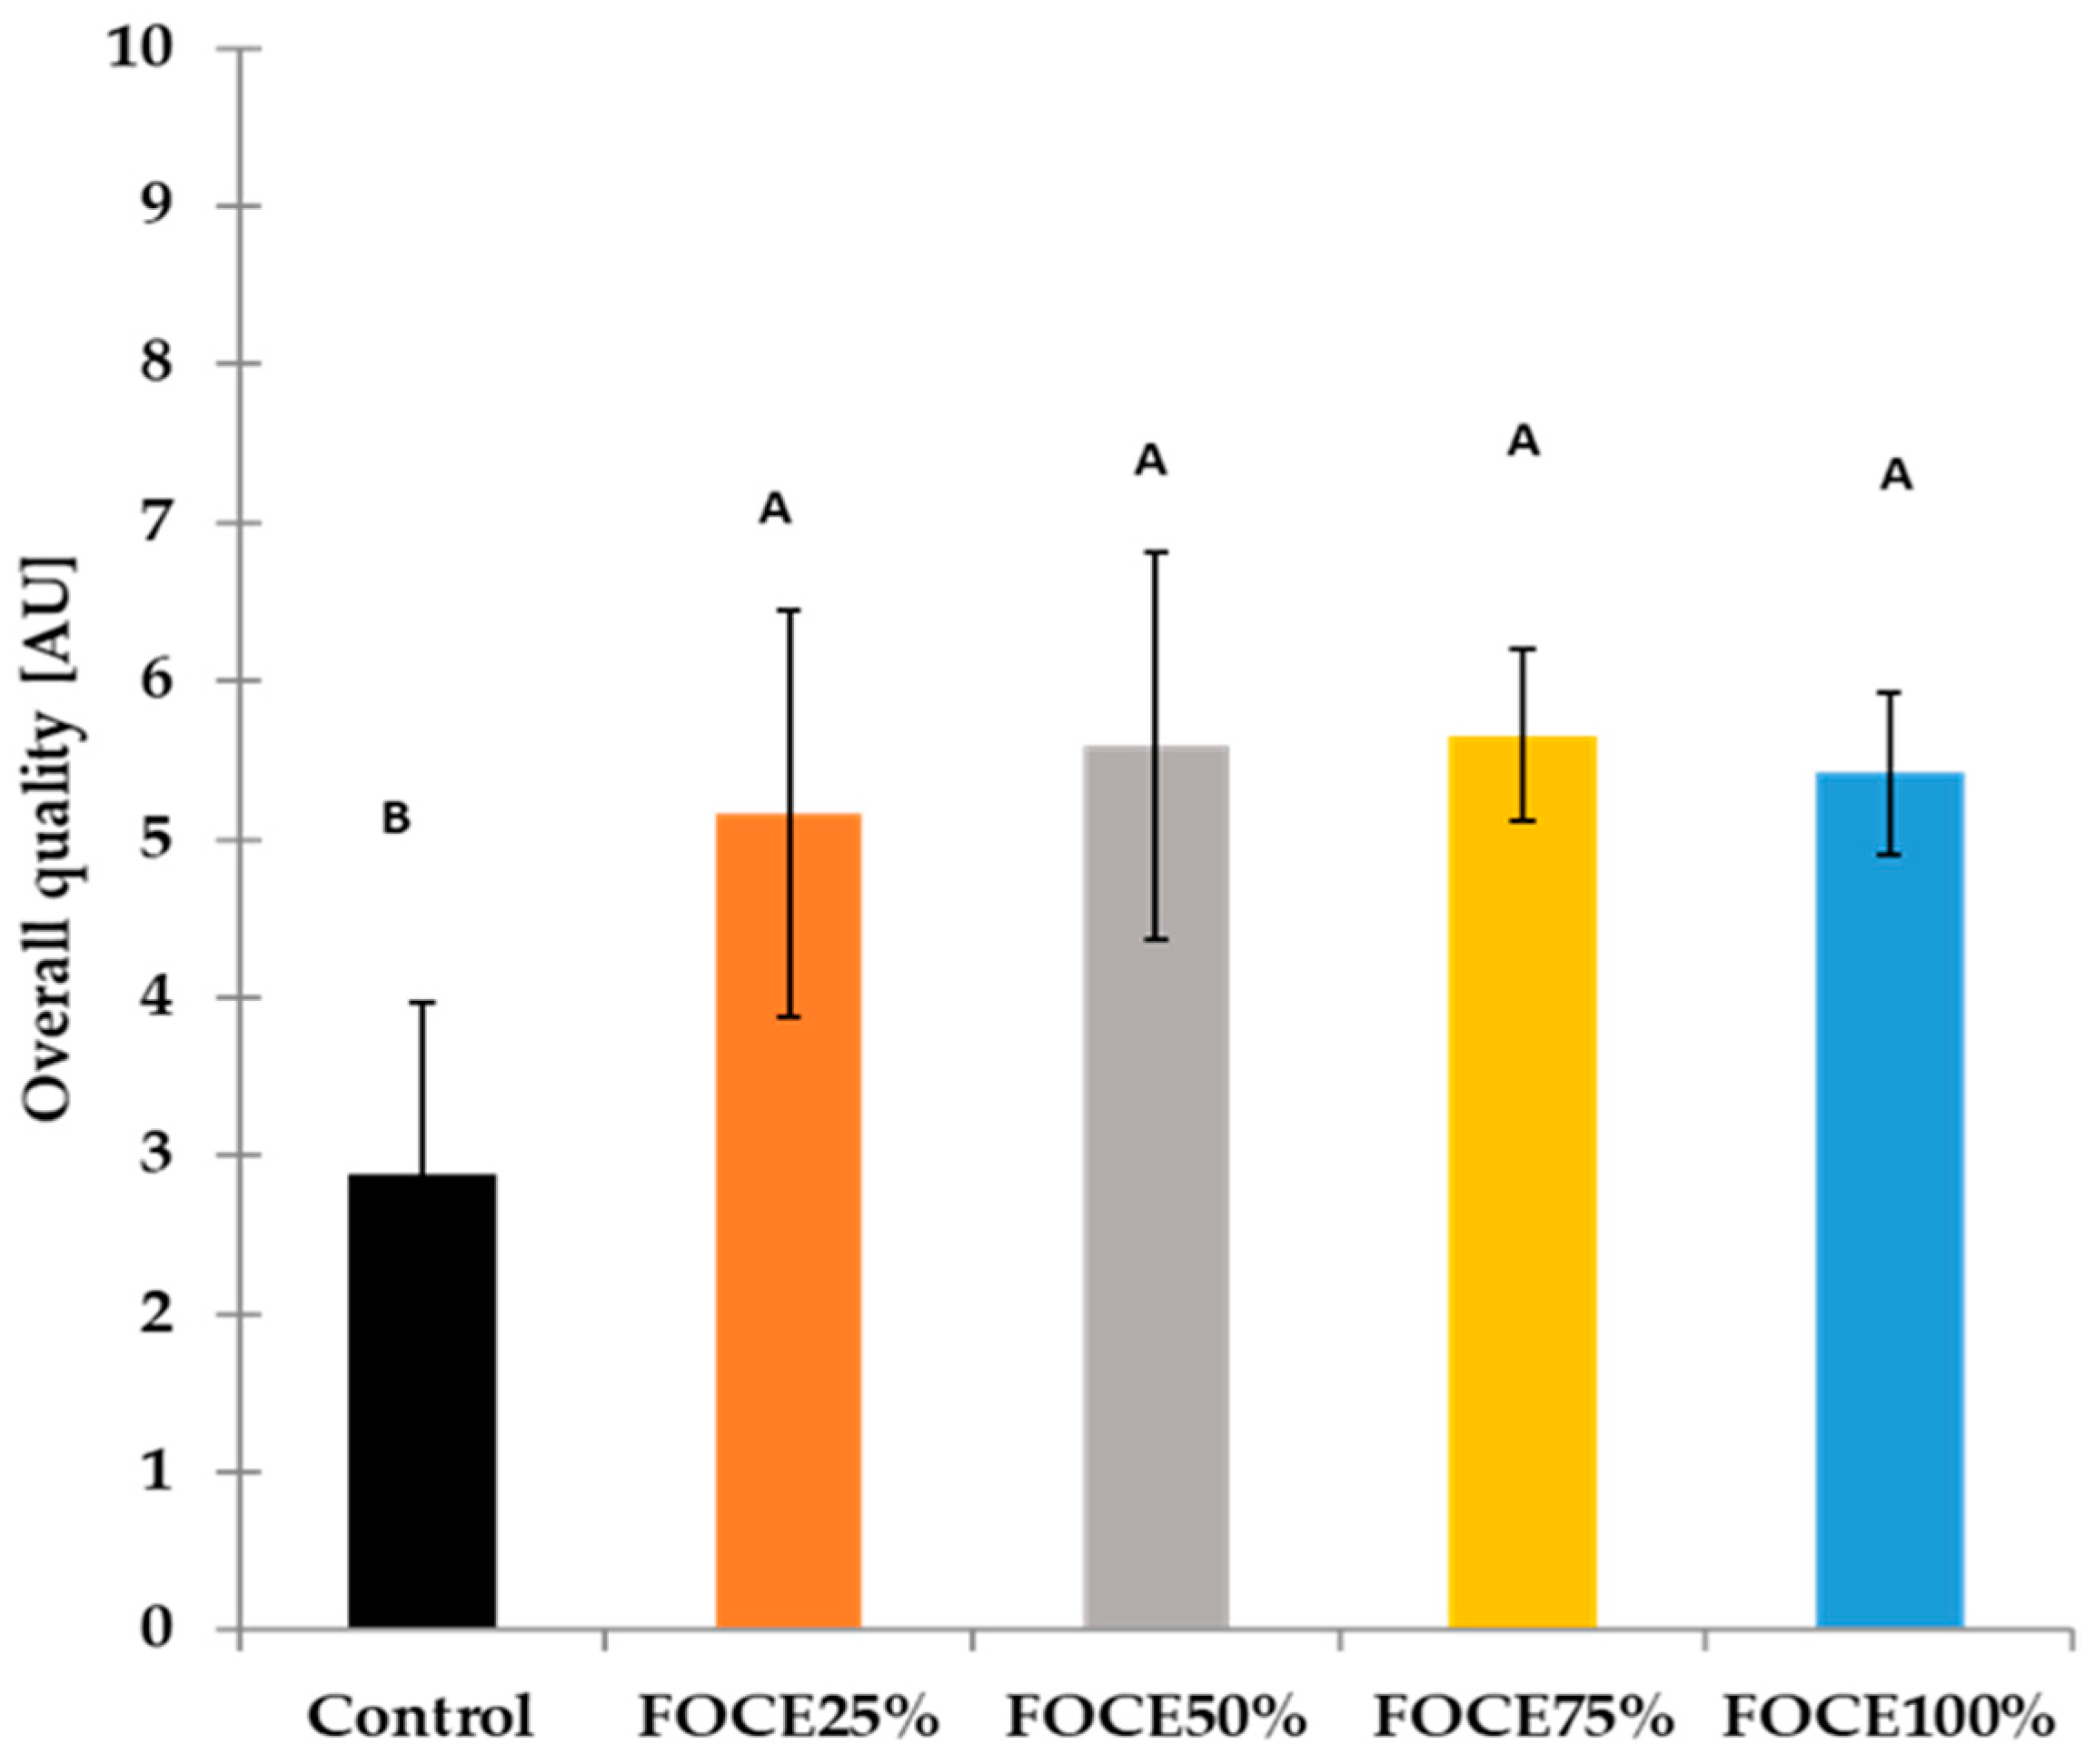
| Overall quality | overall quality contains all attributes and their harmonization | low–high |
Publisher’s Note: MDPI stays neutral with regard to jurisdictional claims in published maps and institutional affiliations. |
© 2022 by the authors. Licensee MDPI, Basel, Switzerland. This article is an open access article distributed under the terms and conditions of the Creative Commons Attribution (CC BY) license (https://creativecommons.org/licenses/by/4.0/).
Share and Cite
Krupa-Kozak, U.; Bączek, N.; Capriles, V.D.; Łopusiewicz, Ł. Novel Gluten-Free Bread with an Extract from Flaxseed By-Product: The Relationship between Water Replacement Level and Nutritional Value, Antioxidant Properties, and Sensory Quality. Molecules 2022, 27, 2690. https://doi.org/10.3390/molecules27092690
Krupa-Kozak U, Bączek N, Capriles VD, Łopusiewicz Ł. Novel Gluten-Free Bread with an Extract from Flaxseed By-Product: The Relationship between Water Replacement Level and Nutritional Value, Antioxidant Properties, and Sensory Quality. Molecules. 2022; 27(9):2690. https://doi.org/10.3390/molecules27092690
Chicago/Turabian StyleKrupa-Kozak, Urszula, Natalia Bączek, Vanessa D. Capriles, and Łukasz Łopusiewicz. 2022. "Novel Gluten-Free Bread with an Extract from Flaxseed By-Product: The Relationship between Water Replacement Level and Nutritional Value, Antioxidant Properties, and Sensory Quality" Molecules 27, no. 9: 2690. https://doi.org/10.3390/molecules27092690
APA StyleKrupa-Kozak, U., Bączek, N., Capriles, V. D., & Łopusiewicz, Ł. (2022). Novel Gluten-Free Bread with an Extract from Flaxseed By-Product: The Relationship between Water Replacement Level and Nutritional Value, Antioxidant Properties, and Sensory Quality. Molecules, 27(9), 2690. https://doi.org/10.3390/molecules27092690