1. Introduction
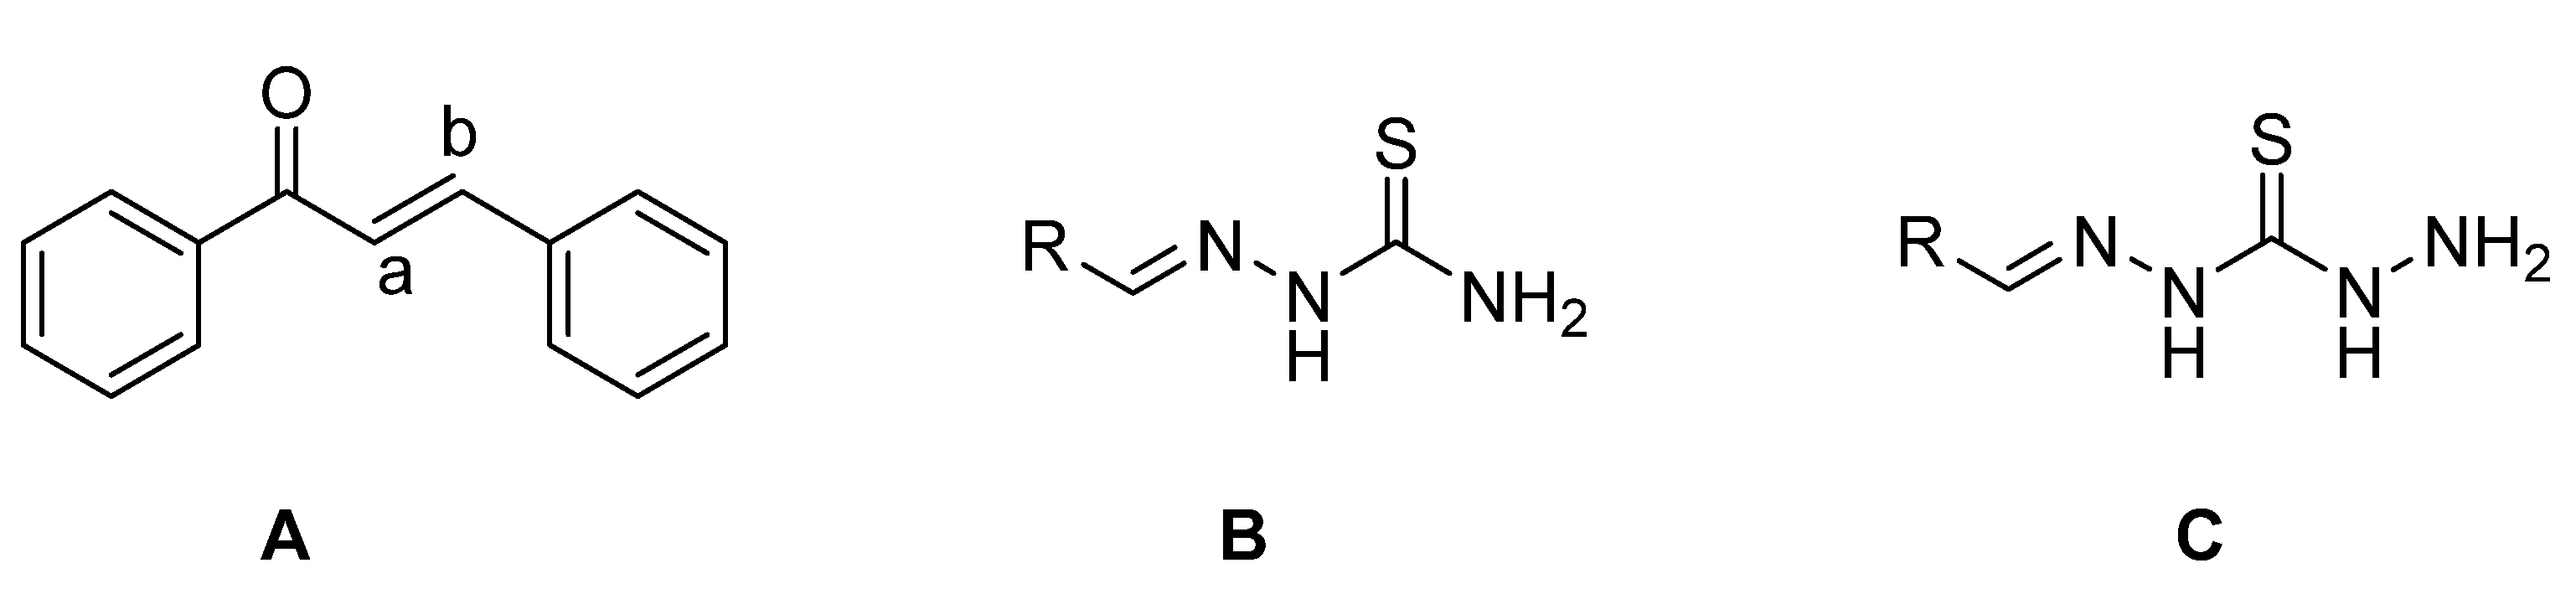
The framework 1,3-diphenylprop-2-en-1-one (
Figure 1A) is well known by the generic term ‘‘chalcone’’, a name coined by Kostanecki and Tambor [
1]. Chalcones belong to the flavonoid family, and they contain conjugated double bonds with absolute delocalization and two aromatic rings. They act as synthons by which a range of analogs and novel heterocycles with pharmaceutical structures can be targeted [
2]. Chalcones can be used to obtain several heterocyclic rings through ring closure reactions [
3]. Various chalcone derivatives show antimicrobial [
4], antifungal [
5], antimalarial [
6], antiviral [
7], anti-inflammatory [
8], antileishmanial [
9] anti-tumor, and anticancer [
10] properties.
Thiosemicarbazones (TCSs) (
Figure 1B) are an important class of compounds possessing remarkable biological properties making them of interest to structural and medicinal chemists. A wide variety of TSCs containing an appropriate structural framework were found to have antineoplastic [
11], antibacterial [
12], and antifungal [
13] properties. Furthermore, their extraordinary complexing capacity with metal ions such as iron, copper, and zinc provides additional versatility as potential candidates for the preparation of coordinate complexes [
14]. Thiosemicarbazones are well known to exhibit both
syn and
anti isomeric forms [
15].
In recent years, there has been growing interest in the coordination chemistry of thiocarbohydrazones, compounds that share the general formula depicted in
Figure 1C and that can be considered the higher homologues of thiosemicarbazones. The first synthesis of these systems is dated in 1925 and described the condensation of ketones and aldehydes with thiocarbohydrazide [
16,
17].
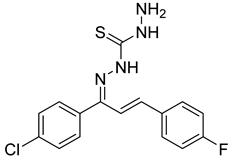
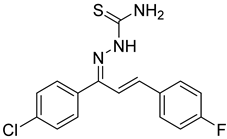
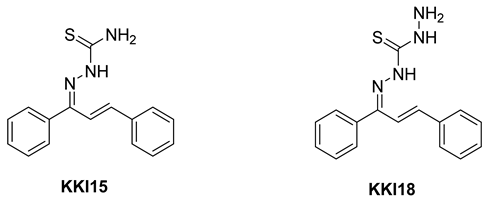
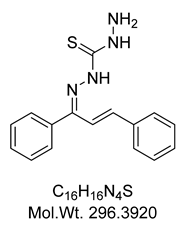
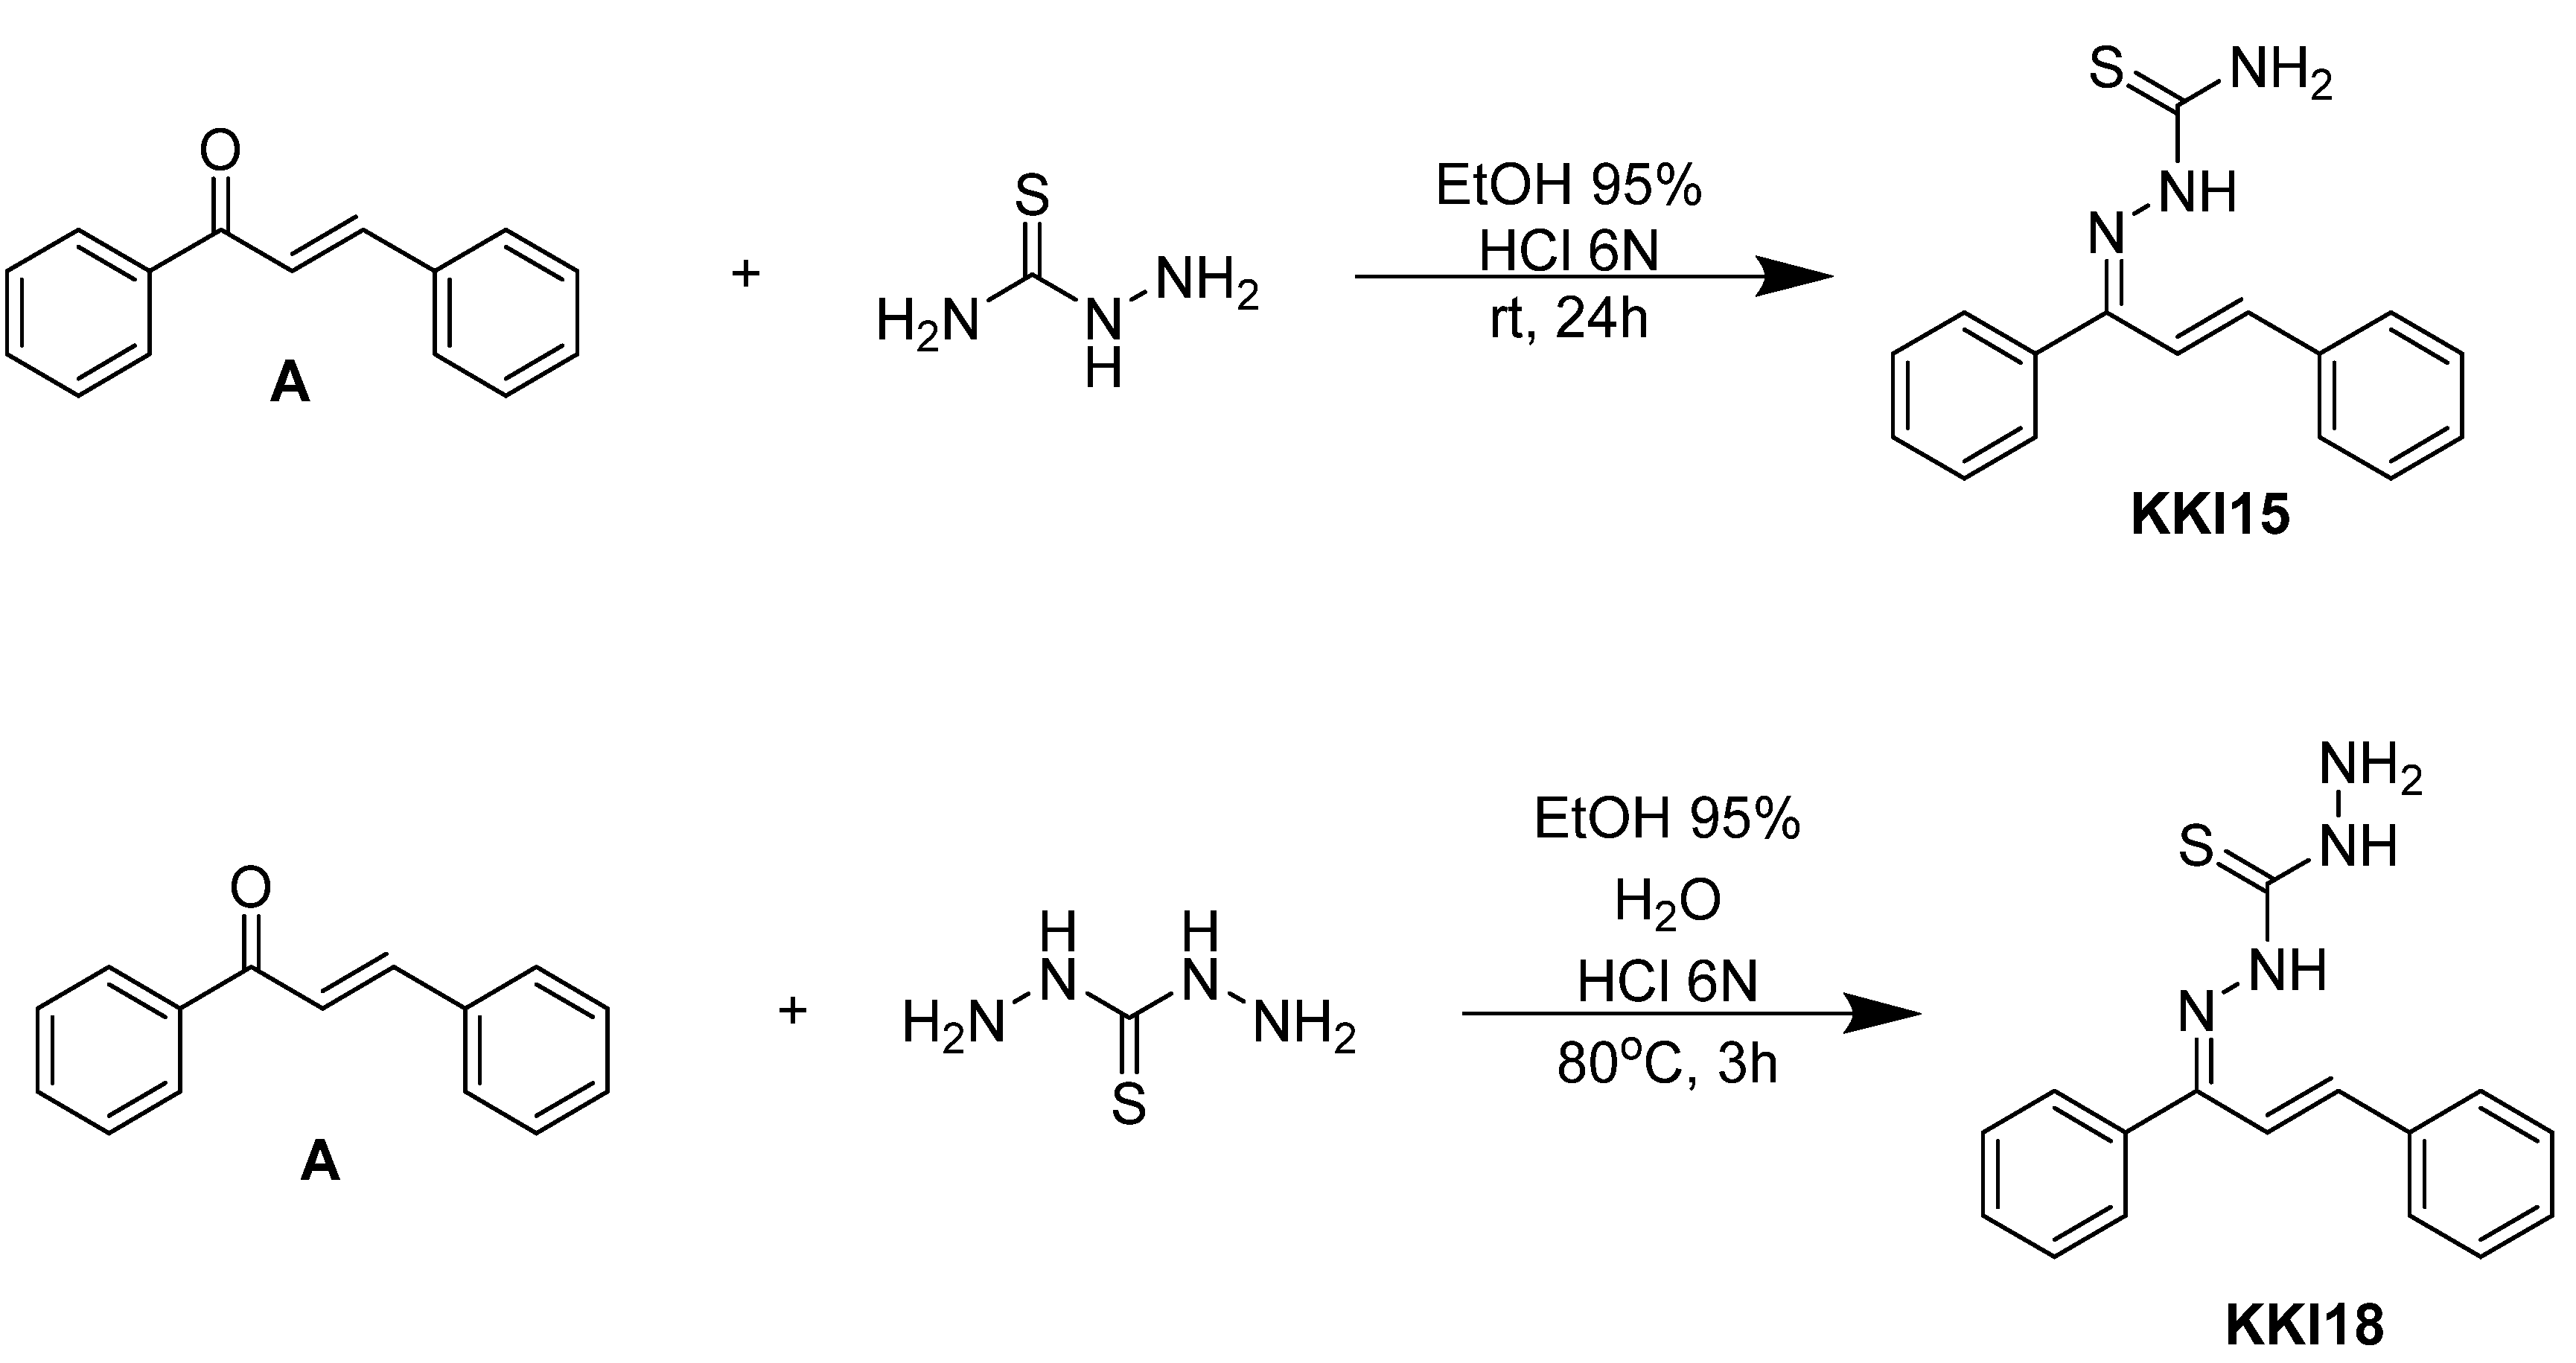
Compounds combining these structural features (
KKI15: chalcone-thiosemicarbazone) (
KKI18: chalcone-thiocarbohydrazone) have never been studied, and the elucidation of their structure is of utmost interest in the understanding of their biological results. Finally, these compounds have great potential for research activities as they are potential lead drugs for diseases to be discovered.
![Molecules 27 02537 i001]()
2. Results and Discussion
2.1. Structure Assignment
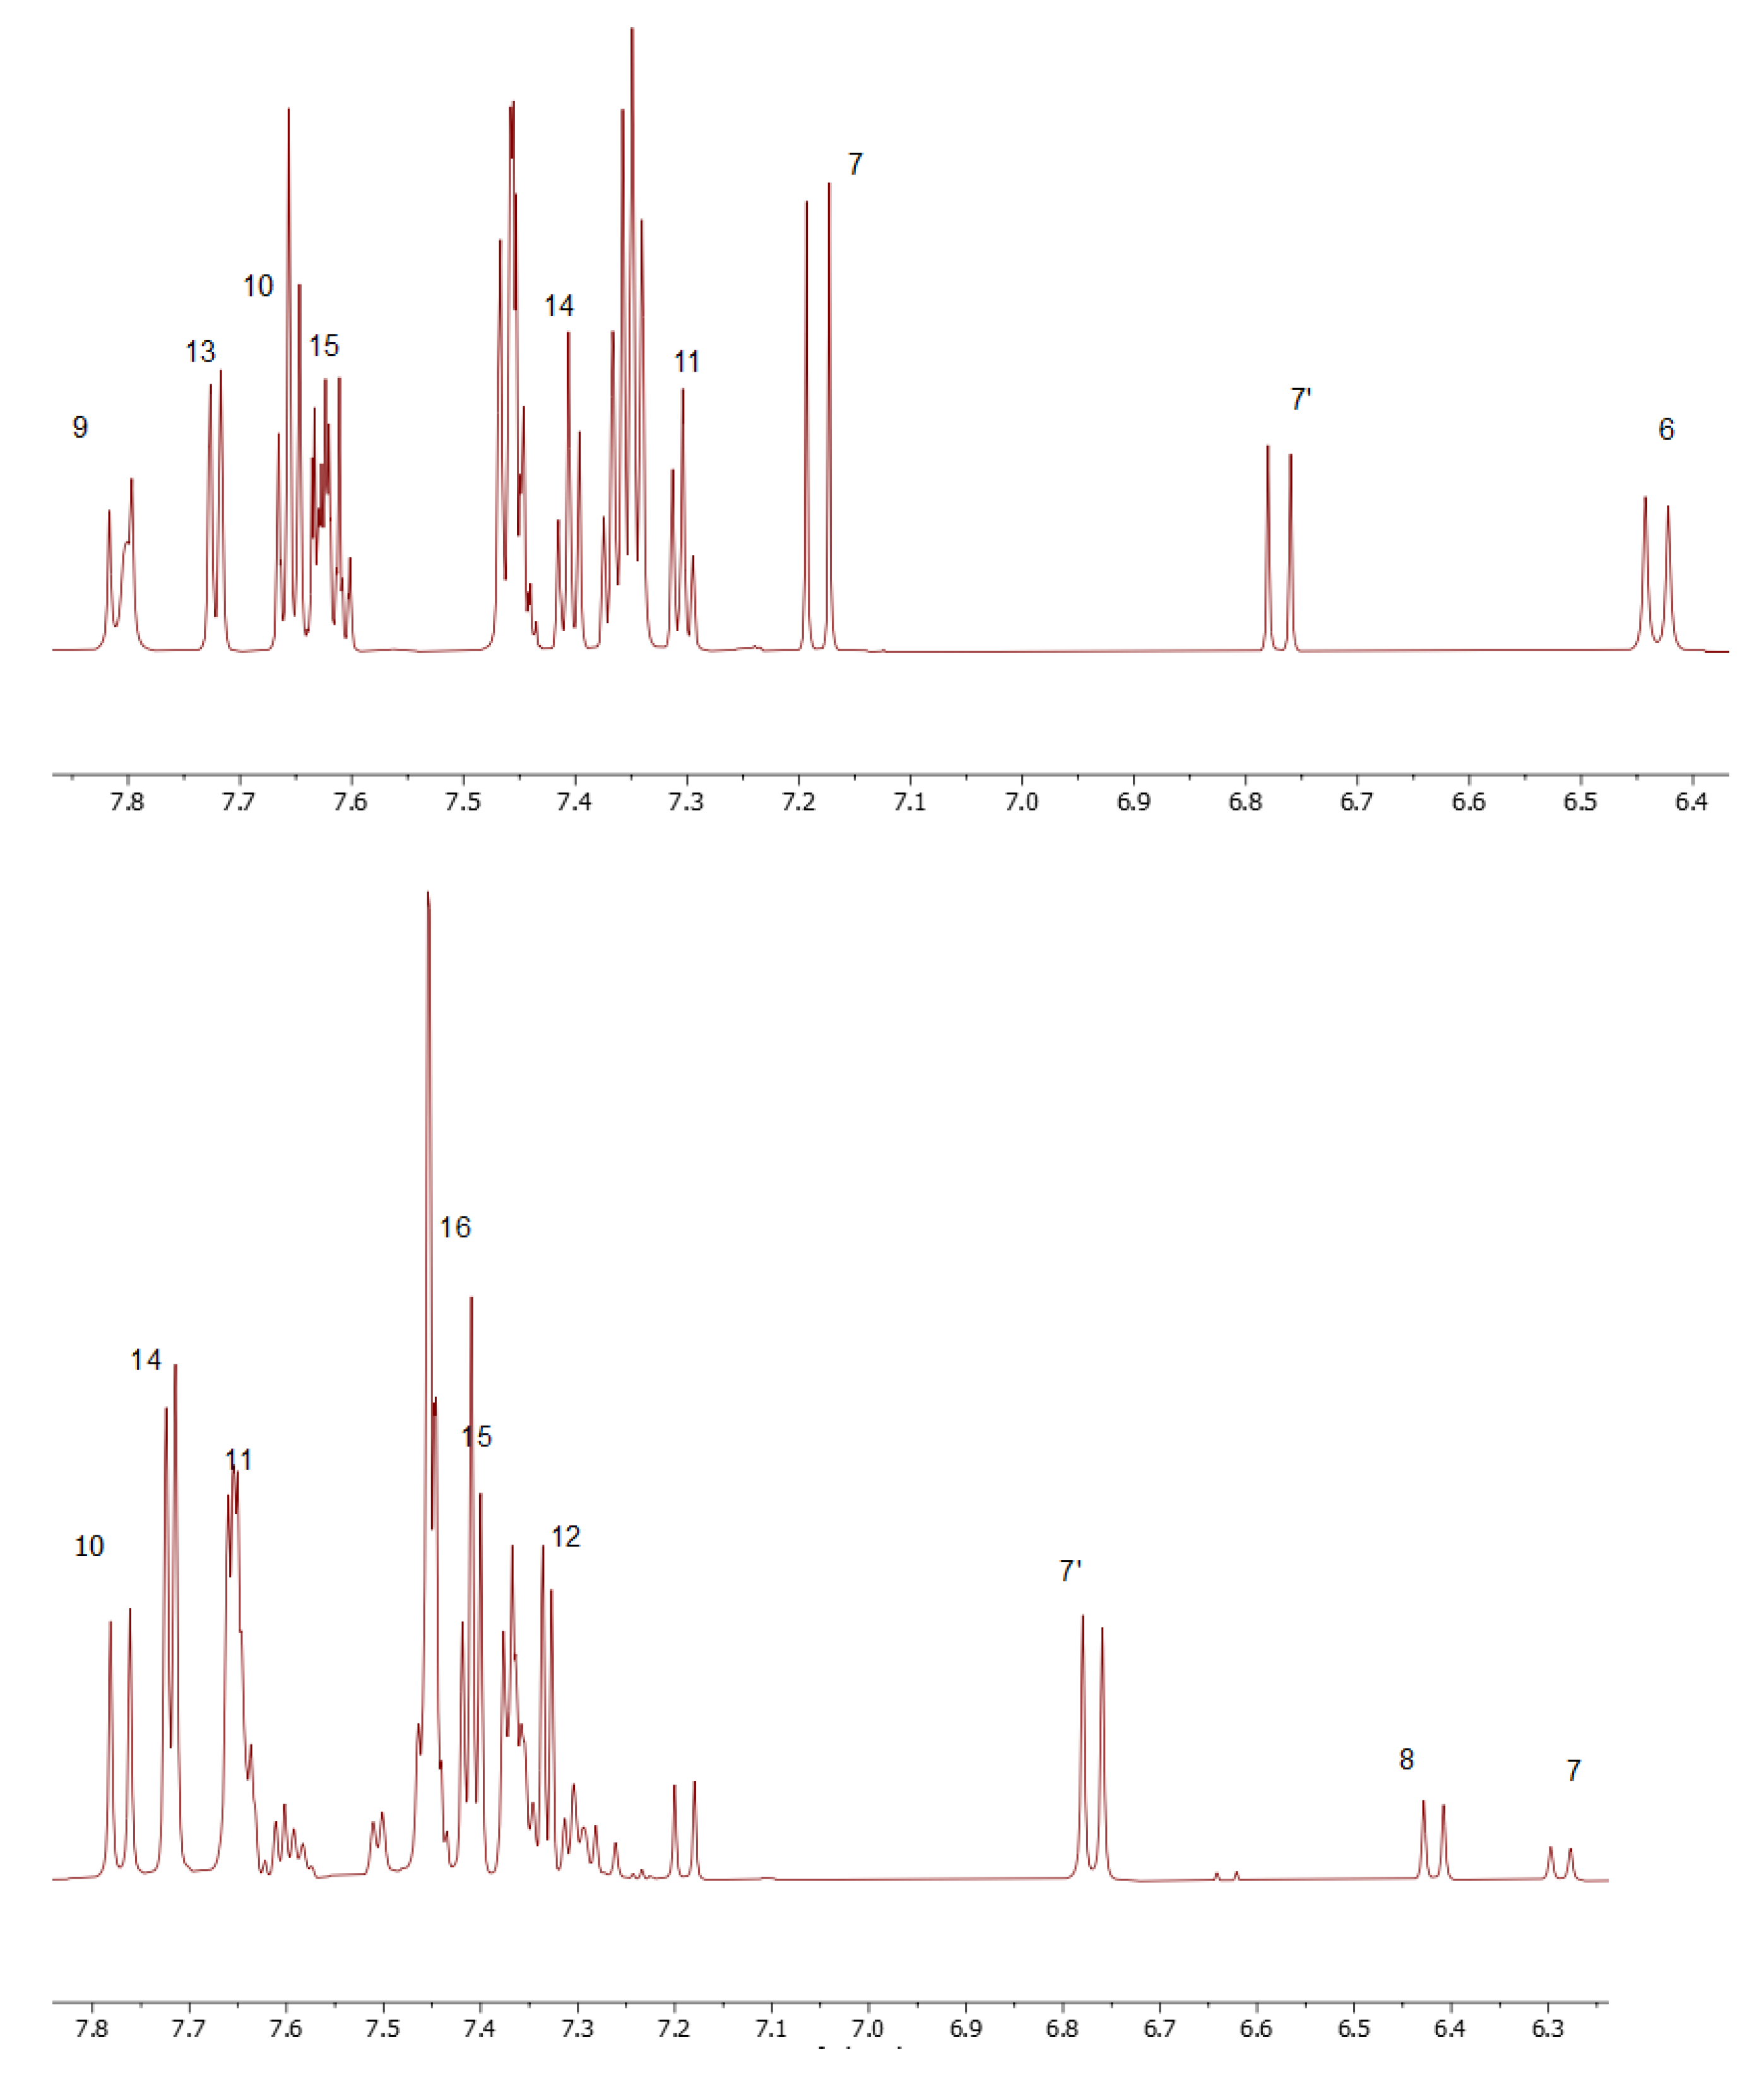
As a convenient starting point for the structure assignment of KKI15, the readily assigned H-7, which resonates at 6.79 and 7.20 ppm, was used. These two signals are due to the two conformations of KKI15. Through 2D-COSY, H-6 resonates at 6.46 ppm. Through 2D HSQC, the H-7 and H-6 show 1JC-H coupling with the C7 and C6, respectively, and therefore, C7 and C6 are assigned unambiguously at 118.0 and 143.0 ppm, respectively. Through 2D-NOESY, H-9 is identified at 7.83 and 8.31 ppm due to its correlation with H-7. H-10 and H-11 are then identified due to their correlation with H-9, through 2D-COSY. Furthermore, it is observed that H-7 has two more correlations with protons H-10 and H-13. Through 2D-HSQC, H-9, H-10, and H-11 show 1JC-H coupling with C-9, C-10, and C-11, respectively, and, therefore, C-9, C-10, and C-11 are assigned unambiguously at 119.10, 129.37, and 129.65 ppm. Through 2D-COSY, H-13, H-14, and H-15 are identified, and through 2D-HSQC, C-13, C-14, and C-15 are therefore assigned unambiguously at 127.39, 128.76, and 131.27 ppm. Moreover, it is observed in one correlation between H-6 and H-14. Protons attached to nitrogen are increasingly deshielded. NH(3) resonates at 11.10 ppm. Through 2D-NOESY, NH2 resonates at 7.80 ppm. Through a two-dimensional 13C-1H spectrum of the KKI15, all the carbons were identified except for the quaternary and carbonyl carbons. These carbons have been identified through 2D-HMBC. Specifically, H-7 shows 3JC-H with C-5, H-6 shows 3JC-H with C-8, H-13 shows 2JC-H with C-12, and finally, NH shows 2JC-H with C-2. Based on this strategy, the complete identification of all the proton and carbon atoms of the KKI15 molecule was achieved.
A similar procedure was carried out for thiocarbohydrazone KKI18. Two signals were observed for H-8 due to the two conformations of KKI18. The only difference is that KKI18 has one more amine group than KKI15. For that reason, NH(4) is resonated to 11 and 9.62 ppm, while through 2D-NOESY, NH2 is identified at 3.33 and 5.02 ppm. Finally, through 2D-NOESY, NH(2) is identified as it is associated with NH2. The NH makes sense to be increasingly deshielded because it is next to two electronegative individuals. Moreover, there were observed correlations similar to KKI15 between H-8 and H-10, H-11 and H-14, and H-7 with H-15.
All the calculations were carried out in DMSO because it is considered to be a solvent that simulates the amphoteric environment and is suitable for the observation of NOE effects [
18,
19].
2.2. Conformational Analysis
DFT was used to predict the lowest energy conformations for
KKI15 and
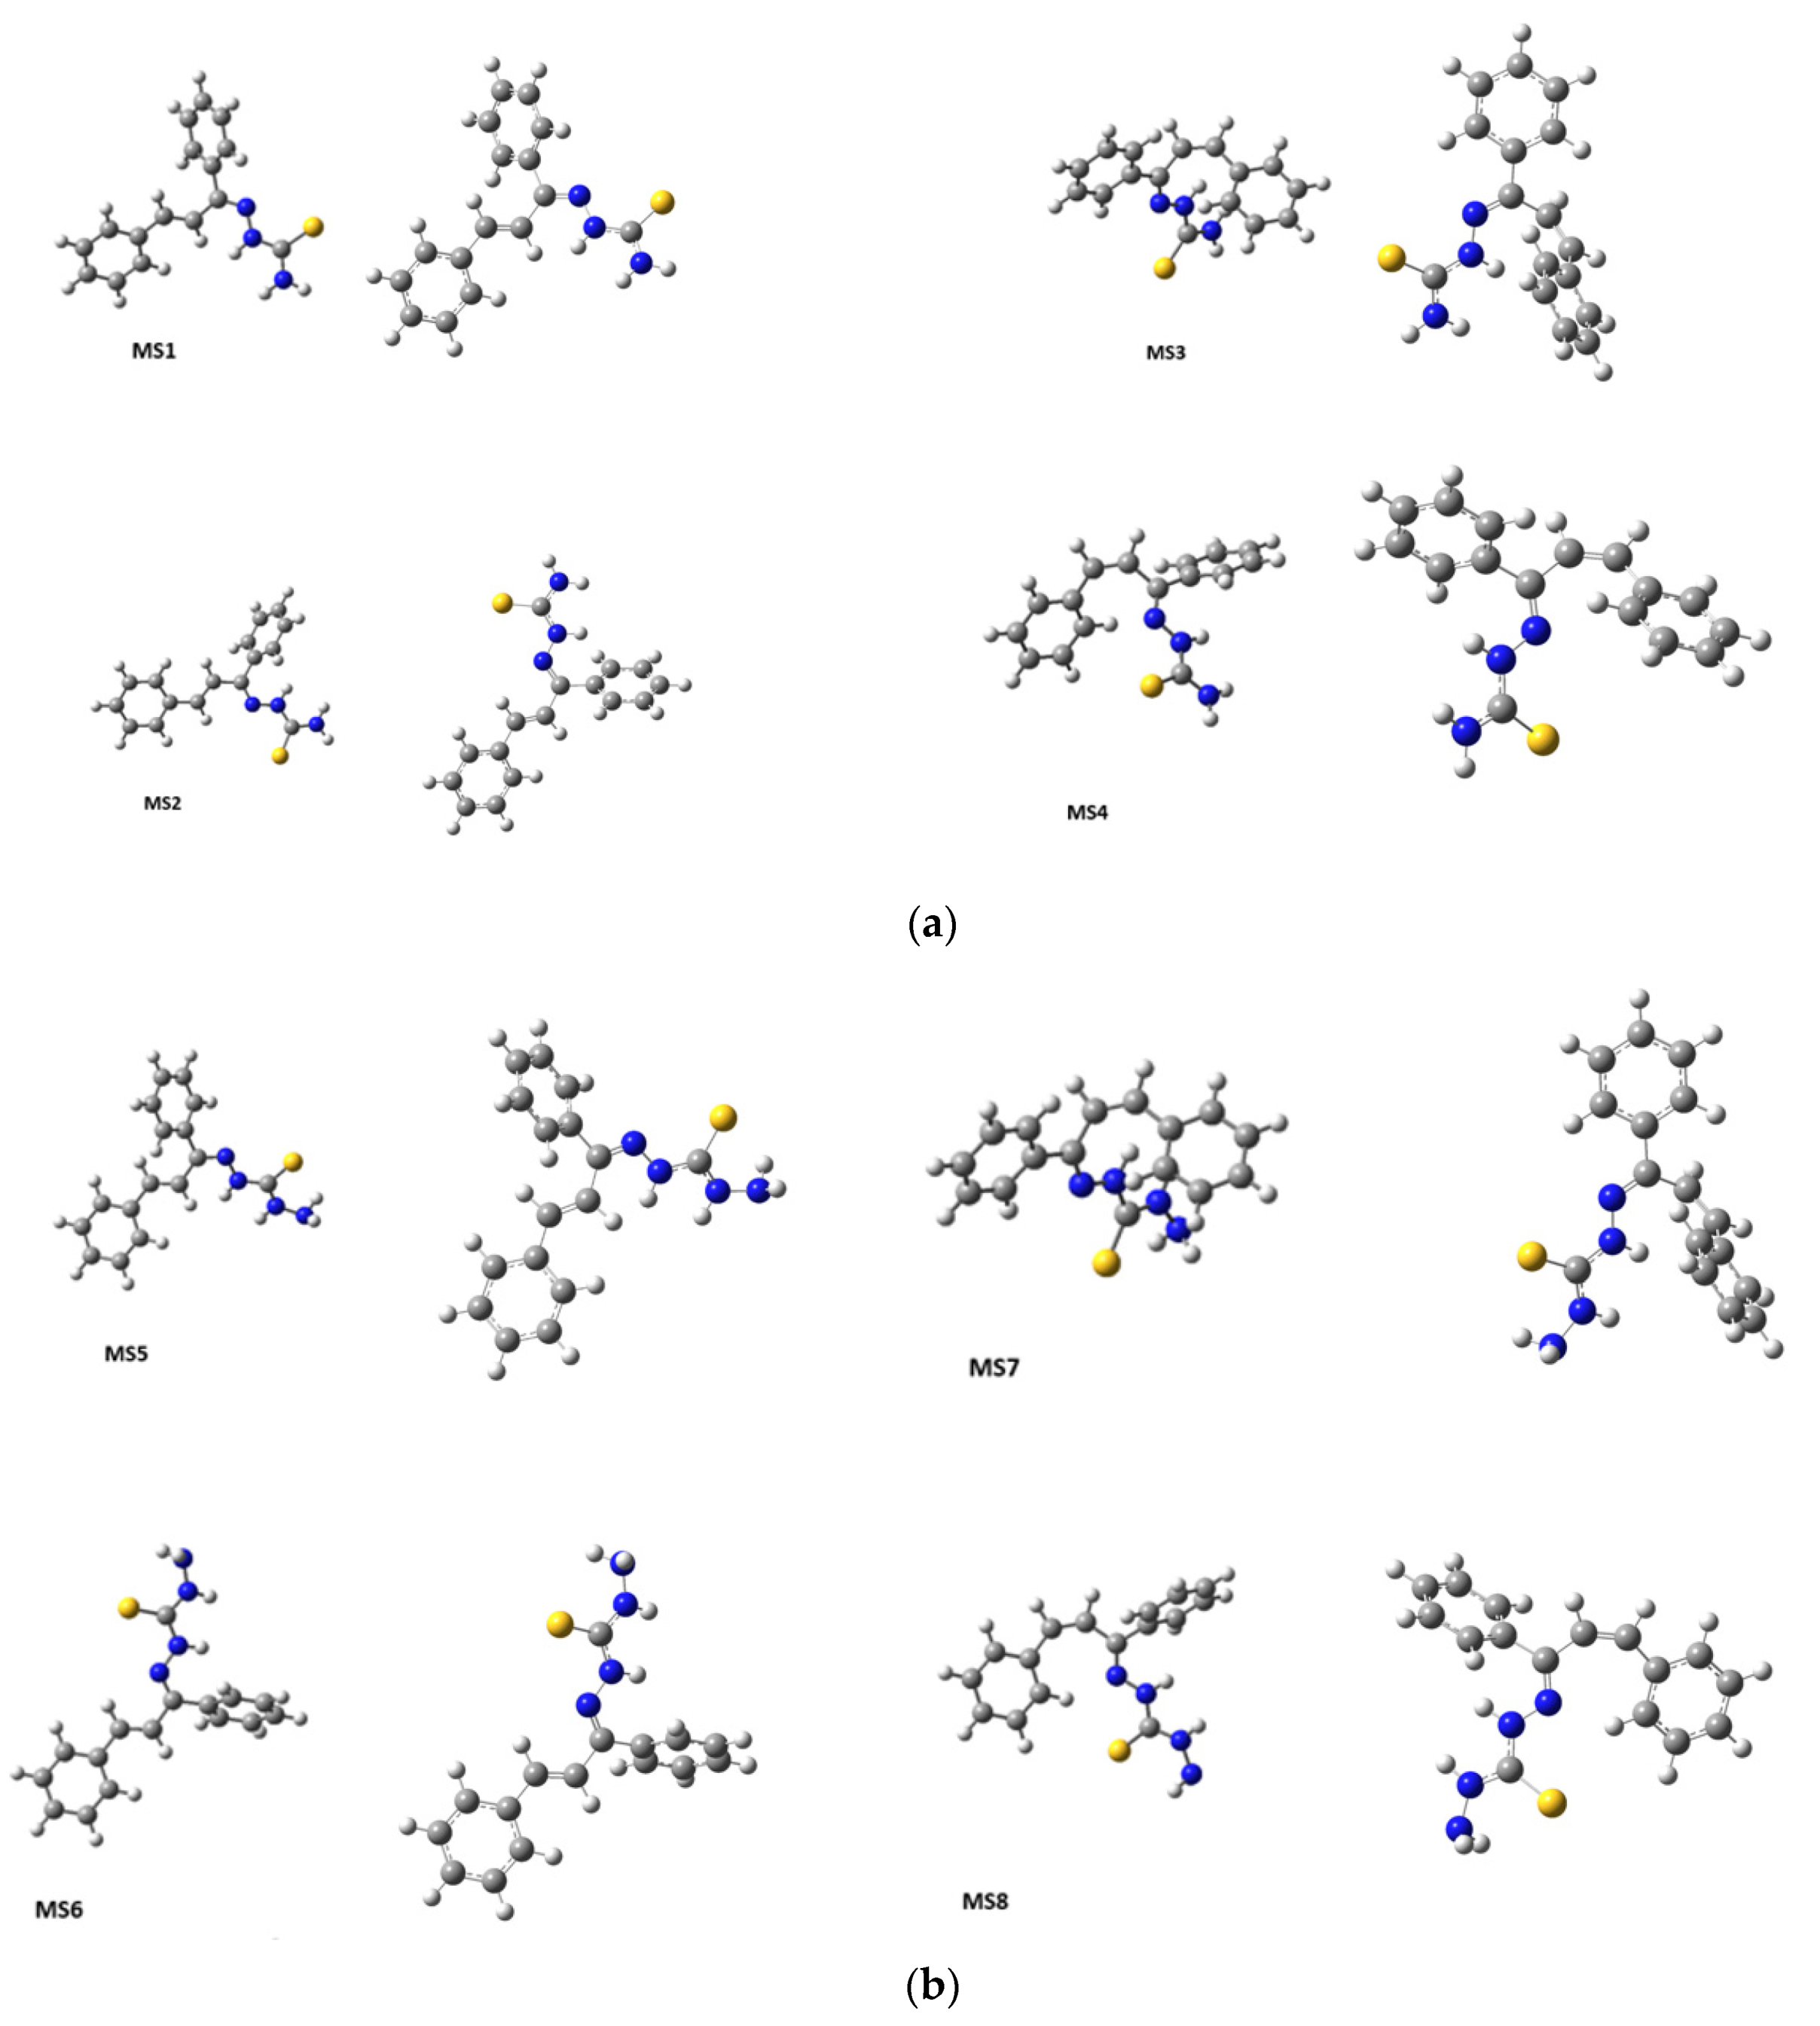
KKI18 as this method offers the highest accuracy of the existing ones. Various initial structures were geometry optimized, and all geometry calculations resulted in eight conformers for
KKI15 and for
KKI18, see
Figure 4. Then their frequencies were calculated. No imaginary frequencies have been found confirming that there are true minima structures.
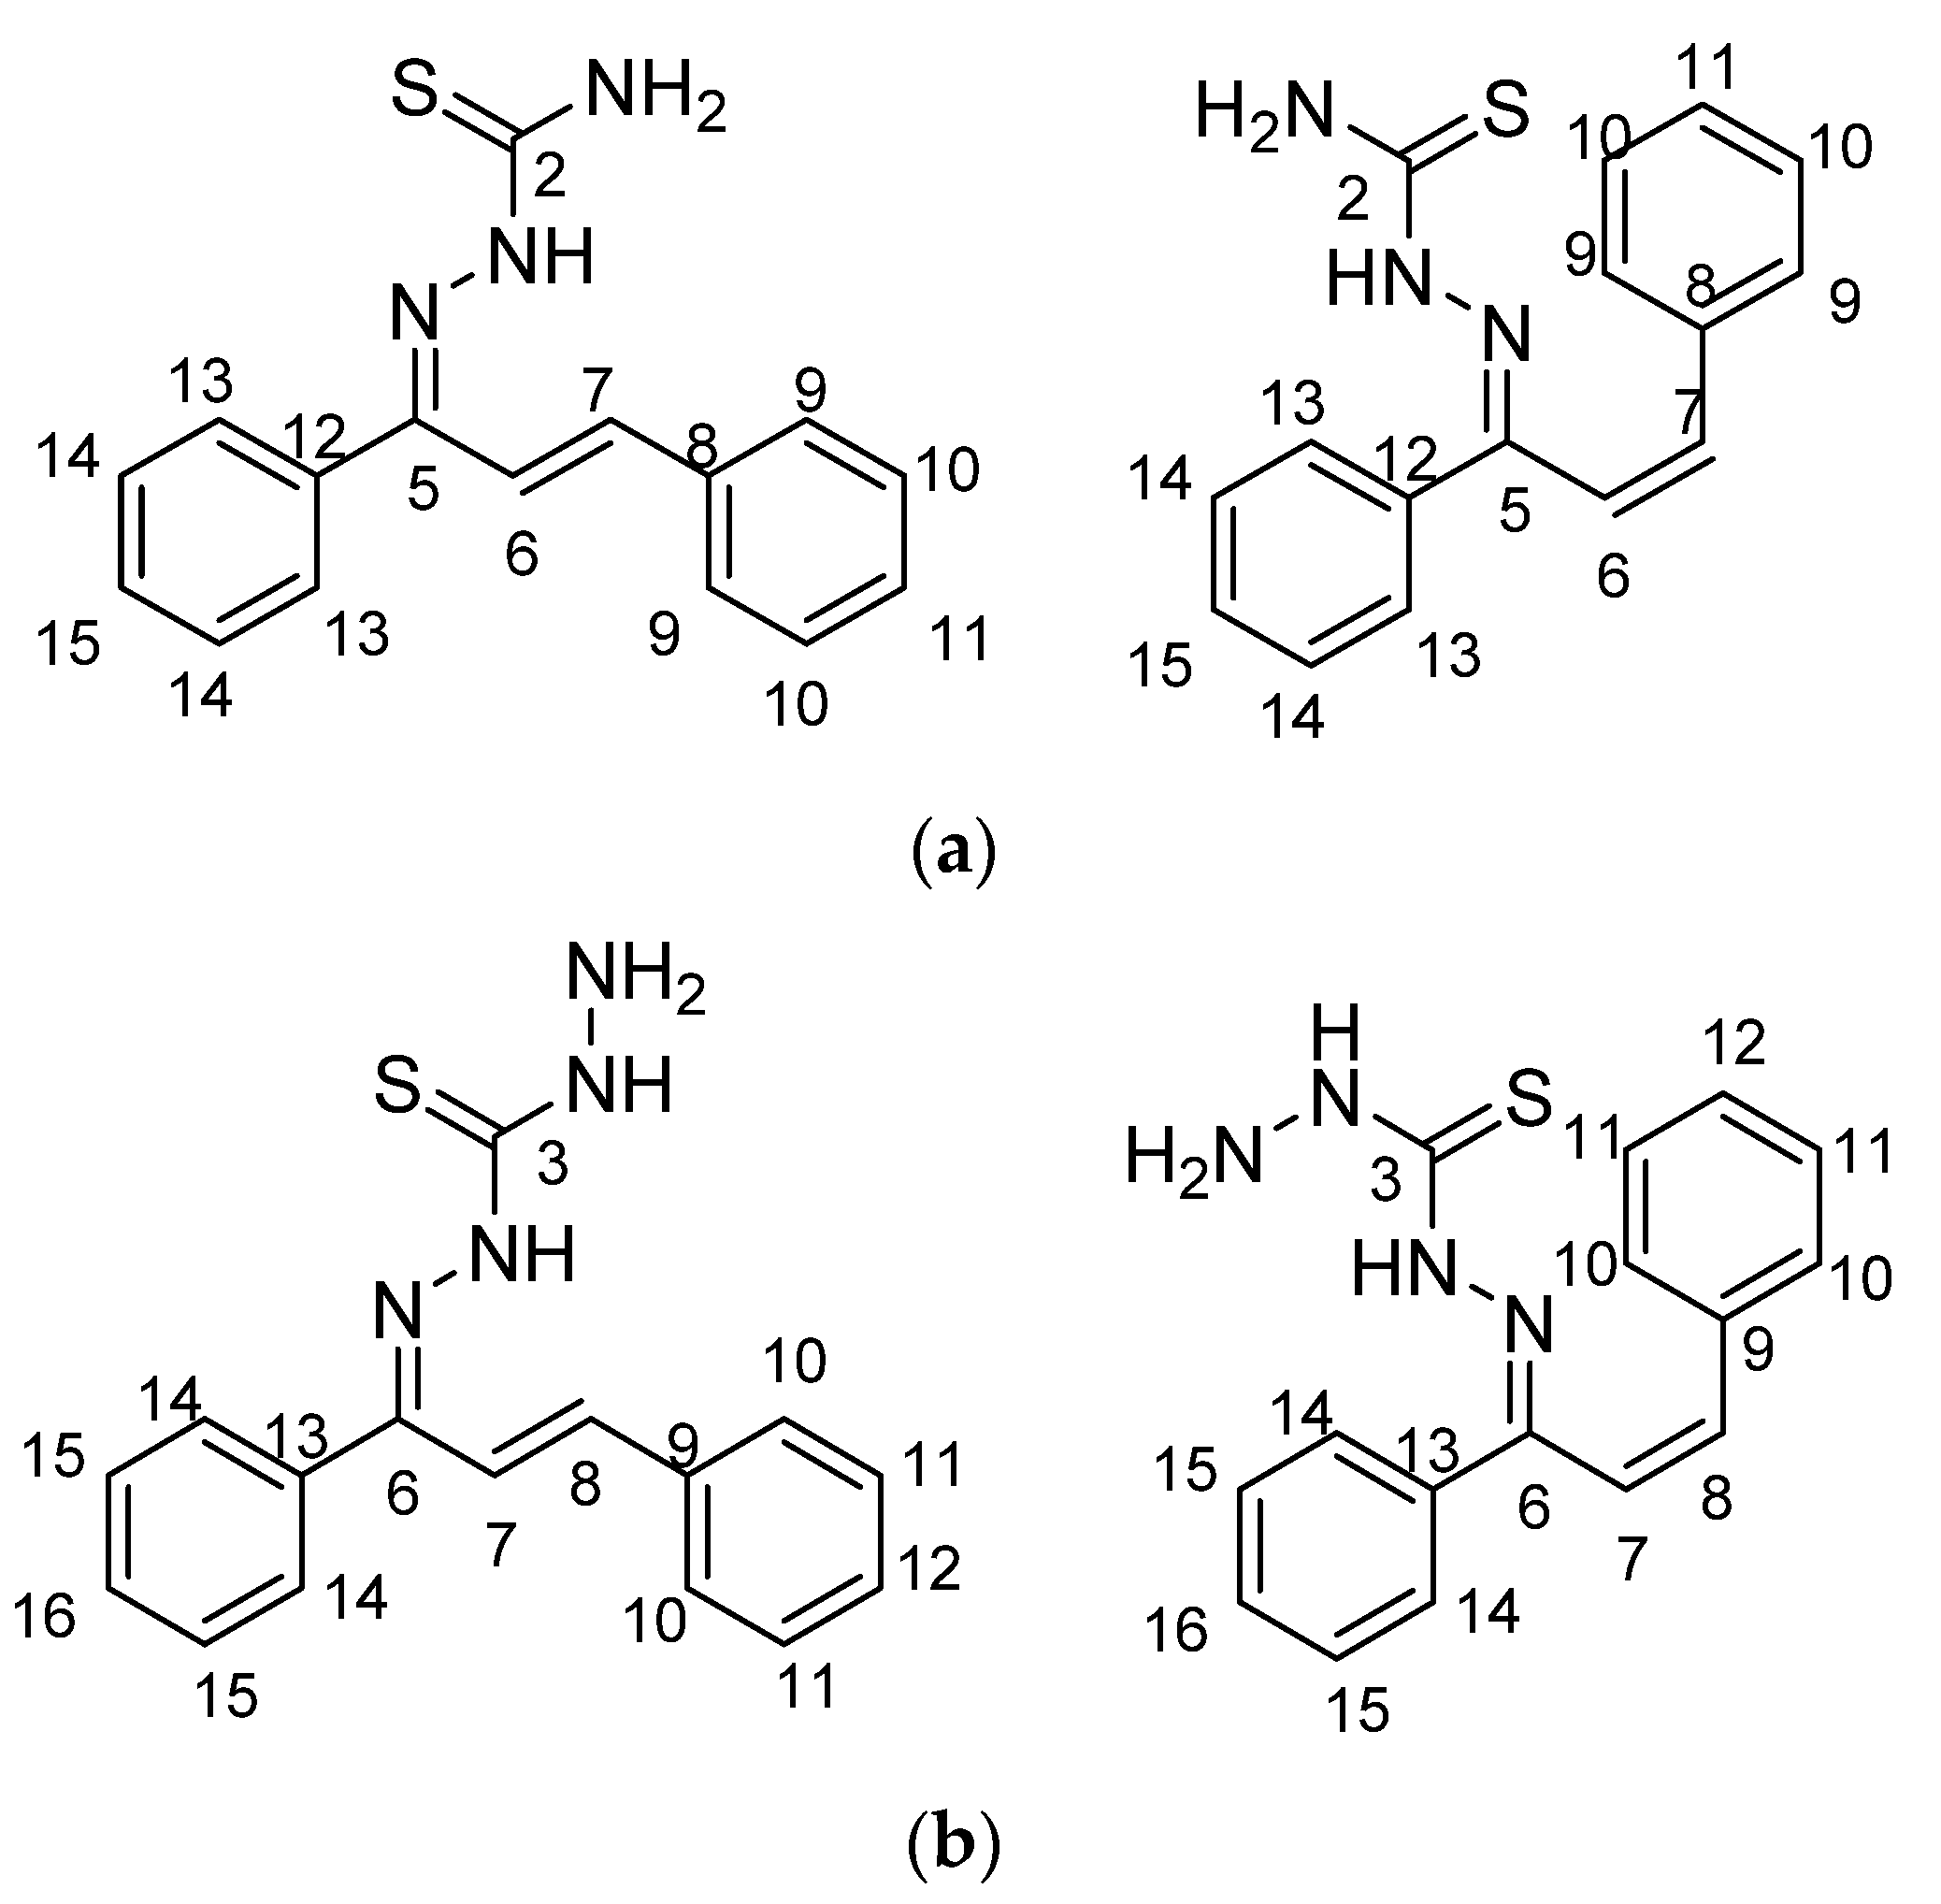
Four dihedral angles were selected for each molecular structure. Specifically, the angles of
KKI15 that were selected for DFT are formed by the following atoms: 5-6-7-8 (τ1), 3-4-5-6 (τ2), 3-4-5-12 (τ3), and 8-7-6-5 (τ4) and for
KKI18: 6-7-8-9 (τ1′), 4-5-6-7 (τ2′), 4-5-6-13 (τ3′) and 9-8-7-6 (τ4′). The relative energies are given in
Table 2 with the values of dihedrals angles for
KKI15 and
KKI18.
In
Table 2, the values of the dihedral angles differ in each isomer. Although the theoretical value of the dihedral angle should be 0° or 180°, there are some small deviations from these values. This may be due to stereochemical hindrances.
Table 2 clearly shows the relationship between the energy values and the structures, with the
E isomers having lower energies values than the
Z. From the three-dimensional structures, it is observed that the
E configurations reduce the stereochemical repulsions in relation to the
Z.
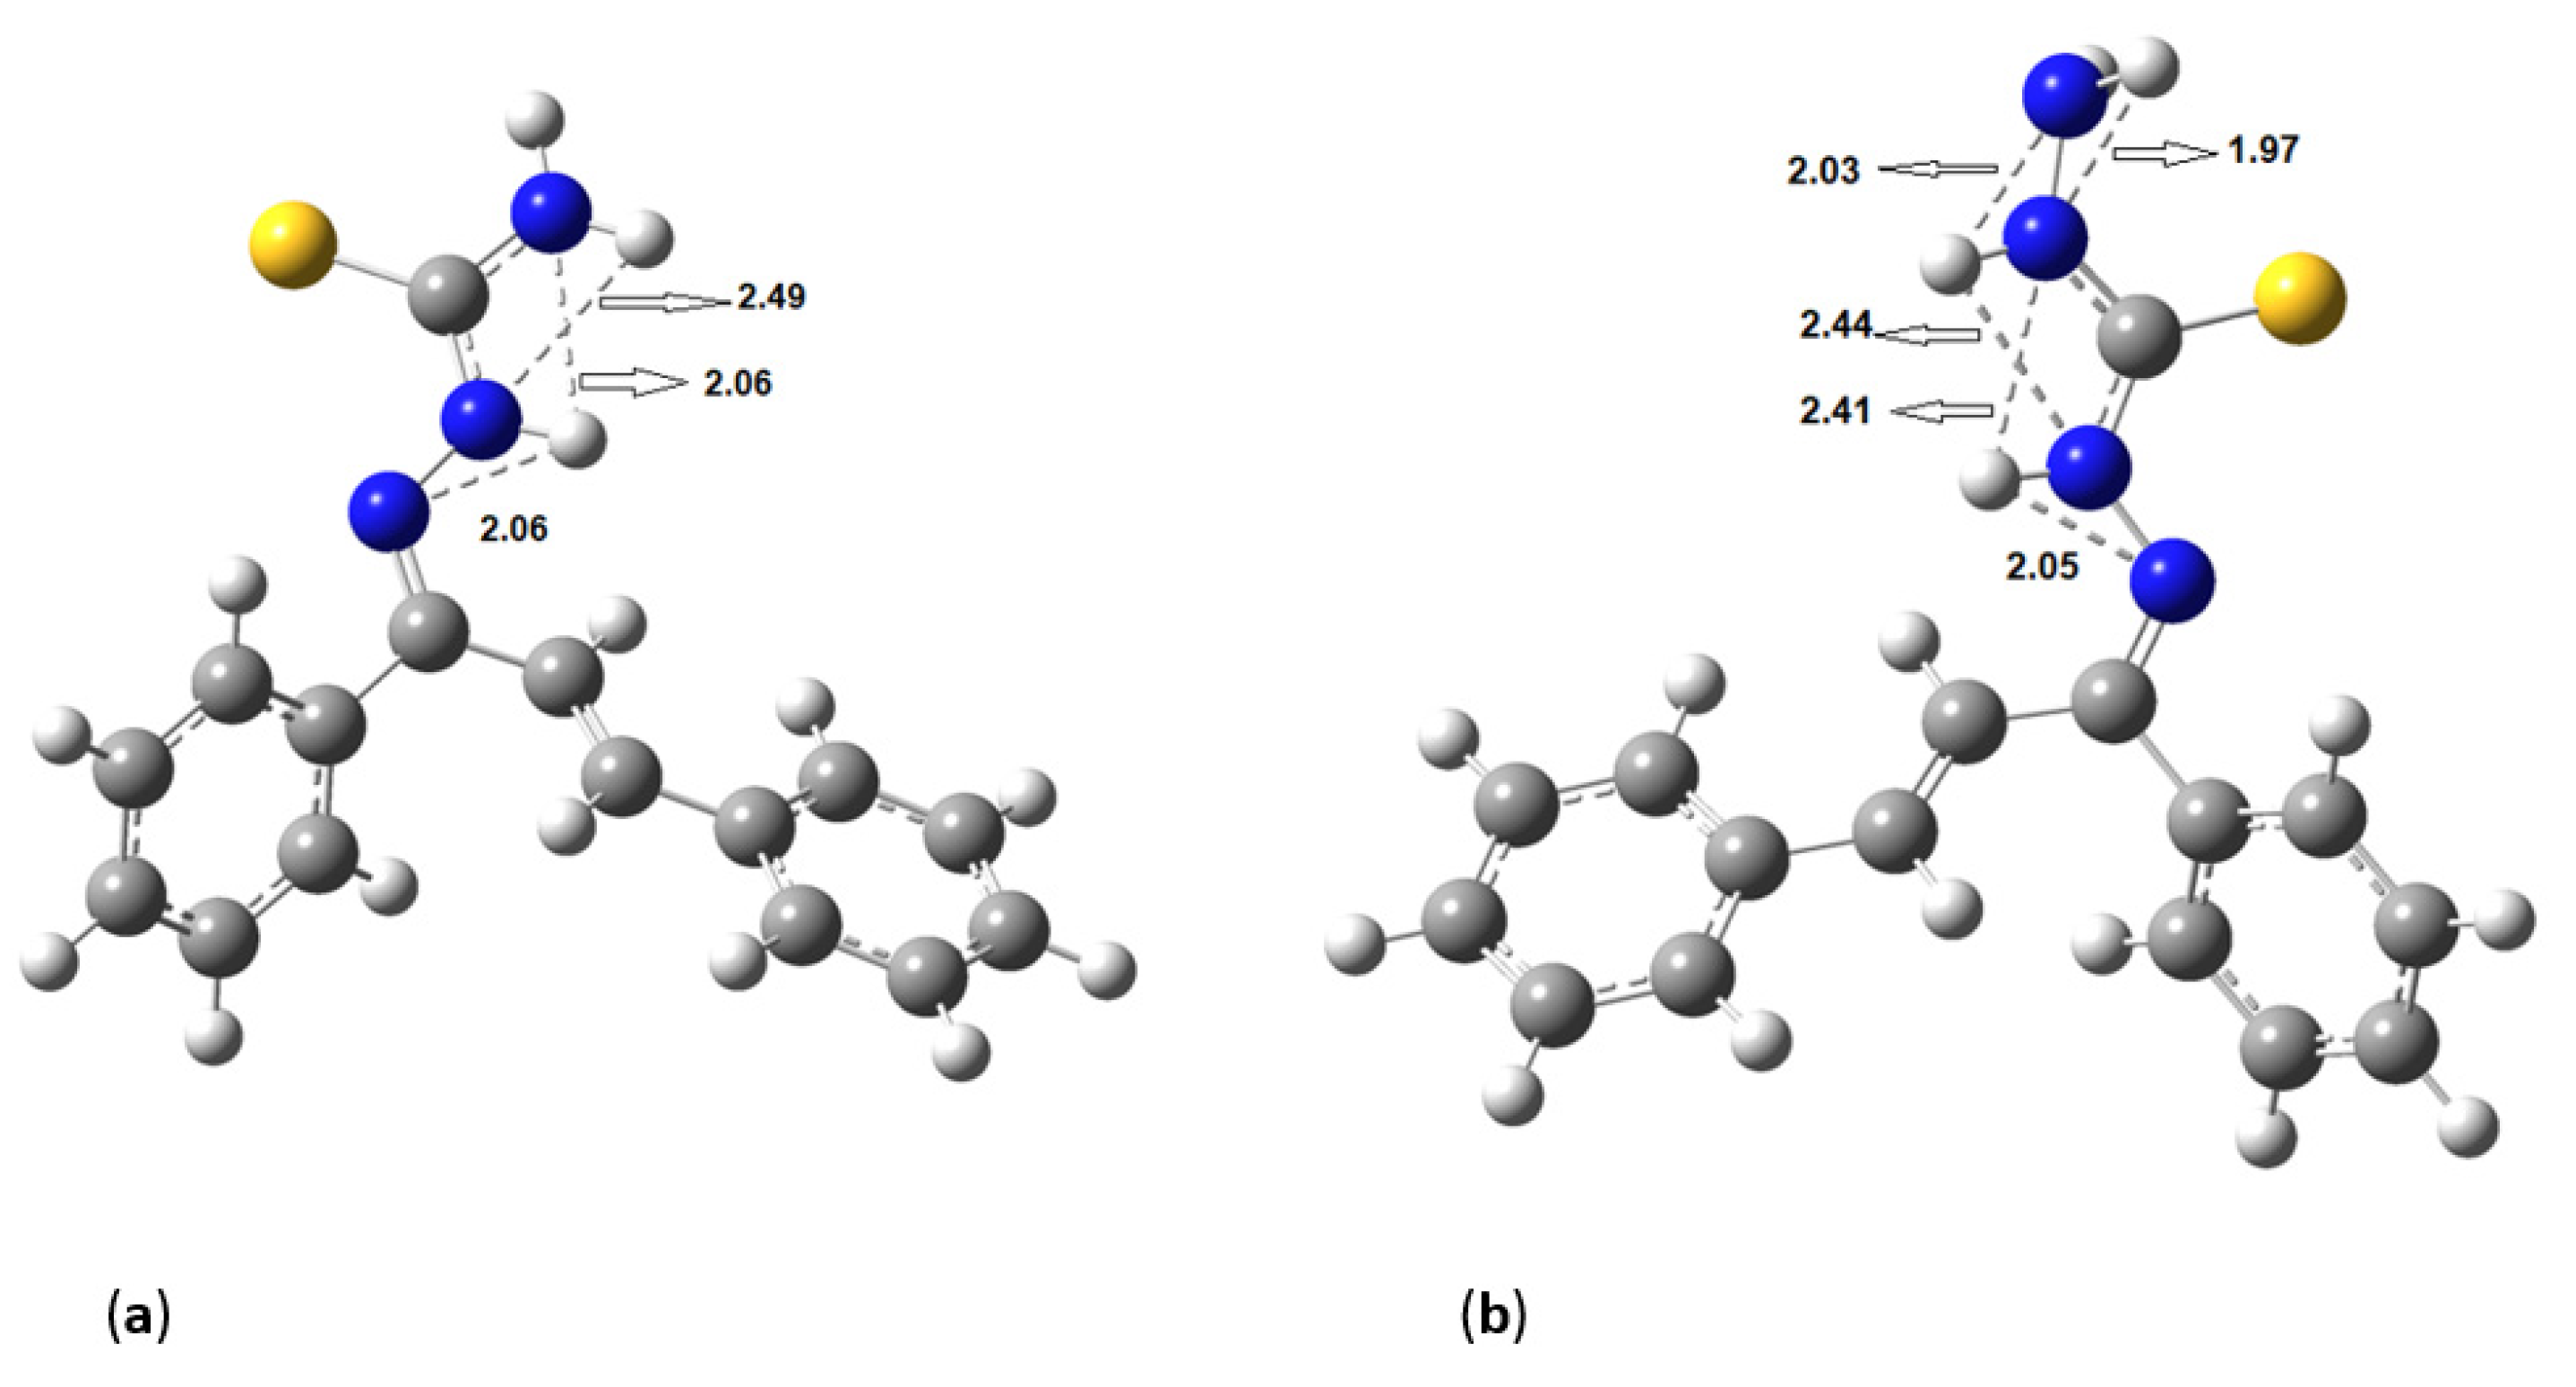
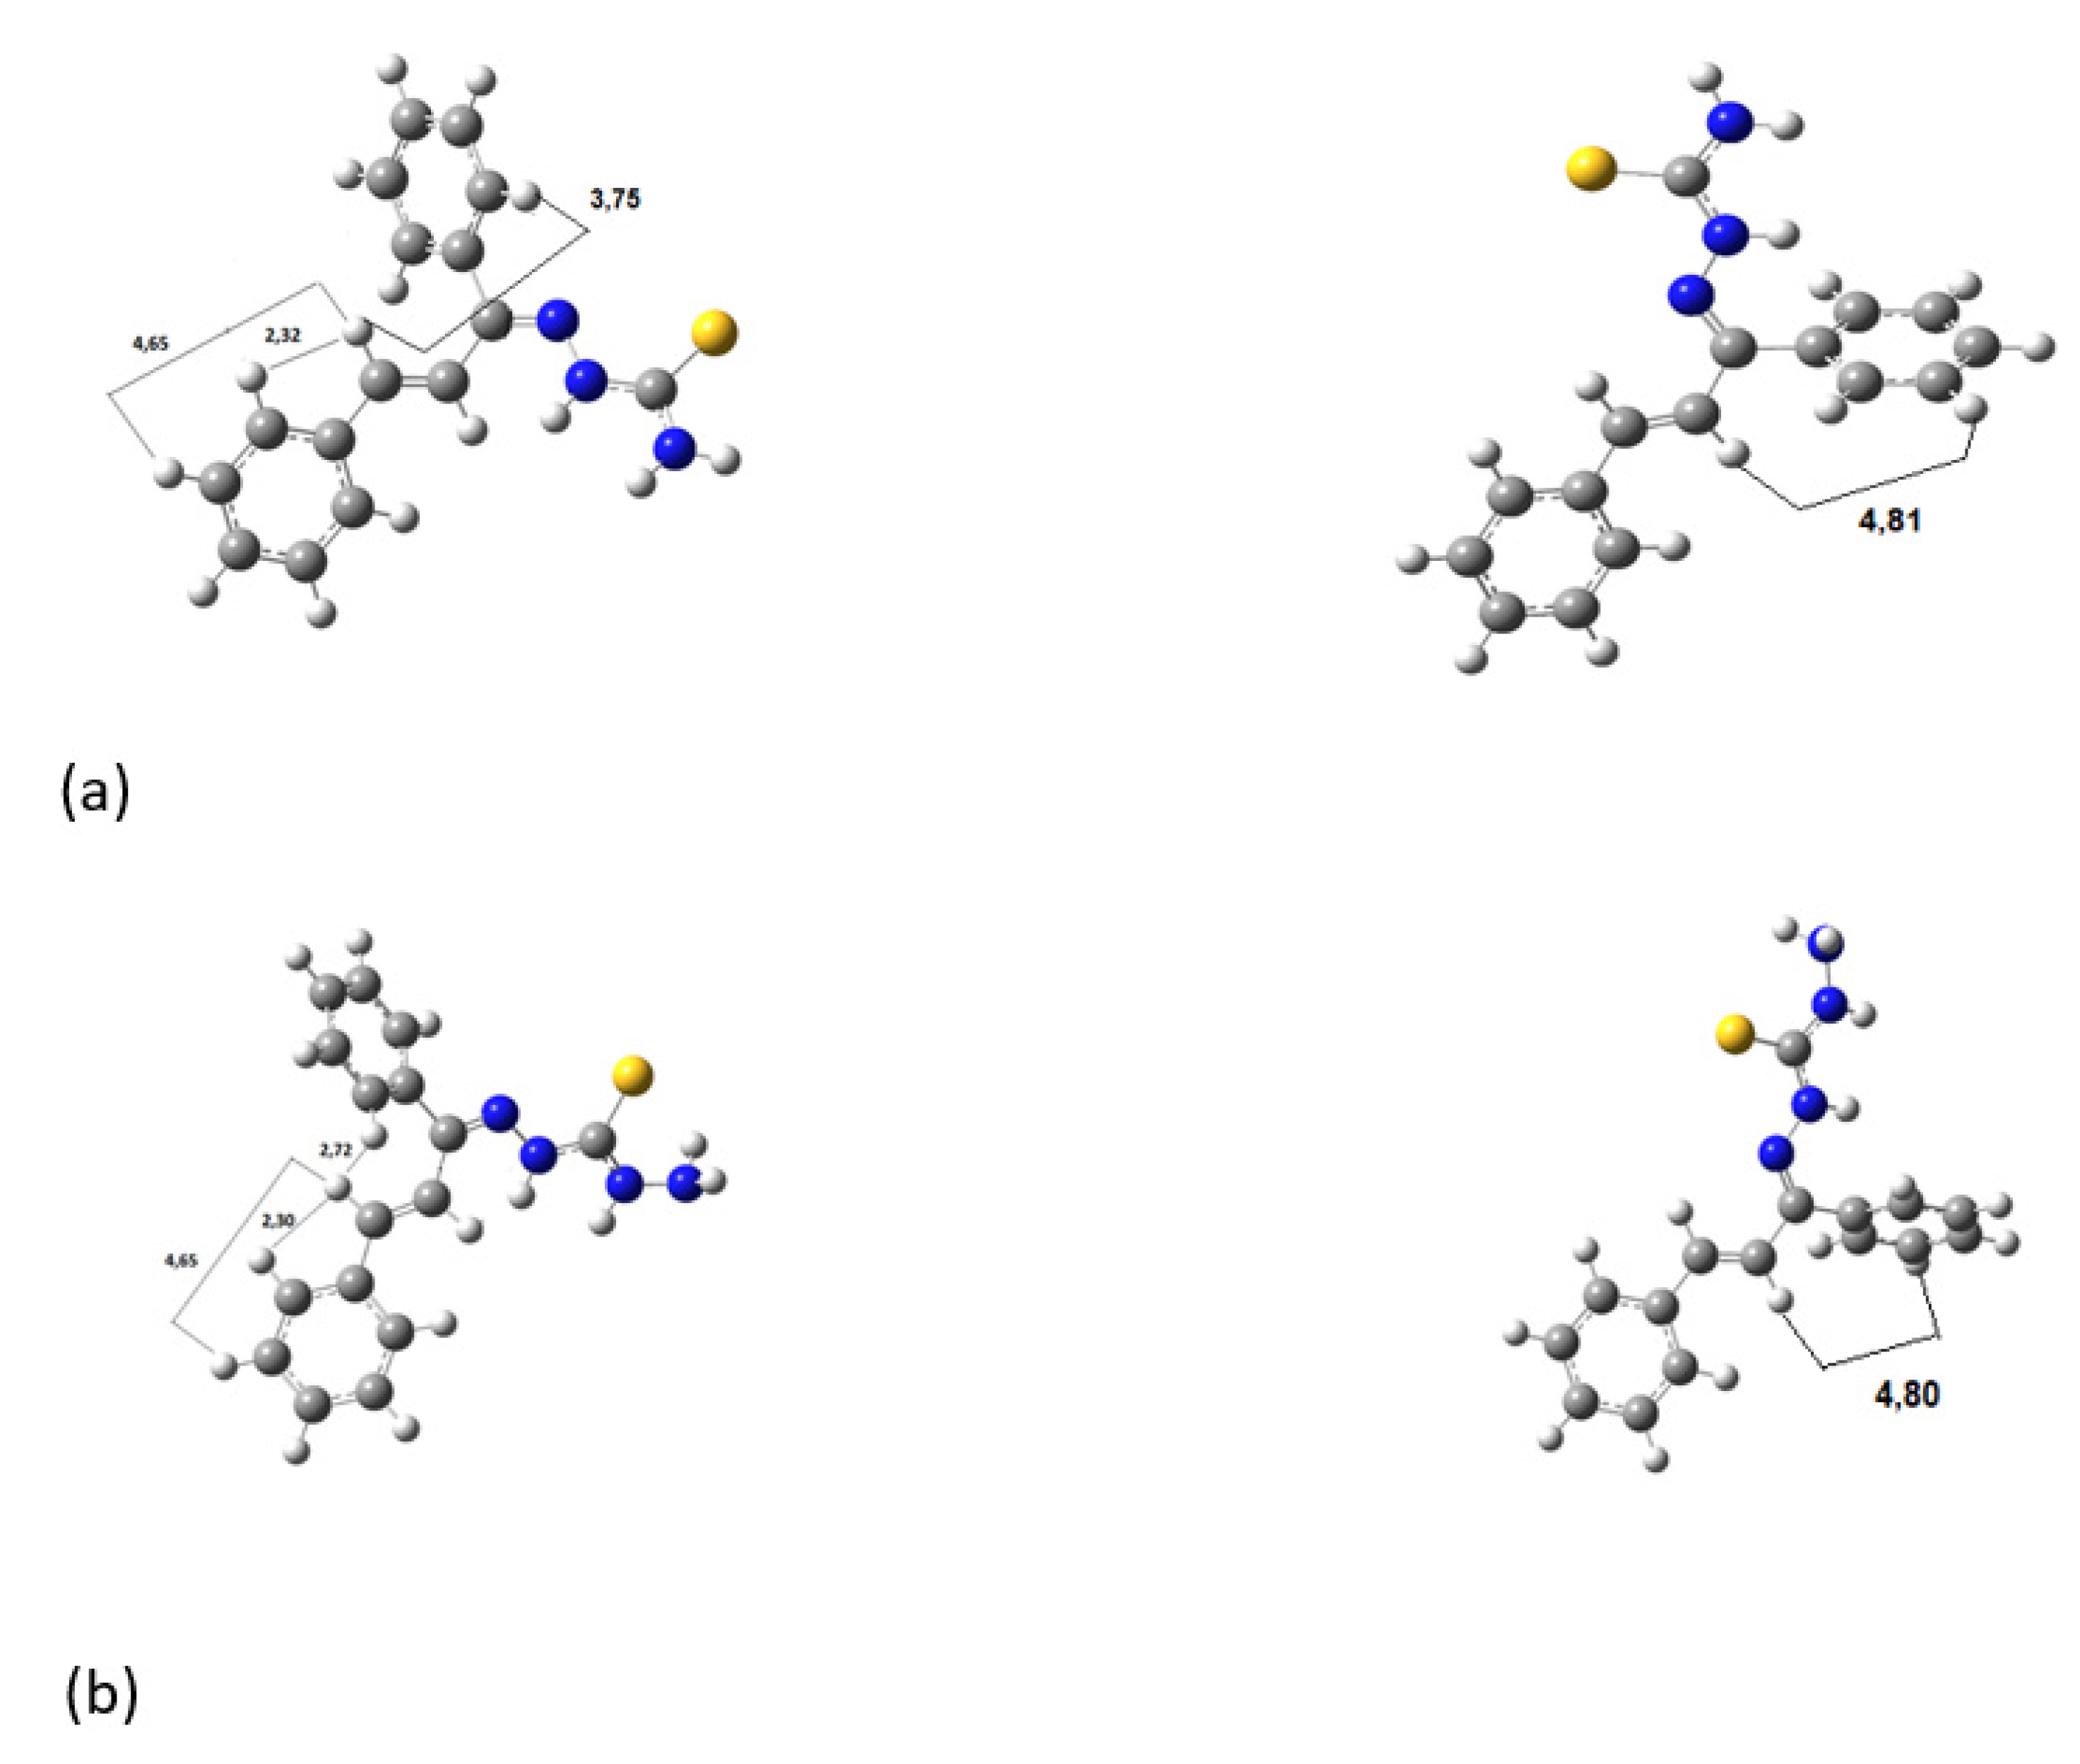
Figure 5 shows the hydrogen bonds between the hydrogen of amines and nitrogens for (a)
KKI15 and (b)
KKI18. The same hydrogen bonds were observed for all the conformations of each compound.
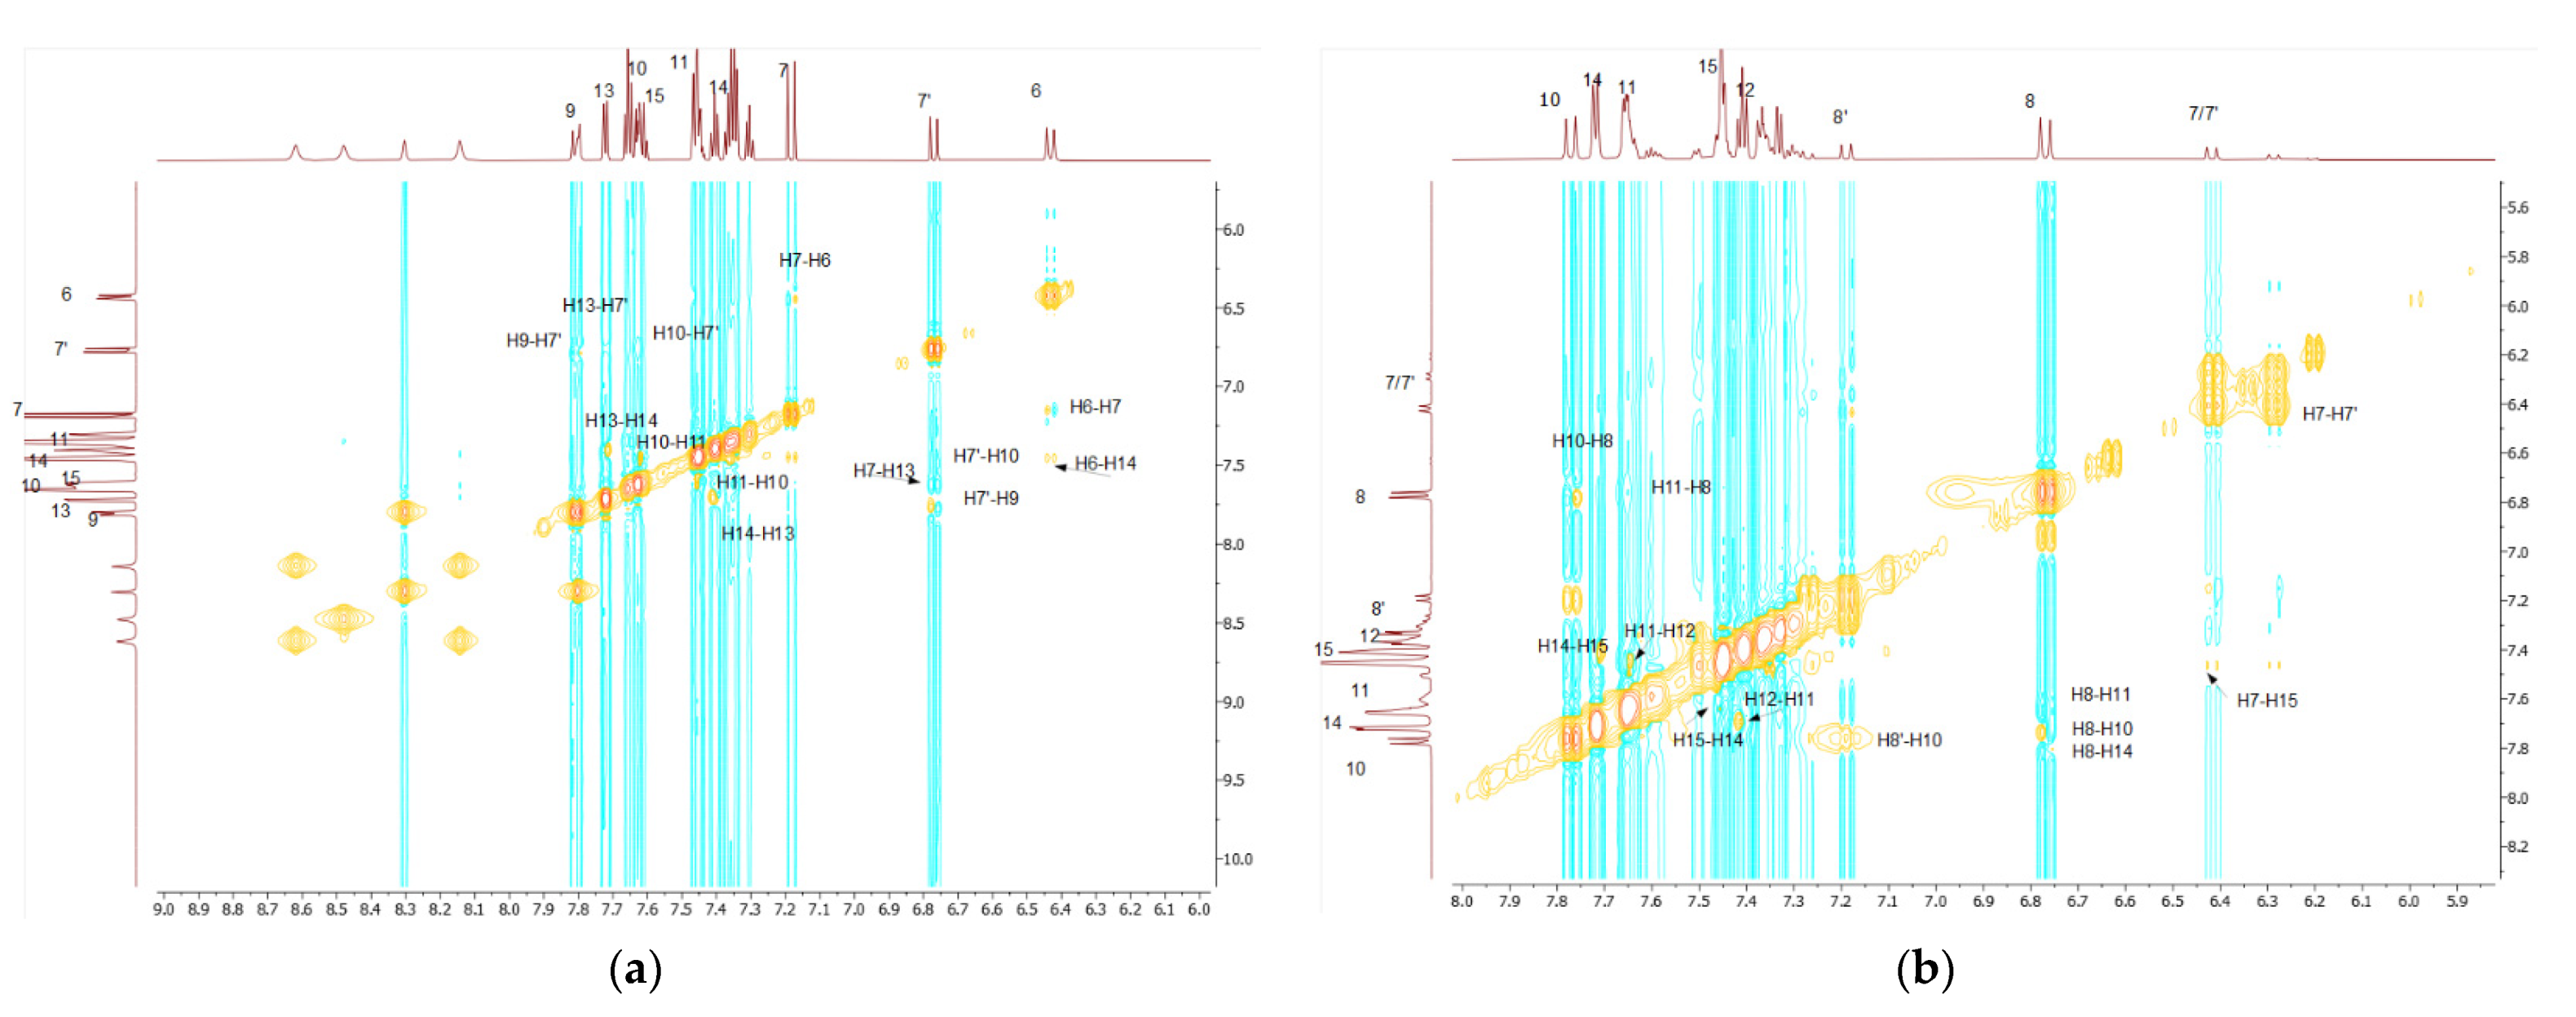
Considering the predicted energy values, the structures of the compounds, and the correlations that were observed in 2D-NOESY spectra (
Figure 6), the structures MS1 and MS5 are taken as the most probable configurations for
KKI15 and
KKI18, respectively, as shown in
Figure 7 (
Table 3).
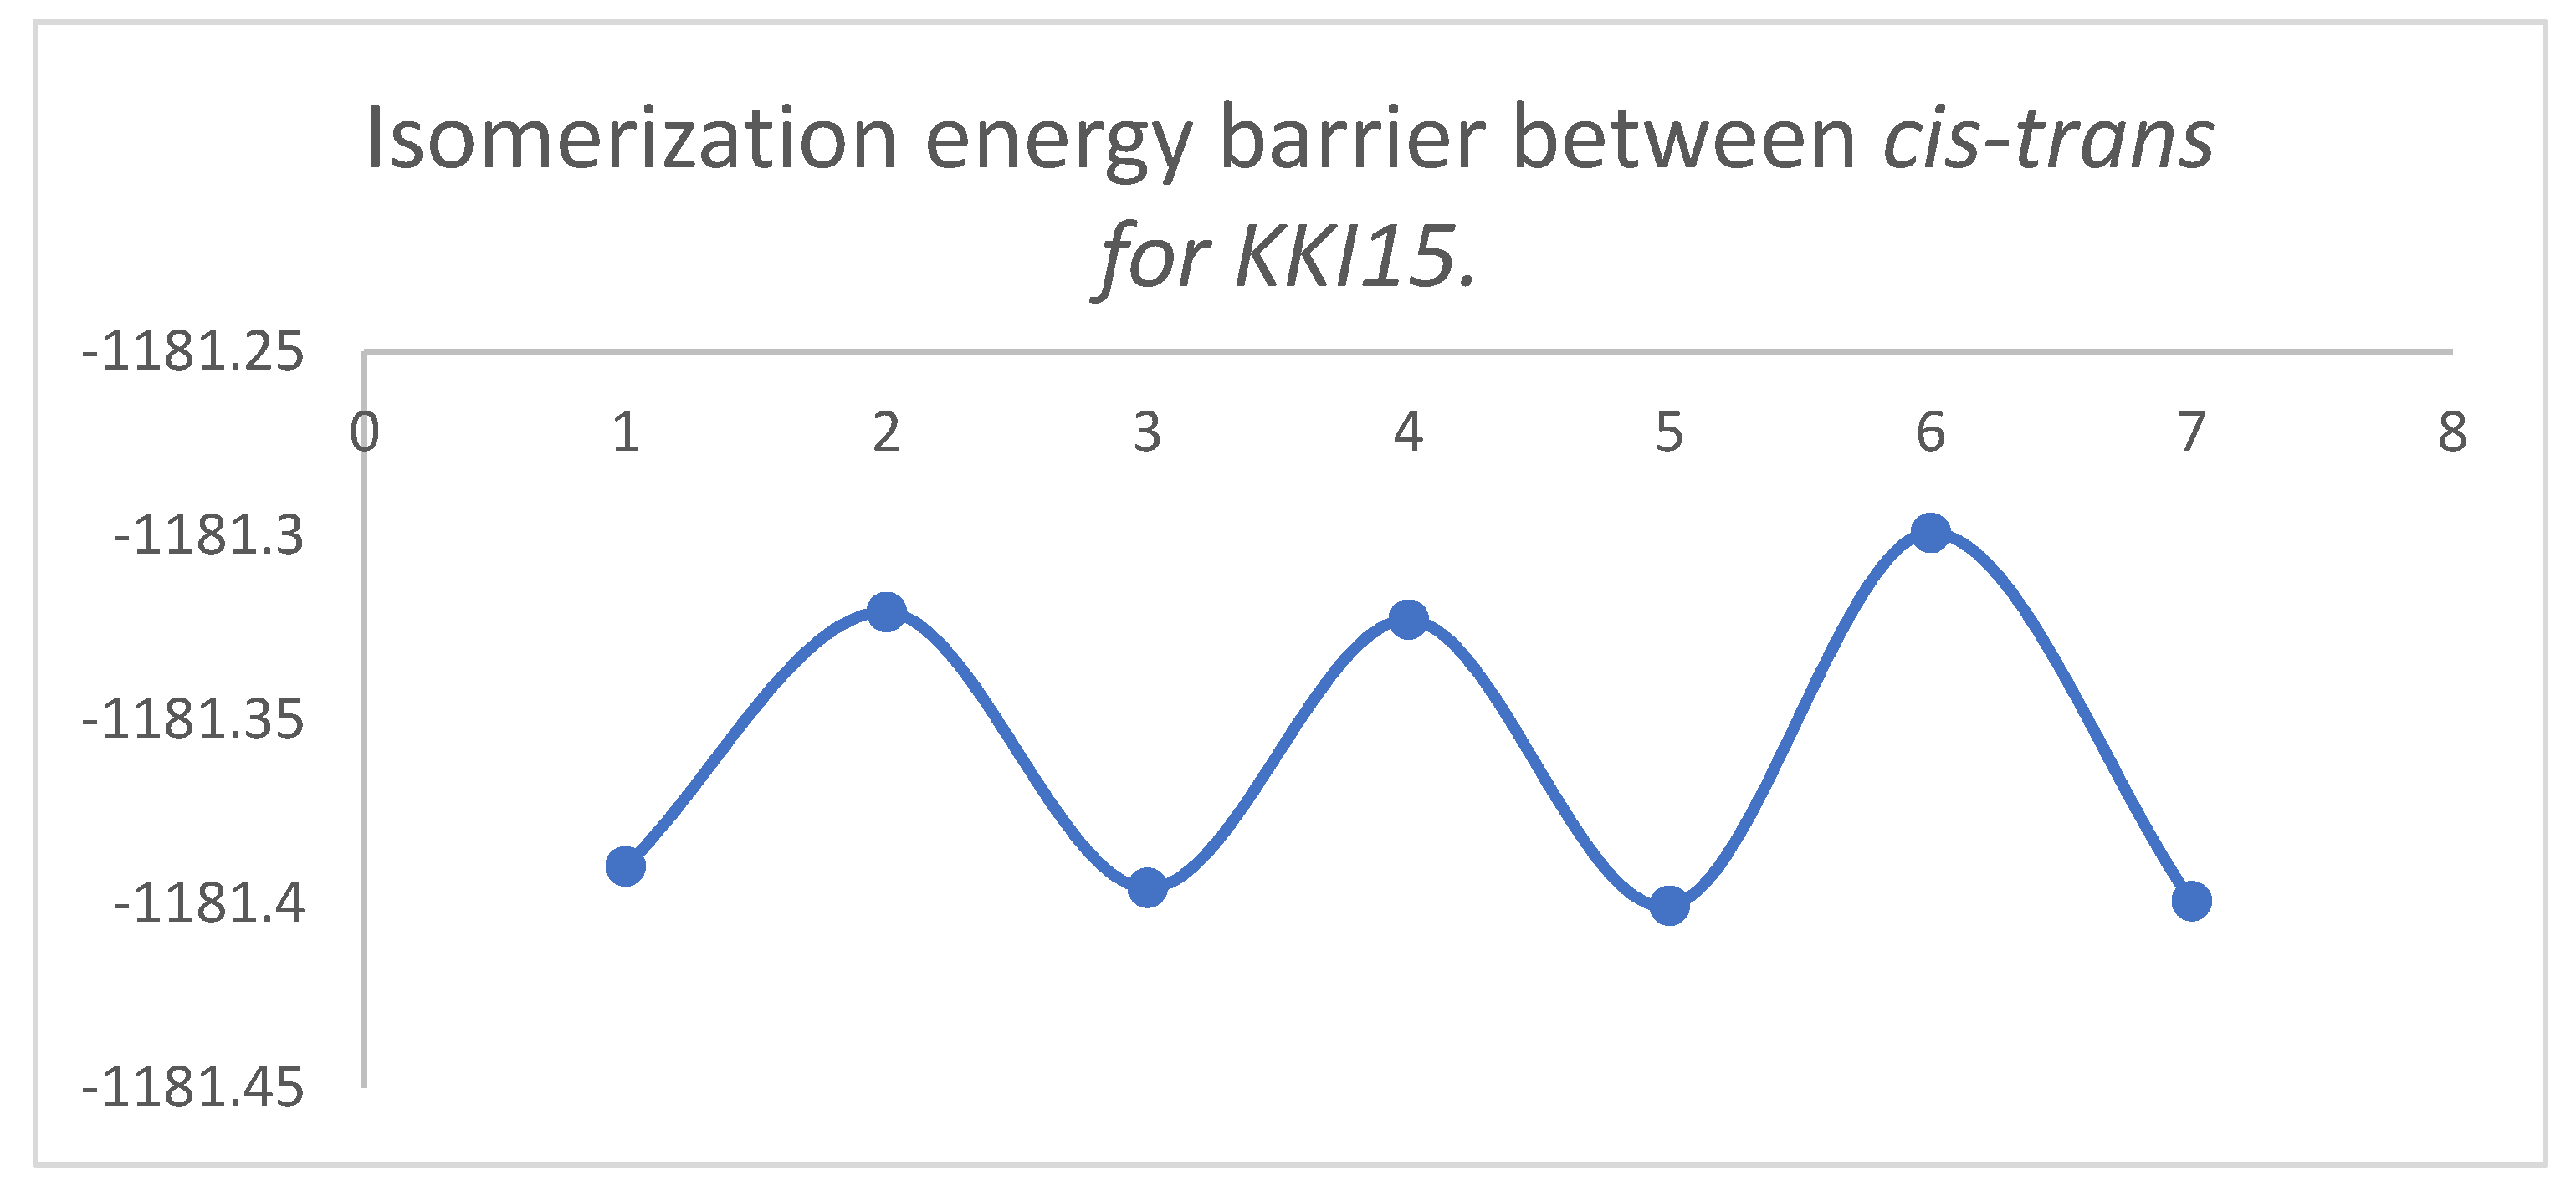
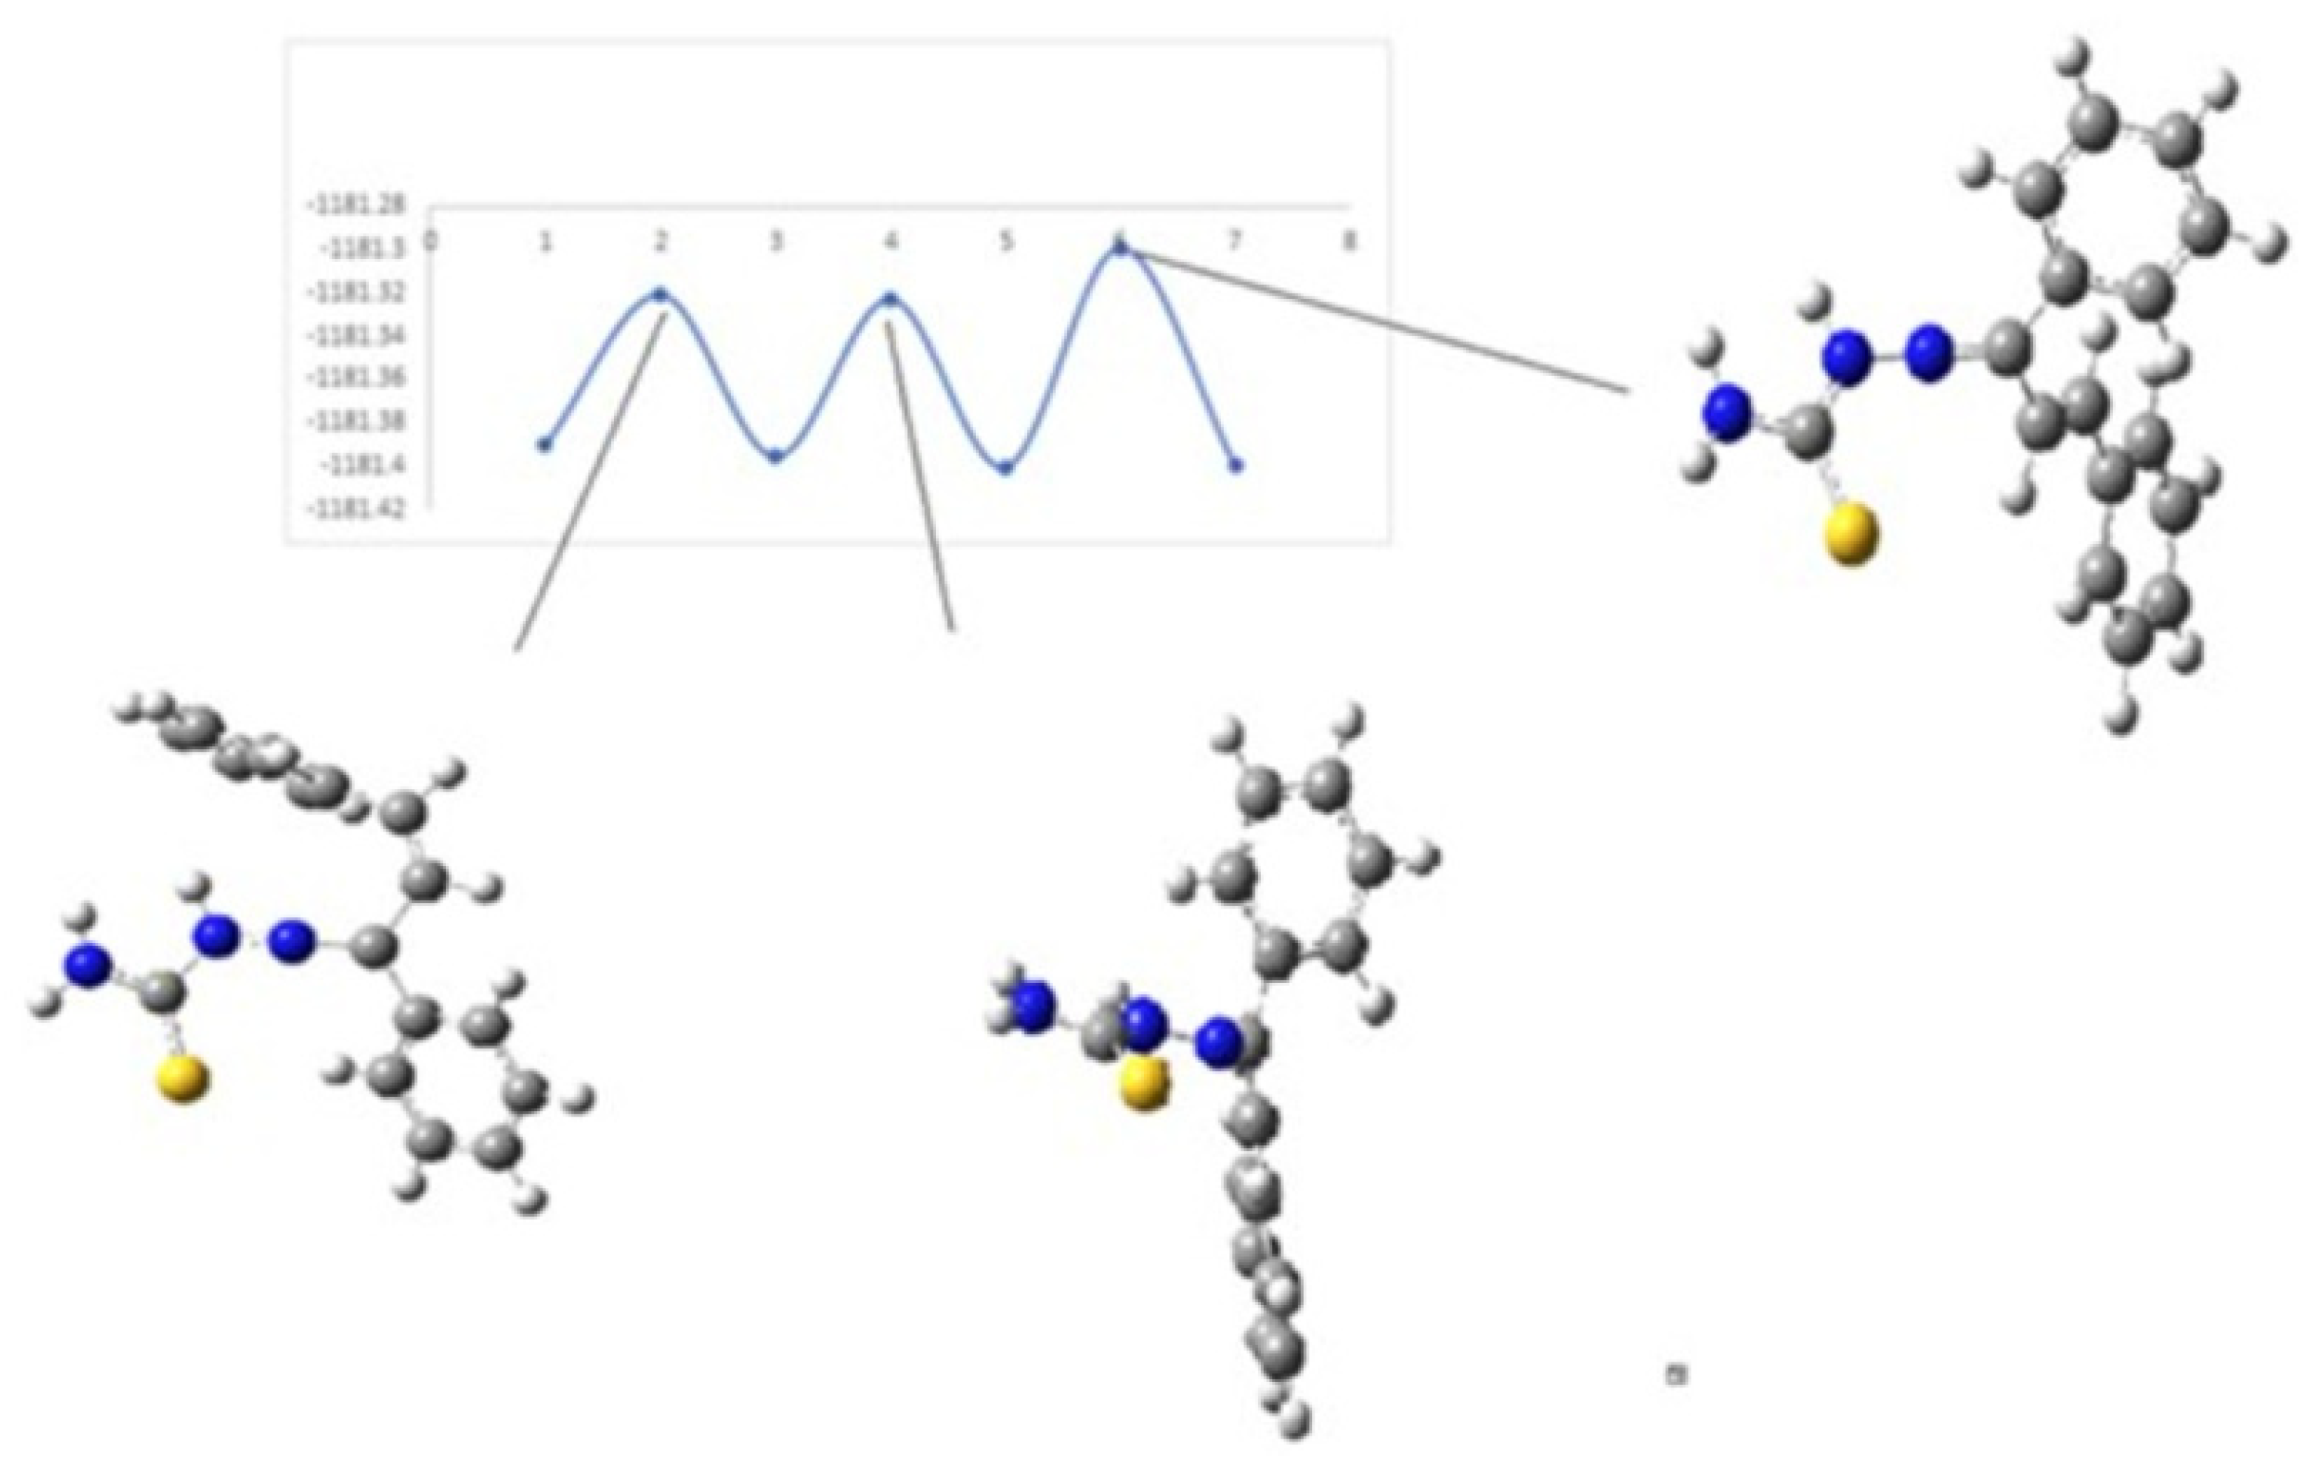
2.3. Energy of Transition States
In order to calculate the transition state structures, an initial conformation with dihedral angles τ
1 or τ
2 of 90° was used, which subsequently was geometry optimized. For the calculation, the geometries of the isomers were considered as implemented in the STQN methodology. The values of the energy of transition states for
KKI15 are shown in
Table 4.
Figure 8 and
Figure 9 show the diagrams for the
cis-trans isomerization energy barrier for compound
KKI15.
The values of the energy of transition states for
KKI18 are shown in
Table 5.
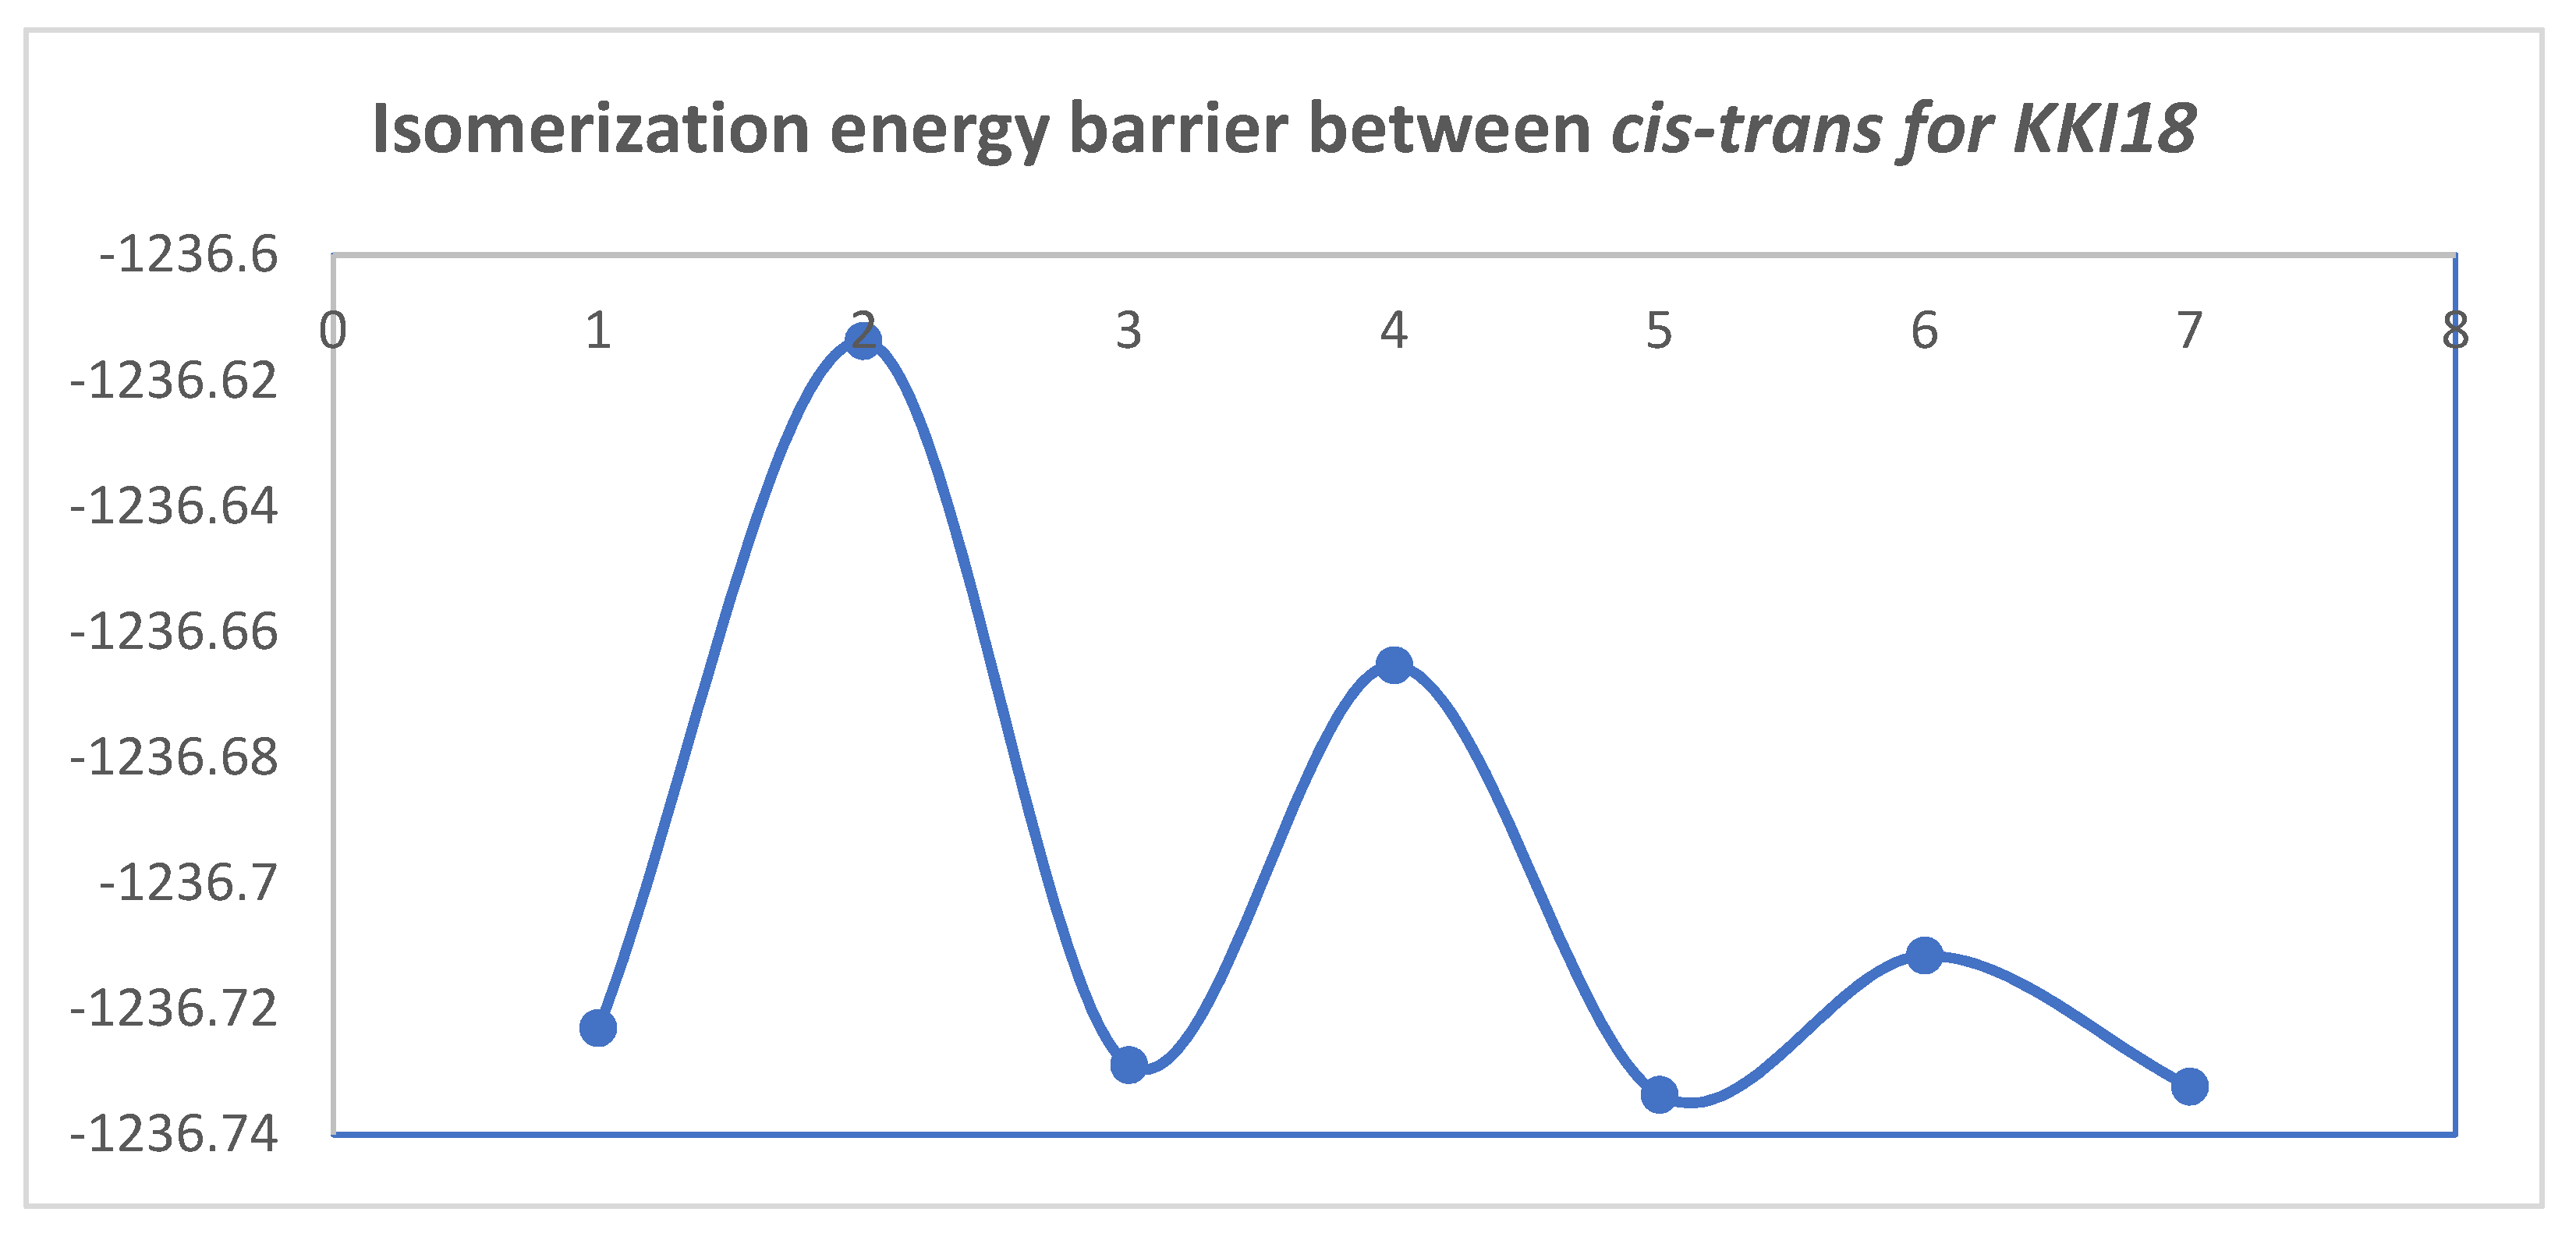
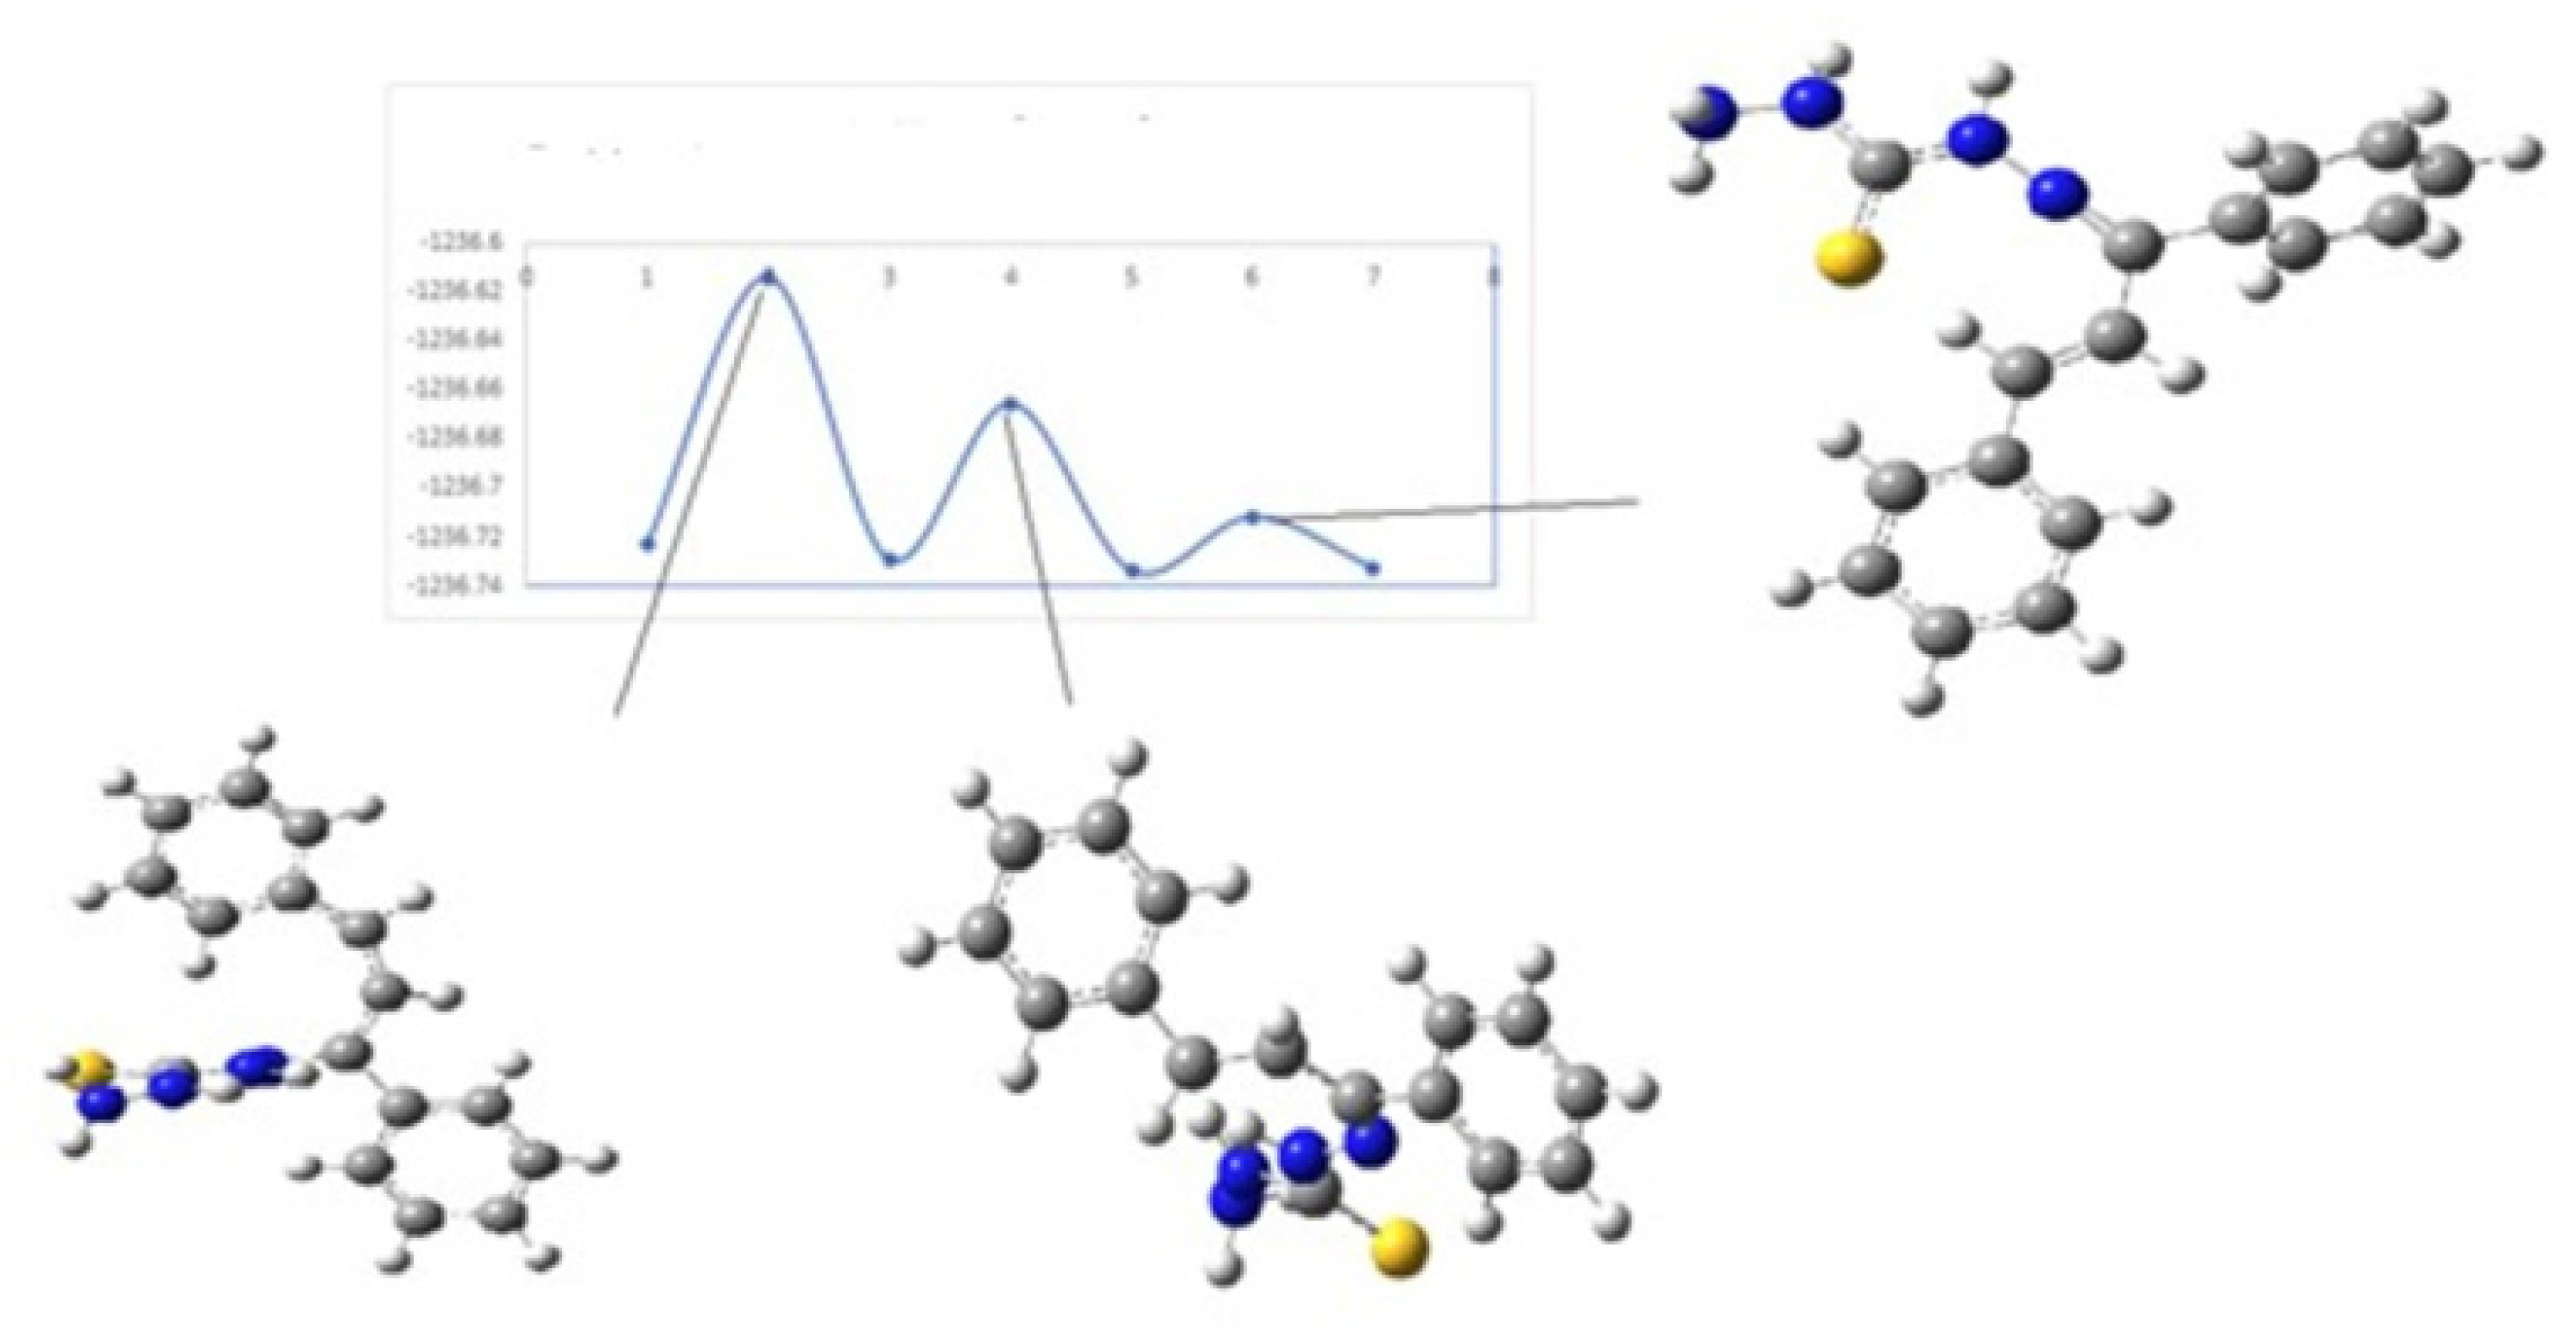
Figure 10 and
Figure 11 show the diagrams for the
cis-trans isomerization energy barrier for compound
KKI18.
The first two energy gaps for KKI15 have very high values (larger than 20 kcal/mol), and for this reason, these conformations are not observed in the NMR spectrum. On the contrary, for KKI18, the energy gap between MS5 and MS6 is less than 20 kcal/mol. This explains the experimental result of observing two conformations. Moreover, the stabilization of the transition states due to the explicit inclusion of the solvent has been evaluated. Specifically, the addition of a solvent molecule in the reaction path MS1→TS3→MS2 of KKI15 results in further stabilization of about 10 kcal/mol, and the energy gap was found to be 53.8 kcal/mol. For the remaining transition states structures, the explicit inclusion of the solvent does not further stabilize them.
2.4. Population Calculation
To make the identification of molecules easier, charge calculations were performed in double bond protons C6=C7 and C7=C8 for compounds
KKI15 and
KKI18, respectively. This will determine which carbon and proton are the most deshielded in the NMR spectrum. For the protons, the calculations showed similar charges. Specifically, CM5 showed a slightly increased positive charge for proton 7 than 6, while the NMO showed 6 to be more positive than 7. On carbons, CM5 showed a more positive charge on C7 by 0.01, while NBO and Mulliken showed carbon 6 to be more negative than 7 by 0.08 and 0.14, respectively. Due to such small differences, a firm conclusion cannot be derived. The charges of carbons range from 0.01 to 0.1, depending on the method. The detailed results are shown in the
Supporting Information (Supplementary Material Table S2A,B).
In the next step, molecular orbitals were calculated in each conformation. For both compounds, the HOMO molecular orbital is localized in the sulfocarbonyl group, and LOMO molecular orbital is localized in the sulfocarbonyl group and in the aromatic ring next to the double bond. The figures with the molecular orbitals are also shown in Supporting Information.
2.5. ECD Results
Absorption UV-Vis spectra of all conformers are given in SI. It was found that there are triplet excitations in the visible area only for KKI15, specifically in the region 625–750 nm. Absorption spectra of KKI18 conformers show no triplet excitation in the visible region. Finally, both compounds present intense single excitations in the UV region at about 230 nm.
2.6. Circular Dichroism (CD)
As it is observed from the CD spectra, in KKI15, there is a distinct difference between the two isomers; in contrast with KKI18, where this difference appears very small. That explains the computational results in which KKI18 was found to show a very low energy gap between the two conformations (See
Figures in SI).
2.7. Molecular Binding
SwissADME [
20] target was utilized to discover possible targets for the two molecules [
21]. Four targets were detected, and more specifically, 5DYW for Butyrylcholinesterase, 4EY7 for Acetylcholinesterase, 5UEN for Adenosine A1 receptor, and 1YK8 for Cathepsin K. In all these crystal files the macromolecule was crystallized with a target. Molecular docking [
22] has been applied for all targets. The grid parameters used were the same for all the substrates.: X = 40, Y = 40, Z = 40 (default) and the distance of the dots: 0.375 Å (default).
Then the coordinates from the co-crystallized ligand which were used for the active center of each macromolecule were: 5DYW [
23]: X = 14.209, Y = 26.367, Z = −41.477 4EY7 [
24]: X = −18,53, Y = −41.928, Z= 24.258, 5UEN [
25]: X = 52.632, Y = 56.381, Z = 141.281, 1ΥΚ8 [
26] X = 71.977, Y = 12.669, Z = 131.026
All docking scores are shown below in
Table 6.
Regarding the 5UEN macromolecule, the binding energy values are the same for both compounds (ΔG = −7.46 kcal/mol). Thus, they strongly bind to Adenosine A1 receptors. The same results apply to the macromolecular 5DYW. The binding energy is −7.75 kcal/mol for thiocarbohydrazone KKI18 and −8.24 kcal/mol for thiosemicarbazone KKI15. Thus, they strongly bind to butyrylcholinesterase.
Proceeding to the 4EY7 macromolecule, it was observed that both KKI15 and KKI18 bind strongly to acetylcholinesterase, with binding energy values of −8.6 and −9.08 kcal/mol, respectively.
In the latter macromolecule, the compounds do not bind strongly. Specifically, they gave values of −6.29 kcal/mol and −6.05 kcal/mol for KKI15 and KKI18, respectively.
The in silico experiments are shown below. The binding energy and the inhibition constants were calculated computationally via the Autodock program.
Following the above conclusions, a thiosemicarbazone (
test2) molecule and a thiocarbohdrazone (
test1) molecule carrying an electronegative substituent in both rings were designed using the ChemDraw platform to control the influence of electronegativity on both rings and to examine the additive effect. The results are shown in
Table 7 and
Table 8 below.
In summary, both classes of compounds provide a strong binding at the macromolecules 5UEN and 4EY7. That is, the addition of electronegative substituents to both rings can also lead to compounds that bind strongly to these enzymes but with no additional binding energy. With respect to the 5DYW enzyme, the compounds are almost non-binding, so the addition of electronegative substituents to both rings attenuates the binding to butyrylcholinesterase. This may be attributed to the size of the compounds. In the latter macromolecule, the compounds do not bind strongly; a similar result was observed obtained with KKI15 and KKI18 compounds. The interactions of the test1 compound with acetylcholinesterase differ from KKI15. It forms three hydrogen bonds with SER293 amino acid and two p-p interactions with aminoacid TRP286. Furthermore, test2 compound forms one hydrogen bond with aminoacidARG296 in contrast with KKI18 in that it does not form any bond with acetylcholinesterase. Secondly, in the adenosine A1 receptor, the test compounds form more interactions than KKI15 and KKI18. All in all, the additions of substituents in three of the four macromolecules do not affect the binding energy.
2.8. Results of the Pharmacokinetics and Toxicity Properties of the Two Compounds
Table 9 shows the Drug-Likeness Properties of
KKI15 and
KKI18. According to pkCSM and preADMET, thiosemicarbazone
KKI15 has a molecular weight < 500 g/mol, hydrogen bonding donors < 5, number of hydrogen bonding acceptors < 10, and lipophilicity less than five. As a result, it obeys Lipinski’s Rules of Five. Because lipophilicity is less than five, it can be easily absorbed from the body. Also, Veber’s Rule is qualified because the rotable bonds are less than seven. The same conclusions apply to thiocarbohydrazone
KKI18 (
Table 10).
According to preADMET, the BBB value is less than one. As a result, KKI15 is classified as inactive in Central Nervous System (CNS). In contrast, KKI18 has a BBB value of more than one, and it might affect the Central Nervous System (CNS). The value for Human intestinal absorption is high for both compounds, and this signifies that these compounds might be better absorbed from the intestinal tract on oral administration. Moreover, KKI18 was found to be an inhibitor of Pgp, and this means that it can increase oral bioavailability. According to pKCSM, both compounds might have the ability to penetrate the blood-brain barrier and thus be potential drugs for the Central Nervous System (CNS). Both compounds are not inhibitors of CP isoenzymes and therefore are not toxic or do not exert other unwanted adverse effects.
According to pKCSM,
KKI15 and
KKI18 have not been predicted to be hepatotoxic (
Table 11). Moreover, AMES toxicity is negative, and that means that the compounds are not mutagenic. Finally, they are inhibitors of Herg II and, according to preADMET, present a low risk for Herg II.
4. Conclusions
This study focuses on structure assignment and conformational analysis of thiosemicarbazone adduct KKI15 and thiocarbohydrazone KKI18 using a combination of NMR spectroscopy and computational studies (QM methods).
The conformational analysis showed that both molecules could obtain four configurations, but the most favorable is when the two double bonds adopt the E relationship. Through 2D-NOESY and DFT, the conformations that are most probably to agree are MS1 and MS2 for KKI15 and MS5 and MS6 for KKI18. The calculation of transition proves that the molecules obtain these two conformations.
In silico experiments were performed with four macromolecules to find some possible biological targets. The results showed that the compounds bind strongly to acetylcholinesterase, butyrylcholinesterase, and adenosine A1 receptors. In cathepsin K, they bind weakly. Both derivatives are not hepatoxic, and they obey Lipinski’s Rule of Five.
It appears that both molecules can be safe and bioactive, and putative for biological targets. This is very useful to synthetic chemists who wish to investigate new structures for various targets. The ultimate goal is through in silico molecular modeling screening to synthesize molecules that act selectively on certain biological targets.


 ,
, 


