Article

Screening and Structure–Activity Relationship of D2AAK1 Derivatives for Potential Application in the Treatment of Neurodegenerative Diseases

by
Oliwia Koszła
1,*,
Przemysław Sołek
2,
Piotr Stępnicki
1 and
Agnieszka A. Kaczor
1,3,*
1
Department of Synthesis and Chemical Technology of Pharmaceutical Substances with Computer Modeling Laboratory, Faculty of Pharmacy, Medical University of Lublin, 4 A Chodzki St., 20-093 Lublin, Poland
2
Department of Biotechnology, Institute of Biology and Biotechnology, University of Rzeszow, 1 Pigonia St., 35-310 Rzeszow, Poland
3
School of Pharmacy, University of Eastern Finland, Yliopistonranta 1, P.O. Box 1627, FI-70211 Kuopio, Finland
*
Authors to whom correspondence should be addressed.
Molecules 2022, 27(7), 2239; https://doi.org/10.3390/molecules27072239
Submission received: 2 March 2022 / Revised: 25 March 2022 / Accepted: 28 March 2022 / Published: 30 March 2022

Abstract

:
Neurodegenerative and mental diseases are serious medical, economic and social problems. Neurodegeneration is referred to as a pathological condition associated with damage to nerve cells leading to their death. Treatment of neurodegenerative diseases is at present symptomatic only, and novel drugs are urgently needed which would be able to stop disease progression. We performed screening of reactive oxygen species, reactive nitrogen species, glutathione and level intracellular Ca2+. The studies were assessed using one-way ANOVA of variance with Dunnett’s post hoc test. Previously, we reported D2AAK1 as a promising compound for the treatment of neurodegenerative and mental disorders. Here, we show a screening of D2AAK1 derivatives aimed at the selection of the compound with the most favorable pharmacological profile. Selected compounds cause an increase in the proliferation of a hippocampal neuron-like cell line, changes in the levels of reactive oxygen and nitrogen forms, reduced glutathione and a reduced intracellular calcium pool. Upon analyzing the structure–activity relationship, we selected the compound with the most favorable profile for a neuroprotective activity for potential application in the treatment of neurodegenerative diseases.

1. Introduction

Neurodegenerative and mental diseases affect millions of people worldwide. They are one of the most common causes of human inability to function in everyday life, with a direct impact at the professional or social level of patients [1]. Neurodegeneration is progressive and is characterized by the loss of neurons and impaired motor and cognitive functions. Consequently, the functional and structural damage to neurons may result in cell death [2]. To date, there are no effective therapeutic methods that would eliminate or alleviate the factors causing the progression of neurodegenerative diseases [3]. For this reason, the development of effective therapies constitutes the global neuroscience research challenge [1]. The pharmaceuticals used so far are characterized by moderate effectiveness; therefore, the development and synthesis of new compounds with potential neuroprotective properties is urgently needed [4,5]. Current screening methodologies in novel drug discovery are performed to select compounds with the most desirable properties. Common high throughput screening assays provide data about potential cytotoxicity, genotoxicity and antiproliferative properties [6]. In turn, our previous studies showed that the D2AAK1 compound displays antipsychotic, anxiolytic and procognitive effects in respective animal models. This compound has been identified in structure-based virtual screening as a multi-target ligand of aminergic G protein-coupled receptors (GPCRs) [7]. Moreover, the compound is characterized by neuroprotective properties as well as stimulation of neuron growth and survival [8,9]. This important finding suggests its potential application in the treatment of neurodegenerative and mental disorders.
Here, we screened D2AAK1 derivatives 120 (Figure 1) [10] for the selection of the most optimal pharmacological profile of compounds as new pharmaceutical substances for the treatment of neurodegenerative diseases. We observed that the compounds cause the increase in hippocampal neurons’ proliferation rate, changes in the level of reactive oxygen species (ROS), reactive nitrogen species (RNS), or the non-enzymatic cell protection mechanism (reduced glutathione—GSH) and depleted intracellular calcium pool. Upon analyzing the structure–activity relationship of D2AAK1 and its derivatives, it may be concluded which compounds from among all implemented structural features are the most favorable for neuroprotective activity.

2. Results and Discussion

The main cause of neurodegenerative diseases is the death of nerve cells. This phenomenon is mainly initiated by oxidative and nitrosative stress. The consequences of a redox imbalance can be highly destructive and include DNA damage and protein or lipid degradation, which inevitably leads to cell death. Moreover, ROS and RNS can activate interacting mechanisms including disturbance of intracellular calcium levels (Ca2+) [11]. Therefore, the screening of compounds 120 (Figure 1) included such assays as cell viability, levels of reactive oxygen and nitrogen species, reduced glutathione and reduced intracellular calcium.
Previously, we provided evidence of the unique properties of the lead structure D2AAK1 in terms of neuronal growth stimulation and cell survival promotion. The events observed were related to the up-regulation of neurotrophic factors, CAMKI kinase and mechanisms related to cell proliferation confirmed by BrdU incorporation into newly synthesized DNA [8]. Moreover, D2AAK1 showed antioxidant properties, decreased the levels of ROS and RNS and prevented excitotoxicity by decreasing intracellular calcium and NMDA levels. The lead structure shows neuroprotective properties thanks to protection of nerve cells against DNA damage and high temperature, not disturbing the cell cycle profile at the same time [9].
In the case of screening related to cell viability and their proliferation in all sets tested, we observed a dose-dependent decrease in the cell metabolic activity. In detail, the highest proliferation rate was observed in the compounds possessing furanylmethyl substituents linked to the tetrahydropyridine moiety (Figure 2A, compounds 14). Among this group and in general, in all sets tested, the highest metabolic activity occurred in the derivative with a methoxy substituent at the C5 position (Figure 2A, compound 2) of the indole (***, p < 0.001). This activity lowered with the increasing size of alkoxy groups (Figure 2A, compounds 34), although the lowest activity was interestingly shown by the compound with no substituent in this position (Figure 2A, compound 1) (**, p < 0.01). Contrary to thiophenylmethyl moiety, the compound with an unsubstituted indole (Figure 2, compound 5) exhibited the highest proliferation rate (***, p < 0.001). The alkoxy group installed (Figure 2A, compounds 68) led to decreasing metabolic activity with a similar tendency to furanylmethyl fragment, namely, the bigger the substituent, the lower the activity. Among the derivatives with benzyl groups (Figure 2A,B, compounds 912) at the tetrahydropyridine fragment, again those with small alkoxy substituents (Figure 2A, compound 10) (***, p < 0.001) or with no substituent (Figure 2A, compound 9) (***, p < 0.001) at the C5 position of the indole showed the highest proliferation while implementing bigger (ethoxy or isopropoxy) groups (Figure 2B, compounds 1112) caused decreases in cell metabolic activity. Applying the 4-methoxy group to the benzyl substituent (Figure 2B, compounds 1316) does not significantly change the tendencies in affecting metabolic activity. Derivatives with a 3-methoxybenzyl substituent (Figure 2B, compounds 1720) showed the lowest proliferation rate among other substitution options at the tetrahydropyridine moiety. Nonetheless, the trend remained the same—with the increasing bulkiness of the alkoxy substituent at the C5 indole (Figure 2B, compounds 1920), the metabolic activity decreased.
The most favorable for enhancing the proliferation seems to be the compounds with methoxy substituents at the C5 position of the indole (Figure 2A,B, compounds 2, 6, 10, 14 and 18). With the increasing size of this moiety, the cell metabolic activity decreased. Considering different chemical groups attached to the tetrahydropyridine fragment, smaller, 5-membered ring substituents (Figure 2A, compounds 18) are more beneficial than 6-membered rings (Figure 2A,B, compounds 920). As it was already emphasized, ethoxy and isopropoxy groups (Figure 2A,B, compounds 34, 78, 1112, 1516 and 1920) are unlikely to enhance proliferation rates. Furthermore, compounds with these substituents exhibit toxicity at higher concentrations, with a more pronounced effect within derivatives possessing bigger, 6-membered rings (Figure 2A,B, compounds 920) at the tetrahydropyridine, rather than 5-membered ring groups (Figure 2A, compounds 18).
Based on the MTT assay, single concentrations of compounds that increase the HT-22 cells metabolic activity were selected for all further studies (marked with a red frame) (Figure 2A,B).
The available literature’s data indicate that antipsychotic drugs improve the survival of nerve cells and support their division [12,13]. Increasing the proliferation of neurons and creating new neural connections is a key point in the treatment of neurodegenerative and mental diseases [2]. Upon analyzing the structure–proliferation relationship of the tested compounds, it can be clearly stated that the lead structure of D2AAK1 causes the highest increase in proliferation [8] compared to its derivatives. The increase in proliferation can be induced as a result of the activation of mechanisms related to the hormesis effect. Hormesis describes dose-response relationships often characterized by stimulation of proliferation by low dose [14]. However, the cell is characterized by the presence of various protective mechanisms. In fact, their action determines cell survival or death. One of the cell death pathway indicators is an increase in the intracellular calcium pool [15], but the function of calcium is not limited to cell death only. Calcium release plays an important role in the control of neurite growth, synaptic plasticity, secretion and neurodegeneration [16]. Additionally, for neurons, levels of calcium are crucial due to its participation in the transmission of depolarizing signals and synaptic activity [17].
Here tested compounds did not alter the levels of intracellular calcium. The only derivatives that cause statistically significant changes are the ones with isopropyl groups at the C5 indole and 3-methoxy or 4-methoxybenzyl substituents at the tetrahydropyridine fragment (Figure 3, compounds 16, p = 0.0486; 20, p = 0.0295). In other cases, the results were at the control level or slightly below; however, they were not statistically significant (Figure 3).
The interaction between calcium level and nitric oxide (NO) in nerve cells has many physiological as well as pathophysiological aspects. Nitric oxide is also considered to be an important effector of calcium accumulation through the potential-dependent Ca2+ mitochondrial channel. Overall, mitochondria are central in the pathogenesis of neurodegenerative diseases due to ROS overproduction or specifically impaired Ca2+-buffering capacity [18,19]. In turn, excessive increase in cytosolic Ca2+ concentration can result in redox imbalance and impaired mitochondrial function and cellular bioenergetics. Most importantly, calcium level dysregulation or mitochondrial impairment may also contribute to aberrant protein folding [17,20]. Thus, in neurodegenerative processes, the ability of neurons to maintain adequate energy levels or redox balance is an extremely important aspect.
In our research, we noted compound-induced accumulation of intracellular nitric oxide (NO). In detail, we observed a statistically significant increase in NO production in all experimental sets (***, p < 0.001—compounds 1, 311 and 1320; ***, p = 0.0005—compound 2; ***, p = 0.0006—compound 12). The highest increase in nitric oxide compared to the control group occurs within the derivatives with bigger substituents at both positions, namely, 3-methoxy and 4-methoxybenzyl, and ethoxy and isopropoxy groups (Figure 4, compounds 1516 and 1920). In contrast, the compounds with furanylmethyl fragments (Figure 4, compounds 14) generally were characterized by the lowest impact on the elevation of NO; however, this was still at the significance level. In the case of thiophenylmethyl derivatives, the highest NO was observed in the compound with a methoxy group (Figure 4, compound 6), while in benzyl derivatives, with no substituted indole (Figure 4, compound 9).
The NO overproduction we observed is probably directly related to low Ca2+ levels. RNS overproduction has been linked with functionally active neurons, increased metabolic activity and cellular plasticity, including neuronal differentiation and neurite outgrowth. Moreover, high RNS levels can influence calcium release and activate signaling cascades directly related to synaptic plasticity. There is, however, a critical limit to the ROS/RNS pool in a cell, which triggers cell senescence and apoptosis. Overproduction can also result in dramatic and long-term changes in cellular excitability and neuronal activity via the calcium-dependent pathway [21,22].
In addition to RNS, ROS are also necessary for the regulation of physiological cell functions through redox signaling. Here, we observed that compounds tested slightly affect the levels of ROS linked with redox homeostasis. In detail, we noted a significant increase in ROS overproduction only in selected experimental sets. Furanylmethyl derivatives (Figure 5, compounds 14) seem to be the most favorable when it comes to affecting the level of reactive oxygen species, causing a slight decrease or no changes (ns, p > 0.05). Within them, only the compound with an isopropoxy group at the C5 position of the indole (Figure 5, compound 4) showed a minor increase in ROS level; however, the result was not statistically significant (ns, p > 0.05). The highest statistically significant increase in the level of ROS was observed in the benzyl compound with an ethoxy group at the indole moiety (Figure 5, ***, p < 0.0001—compound 11). The general tendency among all compounds is that a lack of substituent or installation of a small group at the C5 indole (Figure 5, compounds 1, 2, 5, 6, 9, 10, 13, 14, 17, 18) is more beneficial than the presence of a bigger alkoxy fragment (Figure 5, compounds 3, 4, 7, 8, 11, 12, 15, 16, 19 and 20).
In our study, the ROS level reflected values close to the control (with some exceptions). This may indicate that, in this case, ROS play secondary messenger functions in cell signaling and are essential for various physiological processes. Our research also confirms the general non-cytotoxicity of the tested compounds depending on the structure. ROS levels are often altered by the action of various substances. Recently, ROS have been mainly considered as undesirable oxidative stress-related effects. It turns out, however, that they play an important role as transmitters in redox signaling under normal physiological conditions. Research confirms that ROS accumulation causes damage to various cellular components [23].
ROS/RNS levels are controlled by intracellular enzymatic and non-enzymatic mechanisms. Here, we observed that compounds tested maintain cellular redox homeostasis by glutathione activation. The cytosolic redox state was possibly compensated by intracellular GSH radical scavenging activity [24]. Considering substituents at the tetrahydropyridine moiety, the biggest decrease in the level of glutathione was caused by compounds possessing the thiophenylmethyl group (Figure 6, ***, p = 0.0001—compound 5; **, p = 0.0027—compound 6; ***, p < 0.0001—compounds 7, 8), while the lowest decrease was found for derivatives with a benzyl group (Figure 6, compounds 912). Installing 3- or 4-methoxy fragments to the benzyl group (Figure 6, compounds 1320) generally leads to the drop of glutathione level. In the case of substitution at the C5 position of the indole, the biggest impact on lowering GSH level was noticed predominantly in isopropoxy compounds (Figure 6, compounds 4, 8, 12, 16 and 20). However, interestingly, within 4-methoxyphenyl derivatives, the compound with an isopropoxy group (Figure 6, compound 16) showed the lowest decrease in GSH.
It is quite clear that GSH function is not limited to defense against free radicals. One of the most important is the involvement of key transcription factors in redox signaling and the detoxification of many exogenous compounds [25].
In conclusion, the depletion of the GSH pool could possibly be due to involvement in RNS/ROS detoxification [26]. However, the mechanism by which RNS/ROS initiate cell signaling may differ. The evidence presented here and in the literature shows that cellular levels of free radicals are strongly associated with the regulation of antioxidant levels in cells. Moreover, previous studies have shown that compounds 5, 9 and 17 are dopamine D2 receptor antagonists [10]. Wei Y et al. demonstrated that the astrocyte dopaminergic receptor D2 regulates GSH synthesis [27]. The presented evidence shows that D2 receptor activity may also influence the regulation of GSH levels.

3. Materials and Methods

3.1. Hippocampal Neuronal Cell Line

Mouse hippocampal cell line (HT-22) (Cat# SCC129, RRID: CVCL_0321, Merck; Kenilworth, NJ, USA) was maintained according to the manufacturer’s recommended medium DMEM (Corning, NY, USA), supplemented with 10% fetal bovine serum (FBS, Gibco; Carlsbad, CA, USA) and antibiotic mix solution (100 U/mL penicillin, 0.1 mg/mL streptomycin) (Thermo Fisher Scientific; Waltham, MA, USA). Cells were grown under standard conditions (37 °C with 5% CO2 flow and 95% air humidity (New Brunswick Galaxy 170 R, Thermo Fisher Scientific; Waltham, MA, USA). For assays, cells were seeded at a constant density of 3.0 × 10³ cells/cm2.

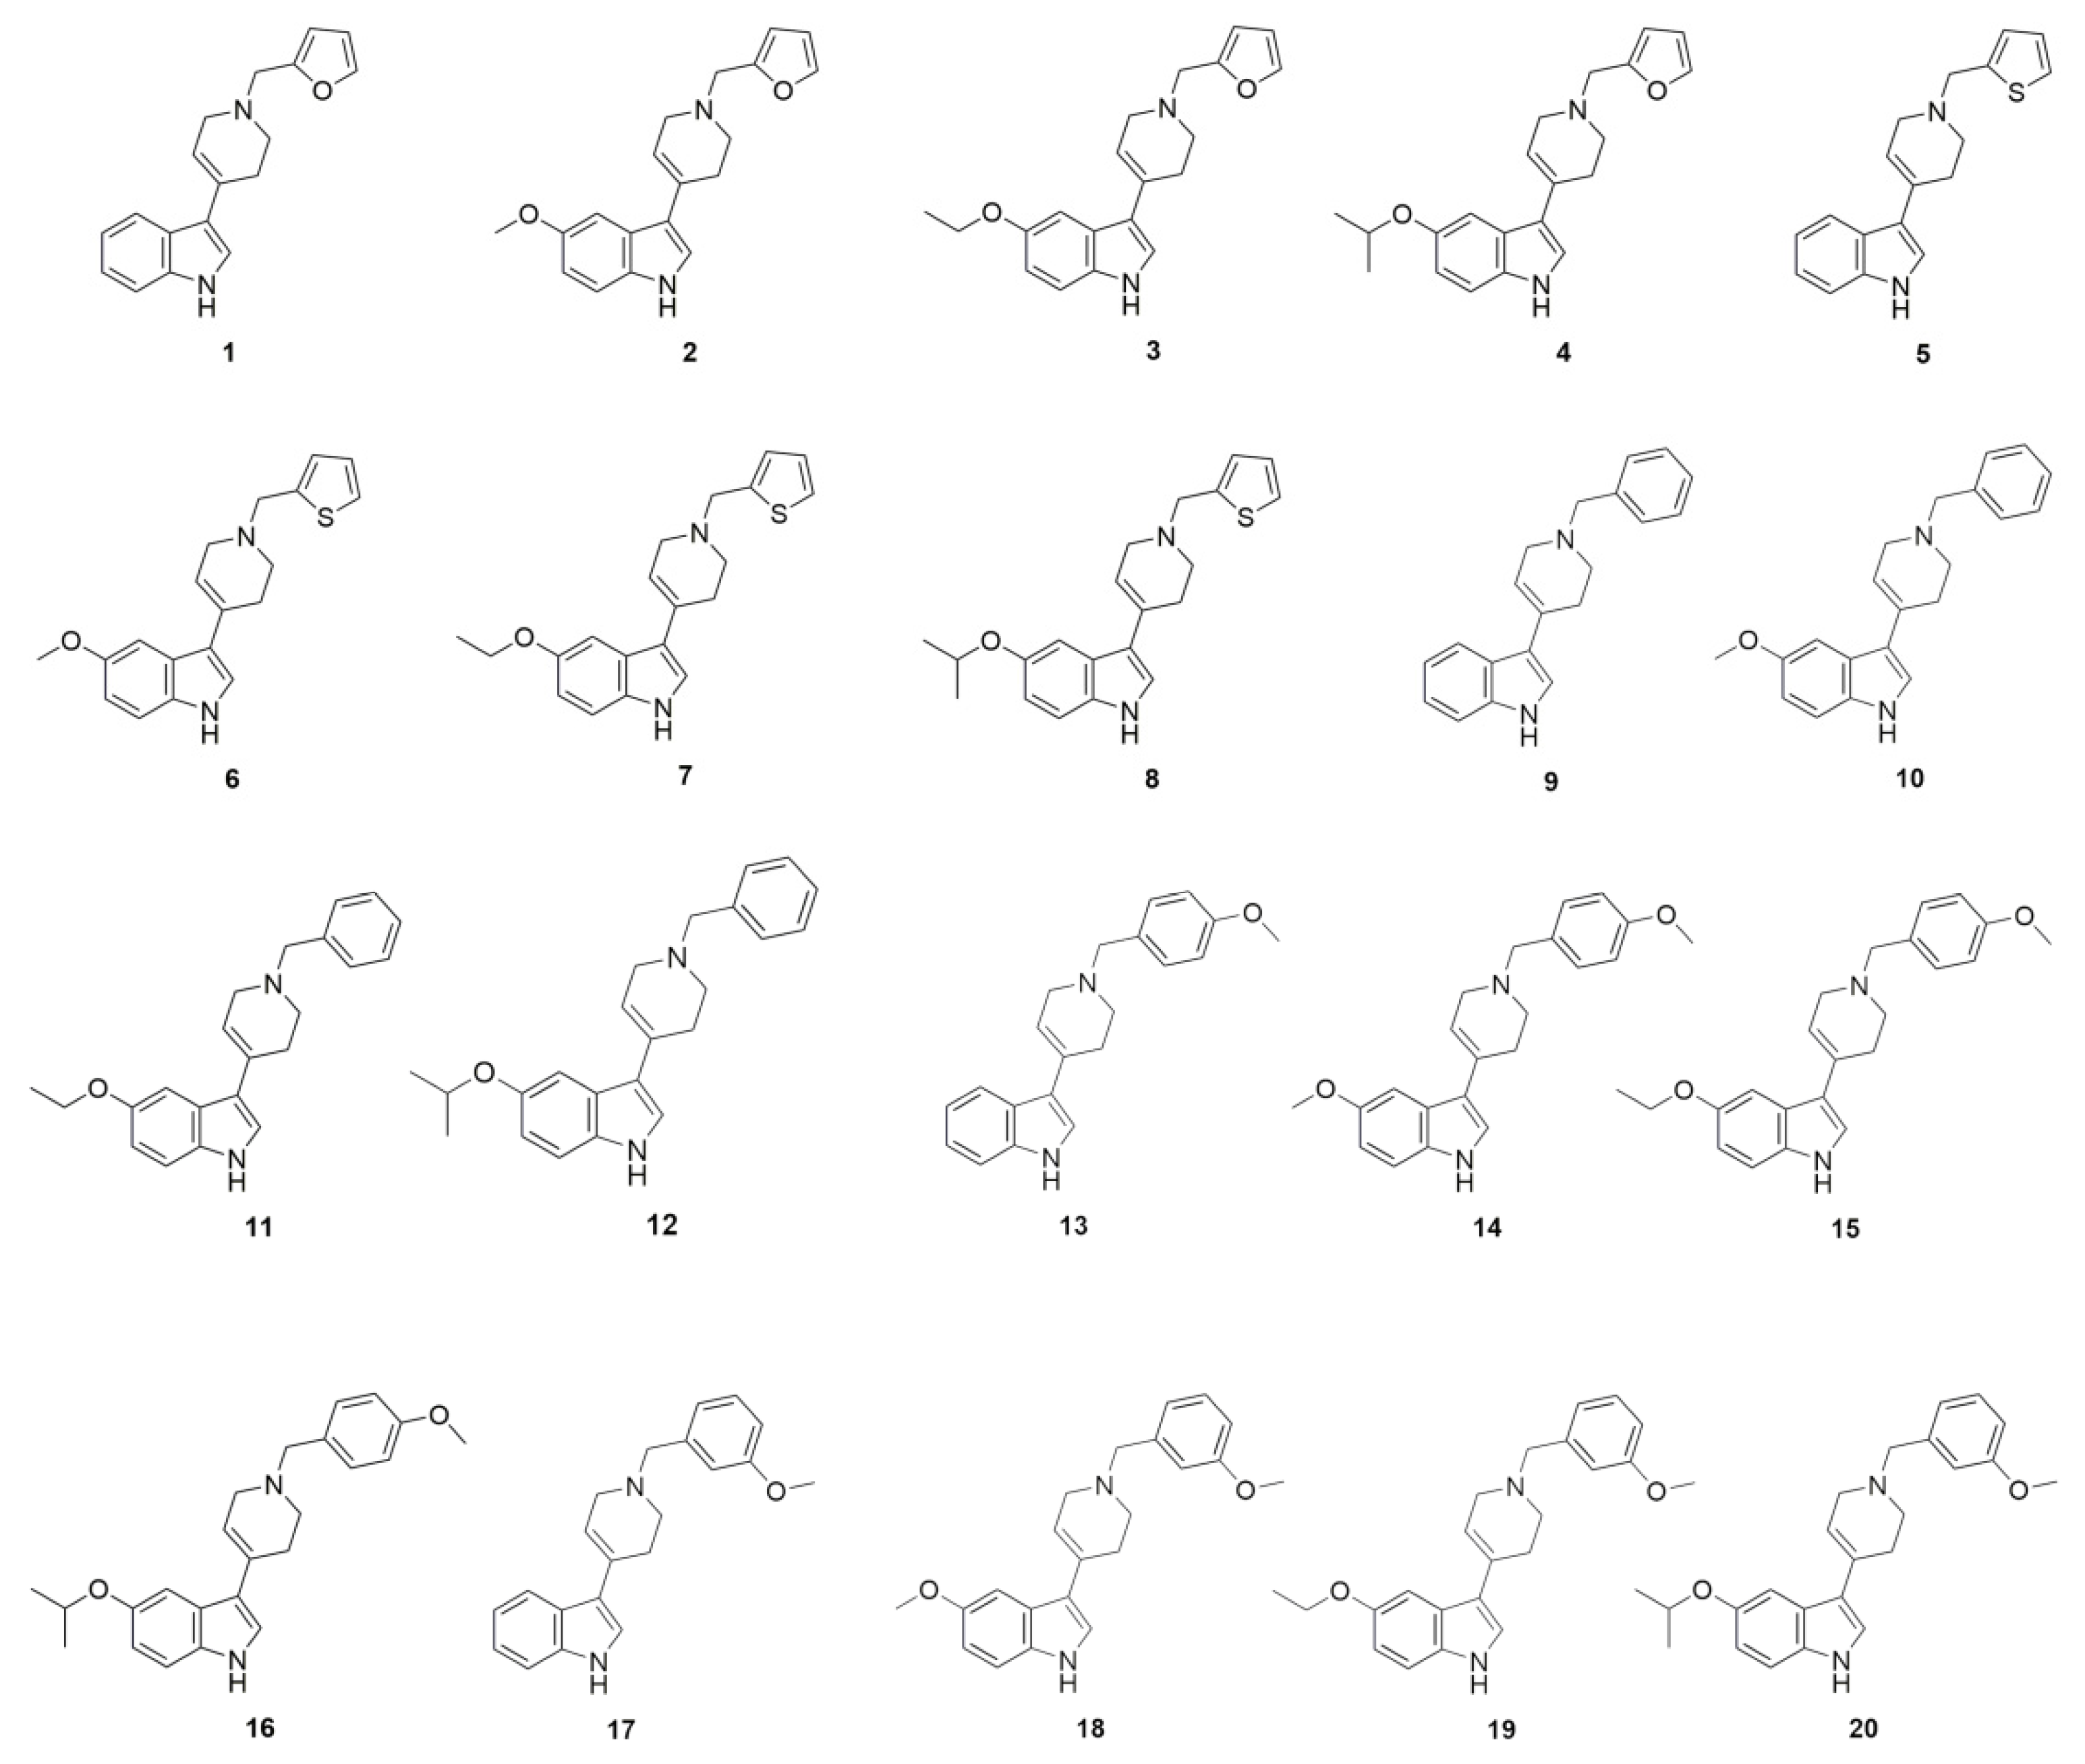
3.2. D2AAK1 Derivatives
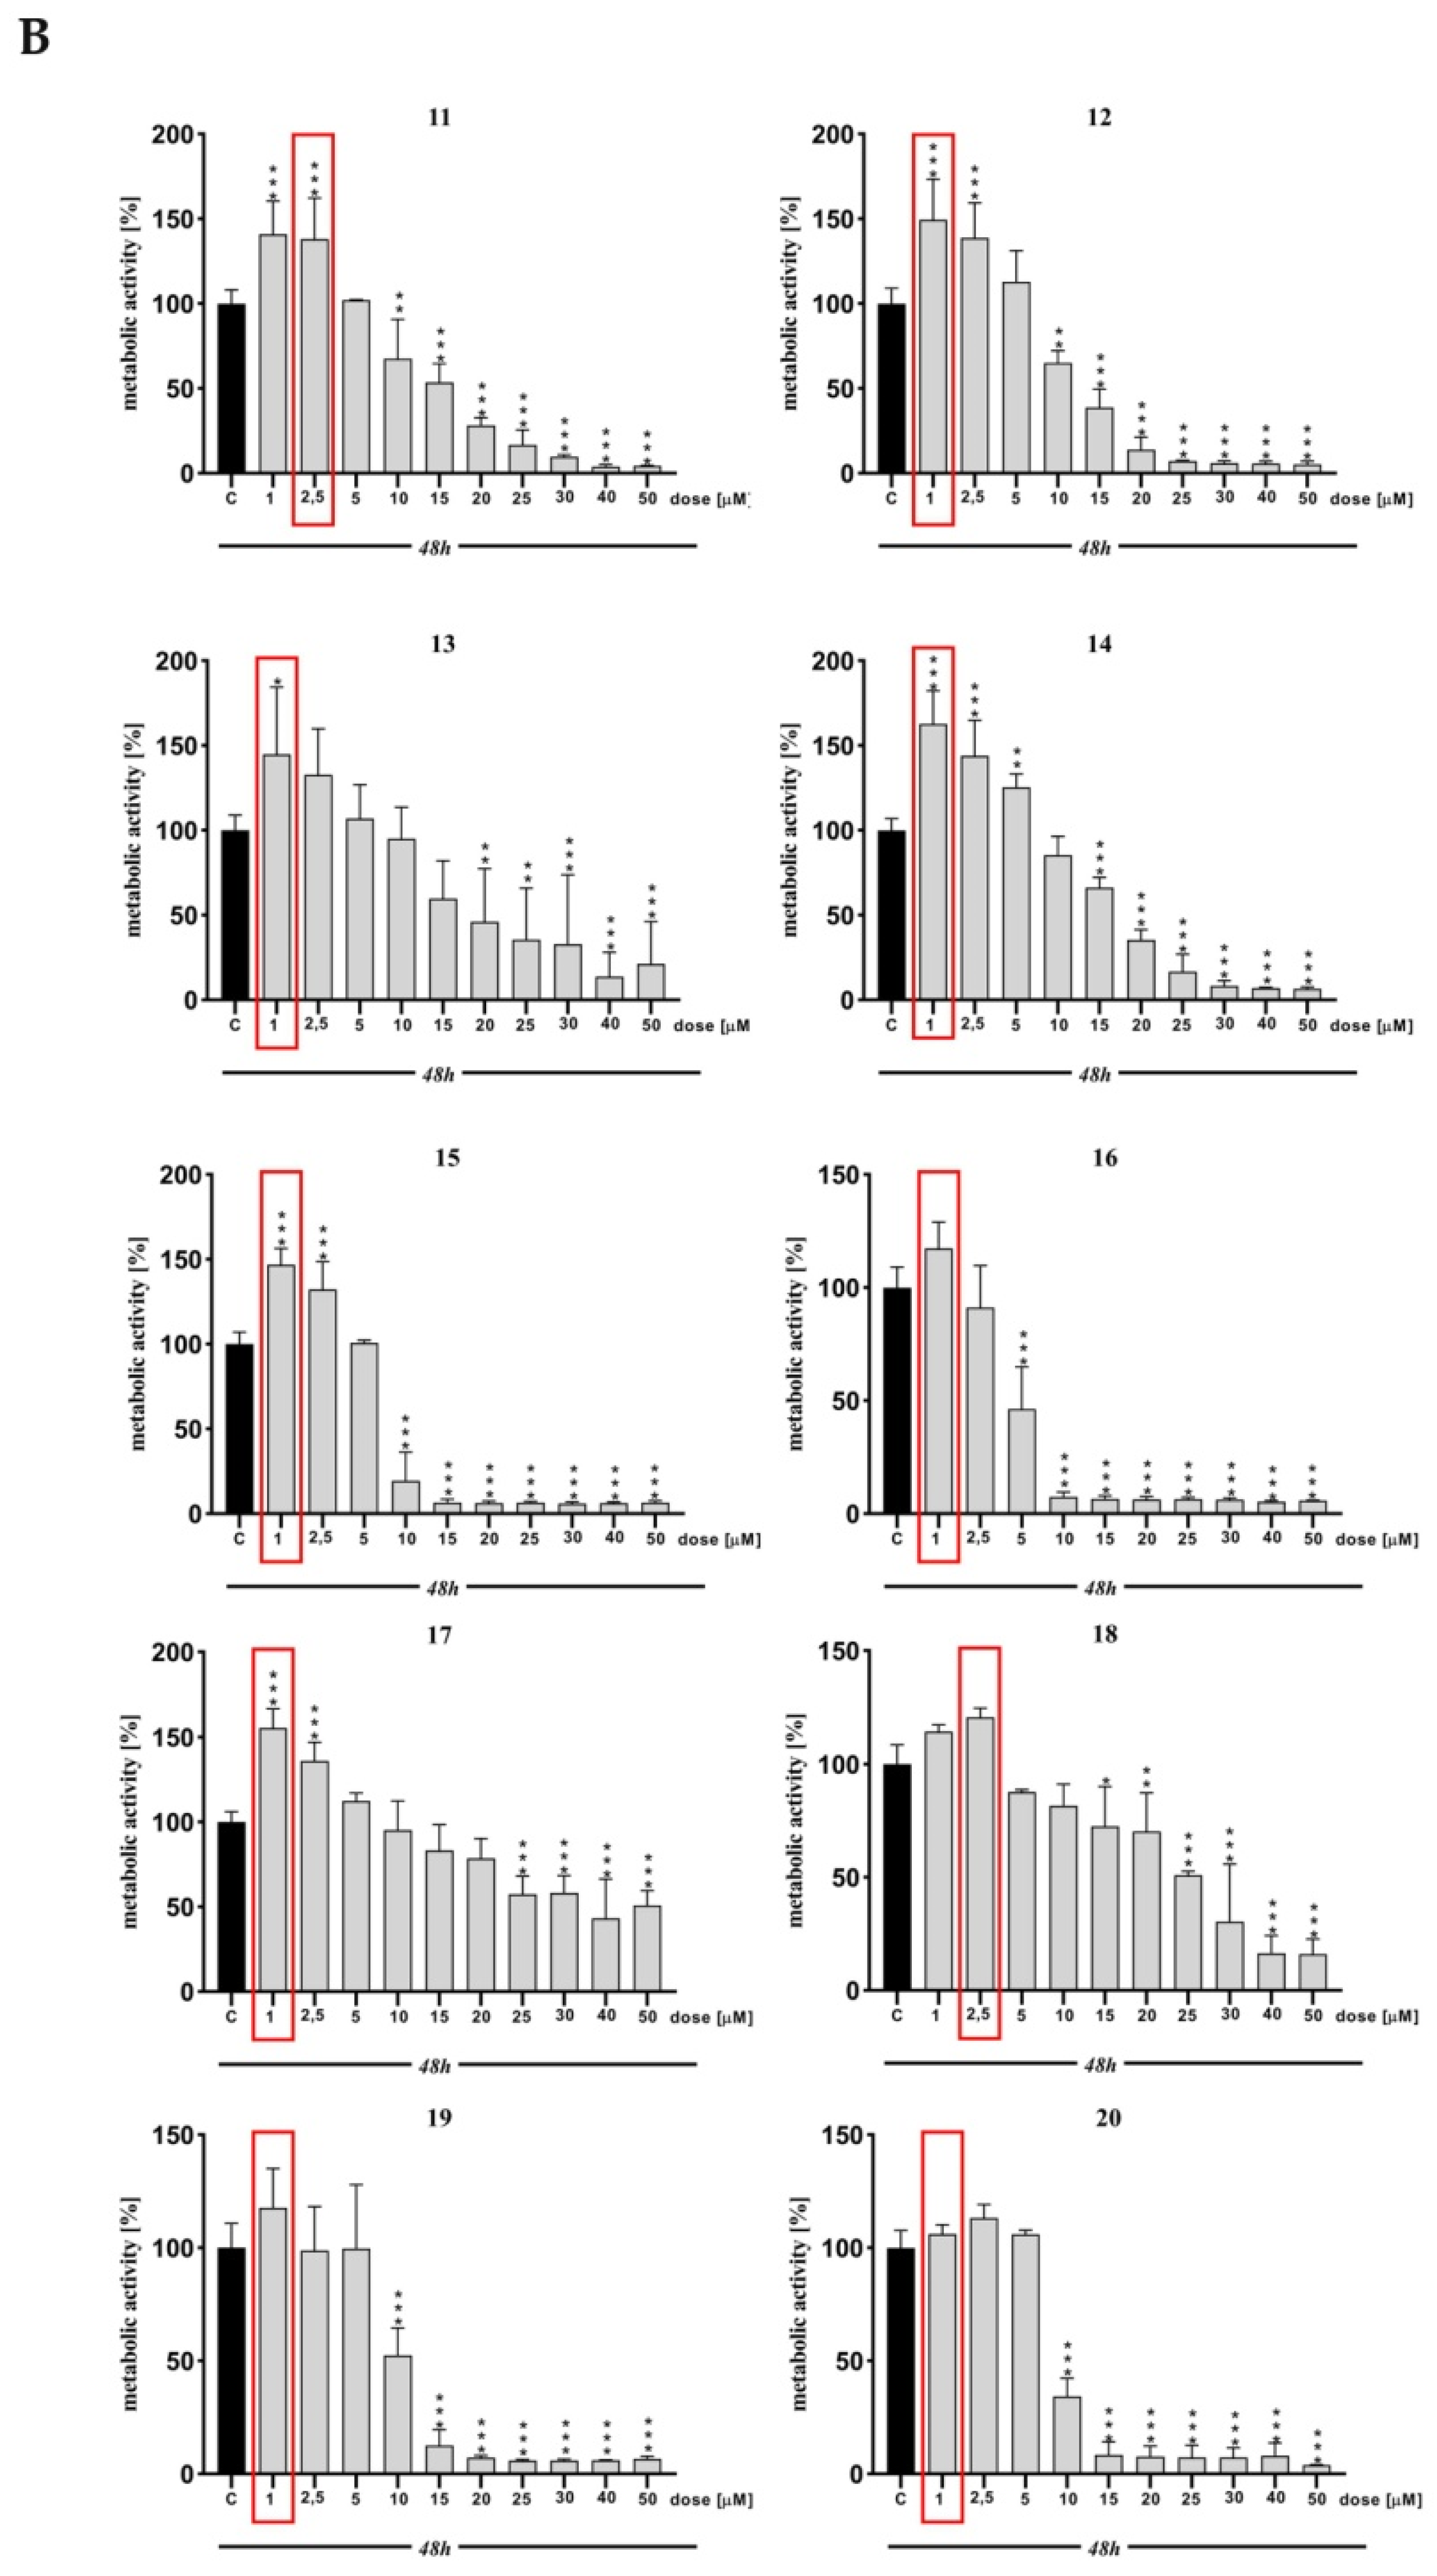
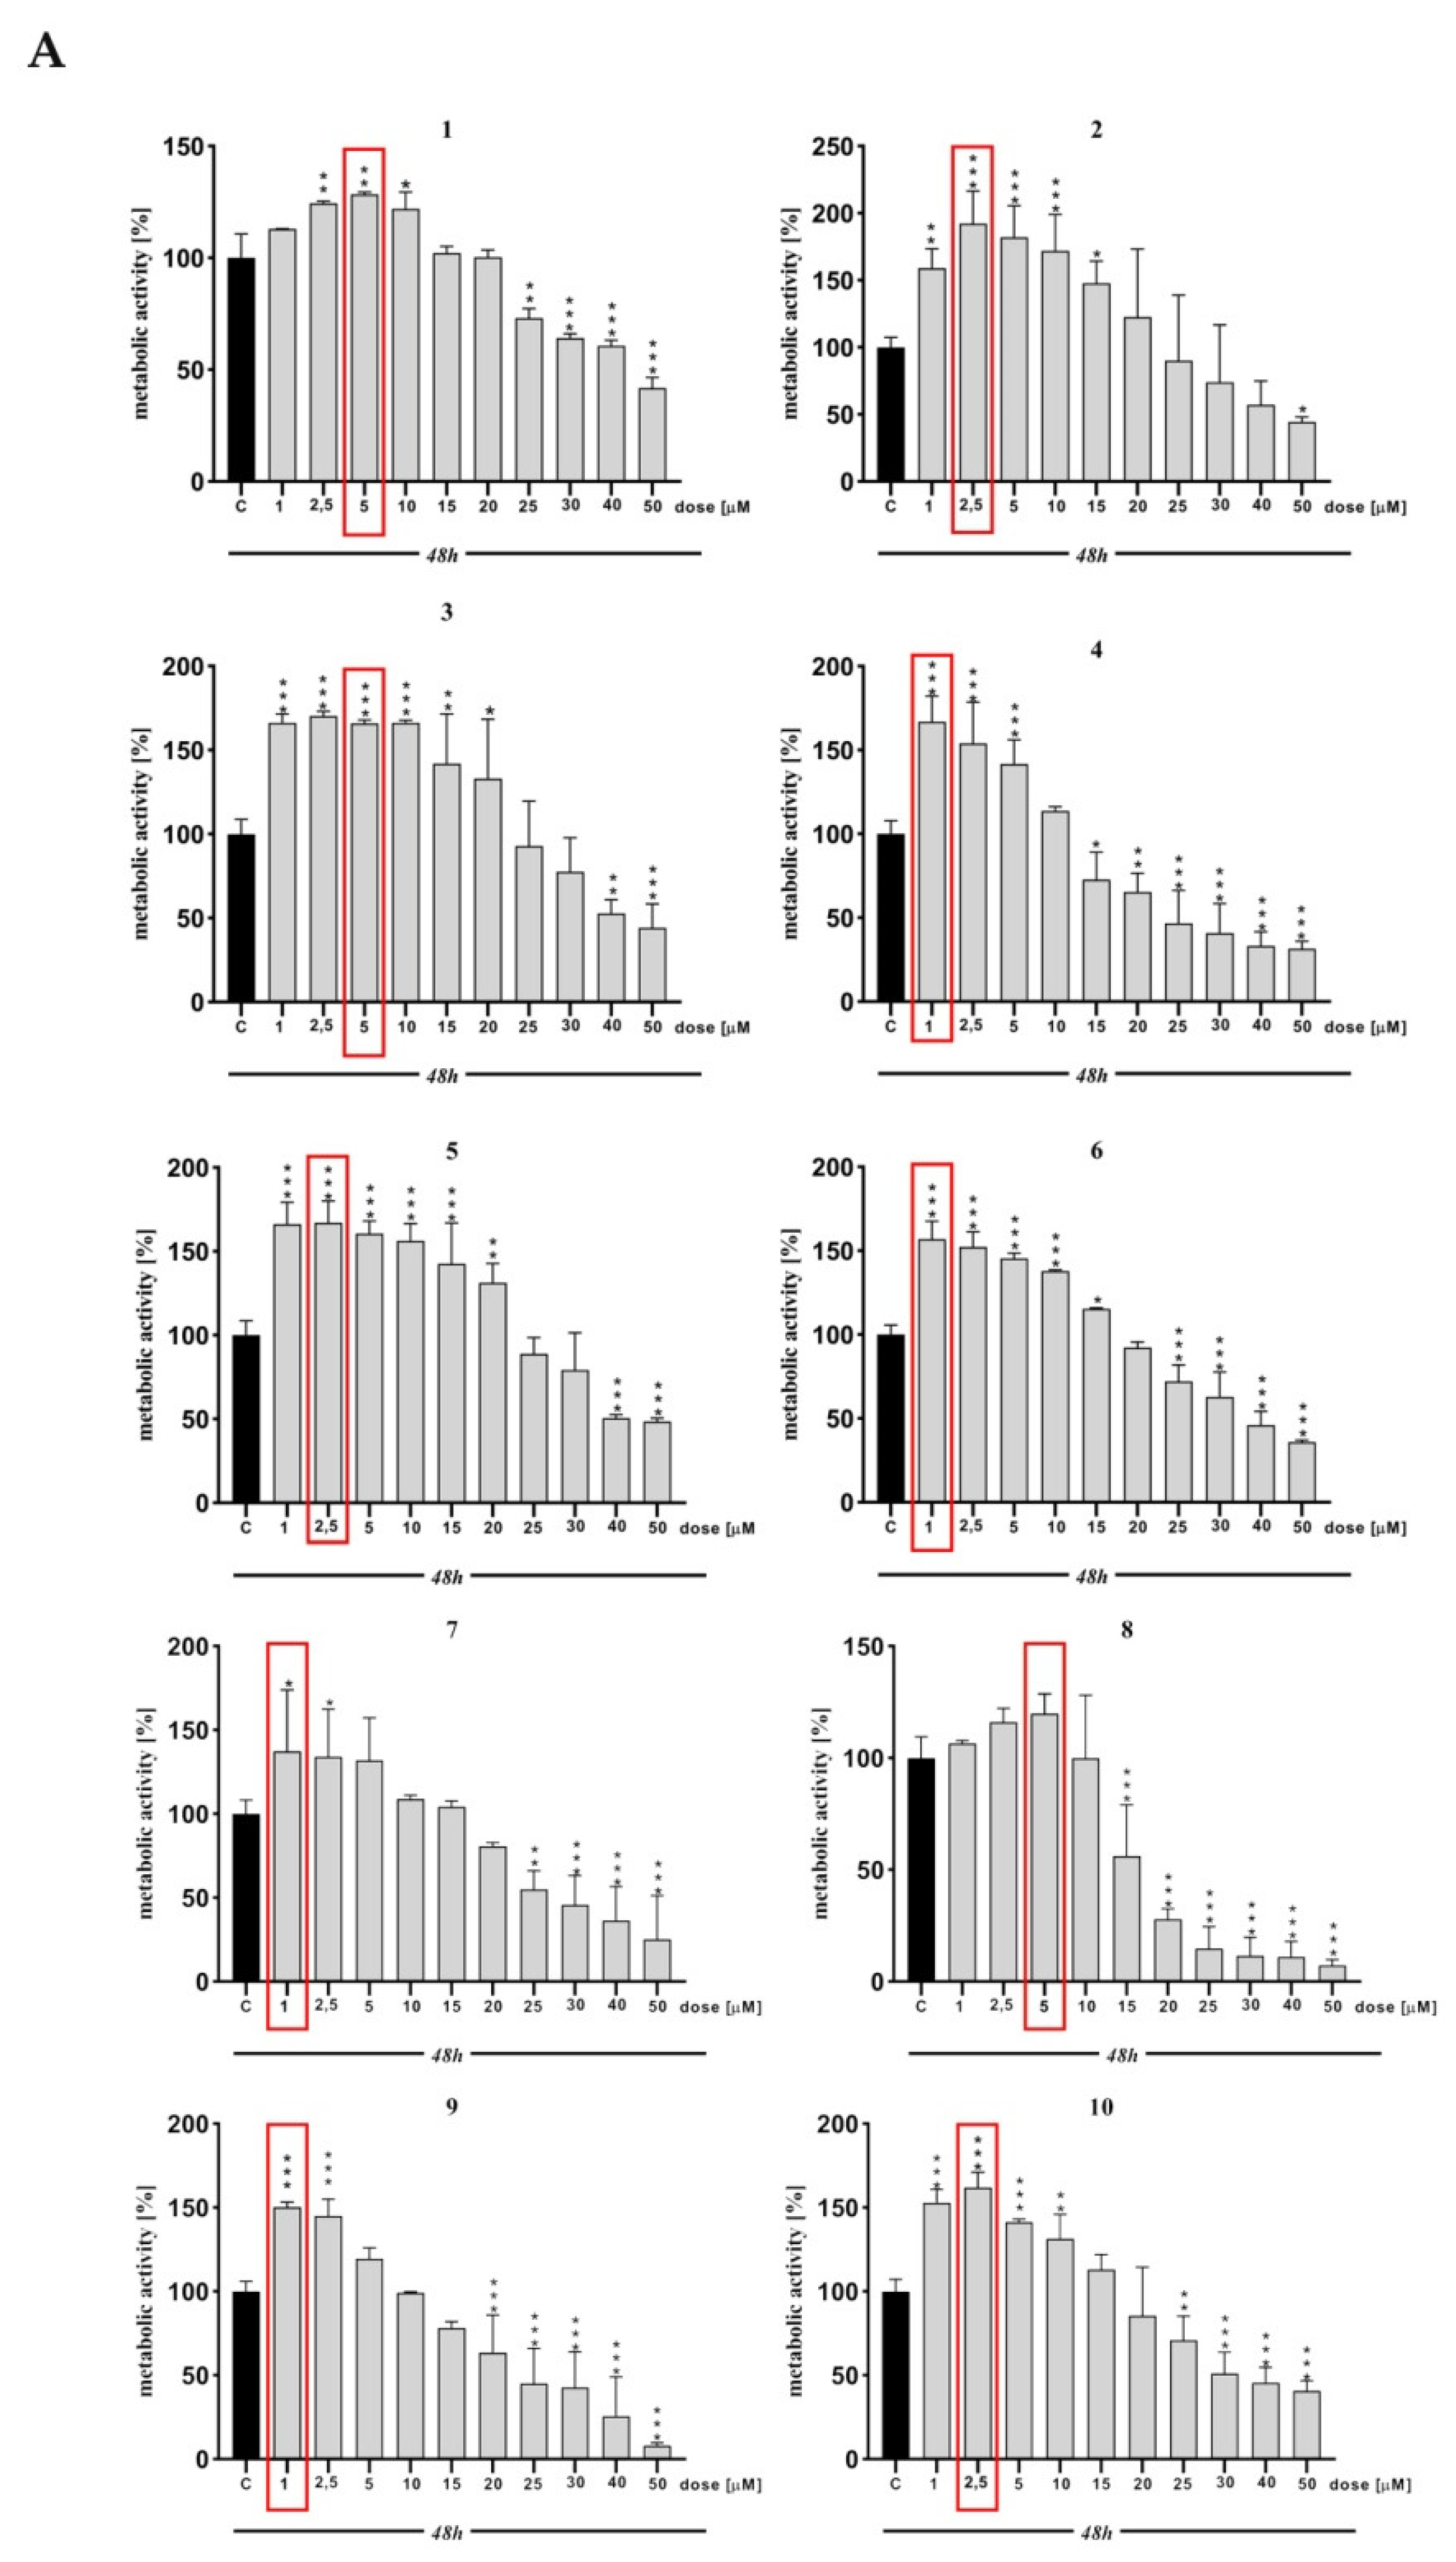
The synthesis and details of the D2AAK1 derivatives are provided elsewhere [10]. For assays, compounds 120 were dissolved in DMSO to a stock solution (10 mM). Before each experiment individual dilutions were prepared in a complete culture medium. For each sample tested, the final DMSO concentration (0.5%) was adjusted, which did not affect the viability of the cells. HT-22 cells were treated with different compounds at selected concentrations and incubated for 48 h.

3.3. MTT Assay

The assay was performed in accordance with our previous research [8]. Cells were seeded on 96-well plates at standard density. After 24 h, cells were treated with selected concentrations (1–50 µM) of D2 AAK1 derivatives for 48 h. MTT (3-(4,5-Dimethylthiazol-2-yl)-2,5-diphenyltetrazolium bromide) was then added at a final concentration of 0.5 mg/mL. After 4 h of incubation at 37 °C, the absorbance was measured at 590 nm (and 620 nm as a reference) using the BioTek-Synergy H1 microplate reader (Agilent; Santa Clara, CA, USA). Based on the MTT assay, concentrations were selected for further studies.

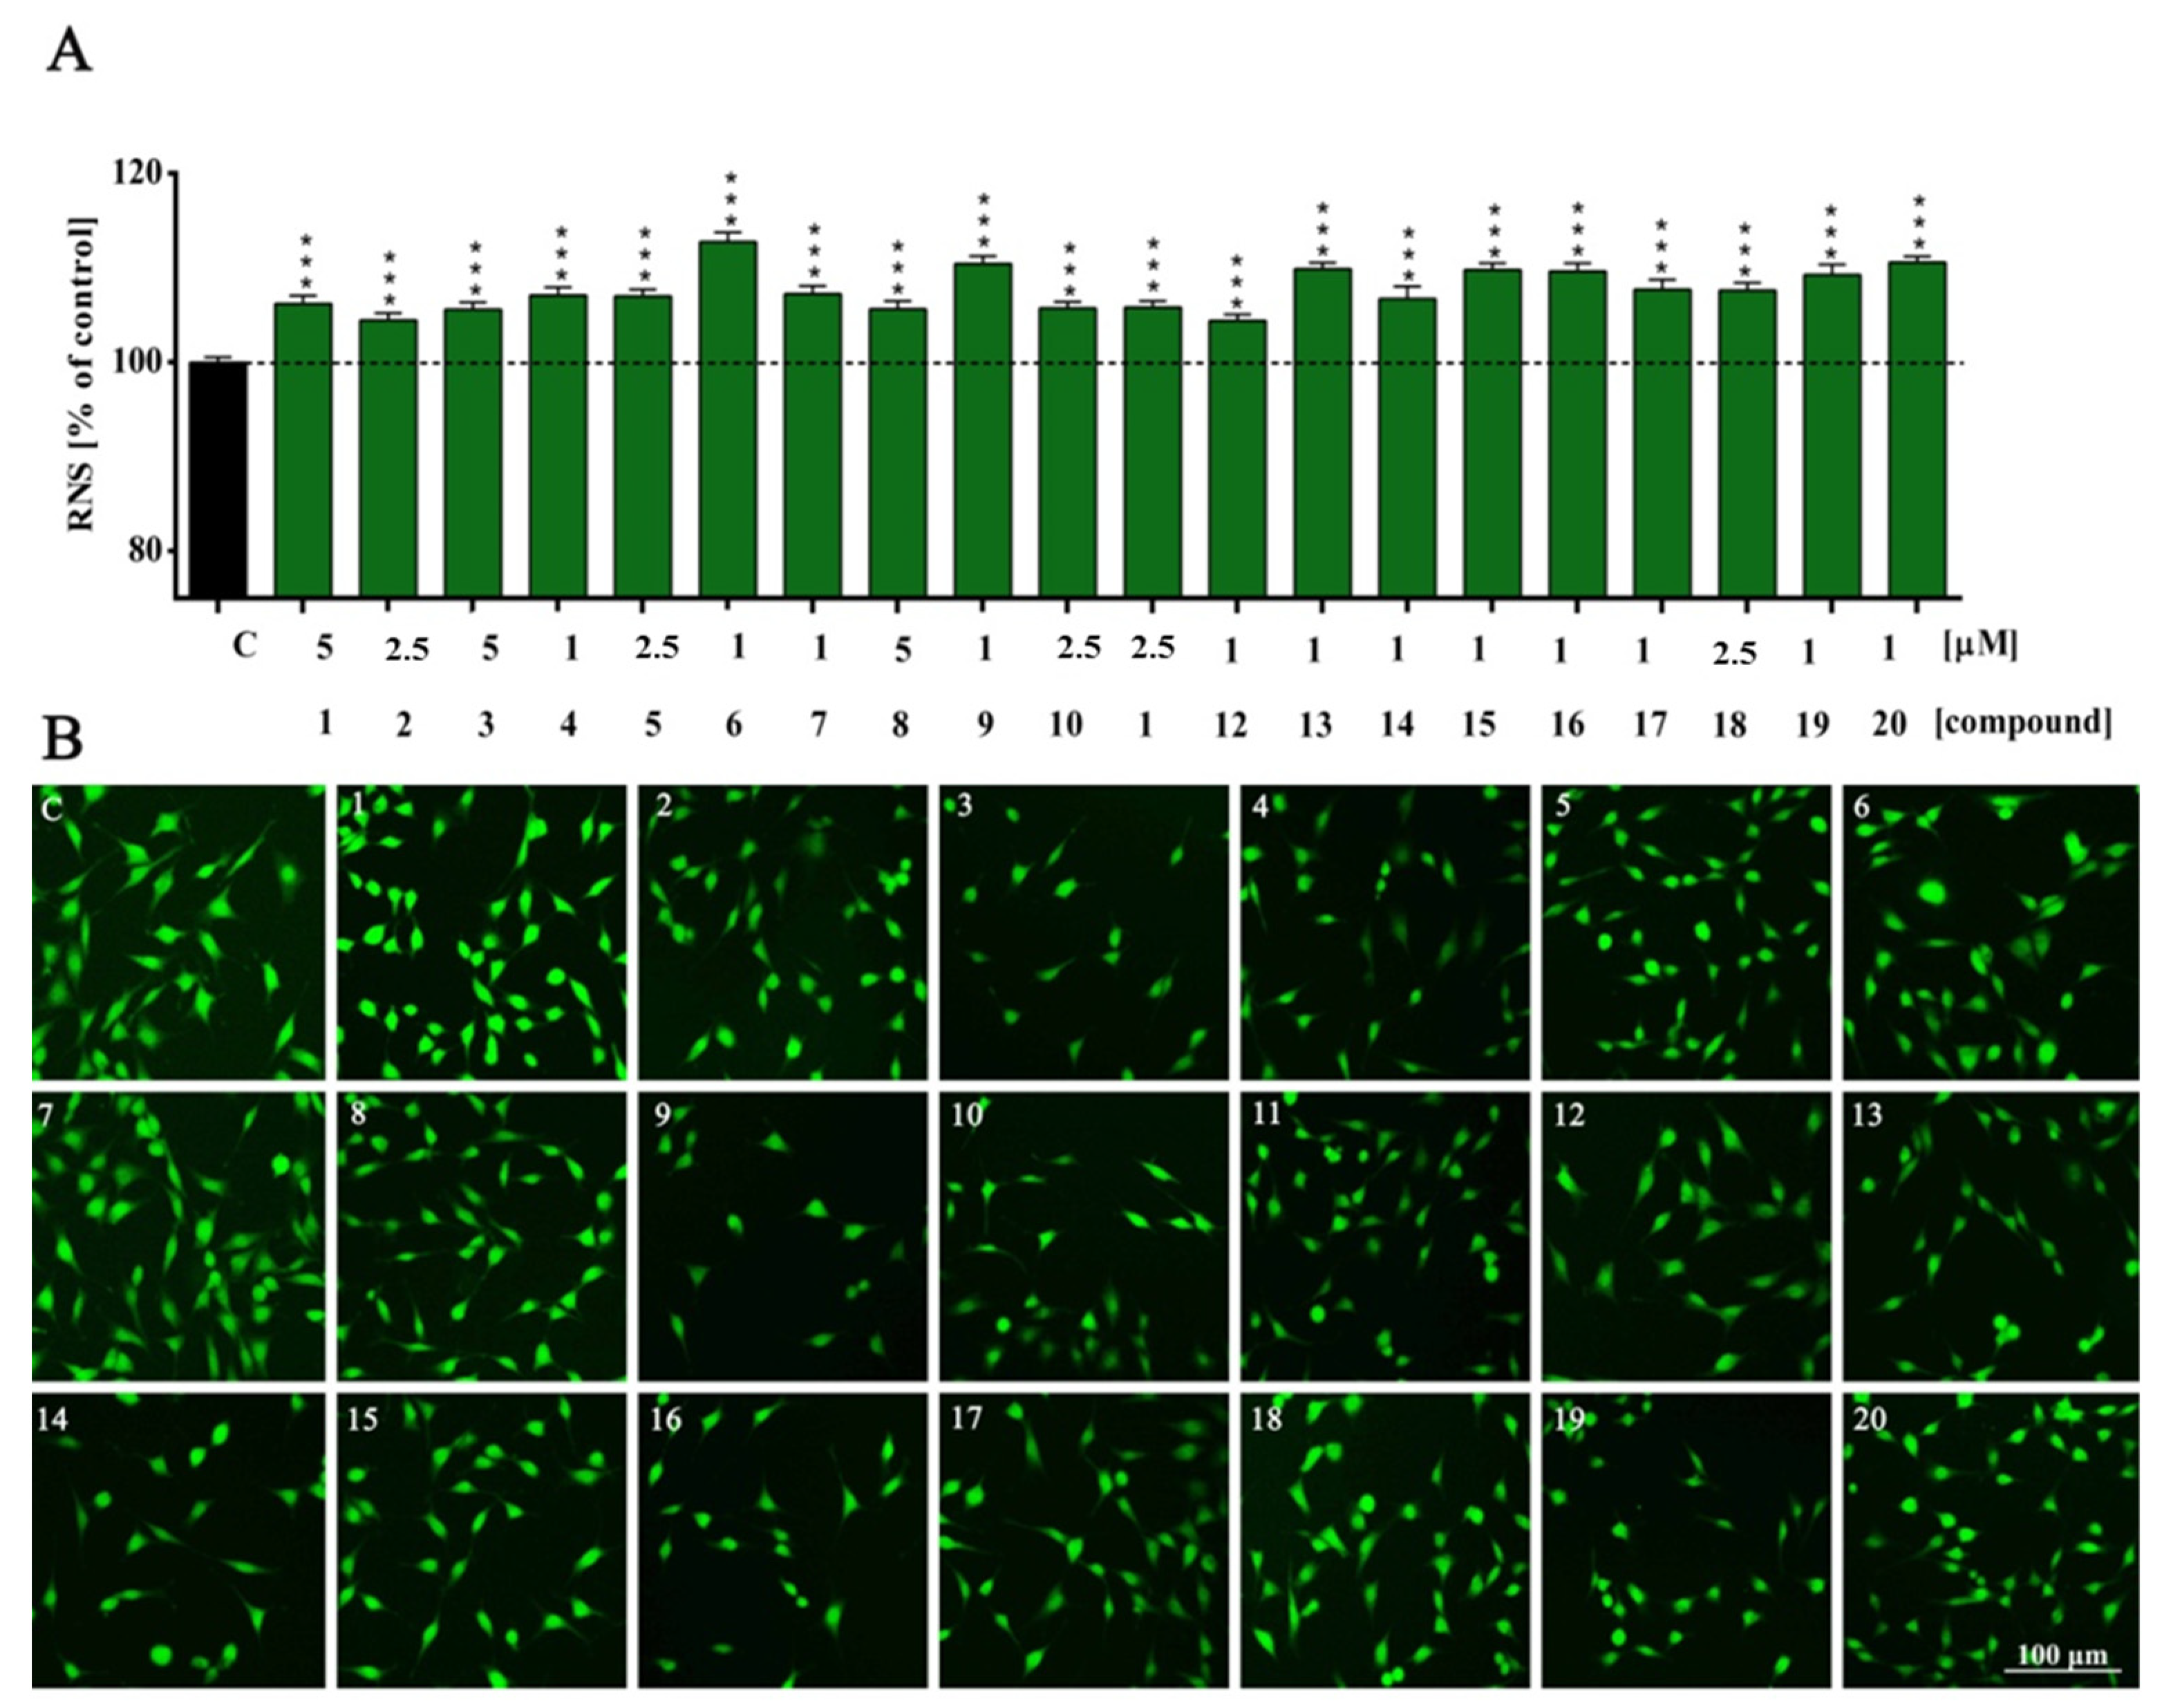
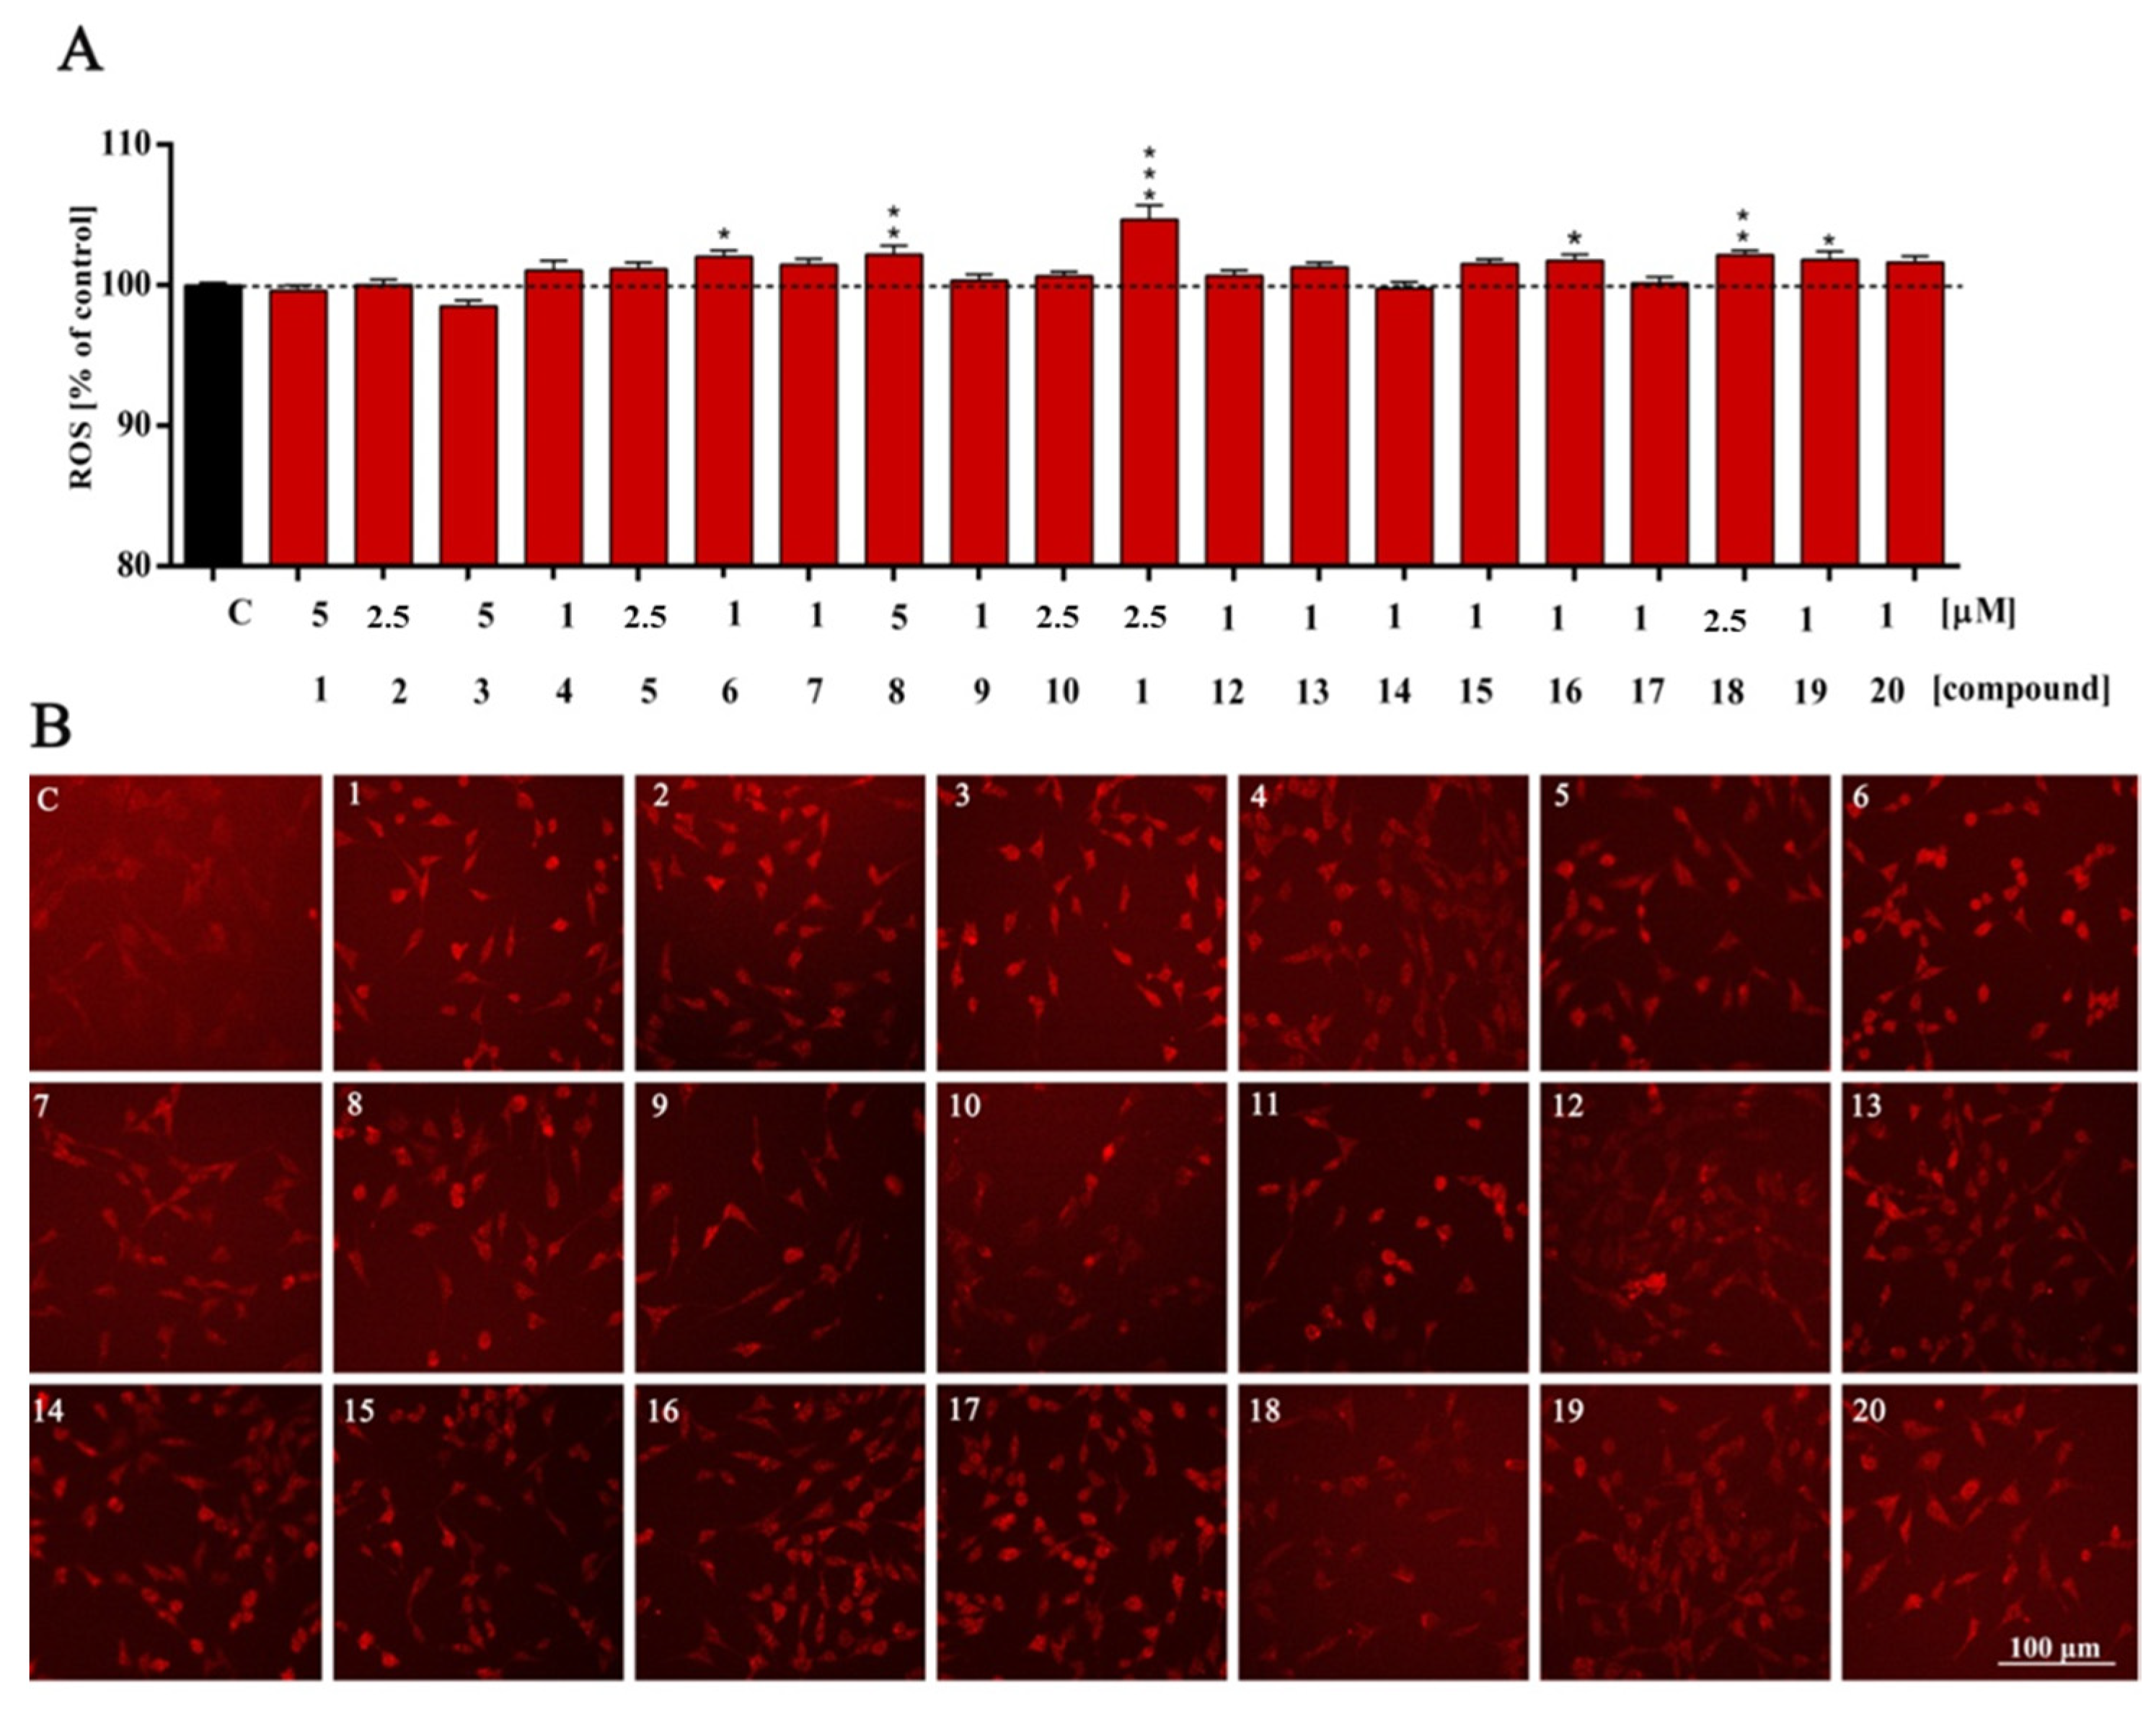
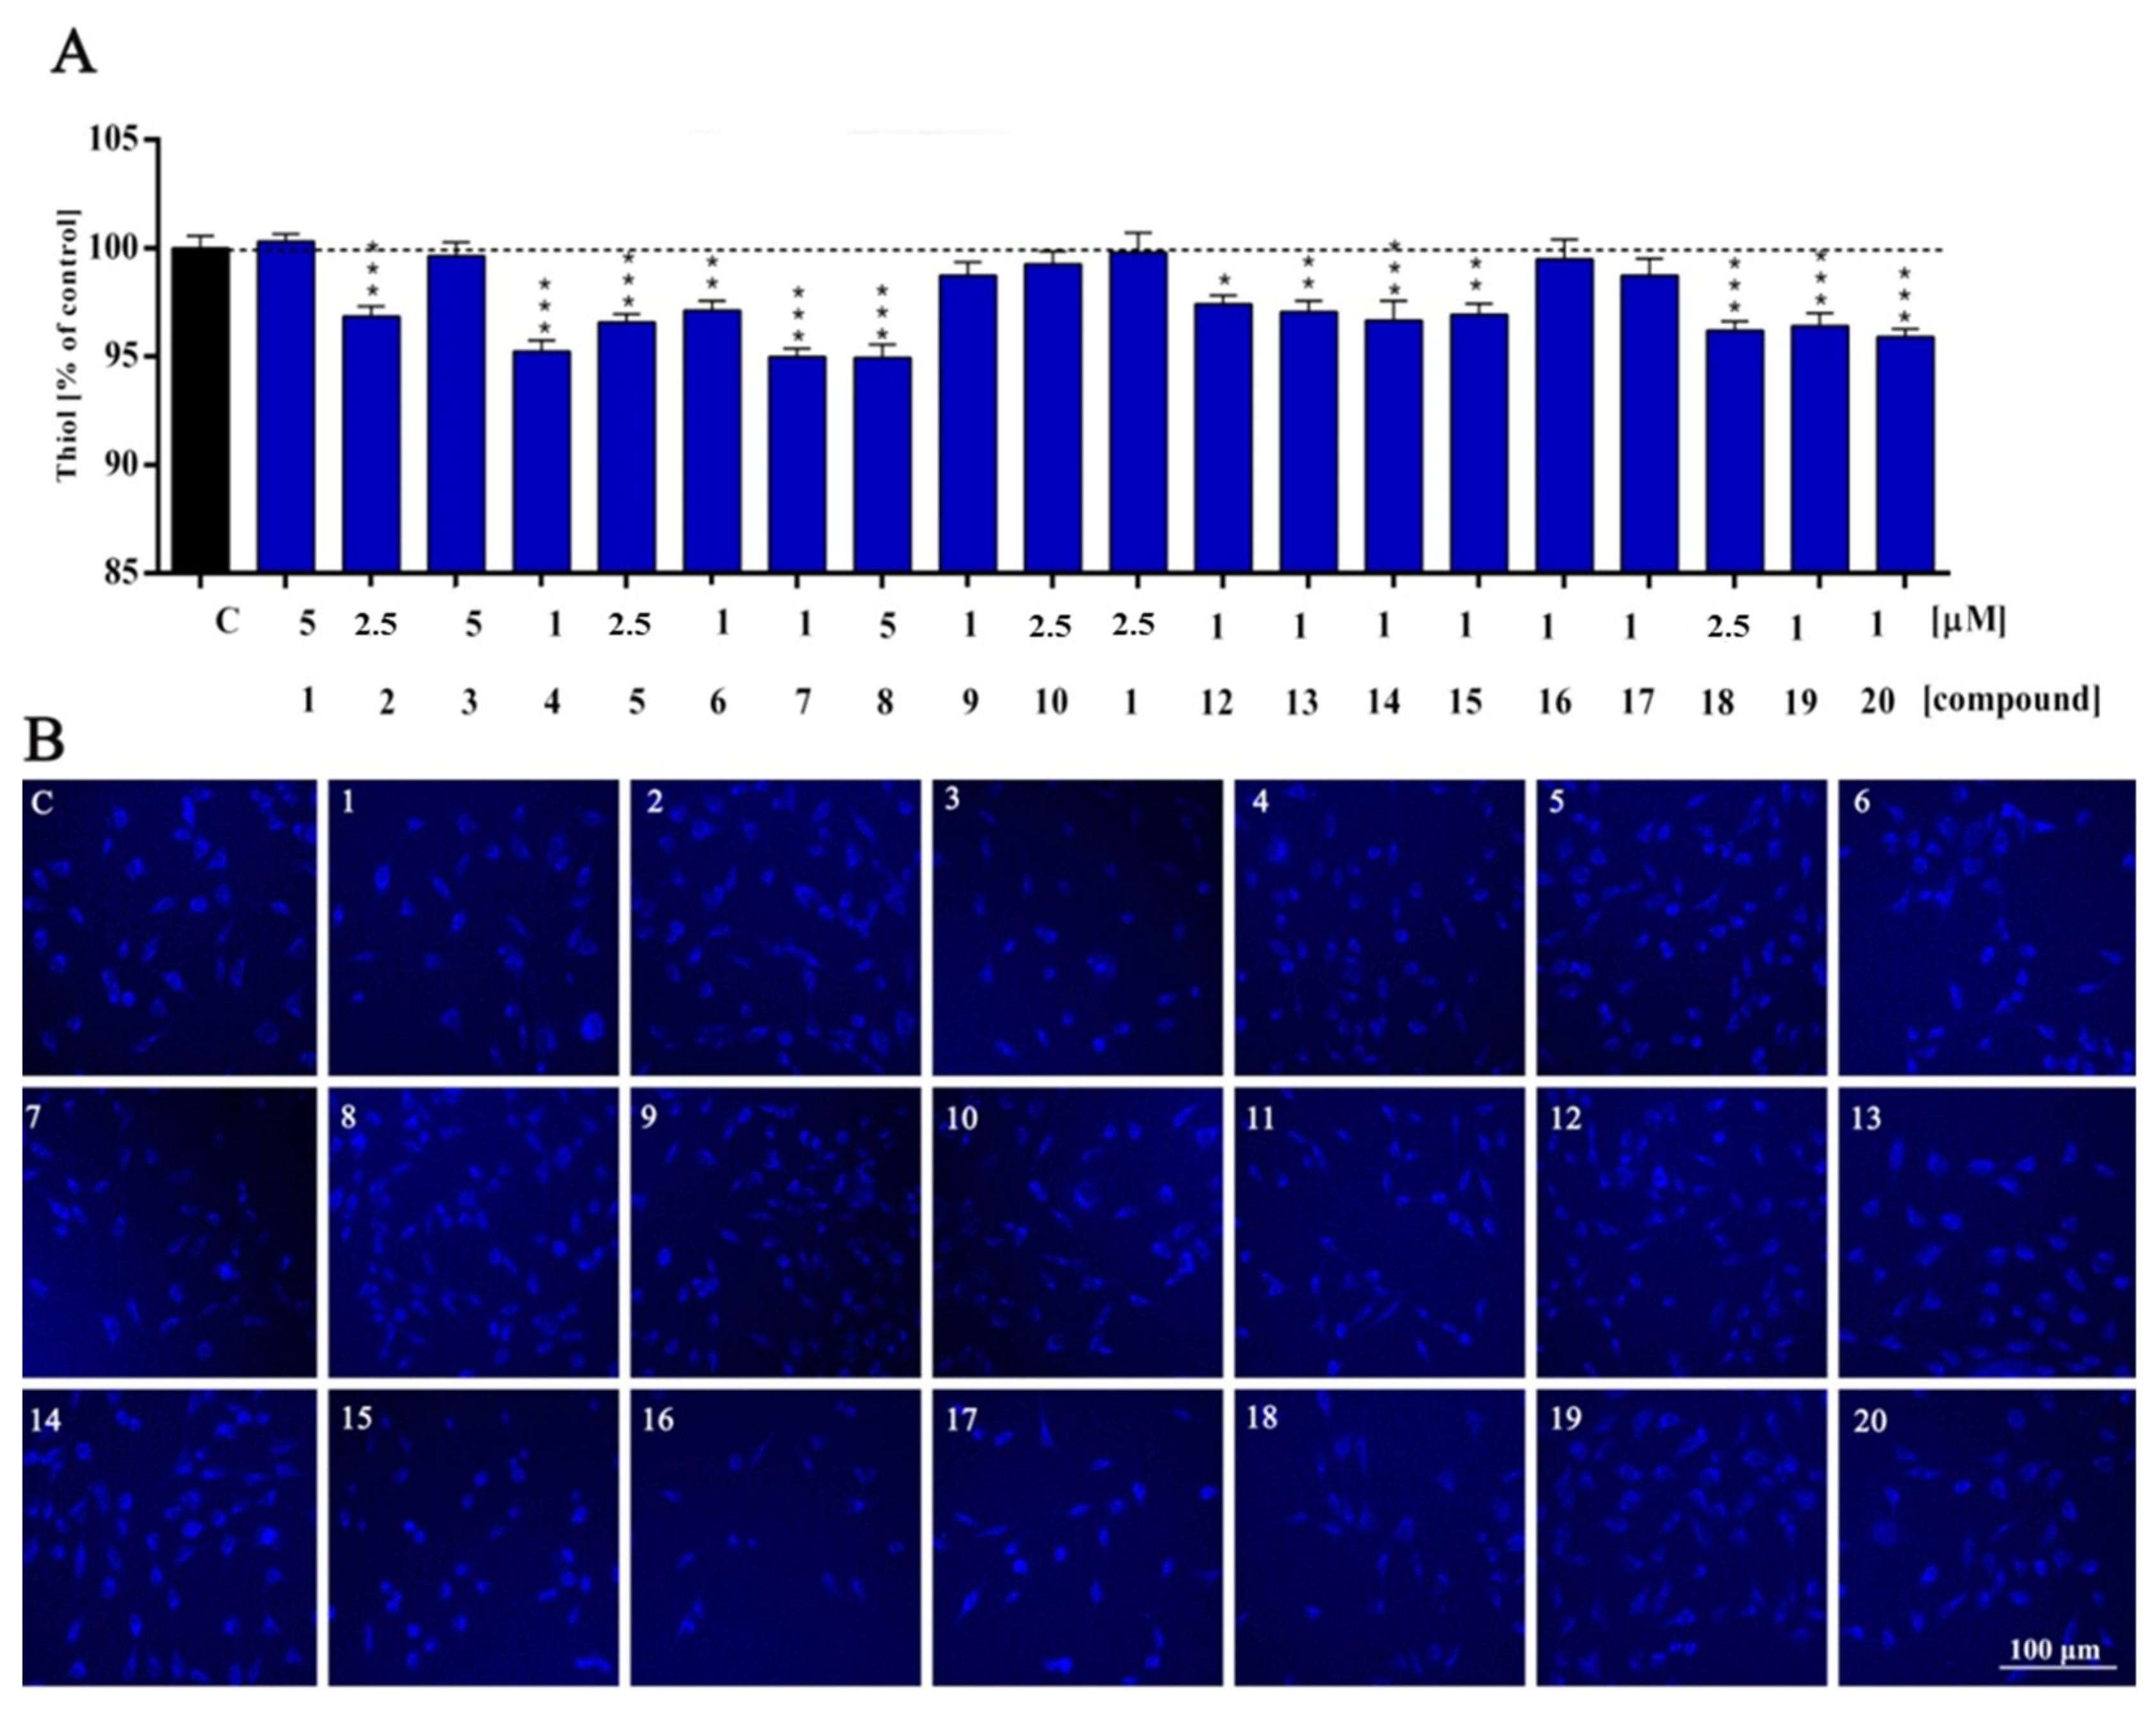
3.4. Cellular Redox Status and Antioxidant Capacity Assessment

The assay was performed in accordance with our previous research [8]. In detail, cells were seeded at standard density on black 96-well fluorescent plates. Measurements were assessed using the following fluorogenic probes at a final concentration of 5 µM: dihydroethidium (Thermo Scientific; Waltham, MA, USA), DAF-2 diacetate (Cayman Chemical; Ann Arbor, MI, USA) and Thiol Tracker Violet (Thermo Scientific; Waltham, MA, USA). Analyses were performed using digital images and quantifications were taken with an InCell Analyzer 2000 (GE Healthcare; Chicago, IL, USA) and presented as relative fluorescence units (RFU).

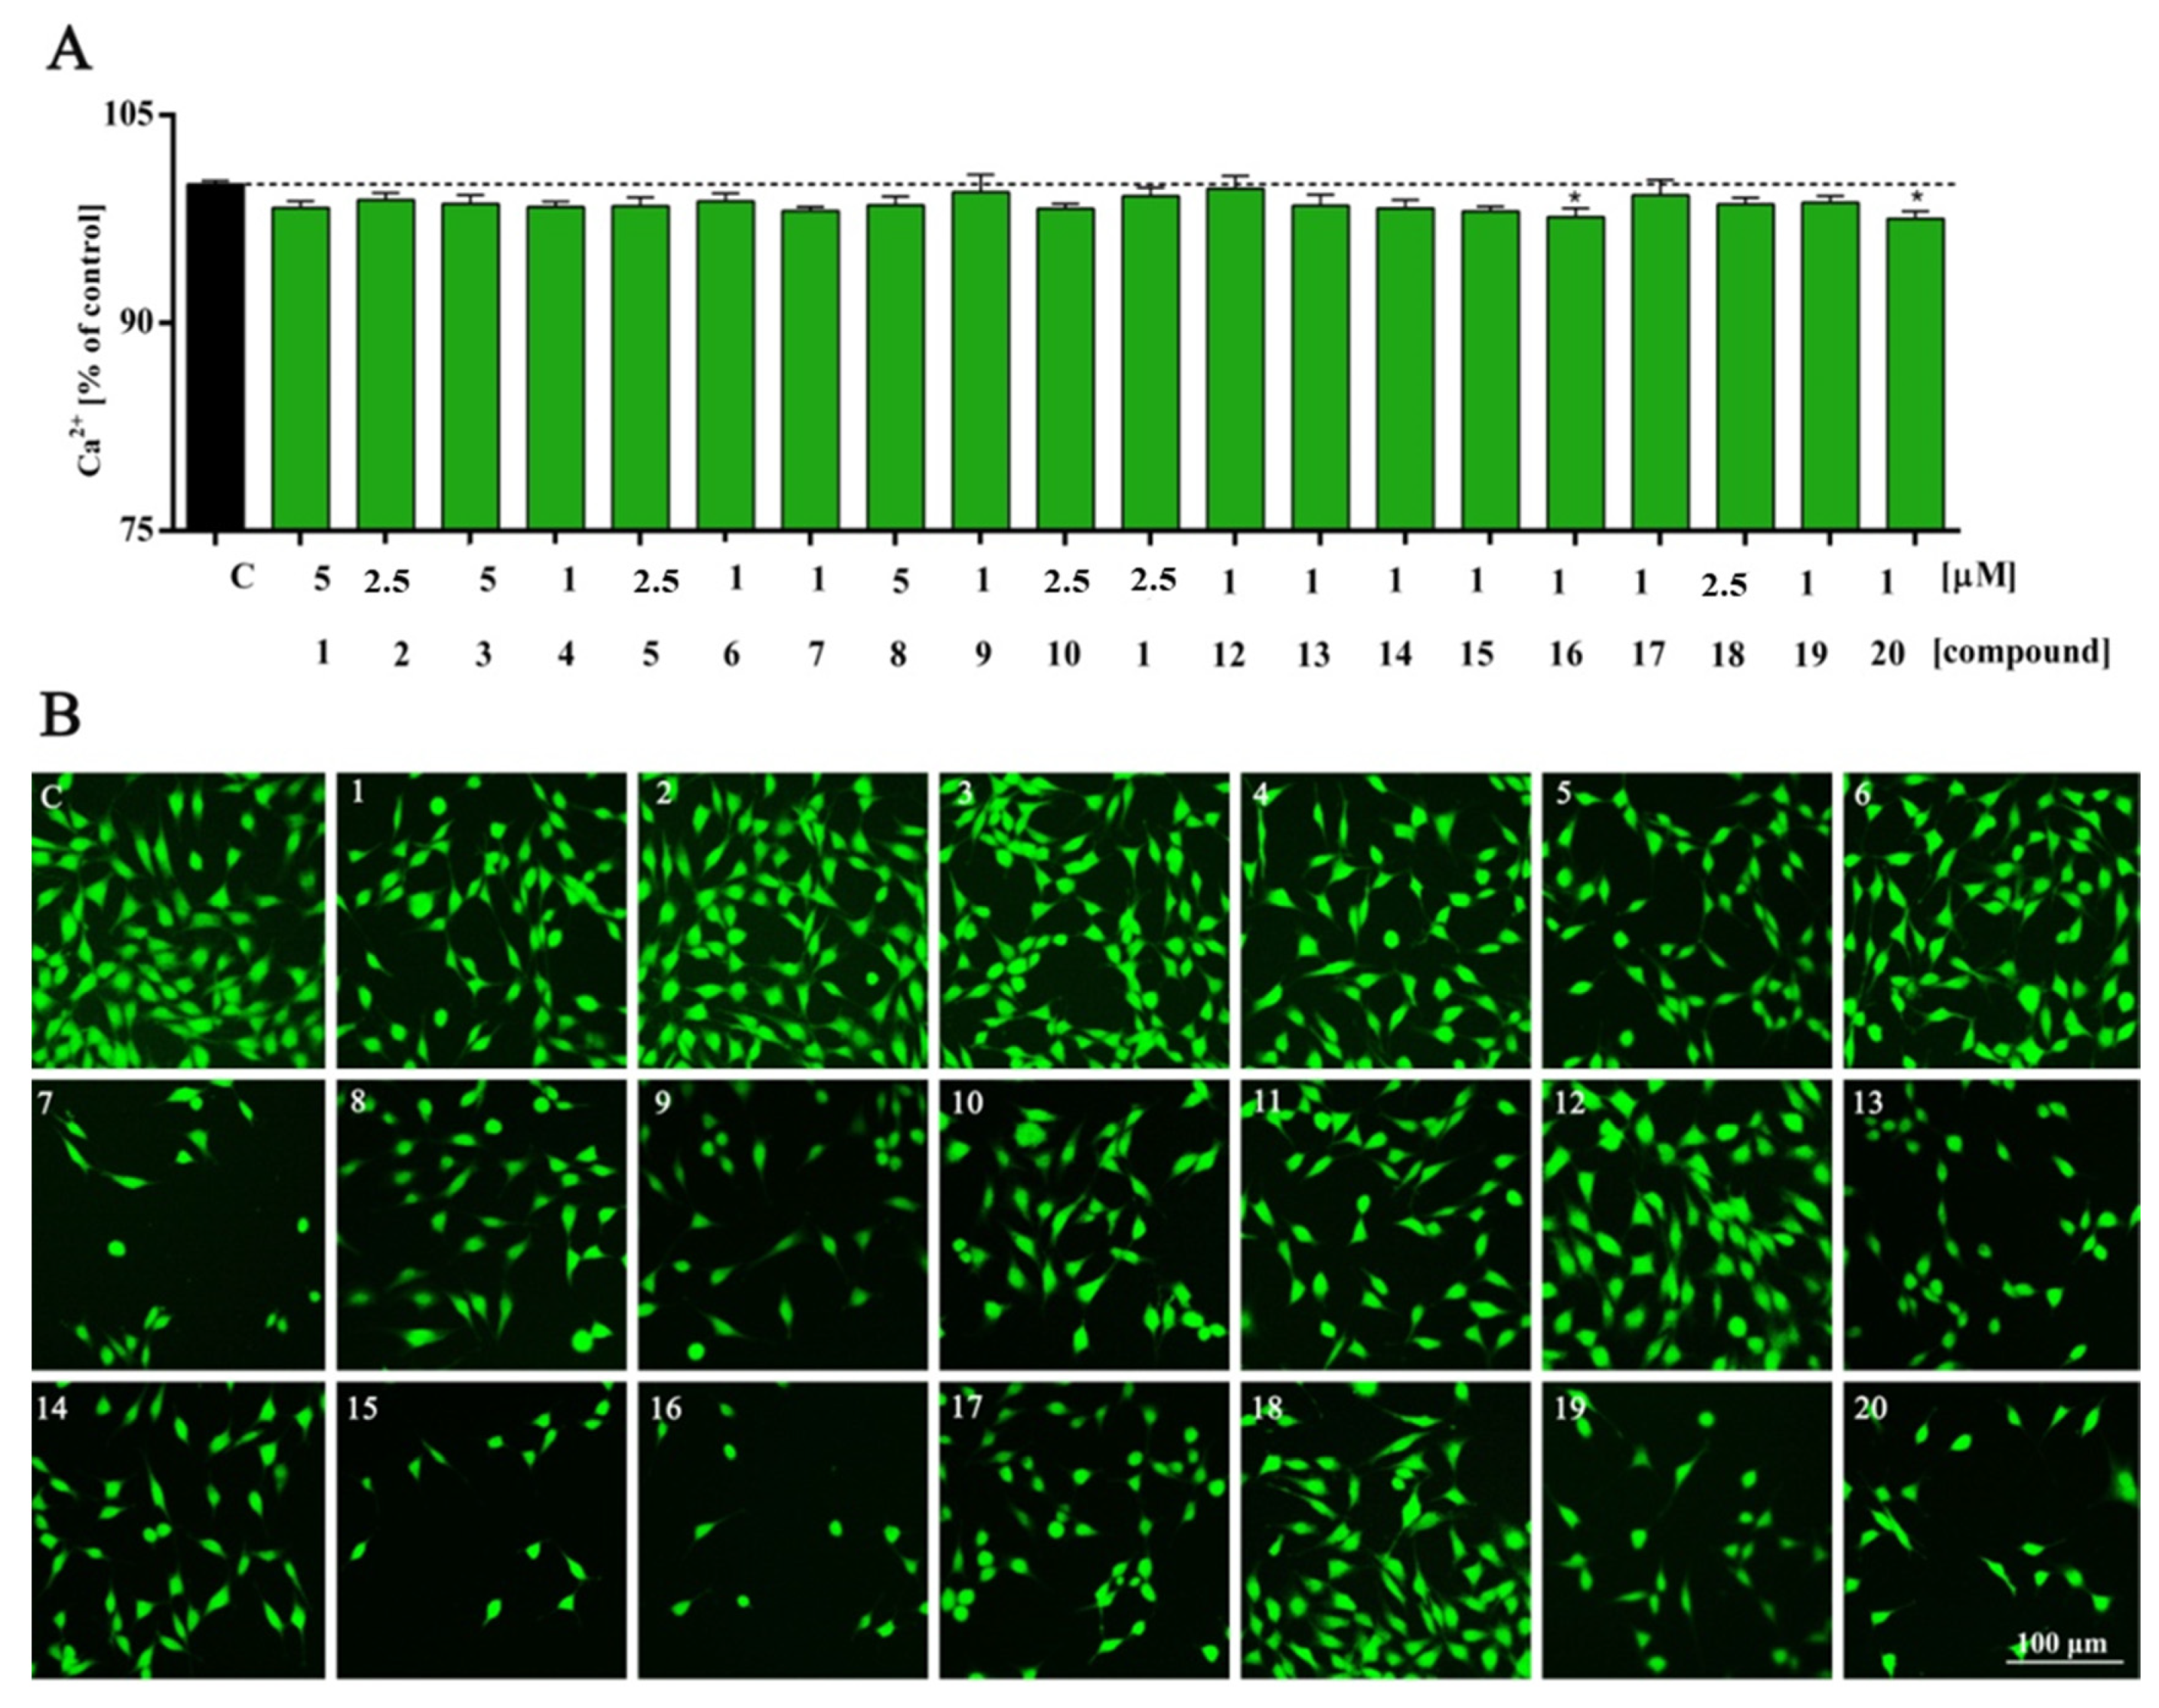
3.5. Intracellular Calcium Analysis

Cells were seeded at standard density and incubated with compounds at selected concentrations for 48 h. Measurements were made using the Fura-2 AM probe (Cayman Chemical; Ann Arbor, MI, USA). Signal detection was performed with an InCell Analyzer 2000 (GE Healthcare; Chicago, IL, USA).

3.6. Statistical Analysis

Statistical analysis was performed with GraphPad Prism v. 8.0. All experiments were carried out in triplicate. Differences between the control and study groups were assessed using one-way ANOVA of variance with Dunnett’s post hoc test. All results are presented as mean ± standard deviation. Statistically significant results (p-value of <0.05) are displayed as: * p < 0.05; ** p < 0.01; and *** p < 0.001. ImageJ software was used for image processing, while Adobe Photoshop CC software was used to create figures.

4. Conclusions

D2AAK1 versus Its Analogs

Although some D2AAK1 derivatives exhibit a significant increase in metabolic activity, the proliferation rate elicited by the lead structure [8] exceeds that of its most active analog. The level of intracellular calcium is statistically significantly lower after treatment with D2AAK1 [9]. Furthermore, all reported analogs lead to an increase in reactive nitrogen species, while the lead structure causes a drop of this parameter [9]. However, considering the impact on reactive oxygen species and the level of glutathione, there are no significant differences between D2AAK1 and its derivatives (Table 1). In summary, analyzing the structure–activity relationship, we selected the compound with the most favorable profile for neuroprotective activity. Among all implemented structural features, D2AAK1 is the most favorable for neuroprotective activity and recognized as a promising medicinal compound for the treatment of neurodegenerative diseases. Further optimization of D2AAK1 is needed to obtain more potent compounds.

Author Contributions

O.K.: developed and planned the idea presented, designed and performed experiments, analyzed data, carried out data interpretation, designed figures and wrote the manuscript; P.S. (Przemysław Sołek): conducted experiments, analyzed data, carried out data interpretation, provided critical advice and guidance and wrote the manuscript; P.S. (Piotr Stępnicki): analyzed the results in terms of the structure–activity relationship and wrote the manuscript; A.A.K.: designed the studied compounds, acquired funding for research and read and revised the manuscript. All authors have read and agreed to the published version of the manuscript.

Funding

The research was funded under OPUS grant from the National Science Center (NCN, Poland), grant number 2017/27/B/NZ7/01767 (to A.A.K.). This study was also supported in part by an internal PB grant for PhD students (Medical University of Lublin, Poland) grant number PBsd20 (to O.K.) in terms of reactive oxygen species (ROS).

Institutional Review Board Statement

Not applicable.

Informed Consent Statement

Not applicable.

Data Availability Statement

The data will be available on request from the corresponding author.

Conflicts of Interest

The authors declare no conflict of interest.

Sample Availability

Samples of the compounds of D2 AAK1 derivatives are available from the authors.

References

  1. Gitler, A.D.; Dhillon, P.; Shorter, J. Neurodegenerative Disease: Models, Mechanisms, and a New Hope. Dis. Model. Mech. 2017, 10, 499–502. [Google Scholar] [CrossRef] [PubMed] [Green Version]
  2. Hussain, R.; Zubair, H.; Pursell, S.; Shahab, M. Neurodegenerative Diseases: Regenerative Mechanisms and Novel Therapeutic Approaches. Brain Sci. 2018, 8, 177. [Google Scholar] [CrossRef] [PubMed] [Green Version]
  3. Linsley, J.W.; Reisine, T.; Finkbeiner, S. Cell Death Assays for Neurodegenerative Disease Drug Discovery. Expert Opin. Drug Discov. 2019, 14, 901–913. [Google Scholar] [CrossRef] [PubMed]
  4. Elufioye, T.O.; Berida, T.I.; Habtemariam, S. Plants-Derived Neuroprotective Agents: Cutting the Cycle of Cell Death through Multiple Mechanisms. Evid. Based Complement. Alternat. Med. 2017, 2017, 3574012. [Google Scholar] [CrossRef] [Green Version]
  5. Śliwka, L.; Wiktorska, K.; Suchocki, P.; Milczarek, M.; Mielczarek, S.; Lubelska, K.; Cierpiał, T.; Łyżwa, P.; Kiełbasiński, P.; Jaromin, A.; et al. The Comparison of MTT and CVS Assays for the Assessment of Anticancer Agent Interactions. PLoS ONE 2016, 11, e0155772. [Google Scholar] [CrossRef] [Green Version]
  6. Lapchak, P.A. Drug-like Property Profiling of Novel Neuroprotective Compounds to Treat Acute Ischemic Stroke: Guidelines to Develop Pleiotropic Molecules. Transl. Stroke Res. 2013, 4, 328–342. [Google Scholar] [CrossRef] [Green Version]
  7. Kaczor, A.A.; Targowska-Duda, K.M.; Budzyńska, B.; Biała, G.; Silva, A.G.; Castro, M. In Vitro, Molecular Modeling and Behavioral Studies of 3-{[4-(5-Methoxy-1H-Indol-3-Yl)-1,2,3,6-Tetrahydropyridin-1-Yl]Methyl}-1,2-Dihydroquinolin-2-One (D2AAK1) as a Potential Antipsychotic. Neurochem. Int. 2016, 96, 84–99. [Google Scholar] [CrossRef]
  8. Koszła, O.; Sołek, P.; Woźniak, S.; Kędzierska, E.; Wróbel, T.M.; Kondej, M.; Archała, A.; Stępnicki, P.; Biała, G.; Matosiuk, D.; et al. The Antipsychotic D2AAK1 as a Memory Enhancer for Treatment of Mental and Neurodegenerative Diseases. Int. J. Mol. Sci. 2020, 21, 8849. [Google Scholar] [CrossRef]
  9. Koszła, O.; Sołek, P.; Kędzierska, E.; Listos, P.; Castro, M.; Agnieszka, A.K. In Vitro and In Vivo Evaluation of Antioxidant and Neuroprotective Properties of Antipsychotic D2AAK1. Neurochem. Res. 2022; in press. [Google Scholar] [CrossRef]
  10. Kondej, M.; Wróbel, T.M.; Silva, A.G.; Stępnicki, P.; Koszła, O.; Kędzierska, E.; Bartyzel, A.; Biała, G.; Matosiuk, D.; Loza, M.I.; et al. Synthesis, Pharmacological and Structural Studies of 5-Substituted-3-(1-Arylmethyl-1,2,3,6-Tetrahydropyridin-4-Yl)-1H-Indoles as Multi-Target Ligands of Aminergic GPCRs. Eur. J. Med. Chem. 2019, 180, 673–689. [Google Scholar] [CrossRef]
  11. Huang, W.-J.; Zhang, X.; Chen, W.-W. Role of Oxidative Stress in Alzheimer’s Disease. Biomed. Rep. 2016, 4, 519–522. [Google Scholar] [CrossRef] [Green Version]
  12. Wang, H.-D.; Dunnavant, F.D.; Jarman, T.; Deutch, A.Y. Effects of Antipsychotic Drugs on Neurogenesis in the Forebrain of the Adult Rat. Neuropsychopharmacology 2004, 29, 1230–1238. [Google Scholar] [CrossRef] [PubMed]
  13. Keilhoff, G.; Fusar-Poli, P.; Becker, A. Effects of Antipsychotics on Dentate Gyrus Stem Cell Proliferation and Survival in Animal Models: A Critical Update. Neural Plast. 2012, 2012, 832757. [Google Scholar] [CrossRef] [PubMed] [Green Version]
  14. Yang, P.; He, X.-Q.; Peng, L.; Li, A.-P.; Wang, X.-R.; Zhou, J.-W.; Liu, Q.-Z. The Role of Oxidative Stress in Hormesis Induced by Sodium Arsenite in Human Embryo Lung Fibroblast (HELF) Cellular Proliferation Model. J. Toxicol. Environ. Health Part A 2007, 70, 976–983. [Google Scholar] [CrossRef] [PubMed]
  15. Frosali, S.; Leonini, A.; Ettorre, A.; Di Maio, G.; Nuti, S.; Tavarini, S.; Di Simplicio, P.; Di Stefano, A. Role of Intracellular Calcium and S-Glutathionylation in Cell Death Induced by a Mixture of Isothiazolinones in HL60 Cells. Biochim. Biophys. Acta–Mol. Cell Res. 2009, 1793, 572–583. [Google Scholar] [CrossRef] [Green Version]
  16. Rizzuto, R. Intracellular Ca2+ Pools in Neuronal Signalling. Curr. Opin. Neurobiol. 2001, 11, 306–311. [Google Scholar] [CrossRef]
  17. Brini, M.; Calì, T.; Ottolini, D.; Carafoli, E. Neuronal Calcium Signaling: Function and Dysfunction. Cell. Mol. Life Sci. 2014, 71, 2787–2814. [Google Scholar] [CrossRef]
  18. Trebak, M.; Ginnan, R.; Singer, H.A.; Jourd’heuil, D. Interplay between Calcium and Reactive Oxygen/Nitrogen Species: An Essential Paradigm for Vascular Smooth Muscle Signaling. Antioxid. Redox Signal. 2010, 12, 657–674. [Google Scholar] [CrossRef] [Green Version]
  19. Mattson, M.P.; Gleichmann, M.; Cheng, A. Mitochondria in Neuroplasticity and Neurological Disorders. Neuron 2008, 60, 748–766. [Google Scholar] [CrossRef] [Green Version]
  20. Feno, S.; Butera, G.; Vecellio Reane, D.; Rizzuto, R.; Raffaello, A. Crosstalk between Calcium and ROS in Pathophysiological Conditions. Oxid. Med. Cell. Longev. 2019, 2019, 9324018. [Google Scholar] [CrossRef] [Green Version]
  21. Hidalgo, C.; Carrasco, M.A.; Muñoz, P.; Núñez, M.T. A Role for Reactive Oxygen/Nitrogen Species and Iron on Neuronal Synaptic Plasticity. Antioxid. Redox Signal. 2007, 9, 245–255. [Google Scholar] [CrossRef]
  22. Yermolaieva, O.; Brot, N.; Weissbach, H.; Heinemann, S.H.; Hoshi, T. Reactive Oxygen Species and Nitric Oxide Mediate Plasticity of Neuronal Calcium Signaling. Proc. Natl. Acad. Sci. USA 2000, 97, 448–453. [Google Scholar] [CrossRef] [PubMed] [Green Version]
  23. Milkovic, L.; Cipak Gasparovic, A.; Cindric, M.; Mouthuy, P.-A.; Zarkovic, N. Short Overview of ROS as Cell Function Regulators and Their Implications in Therapy Concepts. Cells 2019, 8, 793. [Google Scholar] [CrossRef] [PubMed] [Green Version]
  24. Di Meo, S.; Reed, T.T.; Venditti, P.; Victor, V.M. Role of ROS and RNS Sources in Physiological and Pathological Conditions. Oxid. Med. Cell. Longev. 2016, 2016, 1245049. [Google Scholar] [CrossRef] [PubMed]
  25. Lushchak, V.I. Glutathione Homeostasis and Functions: Potential Targets ForMedical Interventions. J. Amino Acids 2012, 2012, 736837. [Google Scholar] [CrossRef] [Green Version]
  26. Kerksick, C.; Willoughby, D. The Antioxidant Role of Glutathione and N-Acetyl-Cysteine Supplements and Exercise-Induced Oxidative Stress. J. Int. Soc. Sports Nutr. 2005, 2, 38. [Google Scholar] [CrossRef] [PubMed] [Green Version]
  27. Wei, Y.; Lu, M.; Mei, M.; Wang, H.; Han, Z.; Chen, M.; Yao, H.; Song, N.; Ding, X.; Ding, J.; et al. Pyridoxine Induces Glutathione Synthesis via PKM2-Mediated Nrf2 Transactivation and Confers Neuroprotection. Nat. Commun. 2020, 11, 941. [Google Scholar] [CrossRef] [PubMed] [Green Version]
Figure 1. 2 D structures of D2AAK1 derivatives.
Molecules 27 02239 g001
Figure 2. (A). Metabolic activity of HT-22 cells treated with compounds 110 for 48 h. All experimental groups were compared using one-way ANOVA of variance with Dunnett’s post hoc test; mean ± SD, n = 9. Statistically significant results are displayed as: * p < 0.05; ** p < 0.01; *** p < 0.001. (B) Metabolic activity of HT-22 cells treated with compounds 1120 for 48 h. All experimental groups were compared using one-way ANOVA of variance with Dunnett’s post hoc test; mean ± SD, n = 9. Statistically significant results are displayed as: * p < 0.05; ** p < 0.01; *** p < 0.001.
Molecules 27 02239 g002aMolecules 27 02239 g002b
Figure 3. Intracellular calcium (Ca2+) level of HT-22 cells treated with compounds 120 (A) for 48 h and representative images (B). All experimental groups were compared using one-way ANOVA of variance with Dunnett’s post hoc test; mean ± SD, n = 9. Statistically significant results are displayed as: * p < 0.05. Green fluorescence—FITC. Magnification of the objective lens 10×.
Molecules 27 02239 g003
Figure 4. Nitric oxide (NO) level of HT-22 cells treated with compounds 120 (A) for 48 h and representative images (B). All experimental groups were compared using one-way ANOVA of variance with Dunnett’s post hoc test; mean ± SD, n = 9. Statistically significant results are displayed as: *** p < 0.001. Green fluorescence—FITC. Magnification of the objective lens 10×.
Molecules 27 02239 g004
Figure 5. Reactive oxygen species (ROS) level of HT-22 cells treated with compounds 120 (A) for 48 h and representative images (B). All experimental groups were compared using one-way ANOVA of variance with Dunnett’s post hoc test; mean ± SD, n = 9. Statistically significant results are displayed as: * p < 0.05; ** p < 0.01; *** p < 0.001. Red fluorescence—Texas Red. Magnification of the objective lens 10×.
Molecules 27 02239 g005
Figure 6. Reduced glutathione (thiol) level of HT-22 cells treated with compounds 120 (A) for 48 h and representative images (B). All experimental groups were compared using one-way ANOVA of variance with Dunnett’s post hoc test; mean ± SD, n = 9. Statistically significant results are displayed as: * p < 0.05; ** p < 0.01; *** p < 0.001. Blue fluorescence—DAPI. Magnification of the objective lens 10×.
Molecules 27 02239 g006
Table 1. Summary of statistical differences of all experimental sets. Statistically significant results are displayed as: * p < 0.05; ** p < 0.01; *** p < 0.001.
HT-22
D2AAK11234567891011121314151617181920
MTT*********************ns*******************ns***nsnsns
Ca2+***nsnsnsnsnsnsnsnsnsnsnsnsnsnsns*nsnsns*
NOns************************************************************
ROSnsnsnsnsnsns*ns**nsns***nsnsnsns*ns***ns
Thiolnsns***ns**************nsnsns********nsns*********
Publisher’s Note: MDPI stays neutral with regard to jurisdictional claims in published maps and institutional affiliations.

