
Modified Natural Rubber as a Simple Chemical Sensor with Smartphone Detection for Formaldehyde Content in a Seafood Sample


 ,
,  and
and
Abstract
:1. Introduction
2. Results and Discussion
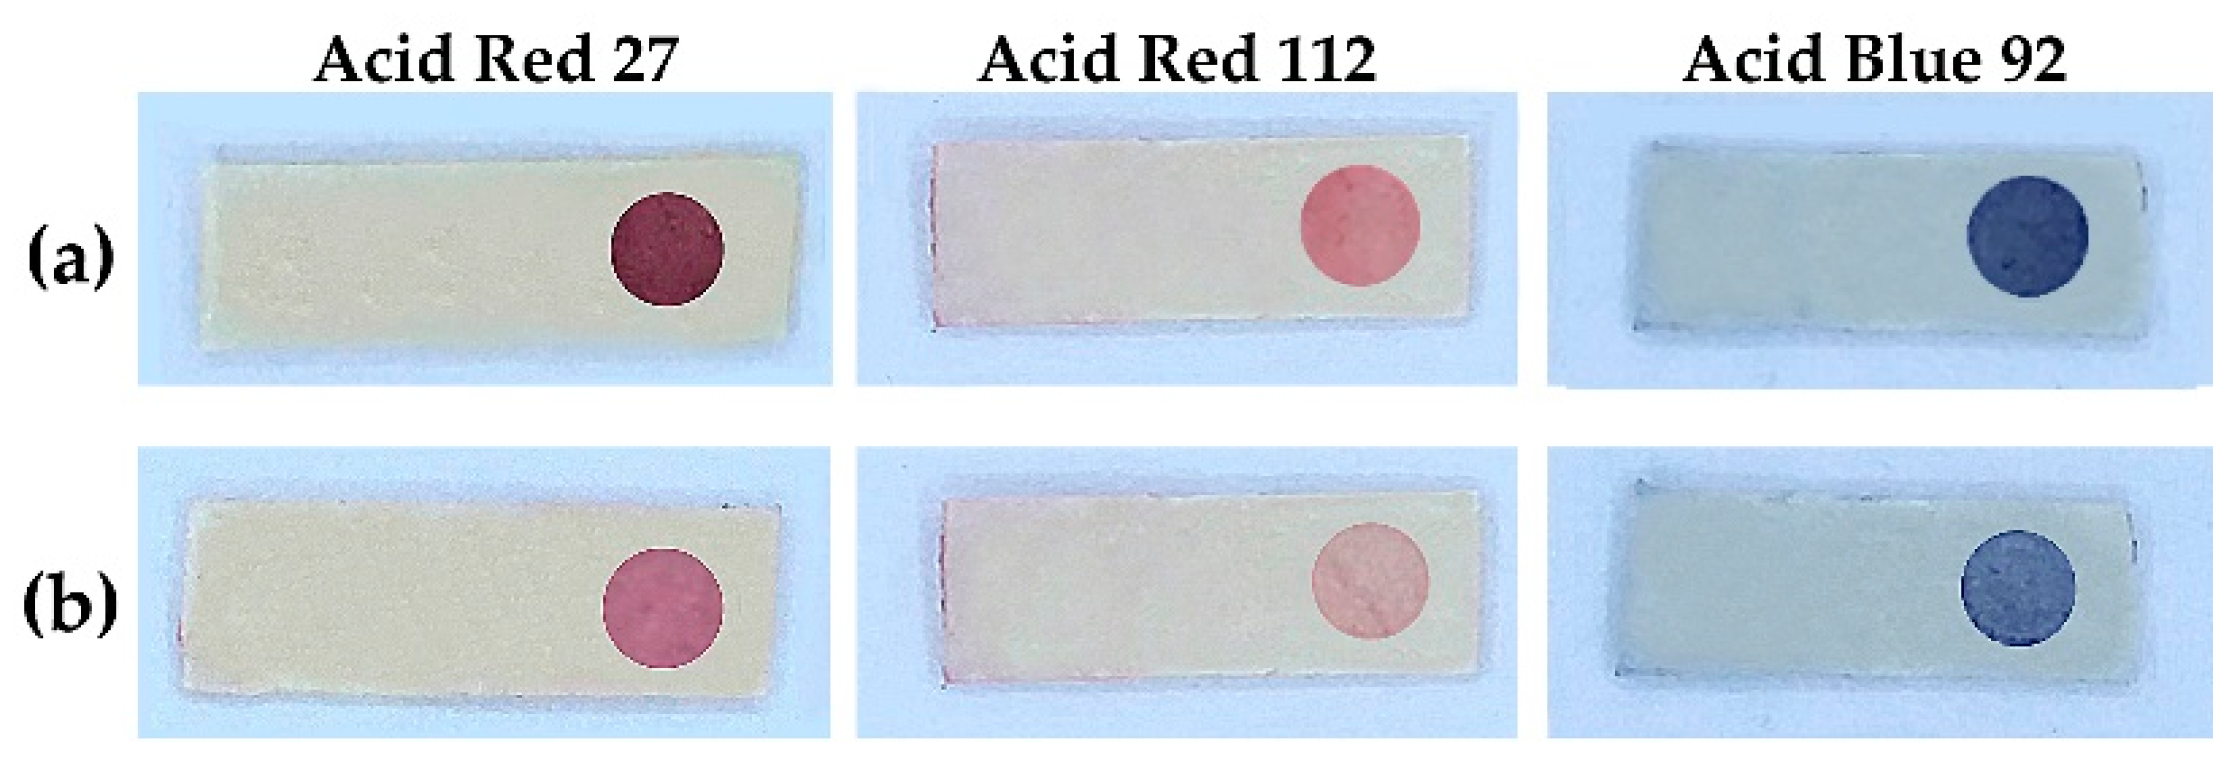
2.1. The Sensor
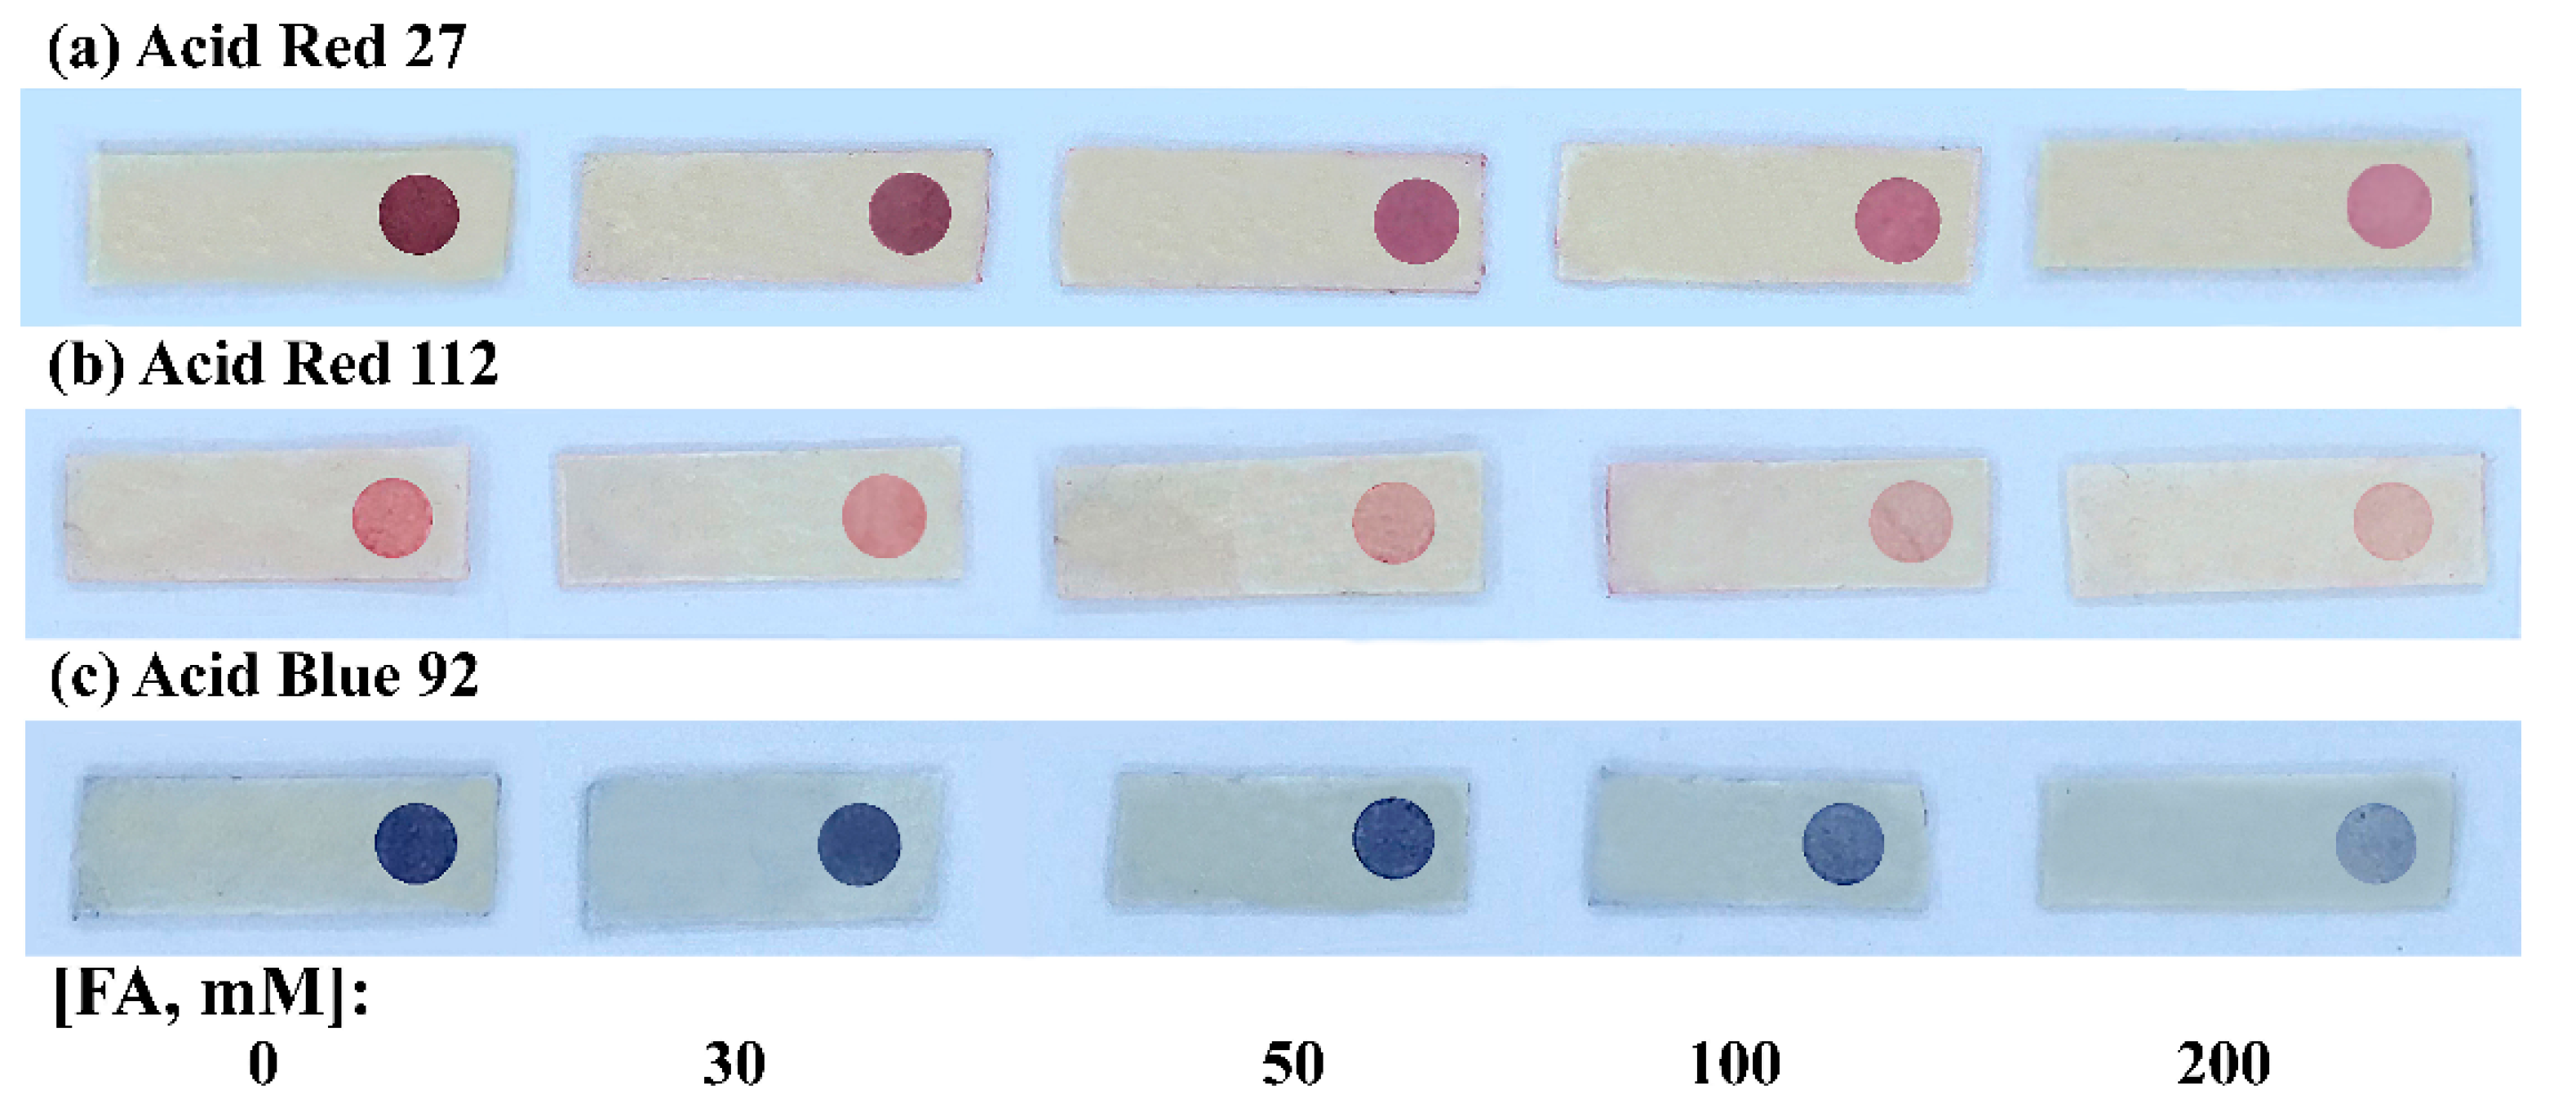
2.2. Sensing and Evaluation for FA
2.2.1. Effect of pH
2.2.2. Exposing Condition
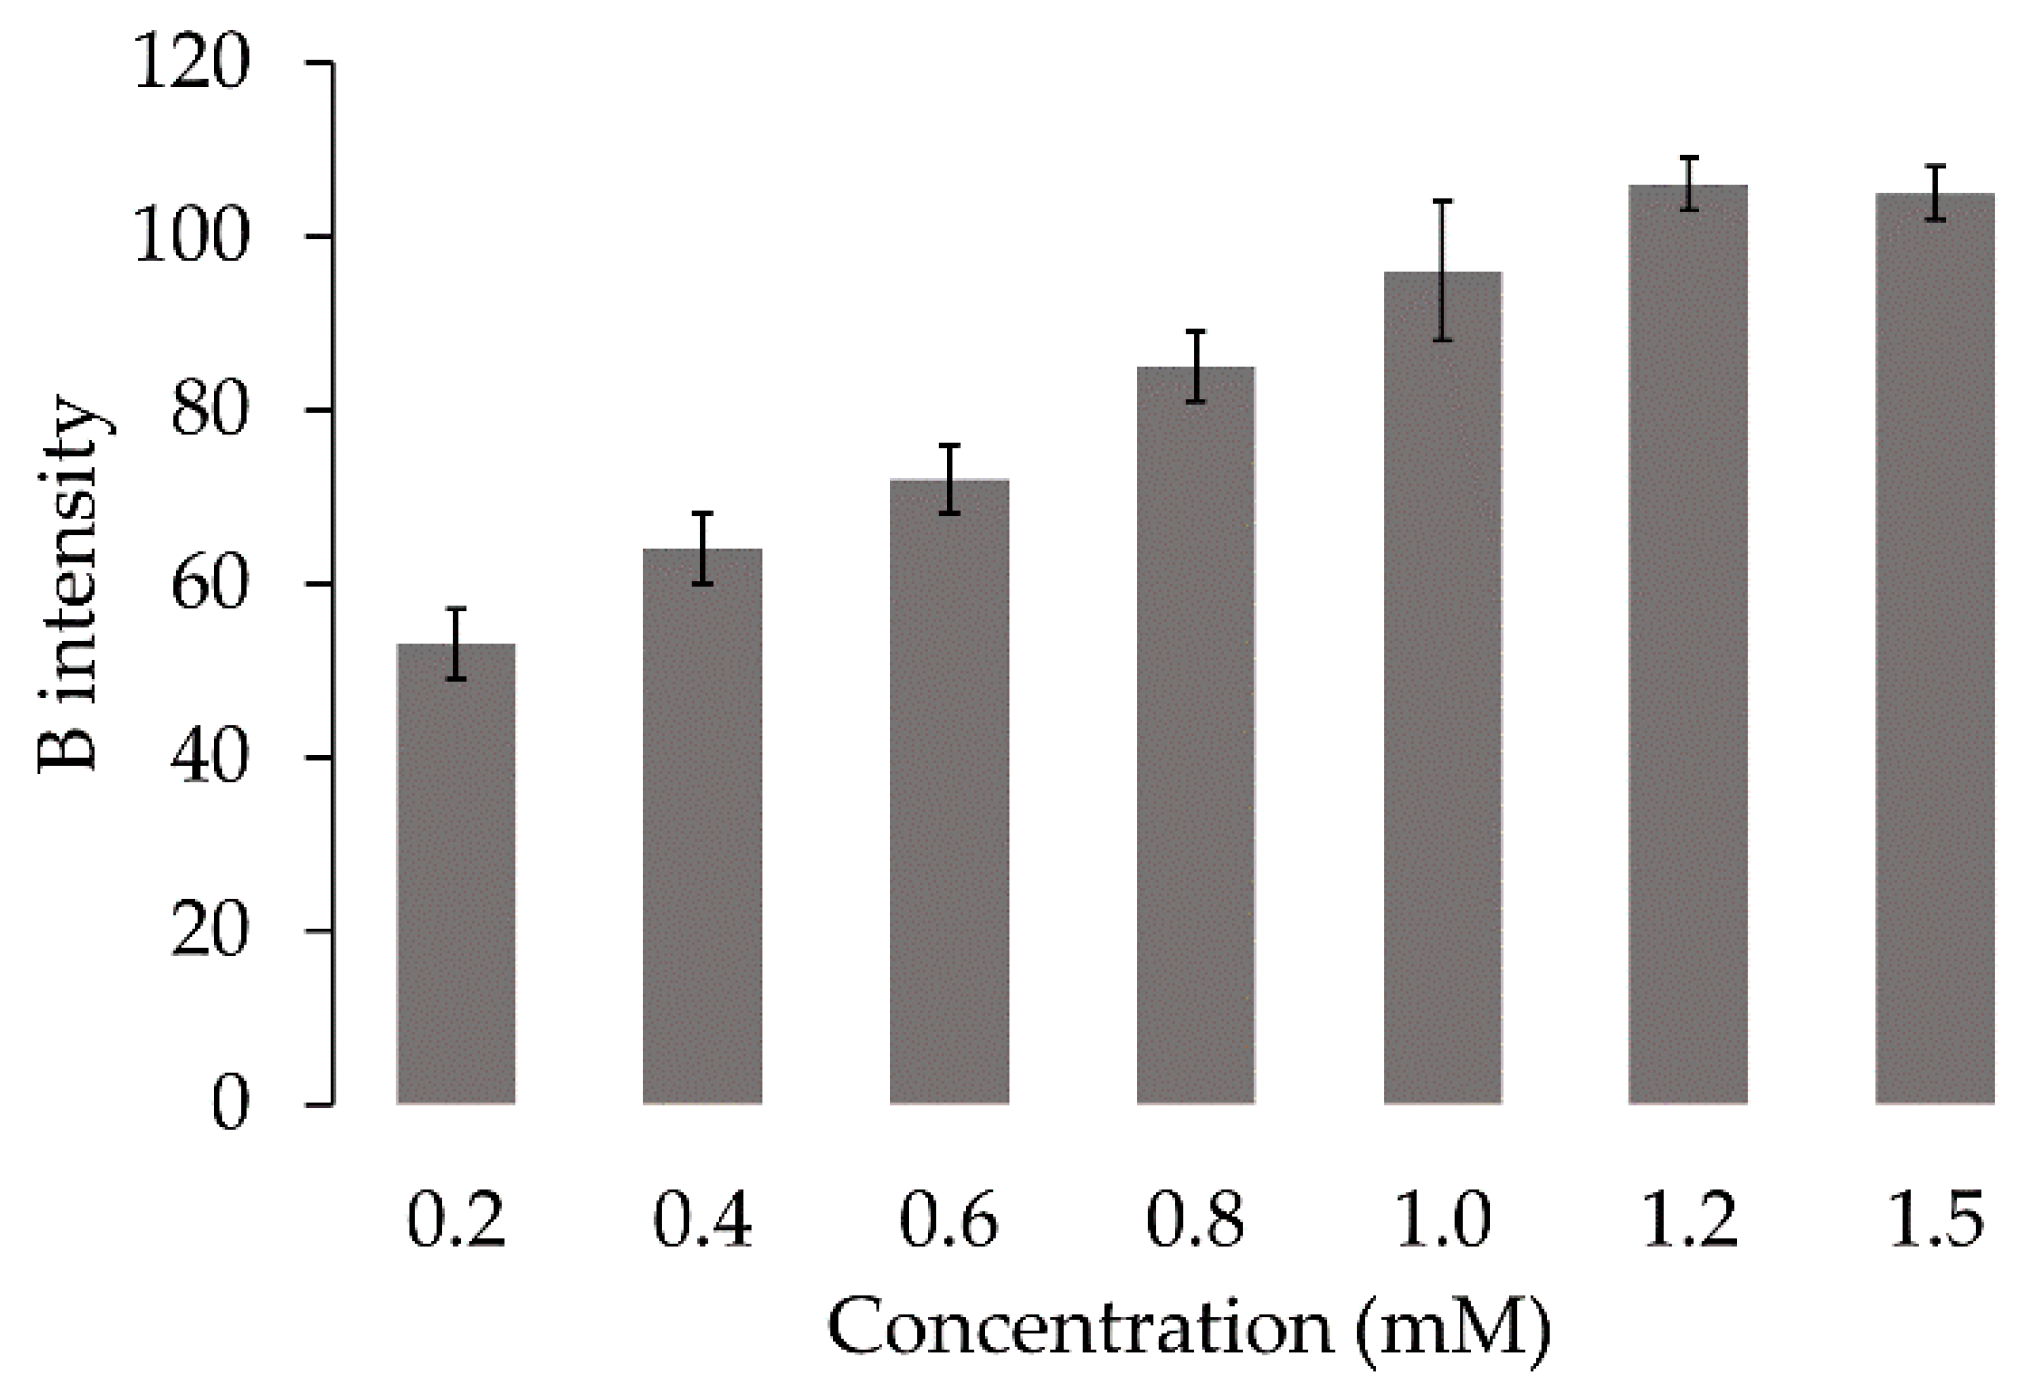
2.2.3. Analytical Performance
Statistical Treatment in Connecting to the Evaluation
Analytical Characteristics
Interferences Study
2.3. Applications to Real Sample
3. Materials and Methods
3.1. Chemicals and Reagents
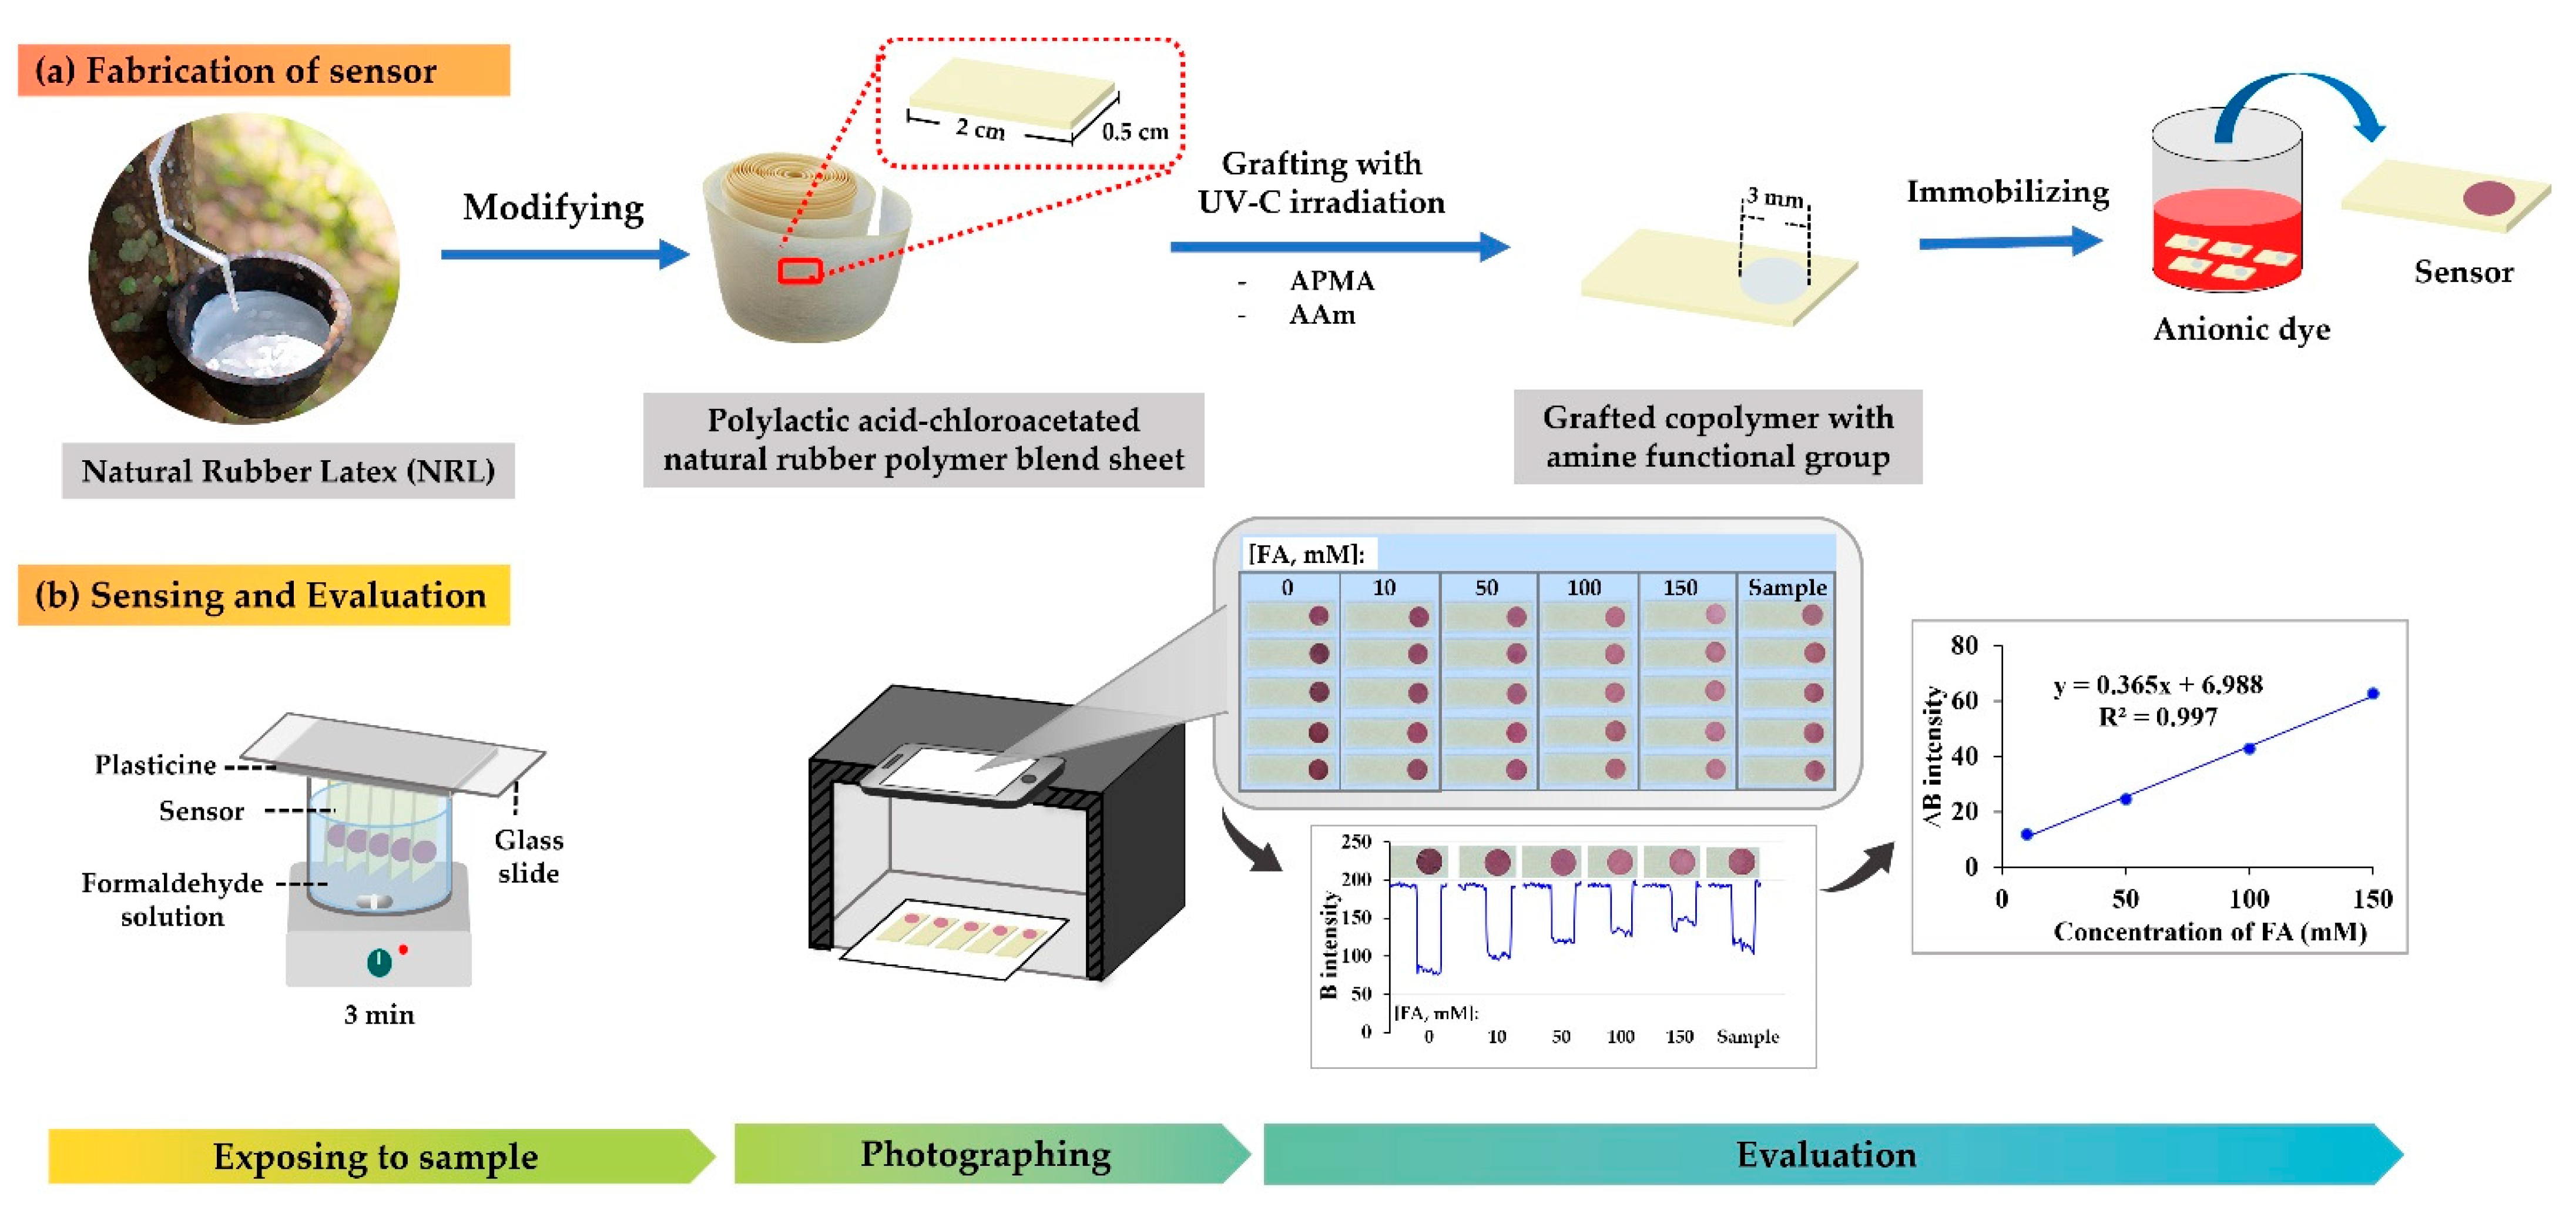
3.2. Fabrication of Sensor
3.3. The Procedure for FA Assay Using the Proposed Sensor with a Smartphone and Image Processing
3.4. Sample Preparation
3.5. Reference Method
4. Conclusions
Supplementary Materials
Author Contributions
Funding
Institutional Review Board Statement
Informed Consent Statement
Data Availability Statement
Acknowledgments
Conflicts of Interest
Sample Availability
References
- International Agency for Research on Cancer (IARC). Formaldehyde, 2-Butoxyethanol and 1-tert- Butoxypropan-2-ol; World Health Organization: Lyon, France, 2006.
- Weng, X.; Chon, C.H.; Jiang, H.; Li, D. Rapid detection of formaldehyde concentration in food on a polydimethylsiloxane (PDMS) microfluidic chip. Food Chem. 2009, 114, 1079–1082. [Google Scholar] [CrossRef]
- Laly, S.J.; Priya, E.R.; Panda, S.K.; Zynudheen, A.A. Formaldehyde in Seafood: A review. Fish. Technol. 2018, 55, 87–93. [Google Scholar]
- Jinadasa, B.K.K.K.; Elliott, C.; Jayasinghe, G.D.T.M. A review of the presence of formaldehyde in fish and seafood. Food Control 2022, 136, 108882. [Google Scholar] [CrossRef]
- Li, J.; Zhu, J.; Ye, L. Determination of formaldehyde in squid by high performance liquid chromatography. Asia Pac. J. Clin. Nutr. 2007, 16, 127–130. [Google Scholar]
- Wang, H.; Ding, J.; Du, X.; Sun, X.; Chen, L.; Zeng, Q.; Xu, Y.; Zhang, X.; Zhao, Q.; Ding, L. Determination of formaldehyde in fruit juice based on magnetic strong cation-exchange resin modified with 2,4-dinitrophenylhydrazine. Food Chem. 2012, 131, 380–385. [Google Scholar] [CrossRef]
- Safari, M.; Yamini, Y.; Tahmasebi, E.; Latifeh, F. Extraction and preconcentration of formaldehyde in water by polypyrrole-coated magnetic nanoparticles and determination by high-performance liquid chromatography. J. Sep. Sci. 2015, 38, 3421–3427. [Google Scholar] [CrossRef] [PubMed]
- Deng, Z.; Hu, K.; Zhang, Y.; Zhao, W.; Wang, F.; Guo, L.; Zhang, W.; He, J.; Huang, Y.; Zhang, S. On-cartridge derivatisation using a calixarene solid-phase extraction sorbent for facile, sensitive and fast determination of formaldehyde in beer. Food Chem. 2016, 211, 314–319. [Google Scholar] [CrossRef]
- Yeh, T.S.; Lin, T.C.; Chen, C.C.; Wen, H.M. Analysis of free and bound formaldehyde in squid and squid products by gas chromatography-mass spectrometry. J. Food Drug Anal. 2013, 21, 190–197. [Google Scholar] [CrossRef] [Green Version]
- Nash, T. The colorimetric estimation of formaldehyde by means of the Hantzsch reaction. Biochem. J. 1953, 55, 416–421. [Google Scholar] [CrossRef] [PubMed] [Green Version]
- Bechmann, I.E. Comparison of the formaldehyde content found in boiled and raw mince of frozen saithe using different analytical methods. Lebensm.-Wiss. Technol. 1998, 31, 449–453. [Google Scholar] [CrossRef]
- Abdullah, S.A.; Hashim, Z.; Bakar, F.A. Health risk assessment of adults consuming commercial fish contaminated with formaldehyde. Food Public Health 2013, 3, 52–58. [Google Scholar]
- Wongniramaikul, W.; Limsakul, W.; Choodum, A. A biodegradable colorimetric film for rapid low-cost field determination of formaldehyde contamination by digital image colorimetry. Food Chem. 2018, 249, 154–161. [Google Scholar] [CrossRef]
- Rovina, K.; Vonnie, J.M.; Shaeera, S.N.; Yi, S.X.; Halid, N.F.A. Development of biodegradable hybrid polymer film for detection of formaldehyde in seafood products. Sens. Bio-Sens. Res. 2020, 27, 100310. [Google Scholar] [CrossRef]
- Guzman, J.M.C.C.; Tayo, L.L.; Liu, C.-C.; Wang, Y.-N.; Fu, L.-M. Rapid microfluidic paper-based platform for low concentration formaldehyde detection. Sens. Actuators B. 2018, 255, 3623–3629. [Google Scholar] [CrossRef]
- Liu, C.-C.; Wang, Y.-N.; Fu, L.-M.; Huang, Y.-H. Microfluidic paper-based chip platform for formaldehyde concentration detection. Chem. Eng. J. 2018, 332, 695–701. [Google Scholar] [CrossRef]
- Sawamura, R.; Koyama, T.; Matsuzawa, T. Determination of formaldehyde in food (I). Shokuhin Eiseigaku Zasshi (Food Hyg. Saf. Sci.) 1962, 3, 280–283. [Google Scholar] [CrossRef]
- Boeri, R.L.; Almandós, M.; Ciarlo, A.S.; Giannini, D.H. Formaldehyde instead of dimethylamine determination as a measure of total formaldehyde formed in frozen Argentine hake (Merluccius hubbsi). Int. J. Food Sci. Technol. 1993, 28, 289–292. [Google Scholar] [CrossRef]
- Liou, Y.L.; Ericson, M.E.; Warshaw, E.M. Formaldehyde release from baby wipes: Analysis using the chromotropic acid method. Dermatitis 2019, 30, 207–212. [Google Scholar] [CrossRef] [PubMed]
- Taarab, N.; Sameenoi, Y. Rapid screening of formaldehyde in food using paper-based titration. Anal. Chim. Acta. 2019, 1069, 66–72. [Google Scholar]
- Walker, J.F. Formaldehyde, 1st ed.; Reinhold Publishing Corporation: New York, NY, USA, 1944; pp. 257–275. [Google Scholar]
- US Department of Health and Human Services. NIOSH Manual of Analytical Methods (NMAM), 5th ed.; National Institute for Occupational Safety and Health (NIOSH): Washington, DC, USA, 2017.
- Denda, T.; Mizutani, R.; Iijima, M.; Nakahashi, H.; Yamamoto, H.; Kanekiyo, Y. Thin films exhibiting multicolor changes induced by formaldehyde-responsive release of anionic dyes. Talanta 2015, 144, 816–822. [Google Scholar] [CrossRef] [PubMed]
- Nilghaz, A.; Mousavi, S.D.; Li, M.; Tian, J.; Cao, R.; Wang, X. Paper-based microfluidics for food safety and quality analysis. Trends Food Sci. Technol. 2021, 118, 273–284. [Google Scholar] [CrossRef]
- Guan, T.; Xu, Z.; Wang, J.; Liu, Y.; Shen, X.; Li, X.; Sun, Y.; Lei, H. Multiplex optical bioassays for food safety analysis: Toward on-site detection. Compr. Rev. Food Sci Food Saf. 2022, 21, 1627–1656. [Google Scholar] [CrossRef] [PubMed]
- Hermanson, G.T. Bioconjugate Techniques, 2nd ed.; Academic Press: London, UK, 2008; pp. 200–201. [Google Scholar]
- Jayawardane, B.M.; Wongwilai, W.; Grudpan, K.; Kolev, S.D.; Heaven, M.W.; Nash, D.M.; McKelvie, I.D. Evaluation and ap plication of a paper-based device for the determination of reactive phosphate in soil solution. J. Environ. Qual. 2014, 43, 1081–1085. [Google Scholar] [CrossRef] [Green Version]
- Miller, J.N.; Miller, J.C. Statistics and Chemometrics for Analytical Chemistry, 6th ed.; Pearson Education Limited: Essex, UK, 2010; pp. 110–126. [Google Scholar]
- Boochathum, P.; Rongtongaram, N. Influence of chloroacetate group on physical properties of natural rubber and its interaction with fillers. J. Appl. Polym. Sci. 2016, 133, 43076. [Google Scholar] [CrossRef]
- Silva, A.F.S.; Gonçalves, I.C.; Rocha, F.R.P. Smartphone-based digital images as a novel approach to determine formaldehyde as a milk adulterant. Food Control 2021, 125, 107956. [Google Scholar] [CrossRef]
- Silva, A.F.S.; Godoy, B.B.R.; Gonçalves, I.C.; Martins, L.C.; Rocha, F.R.P. Novel approach for screening milk based on fast and environmentally friendly determination of protein and fat. J. Food Compost. Anal. 2021, 104, 104178. [Google Scholar] [CrossRef]

| Samples 1 | Concentration of FA (mM) | tcalculated | |
|---|---|---|---|
| Proposed Method (n = 5) | Reference Method [20] (n = 3) | ||
| SQ1 | 32 ± 7 | 31 ± 1 | 0.24 |
| SQ2 | 26 ± 4 | 29 ± 1 | 1.24 |
| SQ3 | 36 ± 7 | 37 ± 1 | 0.24 |
| CS1 | 52 ± 6 | 56 ± 1 | 1.11 |
| CS2 | 70 ± 6 | 75 ± 1 | 1.39 |
| MS | ND | ND | − |
Publisher’s Note: MDPI stays neutral with regard to jurisdictional claims in published maps and institutional affiliations. |
© 2022 by the authors. Licensee MDPI, Basel, Switzerland. This article is an open access article distributed under the terms and conditions of the Creative Commons Attribution (CC BY) license (https://creativecommons.org/licenses/by/4.0/).
Share and Cite
Yeerum, C.; Issarangkura Na Ayutthaya, P.; Kesonkan, K.; Kiwfo, K.; Boochathum, P.; Grudpan, K.; Vongboot, M. Modified Natural Rubber as a Simple Chemical Sensor with Smartphone Detection for Formaldehyde Content in a Seafood Sample. Molecules 2022, 27, 2159. https://doi.org/10.3390/molecules27072159
Yeerum C, Issarangkura Na Ayutthaya P, Kesonkan K, Kiwfo K, Boochathum P, Grudpan K, Vongboot M. Modified Natural Rubber as a Simple Chemical Sensor with Smartphone Detection for Formaldehyde Content in a Seafood Sample. Molecules. 2022; 27(7):2159. https://doi.org/10.3390/molecules27072159
Chicago/Turabian StyleYeerum, Chonnipa, Piyanat Issarangkura Na Ayutthaya, Kullapon Kesonkan, Kanokwan Kiwfo, Ploenpit Boochathum, Kate Grudpan, and Monnapat Vongboot. 2022. "Modified Natural Rubber as a Simple Chemical Sensor with Smartphone Detection for Formaldehyde Content in a Seafood Sample" Molecules 27, no. 7: 2159. https://doi.org/10.3390/molecules27072159
APA StyleYeerum, C., Issarangkura Na Ayutthaya, P., Kesonkan, K., Kiwfo, K., Boochathum, P., Grudpan, K., & Vongboot, M. (2022). Modified Natural Rubber as a Simple Chemical Sensor with Smartphone Detection for Formaldehyde Content in a Seafood Sample. Molecules, 27(7), 2159. https://doi.org/10.3390/molecules27072159