Abstract
Withania somnifera is a traditional Indian herb described under the ‘Rasayana’ class in Ayurveda, which gained immense popularity as a dietary supplement in the USA, Europe, Asia, and the Indian domestic market. Despite enormous research on the pharmacological effect of withanosides and withanolides, bioanalytical method development and pharmacokinetics remained challenging and unexplored for these constituents due to isomeric and isobaric characteristics. In current research work, molecular descriptors, pharmacokinetic, and toxicity prediction (ADMET) of these constituents were performed using Molinspiration and admetSAR tools. A rapid, selective, and reproducible bioanalytical method was developed and validated for seven withanosides and withanolides as per USFDA/EMA guidelines, further applied to determine pharmacokinetic parameters of Withania somnifera root extract (WSE) constituents in male Sprague Dawley rats at a dose of 500 mg/kg. Additionally, an ex vivo permeability study was carried out to explore the absorption pattern of withanosides and withanolides from the intestinal lumen. In silico, ADMET revealed oral bioavailability of withanosides and withanolides following Lipinski’s rules of five with significant absorption from the gastrointestinal tract and the ability to cross the blood-brain barrier. Upon oral administration of WSE, Cmax was found to be 13.833 ± 3.727, 124.415 ± 64.932, 57.536 ± 7.523, and 7.283 ± 3.341 ng/mL for withanoside IV, withaferin A, 12-Deoxy-withastramonolide, and withanolide A, respectively, with Tmax of 0.750 ± 0.000, 0.250 ± 0.000, 0.291 ± 0.102, and 0.333 ± 0.129 h. Moreover, at a given dose, withanoside V, withanolide B, and withanone were detected in plasma; however, the concentration of these constituents was found below LLOQ. Thus, these four major withanoside and withanolides were quantified in plasma supported by ex vivo permeation data exhibiting a time-dependent absorption of withanosides and withanolides across the intestinal barrier. These composite findings provide insights to design a clinical trial of WSE as a potent nutraceutical.
1. Introduction
Herbal nutraceuticals and functional foods have gained worldwide popularity since the last decade due to increasing awareness about health among consumers and a steady increase in life expectancy [1]. Withania somnifera (Ashwagandha), also known as ‘Indian Winter Cherry,’ is a valuable herb used as ‘Rasayana’ to promote a youthful state for physical and mental health for over 3000 years [2,3,4]. The National Center for Complementary and Alternative Medicines (NCCAM) of the US National Institute of Health has recently declared ‘Ashwagandha’ a high-priority topic for mechanistic research in humans [5]. The recent report published states total sales of $13.7 million for Withania somnifera in the natural retail market along with it being the third highest-selling product (with 45.2% sale growth; reached $10.8 million) after cannabidiol (CBD) and elderberry [6]. Roots of Withania somnifera have been used to prepare a tonic that enhances longevity, revitalizes the body, arrests the aging process, and augments a defense against dreadful diseases, such as cancer, Alzheimer’s, and epilepsy [7,8]. It has diversified pharmacological activities, including adaptogenic, anti-inflammatory, anti-stress, antioxidant, hepatoprotective, immunomodulatory, memory enhancer, neuroprotector, etc. [9,10,11,12,13,14,15].
Withania species consist of chemical constituents from diverse chemical classes, such as steroidal lactones, alkaloids, flavonoids, and tannins. More than 40 withanolides, 12 alkaloids, and numerous sitoindosides (withanolides consisting of a glucose molecule at C27) have been extracted and isolated from roots, berries, and aerial parts Withania somnifera. Different alkaloids, such as withanine, withananine, pseudowithanine, somniferine, and somniferinine can be isolated from the plant parts, specifically the leaves. However, the traditional Indian system of medicine called “Ayurveda” recommends using Withania somnifera roots for therapeutic purposes and internal administration. The chemical constituents of roots include withaferin A, withanolide A, withanolide B, 12-Deoxy-withastramonolide, and withanosides. Structures of withanolides and withanosides quantified from Withania somnifera root extract (WSE) is depicted in Figure 1.
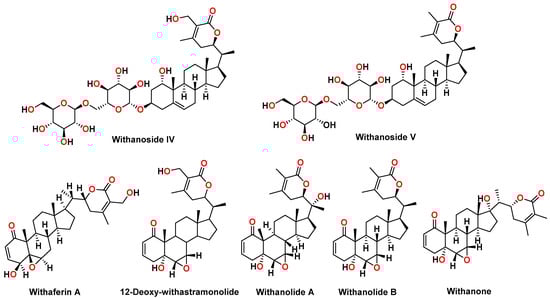
Figure 1.
Chemical structures of withanosides and withanolides from Withania somnifera root extract: withanoside IV, withanoside V, withaferin A, 12-Deoxy-withastramonolide, withanolide A, withanolide B, and withanone.
Due to the complexity in the characterization of chemical constituents of medicinal plants, establishing pharmacokinetic and pharmacodynamic (PK/PD) relationships remained a constant challenge. Subsequently, the characterization of absorbed compounds, pharmacokinetics, tissue distribution, and elimination pattern of constituents upon oral administration from the body is of great interest [16,17,18]. This collective data provides a critical endpoint to determine pharmacological and clinical efficacy, resulting in very little information on how the body behaves with the drug/extract ingested. Amongst chemical constituents, comparative and/or synergistic absorption, distribution, metabolism, and excretion (ADME), differentiating factors can be observed when the whole extract is given to an animal/human compared to the individual constituent.
Although, chemical constituents of Withania somnifera present good and relatable biological activities in pre-clinical and clinical studies. However, the route of administration, dosage, pharmacokinetics, and biopharmaceutical profile are unexplored. The preceding information was used to standardize bioactive withanosides and withanolides of WSE. Later, an in silico absorption, distribution, metabolism, excretion, toxicity (ADMET), and molecular properties prediction of these withanosides and withanolides was carried out using admetSAR online tools. Further, a validated bioanalytical method for simultaneous estimation of withanoside IV, withanoside V, withaferin A, 12-Deoxy-withastramonolide, withanolide A, withanolide B, and withanone in plasma was developed using UHPLC-MS/MS. This method was applied to determine the pharmacokinetic parameters of withanosides and withanolides of WSE in rat plasma. Additionally, the permeability characteristic of WSE and its constituents was estimated using an ex vivo permeability model. Therefore, the results of these studies could be used to validate clinical trials in human volunteers.
2. Results and Discussion
2.1. In Silico Molecular Properties and Absorption, Distribution, Metabolism, Excretion, and Toxicity (ADMET) Prediction
Molecular descriptors of WSE constituents were determined for Lipinski’s rule of five (ROF). The molecular weight of the constituents was found in the range of 450–500 g/mol except for withanoside IV (782.92 g/mol) and withanoside V (766.92 g/mol). Molecular weight is an essential aspect concerning the biological action because as the molecular weight increases, the bulkiness of the compounds also increases correspondingly, which in turn affects the drug action (Table 1).

Table 1.
Lipinski’s rule of five for constituents of Withania somnifera standardized root extract.
Lipophilicity (Log p value) and topological polar surface area (TPSA) are the two significant factors affecting the permeability of the compounds and determining oral bioavailability. TPSA can be defined as calculating the total surface area occupied by oxygen atoms, nitrogen atoms, and hydrogen atoms attached to these molecules. This points out a direct relation of the potential of hydrogen bonding with the TPSA value of the compound. The compounds having ≤140 Å TPSA value and rotational bonds ≤ 10 are more likely to have good bioavailability because rotational bonds give flexibility to the compound that can easily interact with specific rigid binding areas. Remarkably, here, five constituents of WSE demonstrated TPSA values under the specified limit.
In contrast, withanoside IV and withanoside V, showed higher TPSA values, which might be due to the structural diversity of the constituents in the extract. Subsequently, the Log p value of these constituents was calculated by Molinspiration software, where six constituents demonstrated a Log p value less than five. Withanolide B has a higher Log p value, which does not follow Lipinski’s rules of five.
Drug solubility is one of the critical parameters that affect pharmacokinetics and pharmacodynamics, right from the administration, absorption into the systemic circulation, movement in the blood, and excretion. Here, ADMET prediction was carried out using the online dataset admetSAR. Permeability through various biological barriers, i.e., the blood-brain barrier (BBB), human intestinal absorption (HIA), human colorectal adenocarcinoma cell (Caco-2) permeability, and renal organic cation transport, was calculated. The ADMET characteristics majorly represented the probability to predict the certainty of the characteristic between 0–1 that gives an idea about the pharmacokinetics of the drug candidate through the prediction database. All the seven constituents of WSE can be absorbed from the intestine. Based on the results, five constituents, namely withaferin A, 12-Deoxy-withastramonolide, withanolide A, withanolide B, and withanone, might cross the BBB with the probability of >0.8, while withanoside IV and withanoside V could not cross the BBB. The in silico study indicates that withaferin A and 12-Deoxy-withastramonolide have the maximum oral bioavailability in the systemic circulation, supported by an in vivo pharmacokinetic study. The cytochrome enzymes are involved in drug metabolism for elimination and/or biotransformation. Prominent drug-drug interactions are reported due to the selective activation or inhibition of the cytochrome P450 (CYP) enzymes. Therefore, there is a possibility that the drug might be accumulated to a toxic level due to inhibition of CYP enzymes or rapidly excreted due to activation of CYP microsomal enzymes. Here, withanosides and withanolides could act as a substrate for the CYP450 3A4 enzyme while a non-substrate for CYP450 2C9 and CYP450 2D6 enzymes. Further, the results indicate that constituents of WSE were non-inhibitors for CYP450 1A2, CYP450 2C9, CYP450 2D6, CYP450 2C19, and CYP450 3A4 enzymes. A non-inhibitor of CYP450 suggests that the constituents might not hamper the biotransformation of drugs metabolized by the CYP450 enzyme. In pharmacology, P-glycoproteins are the major reason for drug resistance or making the cell less susceptible to the drugs. They are mainly involved in the efflux and activation of P-glycoprotein (P-gp), which would increase the drug’s efflux and create drug concentration below the minimum required concentration, leading to therapeutic failures. Interestingly, all the seven quantified constituents of WSE were non-inhibitors of P-glycoprotein. The carcinogenic and mutagenic potential has a direct or indirect correlation with the molecular properties of the compounds. All constituents were found to be non-AMES toxic, which was also supported by our in vitro AMES (mutagenicity) assay of WSE. Further, these constituents were found to be non-carcinogenic, while acute oral toxicity prediction revealed that, except for withanoside IV and withanoside V, other constituents come under toxicity Class I. Here, the predicted carcinogenicity, acute rat toxicity, fish toxicity, and tetrahymena pyriformis toxicity are summarized in Table 2.
Table 2.
Results of ADMET prediction of Withania somnifera extract constituents.
2.2. Quantification of Withania somnifera Root Extract
The quantitative estimation of WSE (n = 3) constituents, namely withanoside IV, withanoside V, withaferin A, 12-Deoxy-withastramonolide, withanolide A, withanolide B, and withanone, are depicted in Table 3.
Table 3.
Quantification of Withania somnifera extract (WSE) (n = 3; %, w/w).
2.3. Chromosomal Aberration (Genotoxicity) Assay of Withania somnifera Root Extract
Withania somnifera extract was evaluated at three different concentrations (0.25 mg/mL, 0.50 mg/mL, and 1.00 mg/mL) for chromosomal aberration assay as per the OECD 473 guideline. In the case of the untreated control, % chromosome aberration was found to be 4% without a metabolic activation system (Phase I) and with a metabolic activation system (Phase II). In the case of the negative control, it was found that % chromosome aberration in Phase I and Phase II activation system was 5%. In contrast, in the positive control, it was found that the % chromosome aberration in Phase I and Phase II activation system were 21% and 52%, respectively. Treatment with 0.25, 0.50, and 1.00 mg/mL WSE revealed that % chromosome aberration without the metabolic activation system was 5% while it was also found to be 5% with the metabolic activation system. The microscopical observations and data calculations demonstrate that the WSE did not cause chromosomal aberration more than the positive controls mitomycin C (Phase I) and cyclophosphamide (Phase II).
Further, it was found that the ratio between positive to negative control is more than two, while the WSE to the negative control is less than two. Hence, it was observed that WSE is non-cytogenetic in Phase I and Phase II studies. The results of chromosomal aberration are represented in Table 4.
Table 4.
Chromosomal aberration assay of Withania somnifera root extract.
2.4. Salmonella typhimurium Reverse Mutation Assay (AMES) Assay
A mutagenicity study was performed to determine the potential of WSE to induce gene mutations compared to the negative control according to the plate incorporation test (Trial I) and pre-incubation test (Trial II). Results revealed that, when treated with WSE, no significant increase in colony numbers was observed in Salmonella typhimurium strains at any dose level, neither in the presence nor in the absence of metabolic activation. There was no tendency of higher mutation with increasing concentration of WSE.
2.5. UHPLC-MS/MS Method Optimization
The chromatographic method was optimized with the separation of seven analytes, including two internal standards, within a 14 min run. In the ESI-MS spectra analysis, the charge distributions can be altered by adding buffers. Adduct formation could occur depending on the Lewis basicity of the compound in the presence of NH4+, Na+, and K+ or if Li+ or Ag+ are intentionally added to the sample. Therefore, withanoside IV was observed at Rt 1.25 min with the molecular formula C40H62O15 having a molecular weight of 782.92 g/mol gives the ammonium ion adduct at m/z 800.45 [M+NH4]+, while withanoside V (C40H62O14) was observed at the Rt 2.86 min with the molecular weight of 766.92 g/mol that gives the ammonium ion adduct at m/z 784.45 [M+NH4]+. Further, five withanolides were observed at different retention times, such as withaferin A and 12-Deoxy-withastramonolide having a similar molecular formula C28H38O6 with a molecular weight of 470.61 g/mol, and both give [M+H]+ ion at m/z 471.25. Later, withanolide A (C28H38O6) was observed at Rt 6.02 min with a molecular weight of 470.61 g/mol that gives the ammonium ion adduct at m/z 488.30 [M+NH4]+, while withanone gives the prominent fragment at m/z 417.25. Withanolide B was observed at Rt 8.23 min, which has a molecular formula of C28H38O5 that gives ammonium ion adduct at m/z 472.30. Internal standards fluoxymesterone demonstrated the molecular ion peaks at m/z 337.20 gives the protonated ion [M+H]+ and difenoconazole was observed at m/z 406.10 that gives [M]+. Further, MS/MS parameters were optimized on ESI with precursor and product ions in the MRM mode analysis. The MS/MS parameters were optimized for each analyte, as a source temperature, collision energy, and gas flow, based on detected ions and mass parameters. All seven analytes, including internal standards, demonstrated an optimum response in positive ESI mode with good sensitivity, reproducibility, and fragmentation. The optimized mass transition ion pairs (m/z) for quantification were optimized as 800.45/459.30 for withanoside IV, 784.45/443.30 for withanoside V, 471.25/67.05 for withaferin A, 471.25/67.05 for 12-Deoxy-withastramonolide, 488.30/471.25 for withanolide A, 472.30/109.15 for withanolide B and 417.25/263.15 for withanone, 337.20/91.15 for IS1 (fluoxymesterone), and 406.10/336.90 for IS2 (difenoconazole) (Table 5, Figure S1).
Table 5.
Precursor/product ion pairs and parameters for multiple reaction monitoring (MRM) of WSE constituents (Figure S1).
2.6. Sample Pre-Treatment for Bioanalysis
Due to the complex nature of plasma, a sample pre-treatment procedure is needed before LC-MS/MS analysis to eliminate protein and interferences. In the present study, good resolution and higher recovery of analytes were achieved by analyzing the samples spiked with different biological matrices and extraction methods (liquid-liquid extraction, solid-phase extraction, and protein precipitation). The solid-phase extraction technique using clean-up was finalized for the quantification of analytes.
2.7. UHPLC-MS/MS Method Validation
2.7.1. Specificity
The specificity was determined by comparing the retention times in chromatograms of plasma samples (with or without analytes) after oral administration of WSE. No interference of endogenous substances was observed between the retention times of withanoside IV, withanoside V, withaferin A, 12-Deoxy-withastramonolide, withanolide A, withanolide B, withanone, IS1, and IS2, indicating reasonable specificity of the method. In this method, no carry-over effect was observed.
2.7.2. Linearity and Lower Limit of Quantification (LLOQ)
The linearity of seven analytes with correlation coefficient (R2) was plotted, ranging from 0.9917 to 0.9976. The LLOQ of seven analytes was 3 ng/mL. The back-calculated concentration was within ±20% of nominal concentration, indicating the sensitivity of the proposed method. The calibration curve, LLOQ, and linearity for seven analytes are presented in Table S1.
2.7.3. Precision and Accuracy
The intra-day and inter-day precision (% RSD) and accuracy (% RE) of the seven analytes were found within acceptability criteria (within 15%), demonstrating that the developed method was accurate, precise, and reproducible for all seven analytes. The results of accuracy and precision are presented in Table S2.
2.7.4. Extraction Recovery and Matrix Effect
2.7.5. Dilution Integrity
Six replicates of samples at 25 μg/mL were diluted twenty times with blank rat plasma and were analyzed. The resulting concentrations were multiplied by the dilution factor of six. A negligible effect of dilution was observed (Table S5).
2.7.6. Stability
Autosampler stability (for 36 h), freeze/thaw cycles (−80 °C to −25 °C), long-term (−80 °C for 60 days), bench-top stability (for 4 h), and processed stability (for 4 h) of analytes in plasma determined % RE and % RSD and were found within ±15%. Results suggest that all the analytes were stable under the prescribed storage conditions. Extraction recovery data are represented in Table S6.
2.8. In Vivo Pharmacokinetic Study
The validated UHPLC-MS/MS method was applied to estimate seven constituents simultaneously after single-dose oral administration of WSE (500 mg/kg) (n = 6) in male Sprague Dawley rats. The four constituents were quantified at a first-time point (i.e., 15 min), excluding withanoside V, withanolide B, and withanone. LC-MS/MS chromatogram of four constituents after oral administration of WSE at the dose of 500 mg/kg in rats is shown in Figure 2. The mean plasma concentration vs. time curves of four constituents are shown in Figure 3. The pharmacokinetic parameters for the constituents of WSE were calculated and are listed in Table 6. The peak plasma concentrations (Cmax) were found to be 13.833 ± 3.727 ng/mL, 124.415 ± 64.932 ng/mL, 57.536 ± 7.523 ng/mL, and 7.283 ± 3.341 ng/mL for withanoside IV, withaferin A, 12-Deoxy-withastramonolide, and withanolide A, respectively, with observed Tmax of 0.750 ± 0.000, 0.250 ± 0.000, 0.291 ± 0.102, and 0.333 ± 0.129 h, respectively. Results indicate that withanosides and withanolides were rapidly absorbed from the stomach. The LLOQ values of withaferin A and 12-Deoxy-withastramonolide were found to be less than the Cmax/20 ratio, which indicates that the developed method was sensitive to determining the concentration of these constituents in the plasma. The area under the plasma concentration vs. time curve from 0–24 h (AUC(0–24h)) was found to be 13.960 ± 3.703, 161.180 ± 18.863, 82.866 ± 7.820, and 4.179 ± 1.032 h.ng/mL for withanoside IV, withaferin A, 12-Deoxy-withstramonolide, and withanolide A, respectively. The ratio of AUC(0–24h) to AUC(0–∞) was found to be 0.859 ± 0.057 and 0.904 ± 0.059 for withaferin A and 12-Deoxy-withastramonolide at nearly 1.00, which suggests that the sampling interval and calculated terminal half-life were appropriately selected. Further, the half-life (t1/2) of withanoside IV, withaferin A, 12-Deoxy-withstramonolide, and withanolide A was found to be 1.101 ± 0.272, 3.148 ± 0.612, 1.734 ± 0.505, and 0.728 ± 0.423 h and oral clearance (Cl/F) 0.176 ± 0.037, 0.026 ± 0.003, 0.016 ± 0.002, and 0.356 ± 0.090 (mg/kg)/(ng/mL)/h, respectively. Here, withanoside IV, withaferin A, and 12-Deoxy-withastramonolide demonstrated the greater extent of oral absorption from the stomach lining with a higher Cmax, lower half-life, and clearance. Withanoside IV has a higher molecular weight > 700 g/mol, yet polar due to the glucose moieties attached at the C3 position. It is known that the hydrophobic interior surface of the cell membrane (lipid bilayer) serves as a barrier to the passage of polar and high molecular weight molecules. Hence, withanoside IV was readily absorbed by passive diffusion, as it belongs to the biopharmaceutical classification system (BCS) Class-I (compounds with high solubility and high permeability). Further, the content of withanoside IV was 3.8715 mg/500 mg WSE, which is almost similar to withaferin A; however, a lower concentration in plasma was detected. This might be due to the gut glucosidase enzyme, which could hydrolyze compounds and form the aglycone part of withanoside IV with the loss of glycosidic linkages. Withaferin A and 12-Deoxy-withastramonolide were detected in the plasma up to 10 h, indicating that these constituents might have a lower elimination rate from the body. In contrast, the remaining two constituents, namely withanoside IV and withanolide A were not detected after 2 h, suggesting a low oral bioavailability of these constituents, which may be due to the extensive first-pass metabolism and rapid excretion from the body. Whereas withanoside V, withanolide B, and withanone were detected in the plasma after oral administration of the extract, the concentration of these constituents was found below LLOQ.
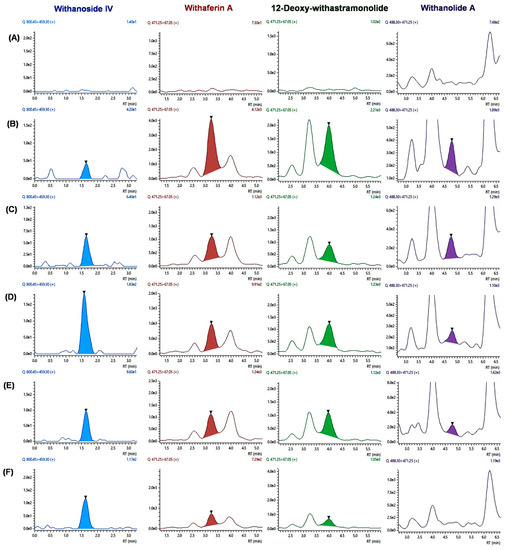
Figure 2.
LC-MS/MS chromatogram of four constituents after oral administration of WSE at the dose of 500 mg/kg in rats; (A) blank plasma; chromatograms of individual constituents at different time points; (B) 15 min; (C) 30 min; (D) 45 min; (E) 1 h; and (F) 2 h.
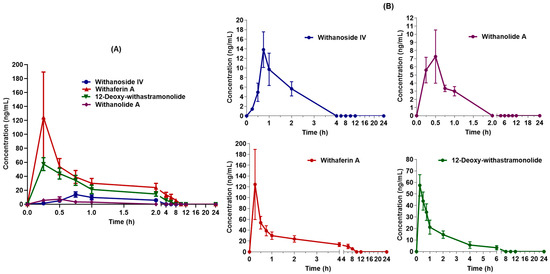
Figure 3.
Mean plasma concentration vs. time curves of four constituents quantified (A) overlay; (B) individual constituents after oral administration of Withania somnifera extract at the dose of 500 mg/kg in male Sprague Dawley rats (Mean ± SD, n = 6).
Table 6.
Pharmacokinetic parameters for withanosides and withanolides in rats upon oral administration of the extract at a dose of 500 mg/kg.
2.9. Ex Vivo Permeability Study
Estimation of Permeability
A linear absorption pattern was observed for all seven markers in the initial lag phase and later showed a plateau. The dQ/dt was determined from the slope of the linear phase. Therefore, the apparent permeability coefficient (Papp) was found to be 1.4174 × 10⁻⁷, 3.4254 × 10⁻⁸, 1.1252 × 10⁻⁷, 1.2221 × 10⁻⁷, 6.6487 × 10⁻⁸, 1.3065 × 10⁻⁸, 3.1746 × 10⁻⁸ cm/s for withanoside IV, withanoside V, withaferin A, 12-Deoxy-withastramonolide, withanolide A, withanolide B, and withanone, respectively (Table 7).
Table 7.
Apparent permeability of Withania Somnifera extract constituents from the intestinal mucosa.
In the present study, a simpler ex vivo permeability model was used to study the absorption pattern and apparent permeability characteristic using the ileocecal segment of the rat intestine. Considering the site-specific permeation of the xenobiotic agents with the pre-determined absorption window, a portable apparatus was developed to study permeability characteristics, and the length of the intestinal segment was kept at 3 cm. The study discloses the transport mechanism of seven prominent biomarkers of WSE across the intestinal barrier to illustrate drug absorption patterns. With advanced techniques, such as LC-MS/MS, these constituents were quantified upon permeation through the rat intestinal segment. The apparatus was attached to a 1 L reservoir and aeration pump to mimic the peristaltic movement and sink conditions. From the results, the constituents followed the passive diffusion absorption process. Initially, the constituents were readily absorbed and later achieved the steady-state concentration. Withanoside IV, withaferin A, and 12-Deoxy-withastramonolide have demonstrated maximum absorption from the donor compartment to the acceptor compartment. Here, with higher solubility, withanoside IV (Log p = 1.22) was readily transported across the intestinal barrier. At the same time, withanone and withanolide B were found at lower concentrations (Figure 4).
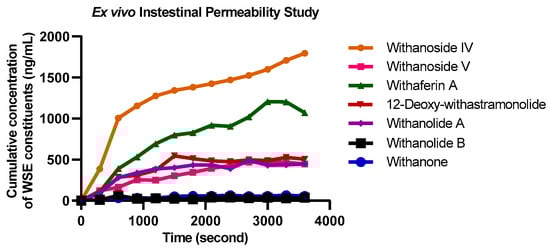
Figure 4.
Overlay absorption kinetics of Withania somnifera extract constituents using everted intestine apparatus (Mean ± SD, n = 6).
3. Discussion
Withania somnifera is a medicinal plant and is recognized as an ethnopharmacological functional food with diverse pharmacological properties. In pre-clinical studies, Withania somnifera root extract and its chemical constituents have proven to be active against several biological activities, such as aphrodisiac, adaptogenic, immunomodulatory, anti-inflammatory, anti-diabetic, hepatoprotective, anti-stress, anti-rheumatic, and neuroprotective [19,20,21,22,23,24,25,26]. Meanwhile, in clinical studies, WSE has been studied for insomnia, anxiety, stress, weight management, thyroid gland function, cardio-respiratory endurance, muscle strength, male and female sexual function recovery, bipolar disorders, and anti-aging activity [27,28,29,30]. This dietary supplement has been regulated and requires validated ADMET data to understand the bioavailability of WSE constituents. The pharmacokinetic parameters of WSE are still unexplored collectively with their significant constituents in the living system. The major phytoconstituents in ‘Ashwagandha’ root extract are withanoside IV, withanoside V, withaferin A, 12-Deoxy-withastramonolide withanolide A, withanolide B, and withanone [31]. Based on that, a precise, sensitive, and accurate bioanalytical method was developed to estimate seven withanosides and withanolides simultaneously in rat plasma. The validation of this novel bioanalytical method was carried out according to the USFDA/EMA guidelines in the presence of two internal standards, which results in linearity with R2 > 0.990. The lower limit of quantification (LLOQ) was found to be 3 ng/mL for all seven constituents of WSE.
Upon oral administration of WSE, except withanoside V, withanolide B, and withanone, four constituents were quantified appropriately in vivo, enabling us to understand how the body reacts to these constituents individually. Recently, Dai and Tianming et al. (2019) studied the oral bioavailability and first-pass metabolism of withaferin A (10 mg/kg oral dose; 5 mg/kg I.V. dose) in rats using LC-MS/MS and Q-TRAP. Results revealed that upon oral administration of withaferin A in male rats, a half-life of 7.6 ± 3.3 h and bioavailability of 32.4 ± 4.8% was observed. The Cmax and Tmax were found to be 619 ± 125 ng/mL and 0.11 ± 0.07 h [32]. Thaiparambil and Jose T. et al. (2011) reported a pharmacokinetic study of withaferin A on Balb/C mice at a dose of 4 mg/kg followed by a single intraperitoneal (I.P.) route of administration. The Cmax was found to be 1.8 µM at Tmax (0.083 h). The plasma half-life of withaferin A was 1.36 h, and the systemic exposure, AUC(0–t), was 1.09 µM.h. Clearance from plasma was rapid (0.151 L/h). Withaferin A was undetectable at 24 h and was found below LLOQ in all mice up to 6 h [33]. Gambhir L. et al. (2015) reported a pharmacokinetics and biodistribution study of withaferin A upon intraperitoneal administration using HPLC, which lacks the in vivo pharmacokinetics estimation of all seven biomarkers from WSE simultaneously [34]. Patil, Dada et al. (2013) developed a bioanalytical method to determine only withaferin A and withanolide A upon oral administration of the Withania somnifera aqueous extract at a dose of 1000 mg/kg (equivalent to 0.4585 mg/kg of withaferin A and 0.4785 mg/kg of withanolide A) in mice using high-performance-liquid chromatography-tandem mass spectrometry. These results suggest that the time required to reach maximum concentration (Tmax), and plasma half-life (t1/2) of withaferin A was found to be 20.00 min and 59.92 ± 15.90 min, respectively, while for withanolide A, Tmax, and t1/2 were found to be 10.00 min and 45.22 ± 9.95 min, respectively [35]. Therefore, in our study, the time required to reach a maximum plasma concentration (Cmax) and plasma half-life (t1/2) of withaferin A were found to be 0.250 ± 0.000 h and 3.148 ± 0.612 h, respectively, while Tmax and t1/2 for withanolide A were found to be 0.333 ± 0.129 h and 0.728 ± 0.423 h. The previous bioanalytical methods were developed specifically for withaferin A and withanolide A, and pharmacokinetics are more limited to withaferin A, whereas, in our study, a validated bioanalytical method was developed to determine seven major phytoconstituents simultaneously from a commercial Withania somnifera root extract. This validated bioanalytical method was later applied to determine the pharmacokinetic parameters of WSE chemical constituents, namely withanoside IV, withaferin A, 12-Deoxy-withastramonolide, and withanolide A in rat plasma.
At a given optimum dose (500 mg/kg), a genotoxicity and mutagenicity study of WSE was carried out. Additionally, to study the permeation characteristics of these constituents across the intestinal barriers, an ex vivo assay using excised everted rat intestinal segment was developed, expressing the advantages over most of the influx and efflux transporters, similar to an in vivo study. Seven markers of WSE were found capable of permeating the intestinal mucosa, and steady-state concentration was achieved after a lag time. At the same time, the amount of withanone and withanolide B were detected in lower concentrations compared to other constituents. Consequently, none of the constituents were found to be carcinogenic, mutagenic, or hepatotoxic in the ADMET study. Our previous study reported acute and sub-acute oral toxicity studies using female Wistar rats by orally administering WSE, indicating that the LD50 value of WSE was > 2000 mg/kg with no toxic effects on the organs of animals [36]. Hence, WSE did not exhibit any mutagenicity or genotoxicity, as per the in vitro assay.
The presence of glucose moiety at the C3 atom, with a high-water solubility and rapid elimination of withanoside IV from the systemic circulation, could be a potential reason for lower toxicity supported by the in vivo pharmacokinetic data, in which withanoside IV was eliminated at 2 h. Similarly, it was observed that all the constituents were rapidly absorbed from the gastrointestinal tract. The higher molecular weight (>450 g/mol) makes these compounds prone to passive diffusion from the stomach and intestine, supported by the ex vivo model. The time-dependent and steady-state absorption of constituents was observed from the intestinal lumen. Overall, results suggest a strong correlation between in silico ADMET, in vivo pharmacokinetics, and the ex vivo permeability study. The collective results of the studies suggest that this validated bioanalytical method could be helpful to explore a clinical pharmacokinetic study of WSE supplements in humans.
4. Materials and Methods
4.1. Chemicals and Reagents
Withanoside IV (purity > 93.00%) and withanolide A (purity > 99.00%) were purchased from USP, Rockville, MD, USA; withanoside V (purity > 97.60%), withanolide B (purity > 95.00%), 12-Deoxy-withastramonolide (purity > 95.90%), and withanone (purity > 93.90%) were procured from Natural Remedies Pvt. Ltd., Bengaluru, India. Withaferin A (purity > 97.60%) was procured from Chromadex, Los Angeles, CA, USA. Fluoxymesterone (FMC, internal standard, IS1) with the purity > 98.82% and difenoconazole (DFC, internal standard, IS2) with the purity > 95.90% were purchased from Clearsynth, Mumbai, Maharashtra, India, and Sigma-Aldrich, St. Louis, MO, USA, respectively. Acetonitrile, methanol, and water (MS grade) were purchased from JT Baker, Radnor, PA, USA. Formic acid was purchased from Honeywell, Charlotte, NC, USA.
4.2. In Silico Absorption, Distribution, Metabolism, Excretion and Toxicity (ADMET), and Molecular Properties Prediction
Poor pharmacokinetics and adverse drug events are directly or indirectly related to the poor prognosis of drug/chemical constituents. Therefore, an in silico ADMET prediction was performed to individually estimate the pharmacokinetics/toxicity of seven constituents of WSE. AdmetSAR is an accessible online server that predicts ADMET properties, such as human intestinal absorption (HIA), blood-brain barrier (BBB+) penetration, Caco-2 permeability, biodegradation, AMES toxicity, carcinogenicity, rat acute oral toxicity, and so on. The ADMET properties of WSE constituents were estimated using the admetSAR online database (http://lmmd.ecust.edu.cn/admetsar2/, accessed on 14 January 2022) to predict ADMET properties. It provides inclusive data for different entities linked to known ADMET properties. Molecular property prediction and Lipinski’s rule of five (ROF) were used to evaluate drug-likeness and/or to determine whether a chemical constituent with a particular pharmacological activity would make it an orally active drug for humans. Molinspiration software (www.molinspiration.com, accessed on 14 January 2022) was used to determine fundamental and molecular properties of these constituents, such as the hydrogen bond donor/acceptor, molecular weight, lipophilicity, etc. [37,38,39].
4.3. Withania somnifera Extract Preparation and Quantification
Withania somnifera roots were procured from Neemuch (MP), India. A voucher specimen was deposited at the Botanical Survey of India (Jodhpur, India) and was authenticated (BSI/AZRC/ I.12012/Tech/19-20/PI. Id/671). The root extract and quantitative assay using HPLC-PDA were performed as per our reported literature [40].
4.4. In Vitro Toxicity Studies
4.4.1. Chromosomal Aberration Assay of Withania somnifera Root Extract
The chromosomal aberration assay was performed to evaluate WSE for the induction of structural deformities in the chromosomes, such as breaking and exchange. For that, Phase I and Phase II genotoxicity study was performed at the three concentrations (0.25, 0.50, and 1.00 mg/mL) in the presence and absence of the metabolic activation system along with the negative and positive control, as per the OECD 473 guideline. After completing the study, chromosomal slides were observed under 100×, and the % aberrated chromosomes were calculated. Further, the mitotic index (MI), relative cell growth (RCG), relative mitotic index (RMI), and % aberration were also calculated upon treatment with WSE [41]. In without metabolic activation system (Phase I), mitomycin C, and with metabolic activation system (Phase II), cyclophosphamide was used as a positive control.
4.4.2. AMES Toxicity Study of Withania somnifera Root Extract
This study was performed to investigate the potential of WSE to induce gene mutations compared to the negative control according to the plate incorporation test (Trial 1) and the pre-incubation test (Trial II) using the Salmonella typhimurium strains TA 1537, TA 1535, TA 98, TA 100, and TA 102. The assay was performed in two independent experiments with or without a liver microsomal activation system. Each concentration, including the negative and positive control, was tested in triplicate. Based on the solubility and precipitation test, the results for eight different concentrations, namely, 0.002, 0.005, 0.016, 0.050, 0.158, 0.501, 1.582, and 5.000 mg/plate were selected for pre-experiments. Later, the following concentrations, 0.016, 0.051, 0.158, 0.501 and 1.582 mg/plate, were selected for the presence of metabolic activation (+S9) and in the absence of metabolic activation (-S9) [42].
4.5. Development and Validation of UHPLC-MS/MS Method
4.5.1. Instrumental and Chromatographic Conditions
The LC-MS/MS analysis was carried out using the Shimadzu Nexera X2 UHPLC system (Shimadzu Tech., Kyoto, Japan), which consists of a degasser DGU-20A5R, quaternary pump LC-30AD, autosampler SIL-30AC, and column oven CTO-20AC with a diode-array detector (SPD-M20A), coupled with LCMS-8045 (Shimadzu Tech., Kyoto, Japan), and triple-quadrupole mass detector equipped with a thermally assisted ESI source. An outlet of the PDA detector was connected with a splitter, which split the flow in the ratio of 5:1 mL/min The separation of individual constituents was obtained from Dr. Maisch GmbH; ReproSil Gold 100C18-XBD, 50 × 4.6 mm; 1.8 µm and associated with a Phenomenex guard column (temperature was maintained at 28 °C) within 14 min run time. The mobile phase composition was 0.1% formic acid in water (A) and acetonitrile (B) with a flow rate of 0.5 mL/min, and the injection volume was kept at 2 µL. The gradient elution procedure was set as follows: 0.00 min, 40% B; 0.00–2.40 min, 45% B; 2.40–4.46 min, 50% B; 4.46–7.00 min, 100% B; 7.00–9.00 min, 100% B; 9.00–11.00 min, 40% B; 11.00–14.00 min, 40% B.
Mass analysis (LC-MS/MS) was carried out in scan mode, and the MS/MS analyses in both positive and negative ion modes (Table 5). The interface for ESI was set to 300 °C. The desolvation line (DL) and heat block temperature were set to 250 °C and 300 °C, respectively. Nebulizing gas flow, 3.00 L/min; heating gas flow, 10.00 L/min; drying gas flow, 10.00 L/min The operation and data generation have been carried out using Lab Solution and Lab Solution Insight software version 3.2 (Shimadzu Corporation, Kyoto, Japan).
4.5.2. Preparation of Stock and Working Standards
The seven individual stock solutions (0.1 mg/mL) of withanoside IV, withanoside V, withaferin A, 12-Deoxy-withastramonolide, withanolide A, withanolide B, and withanone with an individual stock solution of IS1 fluoxymesterone (1.0 mg/mL) and IS2 difenoconazole (0.01 mg/mL) were prepared using LC-MS grade methanol for the preparation of the calibration curve (CC) for both standard and quality control (QC) samples. The primary stock dilutions and working solutions were prepared using methanol ranging from 3.00 to 400.00 ng/mL. Further, IS1 (0.005 mg/mL) and IS2 (0.0001 mg/mL) stock solutions were prepared following the similar method.
4.5.3. Preparation of Calibration Standards and Quality Control Samples
The calibration standards were prepared by spiking 400 µL plasma in methanol and vortexed for 2 min The samples were centrifuged at 5000 rpm for 10 min An aliquot of 85 µL of supernatant was spiked with 0.005 mg/mL of fluoxymesterone (IS1), 0.0001 mg/mL of difenoconazole (IS2), and 5 µL of working solution, respectively. A ten-point calibration curve (3, 5, 10, 25, 50, 75, 100, 200, 300, and 400 ng/mL) was constructed by plotting the ratio of the peak areas of withanoside IV, withanoside V, withaferin A, 12-Deoxy-withastramonolide, withanolide A, withanolide B, and withanone against the nominal concentrations of the calibration standards in the control matrix. The data were subjected to linear regression with a 1/X² weighing.
4.5.4. Sample Pre-Treatment for UHPLC-MS/MS Analysis
The solid-phase extraction (SPE) method was utilized to extract withanoside IV, withanoside V, withaferin A, 12-Deoxy-withastramonolide, withanolide A, withanolide B, and withanone. An aliquot of 85 μL plasma was spiked with 5 μL mix standards, 5 μL of IS1 and IS2. Methanol (400 μL) was added to this mixture, vortexed for 1–2 min, and centrifuged at 5000 rpm for 10 min After centrifugation, 300 µL supernatant was collected into 1.5 mL Eppendorf tubes, then 300 µL methanol was added and vortexed for 1–2 min Bond Elute C18 SPE cartridges were conditioned with 1 mL methanol passed through the SPE manifold, followed by sample loading into the cartridges. They were further washed twice with methanol and passed through the SPE manifold, loading the sample into cartridges of 0.1% formic acid solution (1 mL) to activate the targeted analyte. After that, the reconstitution of pre-treated samples was achieved using methanol (300 µL). The final solution was collected into HPLC vials, and the 2 µL solution was injected into the LC-MS/MS system for bio-analysis.
4.5.5. UHPLC-MS/MS Method Validation
The validation for specificity, linearity, extraction recovery, matrix effects, precision, accuracy, dilution effect, and stability of the developed bioanalytical method was performed as per the US Food and Drug Administration (2018) and European Medicine Agency (2011) guidelines [43,44].
4.5.6. Selectivity, Linearity, and Lower Limit of Quantification (LLOQ)
The selectivity was assessed by analyzing endogenous components in the elution zone of analytes and internal standard (IS) from the chromatogram. Rat plasma samples (n = 6) were spiked at the LLOQ levels. After oral dosing, the samples collected from animals were processed as per the procedure mentioned above, followed by solid-phase extraction (SPE) and LC-MS/MS method. Thereafter, a ten-points calibration curve for the individual standard was prepared and plotted to the IS response to individual constituents against the nominal concentration of all constituents by applying partial least-square linear regression analysis. The lower limit of quantification (LLOQ) was calculated from the above calibration plot by calculating the accuracy and precision.
4.5.7. Matrix Effect, Dilution Integrity, and Extraction Recovery
The matrix effect was evaluated by comparing the MS/MS signals for individual components and internal standards with spiked blank plasma at three different quality control concentration levels of standards. Subsequently, the carry-over effect was determined to ensure the absence of an analytical signal between two consecutive samples in a sequence due to the traces of analyte from previous runs. Dilution integrity was evaluated by injecting 500 ng/mL of each analyte against blank plasma, followed by calculating % relative error (% RE) and % relative standard deviation (% RSD). The comparison of unextracted plasma samples determined the extraction recovery at three concentration levels, namely, LQC, MQC, and HQC, against the extracted samples to evaluate the extraction recovery of the chemical constituents of WSE.
4.5.8. Accuracy, Precision, and Stability
Six replicates of quality control samples were analyzed at four concentration levels (LLOQ, LQC, MQC, and HQC; n = 6) on the same day (intra-day) and repeated for three consecutive days (inter-day) (Table S2). The precision was expressed as the relative standard deviation (% RSD), and accuracy was reported as the relative error (% RE). Later, these samples were analyzed for stability testing under the following conditions: three complete freeze/thaw cycles (−80 °C to 25 °C), long-term sample storage (−80 °C for 60 days), processed sample, and bench-top (25 °C for 4 h). At the same time, autosampler stability was evaluated at 4 °C for 48 h in the autosampler rack.
4.6. In Vivo Pharmacokinetic Study
The pharmacokinetic study was carried out on male Sprague Dawley rats (weighing 200–250 gm) at the Crystal Biological Solution, Pune, Maharashtra, India (Animal House Registration no. 2030/P.O./RcBiBt/S/18/CPCSEA). Animals were quarantined for two weeks in standard conditions 24 ± 1 °C, relative humidity of 56–66%, and 12 h dark and light cycles. Food pellets and tap water were provided ad libitum throughout the experimentation. The protocol to carry out in vivo pharmacokinetics was approved by The Institutional Animal Ethics Committee (IAEC) of Crystal Biological Solution, Pune, Maharashtra, India. (Approval No. CRY/2021/015). Eighteen animals were subdivided into three groups, (n = 6) animals in each group. Withania somnifera extract suspension was prepared in water for oral administration, and the dose was calculated based on the acute oral toxicity study (500 mg/kg; single dose). After dosing, animals were anesthetized using Ketamine (75 mg/kg) + Xylazine (10 mg/kg) by the intraperitoneal route, and the blood samples (0.1 mL) were collected from each group, followed by the retro-orbital venous plexus method (ROP) at different time points (i.e., 0 min, 15 min, 30 min, 45 min, 1 h, 2 h, 4 h, 6 h, 8 h, 10 h, 12 h, and 24 h) using Heparin tubes and further centrifuged at 10,000 rpm for 15 min at 4 °C to collect the plasma samples. The separated plasma samples were transferred into Eppendorf tubes and stored at −80 °C in a deep freezer until analysis. Ten pharmacokinetic parameters were determined using PK solver 2.0, USA [45,46,47]. The maximum observed concentration (Cmax) and maximum observed time (Tmax) were calculated directly from the experimental results. The elimination rate constant (Kel) was calculated from the slope of the linear regression of Log concentrations as a function of time. The half-life (t1/2) was calculated as 0.693/Kel. The area under the curve (AUC(0–t)) was calculated from the linear curve following the trapezoidal rule, while AUC(0–∞) was calculated by adding Ct/λ, with Ct being the final measurable concentration. Oral clearance (Cl/F) was obtained from the equation Cl/F = dose/AUC(0–∞). Mean residence time (MRT) was calculated as AUMC(0–∞)/AUC(0–∞), where AUMC(0–∞) is the area under the first moment curve. Each plasma sample was analyzed in triplicate, and the results are presented as a mean ± standard deviation (SD). The pharmacokinetic parameters as the average of six rats ± SD. The mean plasma concentration Vs. time curve (mean ± SD) was prepared using Prism 8.2, (GraphPad, San Diego, CA, USA).
4.7. Ex Vivo Permeability Study
4.7.1. Everted Rat Intestine Apparatus
The glass apparatus for permeability study was developed as per the previously reported procedure with slight modifications [48]. The everted intestinal segment was mounted on the apparatus and setting it in the beaker. The internal surface of the glass tubes serves as the mucosal compartment, and the beaker serves as the serosal compartment. Animals were humanly sacrificed by cervical dislocation followed by a midline incision. The abdominal cavity was opened carefully, and the intestine was maneuvered to identify the ileocecal junction. A 7 cm long intestinal segment distant to the ileocecal junction (5–6 cm) was excised by carefully removing the mesenteric attachments without causing any damage to the intestinal architecture. The segment was cleaned using the Kreb’s Ringer Bicarbonate (KRB) buffer medium and was stored in KRB buffer in a petri dish. The cleaned segment was then everted gently using a glass rod. Finally, a 3 cm long intestinal segment was used to perform the permeability study [49,50].
4.7.2. Permeability Determination
The tissue was mounted on the apparatus and was placed in a 1000 mL beaker containing 2 mg/mL WSE suspension. The intestinal segment was perfused from the mucosal end using the KRB buffer. The apparatus (beaker with tissue) was placed on the magnetic stirrer followed by continuous stirring using a magnetic bead at 25 rpm to mimic the peristaltic movement of the stomach at 37 °C with appropriate aeration. The sample collection at different time points was carried out every 5 min interval for 1 h. The collected samples were further diluted and analyzed using LC-MS/MS.
4.7.3. Matrix Effect and Sample Preparation for Ex Vivo Permeability Study
The matrix effect was determined by spiking all analytes at LQC and HQC levels in the sample matrix and absence matrix, and it was found to be 85% to 115% for each analyte. The sample was diluted to 20-fold in ACN and injected 2 µL into LC-MS/MS. Samples were stored at −20 °C until analysis using validated UHPLC-MS/MS. The permeability was obtained by plotting the cumulative amount transported (ng) across the gut sac against time (second).
4.7.4. Permeability Calculation
The calculation of apparent permeability (Papp) was carried out using the following Equation (1):
where Papp: apparent permeability co-efficient; dQ/dt: the cumulative amount of drug (Q) appearing in the acceptor (serosal) compartment as a function of time and was obtained from the slope of the linear portion of the amount transported-versus-time plot. A: Surface area of the intestine (cm2) (0.18 cm as radius) and C0: Initial concentration of drug in the donor compartment (ng/mL).
Papp = dQ/dt × 1/A × C0
5. Conclusions
Withania somnifera extract (WSE) is a popular dietary supplement containing withanolides and withanosides. This nutritional supplement has been regulated globally and requires validated bioanalytical methodology and pharmacokinetic parameters. In the present study, for the first time, an accurate, sensitive, and validated bioanalytical method, as per the USFDA/EMA guidelines, was developed to simultaneously estimate seven constituents in rat plasma from WSE using UHPLC-MS/MS. The method demonstrated excellent linearity (R2 > 0.9917) with a lower limit of quantification (LLOQ) of 3 ng/mL for withanosides and withanolides in the presence of internal standards (fluoxymesterone and difenoconazole). The method was further applied to determine the pharmacokinetic parameters of withanolides and withanosides from WSE at the dose of 500 mg/kg. Genotoxicity data revealed that the ratio between positive and negative control is more than two, while the sample to negative control is less than two. Hence, it can be concluded that WSE is non-cytogenetic in Phase I and Phase II studies. Further, an ex vivo intestinal permeability suggests a time-dependent absorption of withanosides and withanolides through intestinal lumen, similar to BCS class I drugs with high solubility and permeability. Therefore, the report discloses the simultaneous estimation of two withanosides and five withanolides in a robust and accurate bioanalytical method. This is the first report where a validated UHPLC-MS/MS-based bioanalytical method demonstrated excellent specificity, linearity, precision, and accuracy. The pharmacokinetic and ex vivo permeability study results could be helpful for clinical trials of WSE in humans.
Supplementary Materials
The following supporting information can be downloaded at online: Figure S1. Typical MRM optimization with precursor ion and product ions (transitions) in the chromatogram with MS/MS spectra of seven analytes and internal standards in the developed UHPLC-MS/MS method, Table S1. The linear equation, linear range, and LLOQ of the withanoside IV, withanoside V, withaferin A, 12-Deoxy-withastramonolide, withanolide A, and withanolide B separately and in rat plasma samples, Table S2. Intra- and inter-day precision and accuracies of the analytes in rat plasma (ng/mL), Table S3. Extraction recovery (ng/mL) of the constituents in rat plasma samples, (n = 6), Table S4. Matrix effect (ng/mL) for the determination of constituents in rat plasma samples, (n = 6), Table S5. Dilution integrity of analytes in 20-fold and 6-fold dilution (ng/mL), (n = 6), Table S6. Stability assays for the determination of constituents in rat plasma, (n = 6).
Author Contributions
Conceptualization, A.G. and L.H.; data curation, S.J.M., A.T., C.G., S.P., S.J., G.S., R.S., A.D. and A.G.; formal analysis, S.J.M., A.T., C.G., S.P., S.J., G.S. and A.D.; funding acquisition, A.D., A.G. and L.H.; investigation, S.J.M., A.T., C.G., S.P., S.J., G.S., R.S. and L.H.; methodology, S.J.M., A.T., C.G., S.P., G.S., R.S., A.G. and L.H.; project administration, R.S., A.D., A.G. and L.H.; resources, R.S., A.D., A.G. and L.H.; software, S.J.M., A.T., C.G., S.P. and S.J.; supervision, R.S., A.D., A.G. and L.H.; validation, A.T., C.G., S.J., G.S., A.D. and A.G.; visualization, A.T., C.G., S.P., S.J., G.S. and A.G.; writing—original draft, S.J.M., A.T., S.P., S.J., G.S., R.S., A.D., A.G. and L.H.; writing—review and editing, S.J.M., A.T., A.D., A.G. and L.H. All authors have read and agreed to the published version of the manuscript.
Funding
This research received no external funding.
Institutional Review Board Statement
The institutional Animal Ethics Committee (Animal House registration no. 2030/P.O./RcBiBt/S/18/CPCSEA) has reviewed and approved the experimental protocol (No. CRY/2021/015). All animals used in the study were handled with care as per CPCSEA guidelines.
Informed Consent Statement
Not applicable.
Data Availability Statement
All the data generated in the current research work has been included in the manuscript.
Acknowledgments
The authors acknowledge Lokesh Bhat (Department of Pharmacology, NMIMS, Mumbai, India) and Vijay Thawani (Former Director, Centre for Scientific Research and Development (CSRD), Bhopal, Madhya Pradesh, India) for expert assistance in reviewing the manuscript. The authors also acknowledge Amit Mirgal and Pradeep Solanki (Pharmanza Herbal Pvt. Ltd., Anand, Gujarat, India.) for authentication of plant material and sample preparation. The authors acknowledge Yogesh Talekar, Crystal Biological Solutions, Pune, Maharashtra, India for providing animal and laboratory support.
Conflicts of Interest
The authors declare no conflict of interest pertaining to this research work.
Abbreviations
| AUC | Area under the Curve |
| AUMC | Area under the mean concentration |
| CPCSEA | The committee for the purpose of control and supervision of experiments on animals |
| CYP | Cytochrome P450 |
| EMA | European medicines agency |
| HQC | Highest concentration QC sample |
| IS | Internal standard |
| KRB | Kreb’s ringer buffer |
| LLOQ | Lower limit of quantification |
| LQC | Lowest concentration QC sample |
| MQC | Moderate concentration QC sample |
| MRT | Mean residence time |
| Papp | Apparent permeability constant |
| RE | Relative error |
| ROP | Retro-orbital venous plexus |
| RSD | Relative standard deviation |
| TPSA | Topological polar surface area |
| UHPLC | Ultra-performance liquid chromatography |
| USFDA | United States food and drug administration |
| USP | United States pharmacopeia |
| WSE | Withania somnifera extract |
References
- Kumar, V.; Dey, A.; Hadimani, M.B.; Marcovic, T.; Emerald, M. Chemistry and pharmacology of Withania somnifera: An update. CELLMED 2015, 5, 1.1–1.13. [Google Scholar] [CrossRef] [Green Version]
- Hepper, F.N. Old World Withania (Solanaceae): A taxonomic review and key to the species. In InSolanaceae III: Taxonomy, Chemistry, Evolution; Hawkes, J.G., Lester, R.N., Nee, M., Estrada, N., Eds.; Royal Botanic Gardens: Kew, UK, 1999; pp. 211–227. [Google Scholar]
- Ilayperuma, I.; Ratnasooriya, W.D.; Weerasooriya, T.R. Effect of Withania somnifera root extract on the sexual behaviour of male rats. Asian J. Androl. 2002, 4, 295–298. [Google Scholar] [PubMed]
- Mabberley, D.J. Mabberley’s Plant-Book: A Portable Dictionary of Plants, Their Classification and Uses; Cambridge University Press: Cambridge, UK, 2017; ISBN 1107115027. [Google Scholar]
- Wijeratne, E.M.K.; Xu, Y.-M.; Scherz-Shouval, R.; Marron, M.T.; Rocha, D.D.; Liu, M.X.; Costa-Lotufo, L.V.; Santagata, S.; Lindquist, S.; Whitesell, L. Structure–activity relationships for withanolides as inducers of the cellular heat-shock response. J. Med. Chem. 2014, 57, 2851–2863. [Google Scholar] [CrossRef] [PubMed]
- Arshad Jamal, S.; Iqbal Choudhary, M.; Asif, E. Two withanolides from Withania somnifera. Phytochemistry 1991, 30, 3824–3826. [Google Scholar]
- Bhattacharya, S.K.; Bhattacharya, A.; Sairam, K.; Ghosal, S. Anxiolytic-antidepressant activity of Withania somnifera glycowithanolides: An experimental study. Phytomedicine 2000, 7, 463–469. [Google Scholar] [CrossRef]
- Singh, G.; Kumar, P. Antibacterial Potential of Alkaloids of Withania somnifera L. and Euphorbia hirta L. Int. J. Pharm. Pharm. Sci. 2012, 4, 78–81. [Google Scholar]
- Pawar, P.; Gilda, S.; Sharma, S.; Jagtap, S.; Paradkar, A.; Mahadik, K.; Ranjekar, P.; Harsulkar, A. Rectal gel application of Withania somnifera root extract expounds anti-inflammatory and muco-restorative activity in TNBS-induced Inflammatory Bowel Disease. BMC Complement. Altern. Med. 2011, 11, 34. [Google Scholar] [CrossRef] [Green Version]
- Widodo, N.; Kaur, K.; Shrestha, B.G.; Takagi, Y.; Ishii, T.; Wadhwa, R.; Kaul, S.C. Selective killing of cancer cells by leaf extract of Ashwagandha: Identification of a tumor-inhibitory factor and the first molecular insights to its effect. Clin. Cancer Res. 2007, 13, 2298–2306. [Google Scholar] [CrossRef] [Green Version]
- Andallu, B.; Radhika, B. Hypoglycemic, diuretic and hypocholesterolemic effect of winter cherry (Withania somnifera, Dunal) root. Indian J. Exp. Biol. 2000, 38, 607–609. [Google Scholar]
- Khan, B.; Ahmad, S.F.; Bani, S.; Kaul, A.; Suri, K.A.; Satti, N.K.; Athar, M.; Qazi, G.N. Augmentation and proliferation of T lymphocytes and Th-1 cytokines by Withania somnifera in stressed mice. Int. Immunopharmacol. 2006, 6, 1394–1403. [Google Scholar] [CrossRef]
- Kumar, P.; Singh, R.; Nazmi, A.; Lakhanpal, D.; Kataria, H.; Kaur, G. Glioprotective effects of Ashwagandha leaf extract against lead induced toxicity. BioMed Res. Int. 2014, 2014, 182029. [Google Scholar] [CrossRef] [PubMed]
- Sehgal, N.; Gupta, A.; Valli, R.K.; Joshi, S.D.; Mills, J.T.; Hamel, E.; Khanna, P.; Jain, S.C.; Thakur, S.S.; Ravindranath, V. Withania somnifera reverses Alzheimer’s disease pathology by enhancing low-density lipoprotein receptor-related protein in liver. Proc. Natl. Acad. Sci. USA 2012, 109, 3510–3515. [Google Scholar] [CrossRef] [PubMed] [Green Version]
- Dar, N.J.; Hamid, A.; Ahmad, M. Pharmacologic overview of Withania somnifera, the Indian Ginseng. Cell. Mol. Life Sci. 2015, 72, 4445–4460. [Google Scholar] [CrossRef]
- Mirjalili, M.H.; Moyano, E.; Bonfill, M.; Cusido, R.M.; Palazón, J. Steroidal lactones from Withania somnifera, an ancient plant for novel medicine. Molecules 2009, 14, 2373–2393. [Google Scholar] [CrossRef] [Green Version]
- Choudhary, M.I.; Abbas, S.; Jamal, S.A. Withania somnifera—A source of exotic withanolides. Heterocycles 1996, 2, 555–563. [Google Scholar]
- Bandyopadhyay, M.; Jha, S.; Tepfer, D. Changes in morphological phenotypes and withanolide composition of Ri-transformed roots of Withania somnifera. Plant Cell Rep. 2007, 26, 599–609. [Google Scholar] [CrossRef]
- Nasimi Doost Azgomi, R.; Zomorrodi, A.; Nazemyieh, H.; Fazljou, S.M.B.; Sadeghi Bazargani, H.; Nejatbakhsh, F.; Moini Jazani, A.; Ahmadi AsrBadr, Y. Effects of Withania somnifera on reproductive system: A systematic review of the available evidence. BioMed Res. Int. 2018, 2018, 4076430. [Google Scholar] [CrossRef] [Green Version]
- Bhattacharya, S.K.; Muruganandam, A.V. Adaptogenic activity of Withania somnifera: An experimental study using a rat model of chronic stress. Pharmacol. Biochem. Behav. 2003, 75, 547–555. [Google Scholar] [CrossRef]
- Davis, L.; Kuttan, G. Immunomodulatory activity of Withania somnifera. J. Ethnopharmacol. 2000, 71, 193–200. [Google Scholar] [CrossRef]
- Sahni, Y.P.; Srivastava, D.N. Anti-inflammatory activity of Withania somnifera: Possible mode of action. J. Appl. Anim. Res. 1993, 3, 129–136. [Google Scholar] [CrossRef]
- Gorelick, J.; Rosenberg, R.; Smotrich, A.; Hanuš, L.; Bernstein, N. Hypoglycemic activity of withanolides and elicitated Withania somnifera. Phytochemistry 2015, 116, 283–289. [Google Scholar] [CrossRef] [PubMed]
- Devkar, S.T.; Kandhare, A.D.; Zanwar, A.A.; Jagtap, S.D.; Katyare, S.S.; Bodhankar, S.L.; Hegde, M.V. Hepatoprotective effect of withanolide-rich fraction in acetaminophen-intoxicated rat: Decisive role of TNF-α, IL-1β, COX-II and iNOS. Pharm. Biol. 2016, 54, 2394–2403. [Google Scholar] [CrossRef] [Green Version]
- Kaur, P.; Mathur, S.; Sharma, M.; Tiwari, M.; Srivastava, K.K.; Chandra, R. A biologically active constituent of Withania somnifera (ashwagandha) with anti-stress activity. Indian J. Clin. Biochem. 2001, 16, 195–198. [Google Scholar] [CrossRef] [Green Version]
- Ahmad, M.; Saleem, S.; Ahmad, A.S.; Ansari, M.A.; Yousuf, S.; Hoda, M.N.; Islam, F. Neuroprotective effects of Withania somnifera on 6-hydroxydopamine induced Parkinsonism in rats. Hum. Exp. Toxicol. 2005, 24, 137–147. [Google Scholar] [CrossRef] [PubMed]
- Langade, D.; Kanchi, S.; Salve, J.; Debnath, K.; Ambegaokar, D. Efficacy and safety of Ashwagandha (Withania somnifera) root extract in insomnia and anxiety: A double-blind, randomized, placebo-controlled study. Cureus 2019, 11, 9. [Google Scholar] [CrossRef] [PubMed] [Green Version]
- Chandrasekhar, K.; Kapoor, J.; Anishetty, S. A prospective, randomized double-blind, placebo-controlled study of safety and efficacy of a high-concentration full-spectrum extract of ashwagandha root in reducing stress and anxiety in adults. Indian J. Psychol. Med. 2012, 34, 255–262. [Google Scholar] [CrossRef] [PubMed] [Green Version]
- Gannon, J.M.; Forrest, P.E.; Chengappa, K.N.R. Subtle changes in thyroid indices during a placebo-controlled study of an extract of Withania somnifera in persons with bipolar disorder. J. Ayurveda Integr. Med. 2014, 5, 241. [Google Scholar]
- Raut, A.A.; Rege, N.N.; Tadvi, F.M.; Solanki, P.V.; Kene, K.R.; Shirolkar, S.G.; Pandey, S.N.; Vaidya, R.A.; Vaidya, A.B. Exploratory study to evaluate tolerability, safety, and activity of Ashwagandha (Withania somnifera) in healthy volunteers. J. Ayurveda Integr. Med. 2012, 3, 111. [Google Scholar] [CrossRef] [Green Version]
- Available online: https://www.usp.org/sites/default/files/usp/document/products-services/products/2015-dsc-vol-1-table-of-contents-ref-standard-index.pdf (accessed on 2 December 2021).
- Dai, T.; Jiang, W.; Guo, Z.; Wang, Z.; Huang, M.; Zhong, G.; Liang, C.; Pei, X.; Dai, R. Studies on oral bioavailability and first-pass metabolism of withaferin A in rats using LC–MS/MS and Q-TRAP. Biomed. Chromatogr. 2019, 33, e4573. [Google Scholar] [CrossRef]
- Thaiparambil, J.T.; Bender, L.; Ganesh, T.; Kline, E.; Patel, P.; Liu, Y.; Tighiouart, M.; Vertino, P.M.; Harvey, R.D.; Garcia, A. Withaferin A inhibits breast cancer invasion and metastasis at sub-cytotoxic doses by inducing vimentin disassembly and serine 56 phosphorylation. Int. J. Cancer 2011, 129, 2744–2755. [Google Scholar] [CrossRef]
- Gambhir, L.; Checker, R.; Sharma, D.; Thoh, M.; Patil, A.; Degani, M.; Gota, V.; Sandur, S.K. Thiol dependent NF-κB suppression and inhibition of T-cell mediated adaptive immune responses by a naturally occurring steroidal lactone Withaferin A. Toxicol. Appl. Pharmacol. 2015, 289, 297–312. [Google Scholar] [CrossRef] [PubMed]
- Patil, D.; Gautam, M.; Mishra, S.; Karupothula, S.; Gairola, S.; Jadhav, S.; Pawar, S.; Patwardhan, B. Determination of withaferin A and withanolide A in mice plasma using high-performance liquid chromatography-tandem mass spectrometry: Application to pharmacokinetics after oral administration of Withania somnifera aqueous extract. J. Pharm. Biomed. Anal. 2013, 80, 203–212. [Google Scholar] [CrossRef] [PubMed]
- Patel, S.B.; Rao, N.J.; Hingorani, L.L. Safety assessment of Withania somnifera extract standardized for Withaferin A: Acute and sub-acute toxicity study. J. Ayurveda Integr. Med. 2016, 7, 30–37. [Google Scholar] [CrossRef] [PubMed] [Green Version]
- Cheng, F.; Li, W.; Zhou, Y.; Shen, J.; Wu, Z.; Liu, G.; Lee, P.W.; Tang, Y. admetSAR: A comprehensive source and free tool for assessment of chemical ADMET properties. J. Chem. Inf. Model. 2012, 52, 3099–3105. [Google Scholar] [CrossRef] [PubMed]
- Shinde, M.G.; Modi, S.J.; Kulkarni, V.M. Synthesis, pharmacological evaluation, molecular docking and in silico ADMET prediction of nitric oxide releasing biphenyls as anti-inflammatory agents. J. Appl. Pharm. Sci. 2017, 7, 37–47. [Google Scholar] [CrossRef]
- Tiwari, A.; Modi, S.J.; Mahadik, K.R.; Suryawanshi, M.R. Synthesis And Anticancer Screening Of Triazine Analogues. Int. J. Pharm. Pharm. Sci. 2019, 11, 114–120. [Google Scholar] [CrossRef]
- Girme, A.; Saste, G.; Pawar, S.; Balasubramaniam, A.K.; Musande, K.; Darji, B.; Satti, N.K.; Verma, M.K.; Anand, R.; Singh, R.; et al. Investigating 11 Withanosides and Withanolides by UHPLC–PDA and Mass Fragmentation Studies from Ashwagandha (Withania somnifera). ACS Omega 2020, 5, 27933–27943. [Google Scholar] [CrossRef]
- Organisation de coopération et de développement économiques. Test No. 473: In Vitro Mammalian Chromosomal Aberration Test; OECD Publishing: Paris, France, 2016. [Google Scholar]
- Lupi, S.; Marconi, S.; Paiaro, E.; Fochesato, A.; Gregorio, P. Mutagenicity evaluation with Ames test of hydro-alcoholic solution of terpenes. J. Prev. Med. Hyg. 2009, 50, 170–174. [Google Scholar]
- United States Food and Drug Administration (USFDA)—Department of Health and Human Services. Bioanalytical Method Validation, Guidance for Industry. 2018. Available online: https://www.fda.gov/files/drugs/published/Bioanalytical-MethodValidation-Guidance-for-Industry.pdf/ (accessed on 17 July 2021).
- European Medicines Agency. Guideline on Bioanalytical Method Validation. 2011. Available online: www.ema.europa.eu/docs/en_GB/document_library/Scientifc_guideline/2011/08/WC500109686.pdf/ (accessed on 17 July 2021).
- Tiwari, A.; Mahadik, K.R.; Gabhe, S.Y. Effect of piperine and its analogs on pharmacokinetic properties of sorafenib tosylate: Bioanalytical method development and validation. J. Appl. Pharm. Sci. 2020, 10, 1–12. [Google Scholar]
- Zhang, Y.; Huo, M.; Zhou, J.; Xie, S. PKSolver: An add-in program for pharmacokinetic and pharmacodynamic data analysis in Microsoft Excel. Comput. Methods Programs Biomed. 2010, 99, 306–314. [Google Scholar] [CrossRef]
- Girme, A.; Pawar, S.; Ghule, C.; Shengule, S.; Saste, G.; Balasubramaniam, A.K.; Deshmukh, A.; Hingorani, L. Bioanalytical Method Development and Validation Study of Neuroprotective Extract of Kashmiri Saffron Using Ultra-Fast Liquid Chromatography-Tandem Mass Spectrometry (UFLC-MS/MS): In Vivo Pharmacokinetics of Apocarotenoids and Carotenoids. Molecules 2021, 26, 1815. [Google Scholar] [CrossRef] [PubMed]
- Dixit, P.; Jain, D.K.; Dumbwani, J. Standardization of an ex vivo method for determination of intestinal permeability of drugs using everted rat intestine apparatus. J. Pharmacol. Toxicol. Methods 2012, 65, 13–17. [Google Scholar] [CrossRef] [PubMed]
- Nunes, R.; Silva, C.; Chaves, L. Tissue-based in vitro and ex vivo models for intestinal permeability studies. In Concepts and Models for Drug Permeability Studies; Elsevier: Amsterdam, The Netherlands, 2016; pp. 203–236. [Google Scholar]
- Volpe, D.A. Application of method suitability for drug permeability classification. AAPS J. 2010, 12, 670–678. [Google Scholar] [CrossRef] [PubMed] [Green Version]
Publisher’s Note: MDPI stays neutral with regard to jurisdictional claims in published maps and institutional affiliations. |
© 2022 by the authors. Licensee MDPI, Basel, Switzerland. This article is an open access article distributed under the terms and conditions of the Creative Commons Attribution (CC BY) license (https://creativecommons.org/licenses/by/4.0/).