Article

Quality Related Safety Evaluation of a South African Traditional Formulation (PHELA®) as Novel Anti-Biofilm Candidate

1
Department of Pharmaceutical Technology, School of Natural Product Studies, Jadavpur University, Kolkata 700032, India
2
Institute of Bioresources and Sustainable Development, Department of Biotechnology, Government of India, Imphal 795001, India
3
Department of Pharmacology, School of Medicine, Faculty of Health Sciences, University of the Free State, Bloemfontein 9300, South Africa
*
Author to whom correspondence should be addressed.
Molecules 2022, 27(4), 1219; https://doi.org/10.3390/molecules27041219
Submission received: 17 December 2021 / Accepted: 4 January 2022 / Published: 11 February 2022
(This article belongs to the Special Issue Biological Activities of Natural Products II)

Abstract

:
A South African traditional formulation, PHELA®, is consumed by the traditional people for severe chest problems with coughing, diarrhea, oral ulcers etc. The present study focused on establishing the anti-infective properties of a safe and standardized poly-herbal formulation through a series of criteria and specifications.

1. Introduction

Biofilms are aggregates of microorganisms entrenched in a self-produced extracellular polymeric substances (EPS) matrix by adhering to each other and/or abiotic surface having high cell densities, ranging from 108 to 1011 cells/gm wet weight [1,2,3,4]. Around 60% of human infections are due to formation of biofilm. Most of the biomass of the biofilms is made up of hydrated EPS rather than microbial cells. The spatial organization of EPS molecules in the matrix is a nonstop, dynamic process that produces microcolonies from the biofilm cluster [5]. The functional and emergent property of the matrix is due to the heterogeneous nature of the polysaccharides in a highly ordered composition. Biofilms allow microorganisms to trap nutrients and withstand hostile environmental conditions (pH, temperature and presence of antibiotics) through quorum sensing (QS) [6]. QS helps the biofilms to respond to the environmental changes and facilitate the colonization of a surface by forming streamers. This increases antimicrobial resistance compared to free-living bacterial cells. Due to these emergent properties, it is challenging to target biofilm forming microorganisms in industrial and health care sectors. Natural products have gained extensive interest in the search of alternatives for anti-microbial therapy [7]. The compounds are well accepted due to safety reasons and having a long history of use in different traditional medicine for the prevention and treatment of infectious diseases [8,9,10]. The use of herbal medicines has significantly increased over last decades. In comparison with a single herb, herbal combinations have shown a more promising effect in the treatment of disease conditions. The concept of poly herbal combinations has been well established and unexpected success has been reached. However, traditional herbal treatments are not found to be inherently safe due to their unexpected interactions with different drug metabolizing enzymes when prescribed with conventional medicines. A survey states that about 14–31% of prescription drug users take the herbal products as a nutritional supplement. The lack of adequate knowledge of interaction potential with these herbs with drug metabolizing enzymes results in altered pharmacokinetic and/or pharmacodynamic parameters. More than 70% of drug candidates are being bio-transformed by Cytochrome P450 class of isozymes via oxidation. Thus, the documentation of the herbal medicine interacting with CYP isozymes became essential for regulatory licensing using different in-vitro, in-vivo and in-silico techniques [11].
PHELA® is a crude polyherbal formulation, used in the South African traditional system of medicine, considered as a dietary supplement that has a traditional use as “Imbiza” for blood cleansing. Different parts of the four plants, namely, Gladiolus dalenii Van Geel, Clerodendrum glabrum E. Mey, Senna occidentalis (L.) Link and Rotheca myriciodes (Hochst), were combined by Steane & Mabb in a specific ratio to make the PHELA® formulation. The herbal formulation has been reported to have benefits for the condition traditionally known as “Muyaka”, characterized in bed-ridden patients with severe chest problems, coughing, coated or pimply tongue, resulting in severe weight and appetite loss, vomiting and diarrhea, stiffness, oral ulcers and slow painful death [12,13]. Few studies are available reporting on immune stimulation and anti-Alzheimer’s potentials of the formulation [14,15]. The phytochemical composition of the formulation has yet not been documented well. A comprehensive chromatographic method was developed by Lekhooa et al., for fingerprinting analysis of different solvent extracts [16]. In another study, the developed HPLC-FLD analysis identified major peaks in rat plasma after administration of aqueous extract at different time intervals. The developed method could help to optimize the pharmacokinetic parameters to obtain steady state plasma concentration [17].
The present study is undertaken to investigate the biofilm inhibitory property of standardized PHELA® extract and to evaluate its interaction potential with cytochrome class of drug metabolizing enzymes.

2. Materials and Methods

Metabolite profiling was performed by UPLC-MS/MS followed by quantitative estimation of major metabolite by RP-HPLC analysis. The cytotoxicity assay was studied in HEP G2 cell line, and interaction potential with different drug metabolizing enzymes was performed using CYP450 isozymes inhibition assay method. The antibacterial potency of the extracts was studied against Staphylococcus aureus, Bacillus substilis, Escherichia coli, Pseudomonas aeruginosa. Standard plate count method followed to understand the effect of the extract on the bacterial growth pattern and reported as CFU/mL. Inhibition of biofilm formation study was performed using crystal violet stain and AFM was utilized to unravel its surface topology.

2.1. Chemicals and Reagents

LC grade methanol (Merck-Mumbai, India), emodin (>98%), ketoconazole and fluoxetine from Sigma chemicals (Steinheim, Germany). Vivid® CYP450 Screening Kit [CYP2D6 (Cat. No. P2972) and CYP3A4 (Cat. No. P2858)] and specific Vivid® Substrates [CYP2D6—EOMCC; CYP3A4—BOMCC] were purchased from Life Technologies (Carlsbad, CA, USA), Muller Hinton Broth (MHB), Nutrient Agar and Crystal violet were supplied by Himedia, India. All other chemicals and reagents were of analytical grade (E-Merck). Bacterial strains like Staphylococcus aureus (ATCC 29213), Bacillus cereus (ATCC 14579), Pseudomonas aerugenosa (ATCC 9027) and Escherichia coli (ATCC 25922) were sub-cultured on Mueller Hinton Broth (MHB) and incubated at 37 °C for 24 h.
HEPG2 cells were obtained from the American Type Culture Collection (ATCC HB 8065). Eagle’s Minimum Essential Media (EMEM), Fetal Bovine Serum (FBS) and Phosphate Buffer Saline (PBS) were purchased from Life technologies Ltd. (Fairlands, Johannesburg, South Africa). The 3-(4,5-Dimethylthiazol-2-yl)-2,5-Diphenyltetrazolium Bromide (MTT), Dimethyl Sulfoxide (DMSO), Trypsin and all other chemicals and reagents were of analytical grade and acquired from Merck (Pvt.) Ltd. (Modderfontein, Johannesburg, South Africa).
The cell line was maintained in EMEM supplemented with 10% FBS, supplemented with non-essential amino acids and sodium pyruvate (1 mM). The cell line was grown at 37 °C in a humidified incubator set at 5% CO2 and sub-cultured with 0.25% (w/v) trypsin and 0.53 mM EDTA for a maximum of 15 min every 2–3 days after they had formed a 90% confluent monolayer.

2.2. Procurement of Plant Material

Crude PHELA® sample was provided by Prof. Motlalepula G. Matsabisa, the Director, IKS Lead Programme, Department of Pharmacology, University of Free State, Bloemfontein, South Africa under the India–South African Science and Technology funded bilateral research project (DST-NRF Unique Grant No. 104775 UFS Entity 1 047 N1418). The voucher specimens for individual plant Gladiolus dalenii Van Geel (BLFU/MGM001), Clerodendrum glabrum E. Mey (BLFU/MGM004), Senna occidentalis (L.) Link (BLFU/MGM0012) and Rotheca myriciodes (Hochst), Steane & Mabb (BLFU/MGM0013) were stored at Department of Pharmacology, Faculty of Health Sciences, University of the Free State, Bloemfontein, South Africa. For PHELA® formulation, the crude herbal formulation was ground into coarse powder and mixed (1:4:8:6).

2.3. Extraction of the Plant Material

The crude powdered PHELA® formulation was subjected to hydro-alcoholic extraction through maceration. 100 g of the milled plant sample was soaked in 500 mL of 80% methanol at room temperature with frequent shaking for 72 h. The extraction procedure was repeated 3 times. Finally, the filtrates were pooled and concentrated using a rotary vacuum evaporator (IKA, Osaka, Japan) and lyophilized (Instrumentation India, India) to get dry powder. The percentage yield for the hydro-alcoholic extract of PHELA® (PHAE) was found to be 13.5% (w/w). The dried extract was packed in an airtight container and stored at 4 °C freezer for further use.

2.4. UPLC-MS Analysis of PHELA® Extract

Compound separation and detection was performed using a Waters UPLC hyphenated with a Waters Synapt G2 QTOF instrument. Analysis was done in an Acquity UPLC BEH C 18 1.7 µm (2.1 × 100 mm column). The column was operating in a flow rate of 0.4 mL/min. For negative ion mode the mobile phase used was A; 0.1% HCO2H in deionized water and B; MeOH + 0.1% HCO2H. MS source ESI operated in positive, capillary voltage and endplate voltage were set at 4000 V and −500 V, respectively. Nitrogen was used as nebulizing gas at 35 p.s.i. and m/z range was set from 120 to 1000 amu and for positive ion mode the mobile phase consisted of A; 5 mM ammonium formate buffer (pH 8) contained 1% methanol, and solvent (C) 100% methanol. Gradient elution started with 95% A and 5% B at 40 °C which remained at the linear gradient until 15 min. From 15 to 17 min it was 10% A and 90% B, then, from 17 min to 21 min, elution was kept constant into 0% A and 100% B, a linear gradient was then used to reach completion, 95% A and 5% B until 25 min.

2.5. RP-HPLC Analysis of PHELA® Extract

The percentage content of standard phytomarker emodin in PHELA® extract was determined through RP-HPLC (Shimadzu Prominence, Kyoto, Japan) system. Built with two Shimadzu LC-20 AD UFLC reciprocating pumps, a variable Shimadzu SPD-M20A Prominence PDA detector and a Rheodyne manual injector with a loop volume of 20 μL with a C18column (Phenomenex-Luna C18, Torrance, CA, USA) (250 × 4.6 nm, 5 μm particle size) was used as the stationary phase. For analysis, the standard and test samples were dissolved in methanol to obtain a stock solution of 1 mg/mL. The standard and sample were injected at a volume of 20 μL using Hamilton Micro liters syringe (Bonaduz, Switzerland). The analysis was performed under isocratic elution using optimized mobile phase methanol and 1% acetic acid solution at a 1 mL/min flow rate. The detection of the compounds was performed at λmax254 nm. The amount of the standard present in the sample was determined through the construction of the calibration curve by plotting peak area against corresponding concentrations through linear regression using LC solution software [18].

2.6. Safety Assessment of PHELA® Extract

2.6.1. MTT Cytotoxicity Assay

The toxicity of PHELA® extract in HEPG2 cells were performed using MTT cytotoxicity assay with some modification as described by Kar et al. [19]. HEPG2 cells were cultured and maintained in high glucose Dulbecco’s modified Eagle’s medium (DMEM) supplemented with 10% (v/v) fetal bovine serum, L-glutamine (4 mM), 100 U/mL penicillin and 100 µg/mL streptomycin. Cells (1 × 10⁴ cells/mL) were seeded in 100 µL medium in 96-well microtiter plates and incubated for 24 h at 37 °C and 5% CO2 to allow cells to adhere. Subsequently, cells were exposed to the different concentrations of the samples and the controls, which included vehicle-treated cells exposed to 0.5% DMSO; cells propagated in growth medium and cells exposed to the positive control. After the 24 h of treatment period, the cells were exposed to the MTT reagent (0.5 mg/mL). The colorimetric reaction was measured by means of a plate reader (Multiskan Go, Thermofischer Scientific, Vantaa, Finland) at 570 nm. Color control blanks were included and utilized to normalize the results and the vehicle control treated cells were regarded as 100% cell viability. The results given are representative of the average percentage inhibition of all the experiments were repeated as triplicate and given as CC50.

2.6.2. CYP450 Enzyme Inhibition Study

Fluorogenic assay was performed in black 96-well microplates. All the samples and standard inhibitors were dissolved in 100 mM Vivid CYP450 reaction buffer to obtain desired concentrations. The assay mixture consisted of 50 μL of prepared enzyme mixture and 40 μL test solution; incubate for 20 min at 37 °C. The enzymatic reaction was initiated by the addition of a mixture of NADP+ and the appropriate substrate (10 μL) and incubated for 10 min at 37 °C. To start the reaction 10μM concentration of 7-benzyloxymethyloxy-3-cyanocoumarin (BOMCC) and 7-ethoxymethoxy-3-cyanocoumarin (EOMCC) fluorogenic substrate were used for CYP3A4 and CYP2D6, respectively. Product formation from the fluorogenic substrate were measured on a fluorescence microplate reader (PHERAstar, BMG Labtech, Cary, NC, USA) using an excitation wavelength of 415 nm and emission wavelength of 460 nm. Percentage inhibition and IC50 value were determined [19,20].

2.7. Antibacterial and Anti-Biofilm Activity of PHELA® Extract

2.7.1. MIC Determination by Broth Dilution Method Using the 96-Well Plate

Broth dilution is one of the most basic antimicrobial susceptibility testing methods to determine MIC using a 96-well microtitre plate [21]. To each well 50 µL of MHB was dispensed followed by addition of 100 µL of test extract or standard antimicrobial agent (ciprofloxacin, 1 mg/mL) and serially diluted row-wise. Then, each well was inoculated aseptically with 50 µL of bacterial inoculums adjusted to 0.5 McFarland Standard (1.5 × 10⁸ CFU/mL). The well without extract or standard antimicrobial agent served as negative control. Wells containing the extract or standard antimicrobial agent served as test and positive control groups, respectively. Finally, 30 µL of 0.02% p-iodonitrotetrazolium chloride (INT) was added to each well and incubated at 37 °C for 24 h. The MIC concentration determined by change in color.

2.7.2. Determination of MBC

MBC is the lowest concentration of the test material to diminish 99.9% of viable bacterial growth. To determine MBC the contents of MIC wells sub-culturing on agar medium without disinfectant. After 16–20 h of incubation at 35 °C, the number of colonies were counted by colony counter. The experiments were conducted in triplicate to minimize errors [22].

2.7.3. Growth Curves Analysis

As the tested plant extract showed the lowest MIC value against S. aureus, the microorganism was cultured on MHB and the bacterial cell concentration was adjusted to 0.5 McFarland standards. Then, 1 mL of the sample mixture was withdrawn at different time intervals (0, 5, 10 and 20 h). At each time interval, the withdrawn samples were serially diluted as 10, 100, 1000 times and spread on agar plates by spread plate technique. The standard plate count method was performed after 24 h of incubation at 37 °C to detect the number of viable bacterial cells in terms of colony forming unit (CFU) for the control and treated isolates using the standard protocol and reported as CFU/mL [23].

2.7.4. Inhibition of Biofilm Formation

The study was performed as described by Sarkar et al. [19]. In a 96=well microtitre plate, 25 μL of a 1.5 × 10⁸ CFU/mL suspension of S. aureus was inoculated in 100 µL of fresh MHB in each well followed by the addition of 50 µL of the extract (MIC, MIC X 2, MIC X 3 and MIC X 4) or standard antimicrobial agent (ciprofloxacin) at a sub-lethal concentration and serially diluted row-wise. The well without extract or standard antimicrobial agent served as non-treated control and wells containing the extract or standard antimicrobial agent served as test and positive control groups, respectively. After 16 h of incubation at 37 °C, the plate was taken out and washed with PBS (pH 7.4) to remove non-adherent bacteria. The adherent cells were stained with 1% crystal violet solution followed by washing again with PBS to remove the excess stain. The biofilm was extracted with 33% glacial acetic acid and the absorbance was recorded at 492 nm (SpectramaxM5; Molecular Devices, San Jose, CA, USA) [24].
The percentage of inhibition of biofilm formation was calculated as follows:
1 O D   o f   t h e   t e s t O D   o f   n e g a t i v e   c o n t r o l × 100

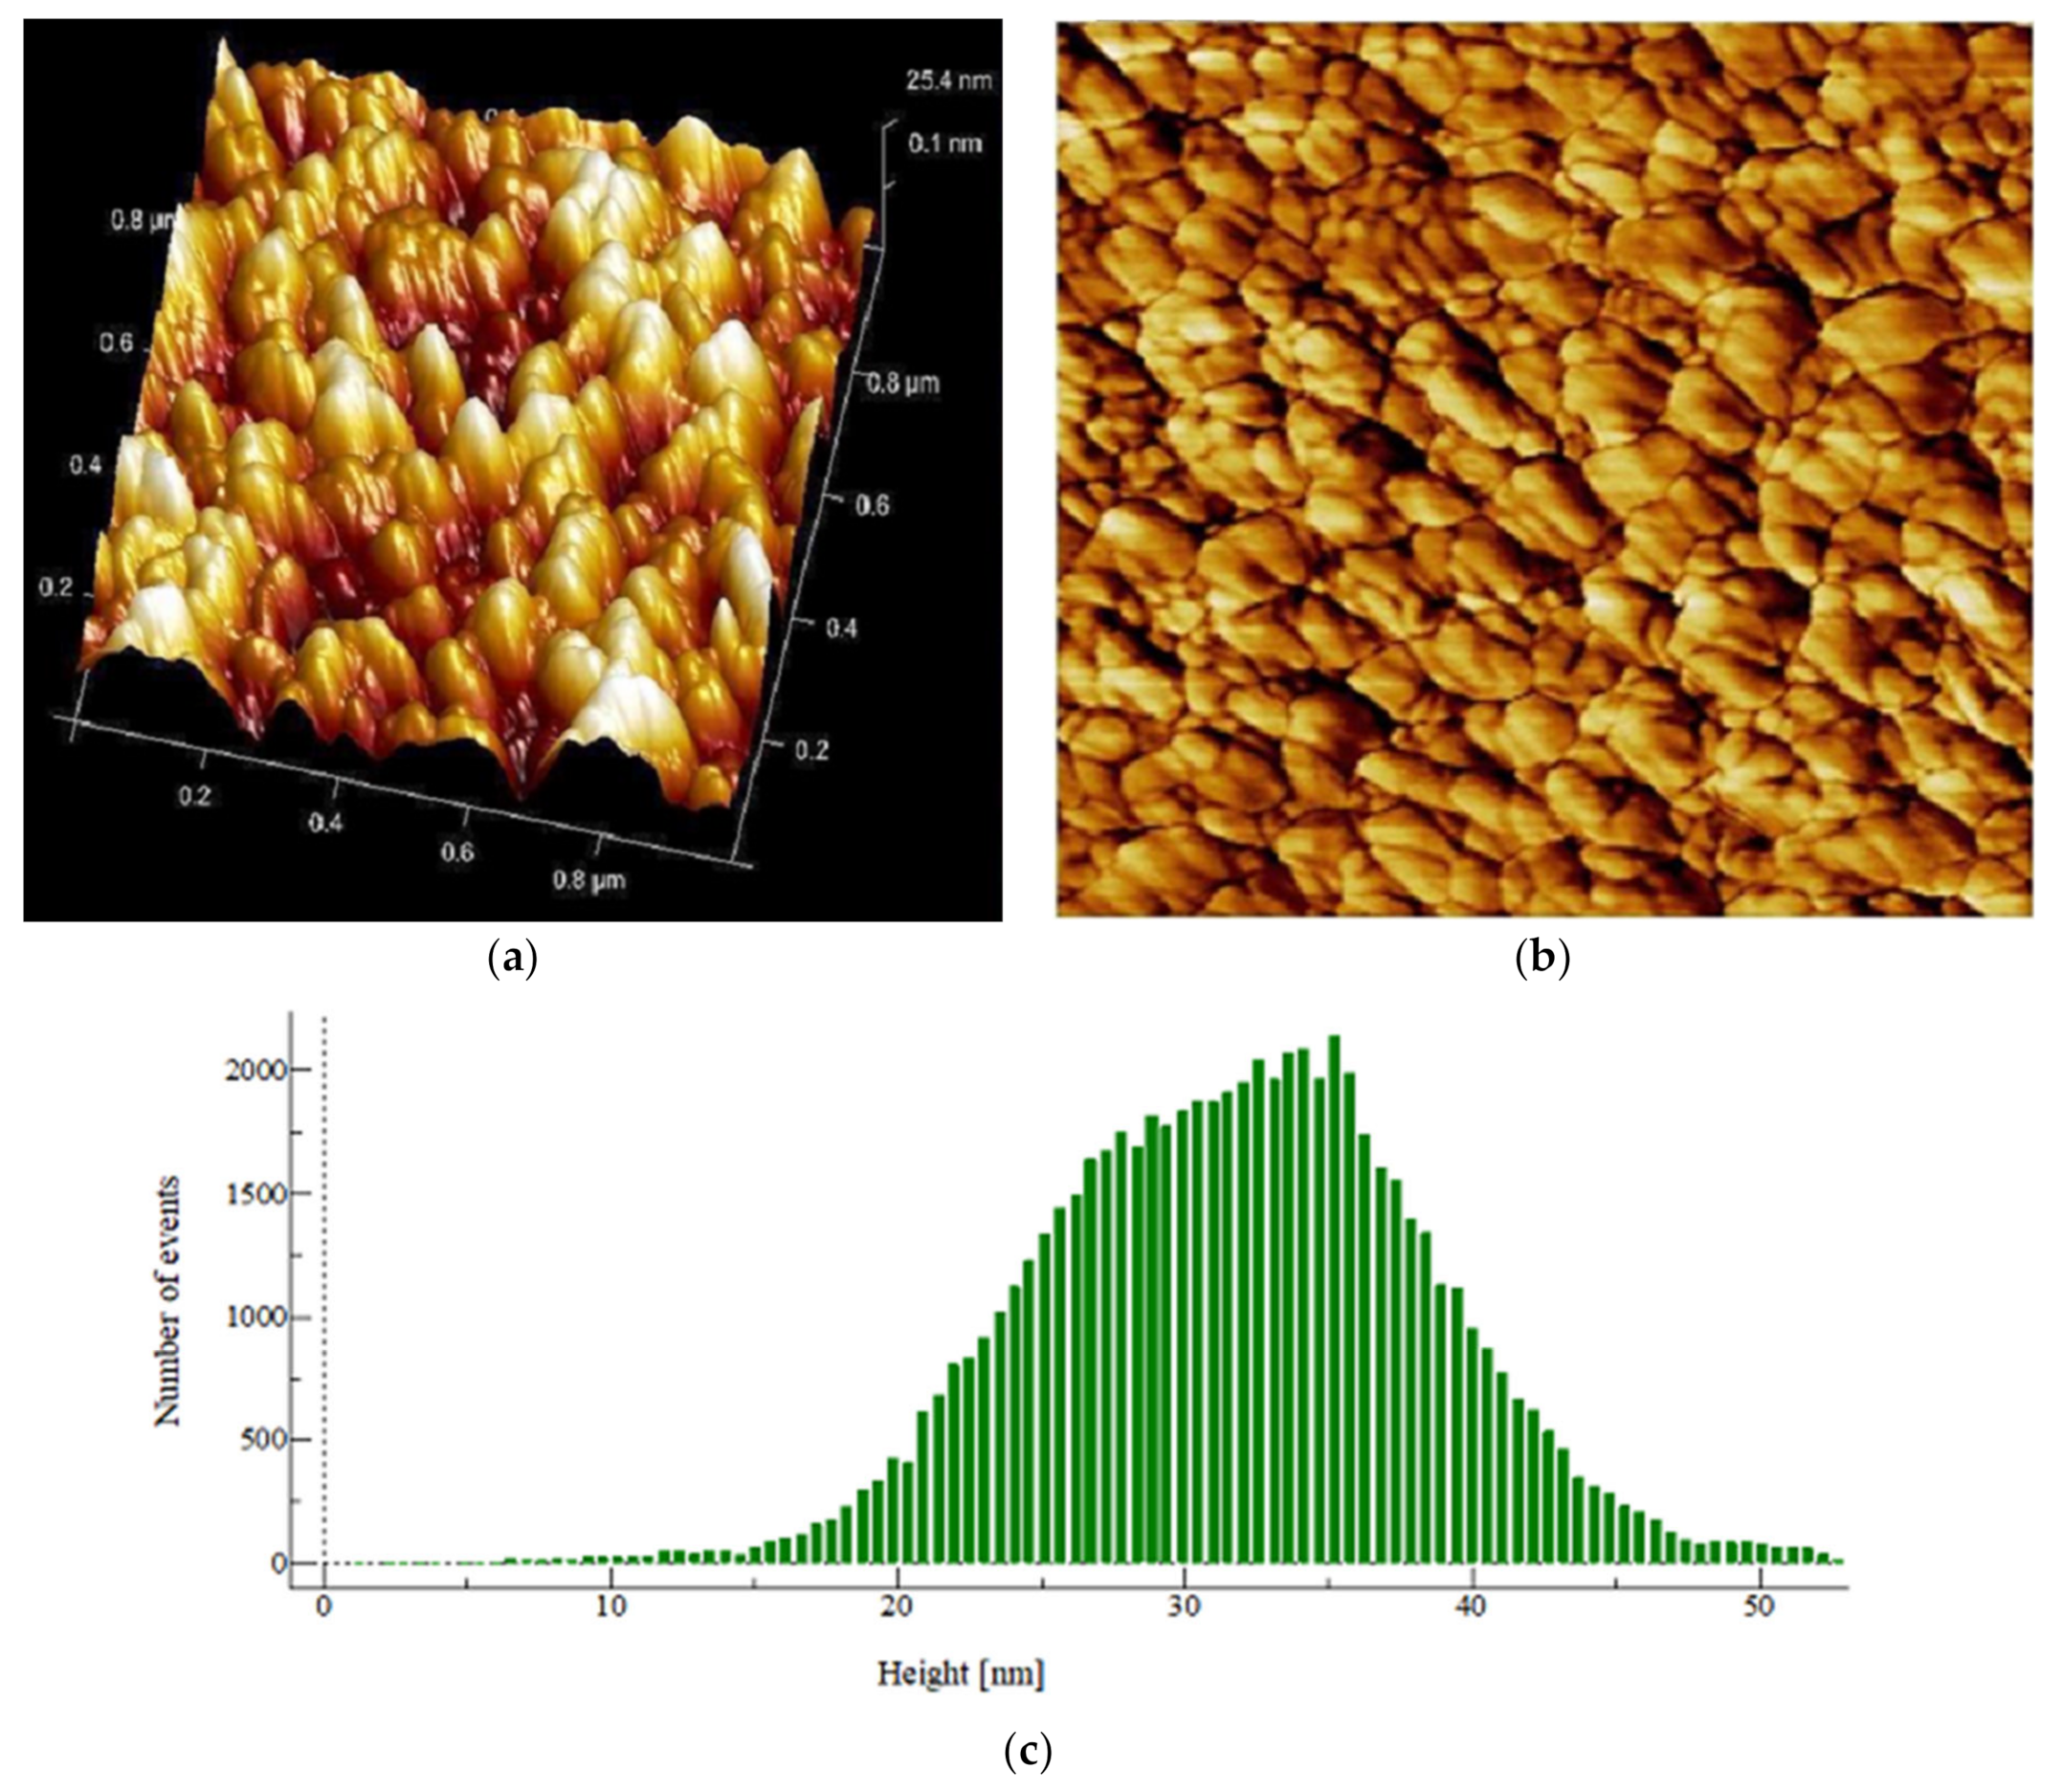
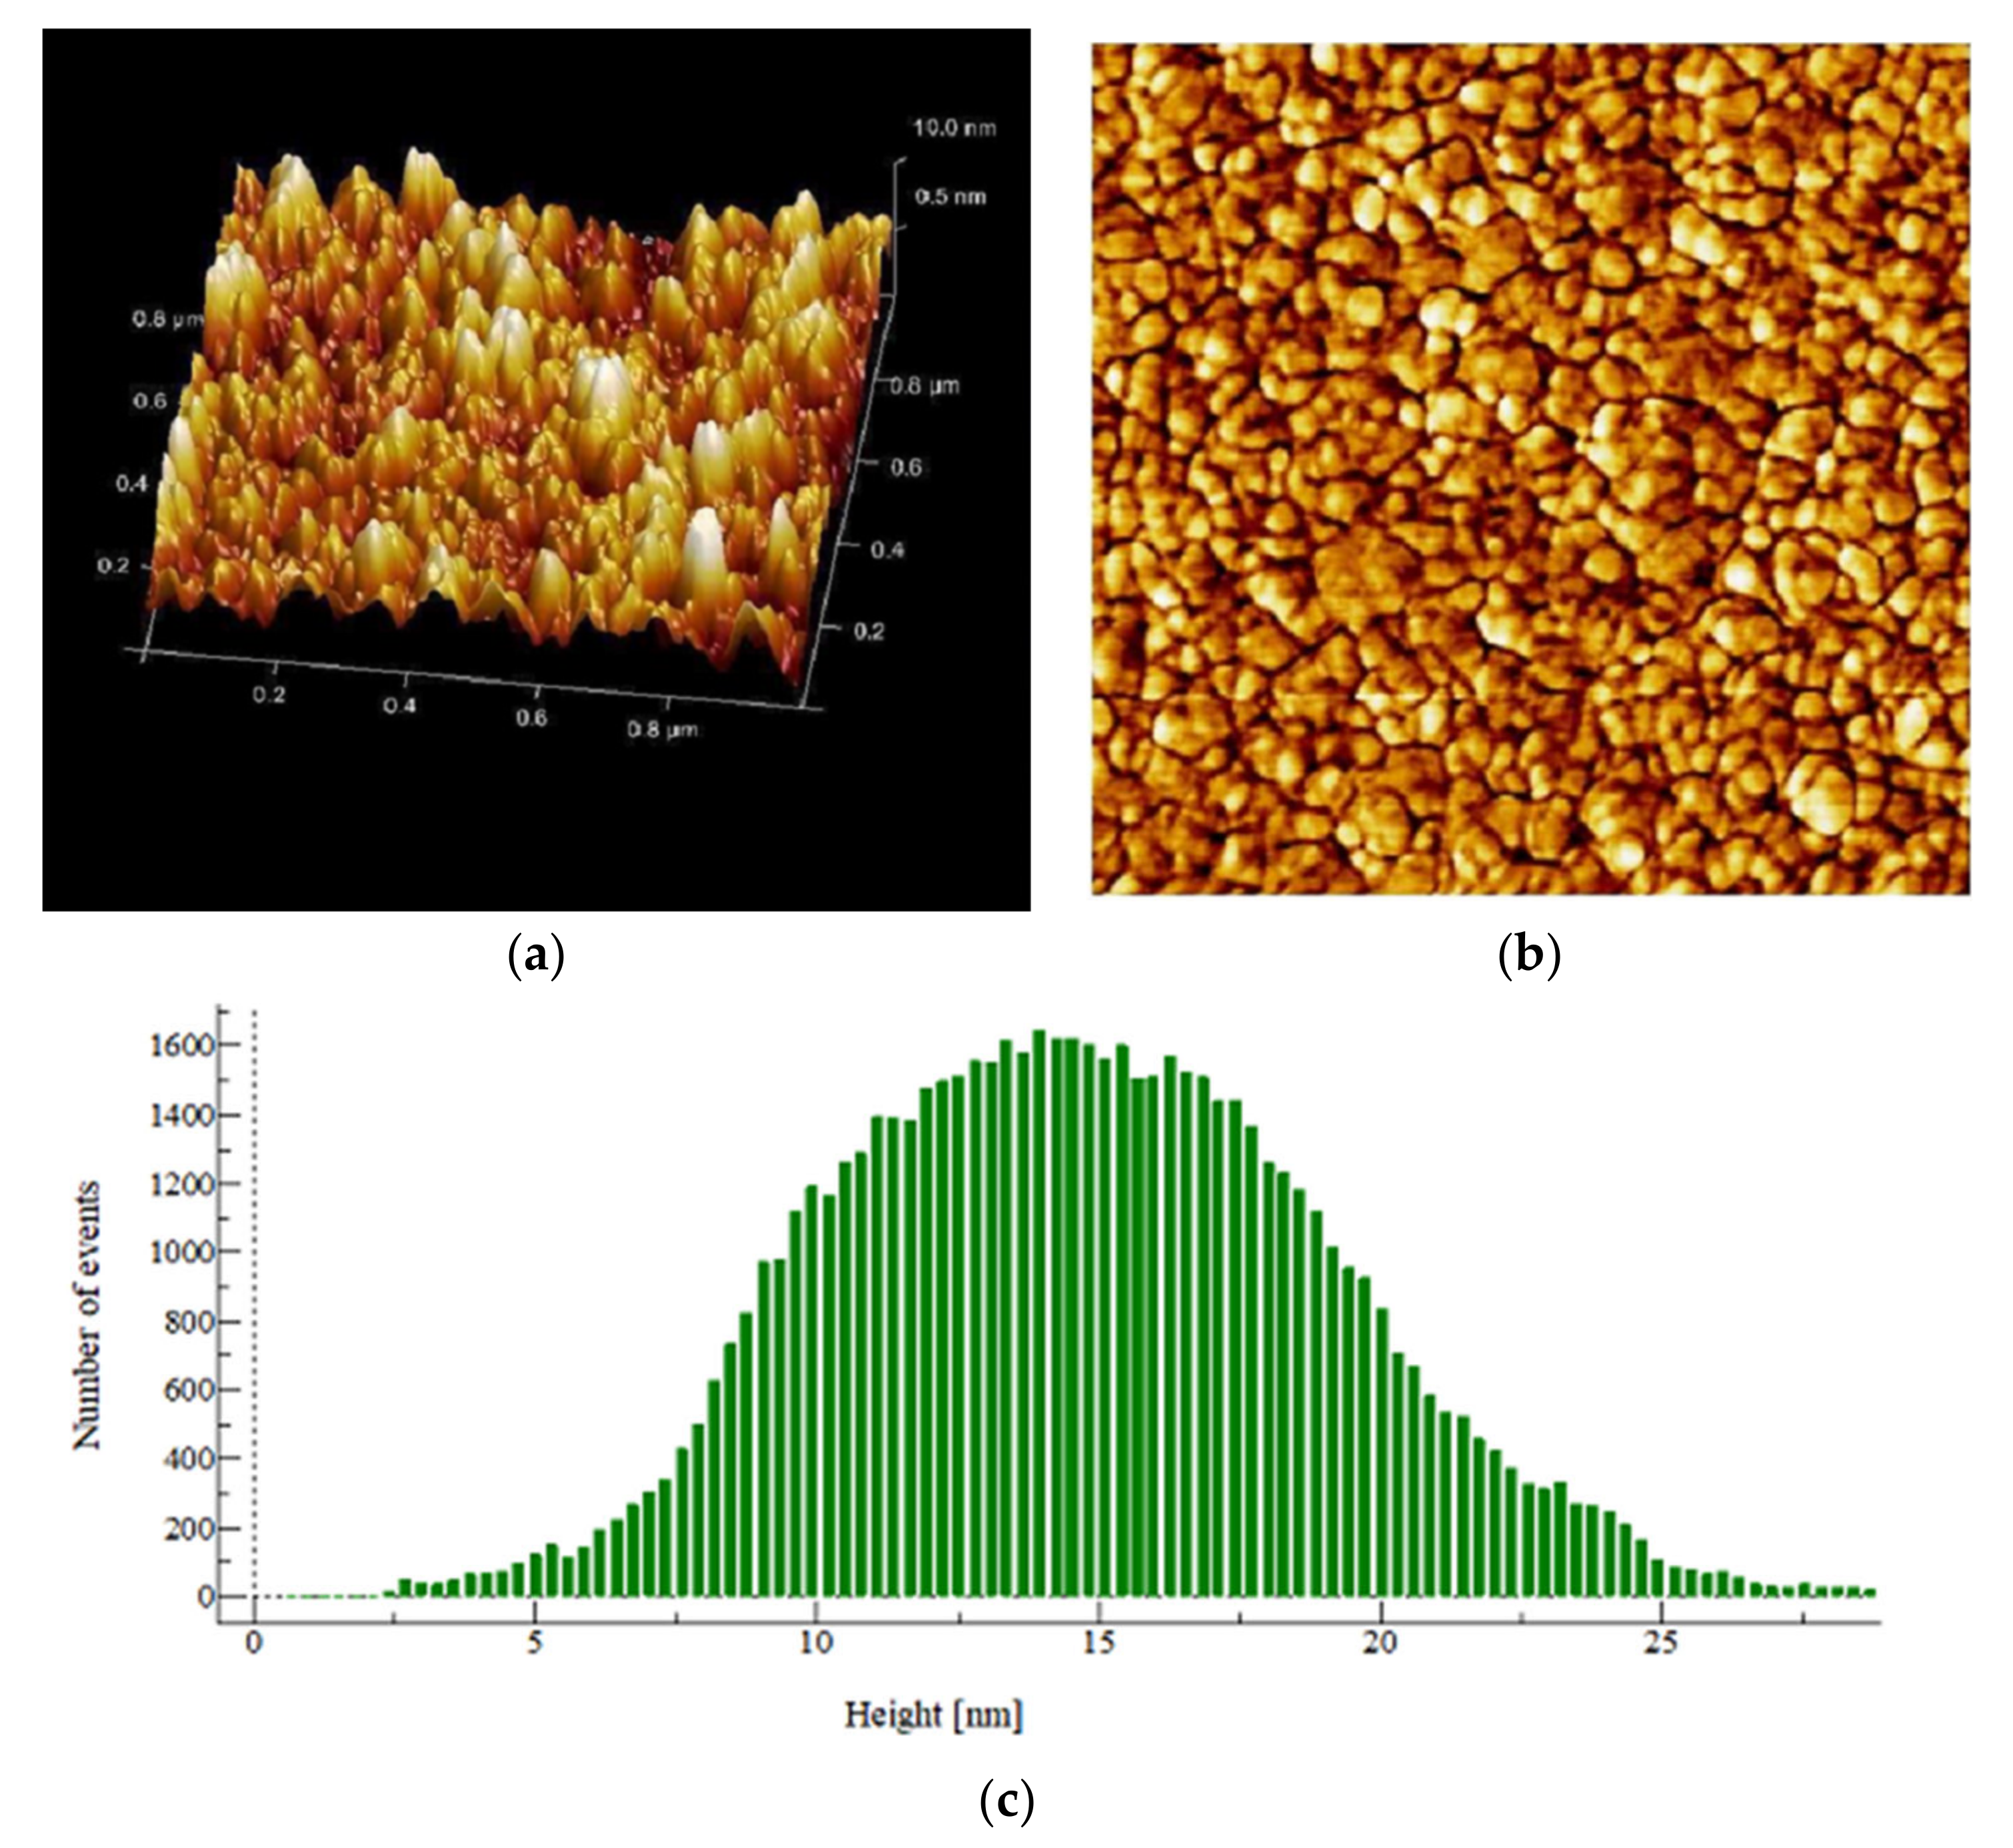
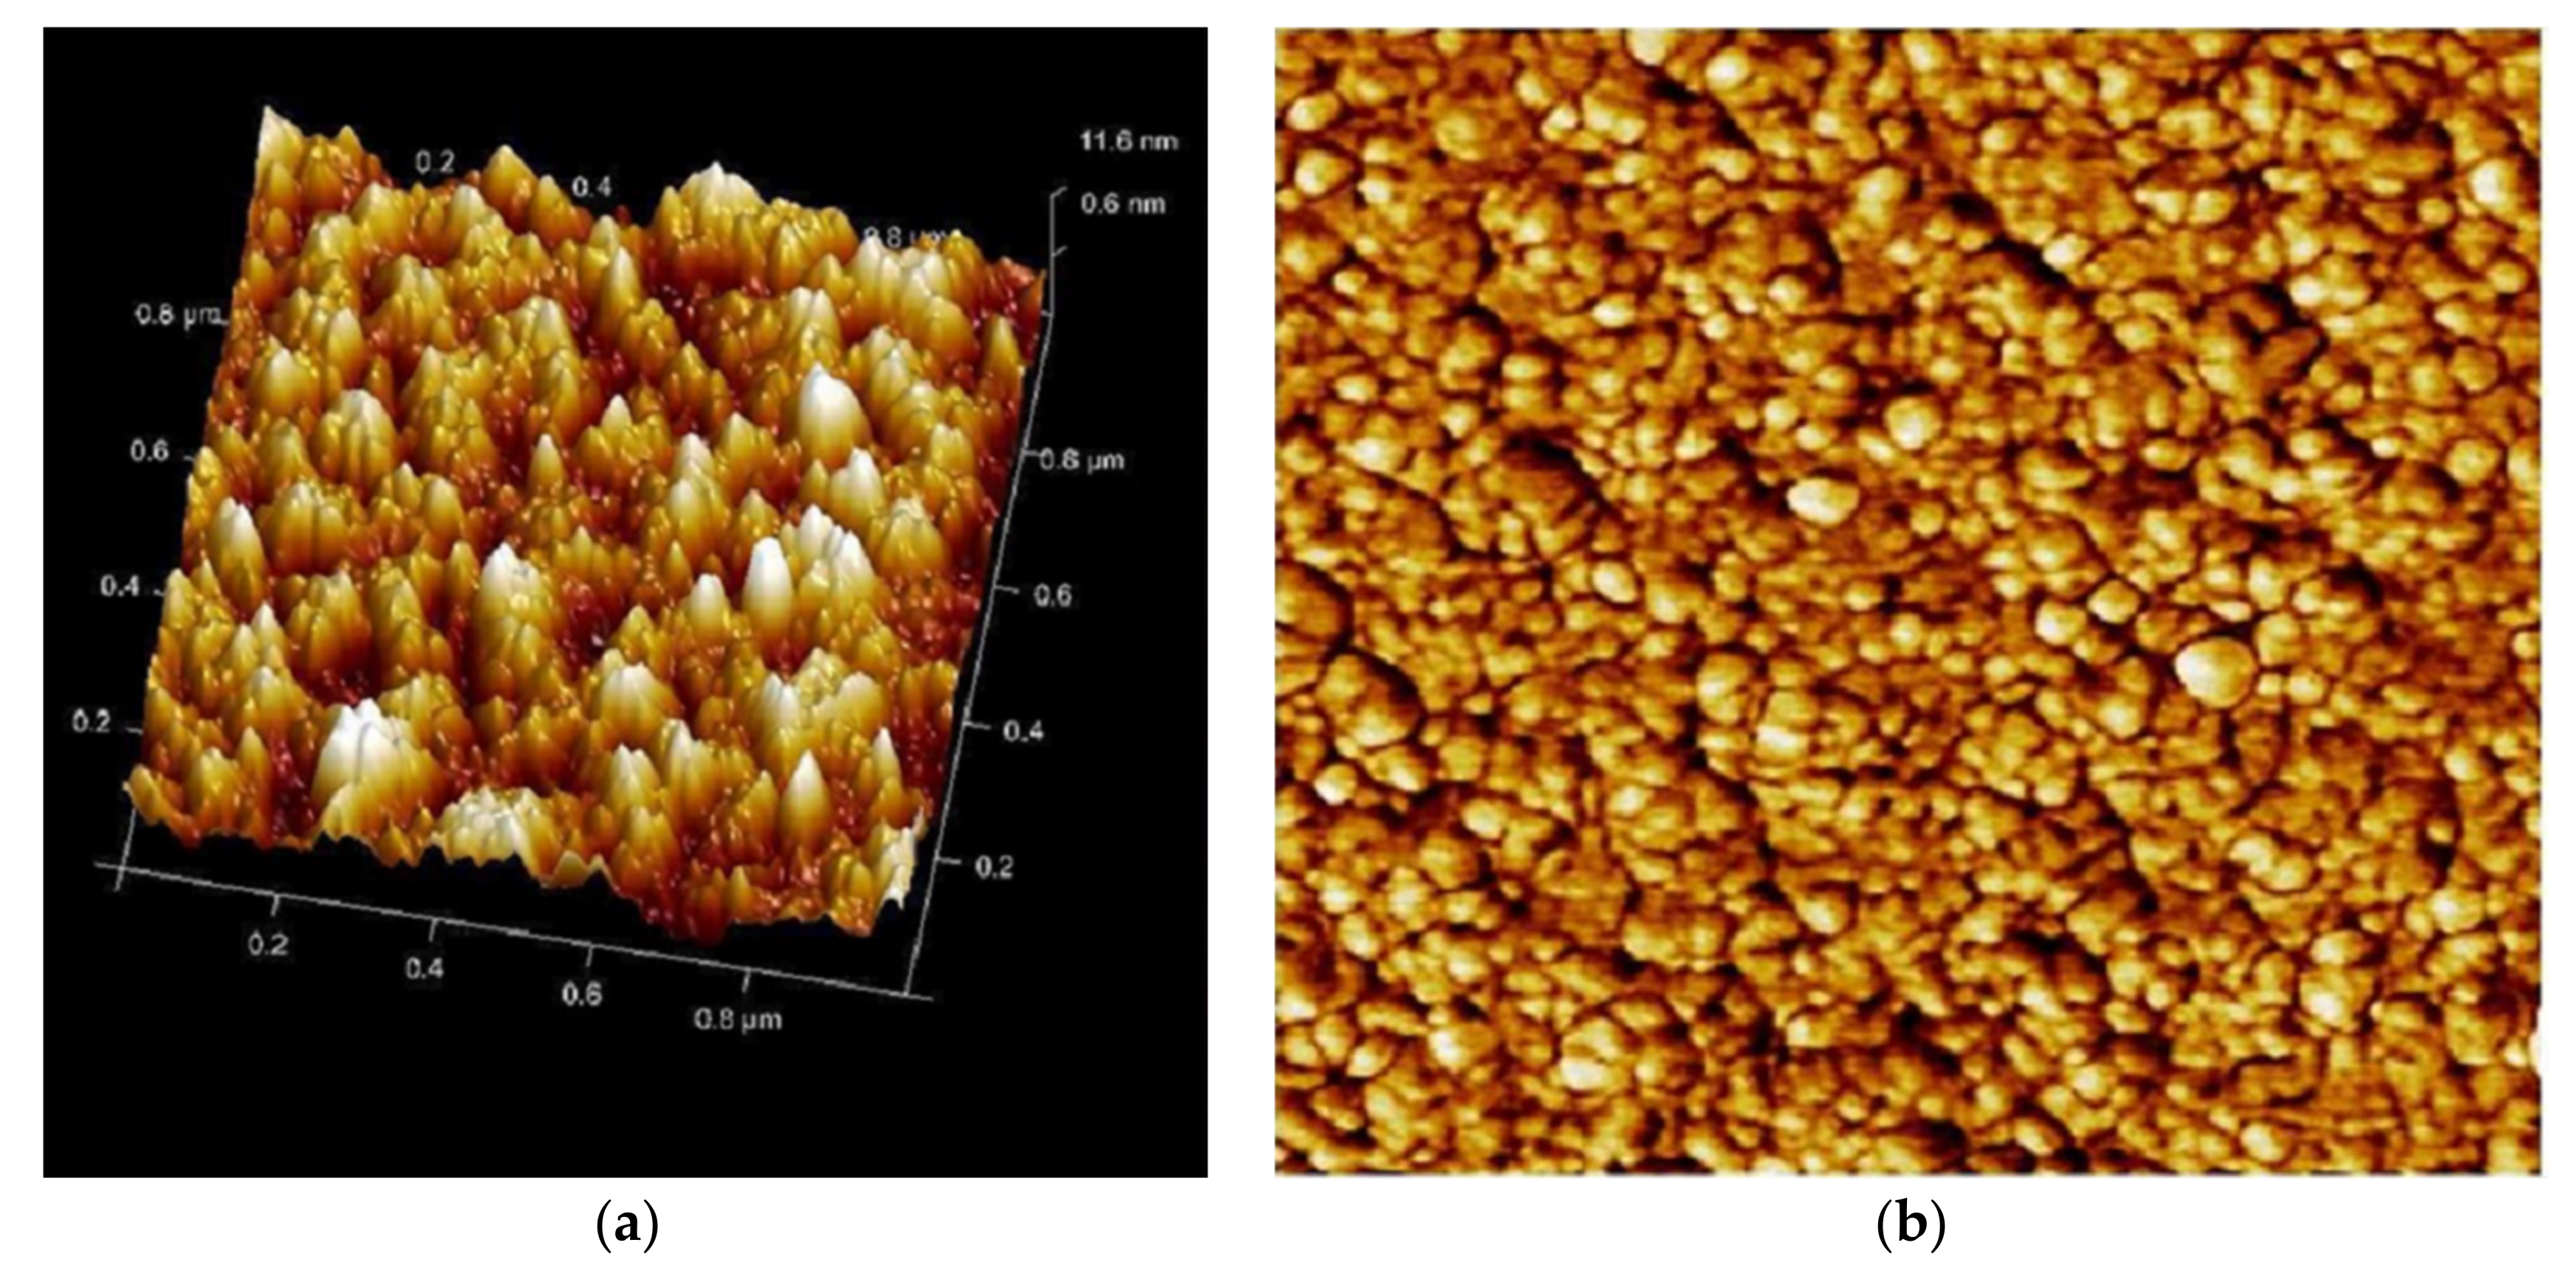
2.7.5. AFM Assisted Characterization of the Effects of PHELA® Extract on S. aureus Biofilm

S. aureus was cultured on MHB and the concentration was adjusted to 0.5 McFarland standards. The biofilms were grown on coverslips using 12 well plates in the presence or absence of standard or test materials. The cleaned coverslips were immersed in piranha solution (Conc. H2SO4 and 30% H2O2 in a ratio of 3:1) for 15 min and washed with sterile MilliQ water and dried in the vacuum desiccators. After 16 h of incubation at 37 °C, the coverslips were taken out and dried for 12 h and put in desiccators [25,26]. AFM was utilized to study the microbial systems including structure, topographical landscape and behavior of biofilms. The samples were analyzed using AFM (di INNOVA, Bruker) run by NanoDrive v8 real-time control & NanoScope Analysis software in semi-contact mode at the speed of 1 Hz in tapping mode [27]. The surface and roughness of AFM images were analyzed using the image acquisition software [28,29]. The AFM data were collected at 1 × 1 μm scan area. The statistical parameters like Root Mean Square (Sq), Reduced peak height (Spk), Reduced valley depth (Svk), Roughness Average (Sa), Surface skewness (Ssk), Coefficient of kurtosis (Ska) Surface Area Ratio (Sdr), % Maximum height (Sz) values were measured using WSxM 5.0 software [30].

3. Statistical Analysis

All the experiments were performed in triplicate and the values were presented in mean ± SEM using GraphPad InStat Version 5.0 (GraphPad Software, Inc., San Diego, CA, USA).

4. Results

The UPLC-MS/MS analysis revealed the presence of 7 compounds from 6 different chemical classes like Phenolic acid or diterpene, flavonoids with corresponding glycosides or glycoside, anthraquinone derivatives, reducing disaccharide in both ionization mode. The amount of emodin present in the extract was determined by RP-HPLC analysis. The in-vitro cytotoxicity assay indicates the extract having a CC50 value > 1 mg/mL and the CYP450 assay data showed lesser interaction with 3A4 and 2D6 isozymes. The extract was found to be most active against S. aureus and a concentration-dependent decrease in S. aureus biofilm formation was observed. AFM analysis showed reduction in height, average roughness of biofilm.

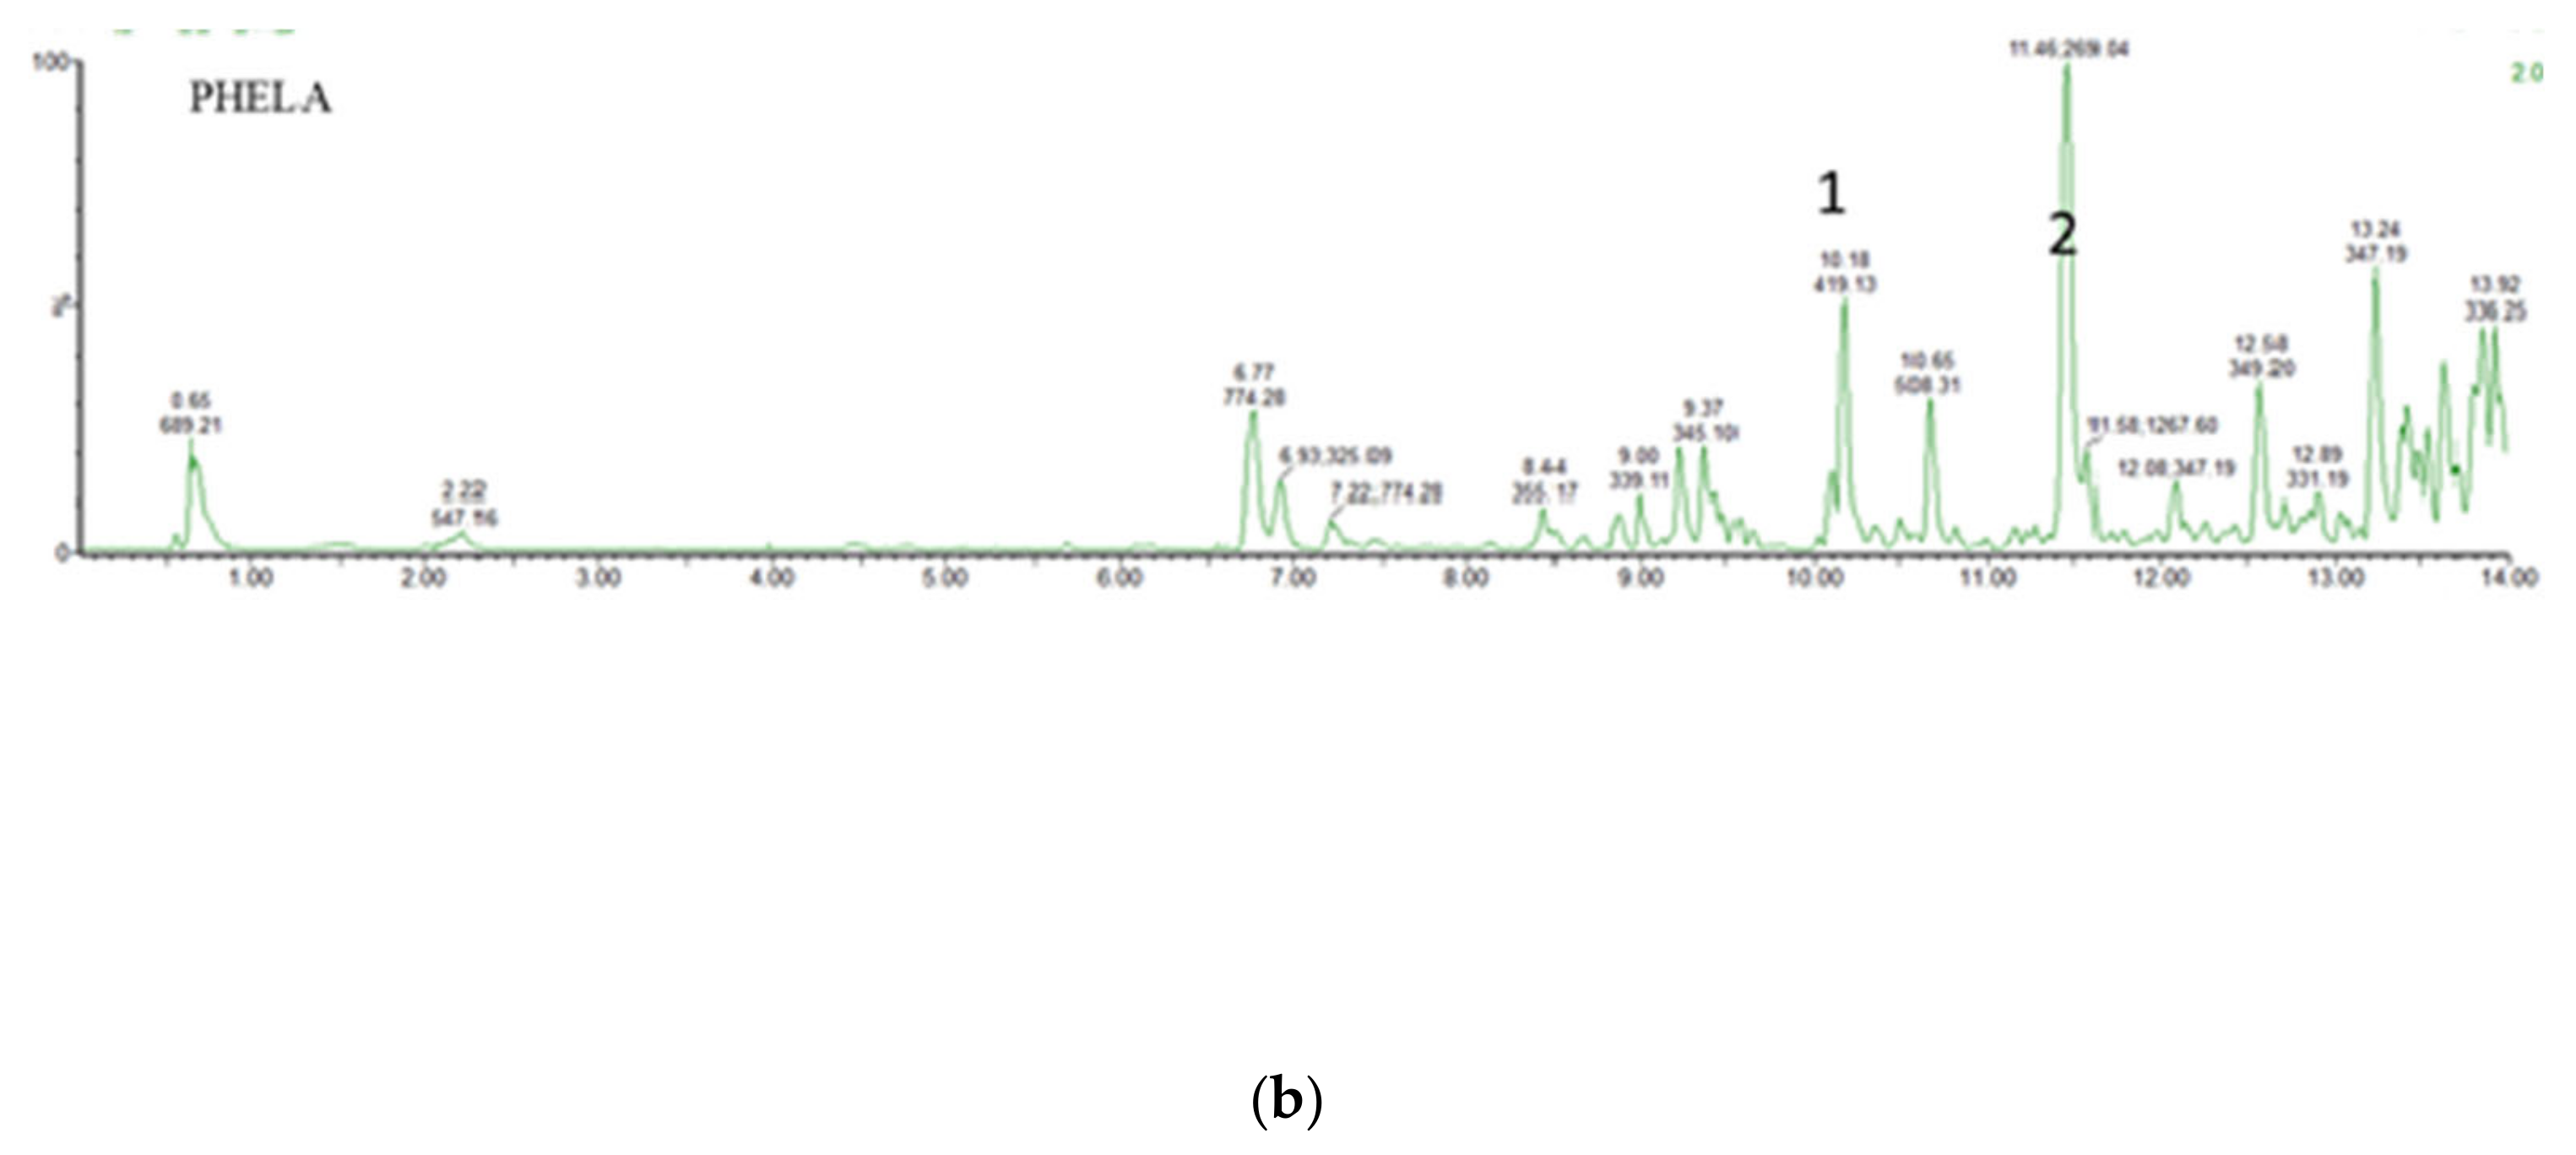
4.1. UPLC-MS Analysis of PHELA® Extract

Tentative identifications of compounds present in the hydro-alcohol extract of PHELA® was carried out using LC-ESI-QTOF/MS in both positive and negative ionization modes by interpretation of their UV absorbance, molecular weight, and characteristic MS/MS fragment ions. A total of 7 compounds from 6 different chemical classes like Phenolic acid or diterpene, flavonoids with corresponding glycosides or glycoside, anthraquinone derivatives, reducing disaccharide were characterized and better fragments were collected in negative ion mode (Figure 1). A flavonoids glycoside along with a reducing disaccharide namely 6-0-α-d-glucopyranosyl-d-fructose and Quercetin-3-O-alpha-l-rhamnopyranosyl(1-2)-beta-d-glucopyranoside-7-O-alpha-l-rhamnopyranoside were detected at Rt 0.6 and 6.7 min showing molecular ion [M-H] at m/z values at 341.1089 and 755.2406 [31,32,33]. A chalcone derivative of bioflavonoid was identified to be Hesperidin methyl chalcone, showing [M-H] at m/z value of 623.1974 at 6.8 min [34]. Martynoside, a phenolic acid at 7.9 min produces molecular ion [M-H] at m/z 651.2285 [35]. Another compound at Rt 13.4 showed molecular ion [M-H] at m/z 331.1906 and was identified to be Carnosol [36]. In positive ionization mode, a flavonoid glycoside identified as Isoliquiritin at Rt 10.18 min showed [M+H]+ ion at m/z 419.1349 [37]. An anthraquinone class compound detected at Rt 11.4 showing [M+H]+ ion at m/z at 269.0448 and identified to be emodin. Table 1 shows the theoretical and acquired m/z values for individual compounds with error ppm ± 5 under library identification scores >80.

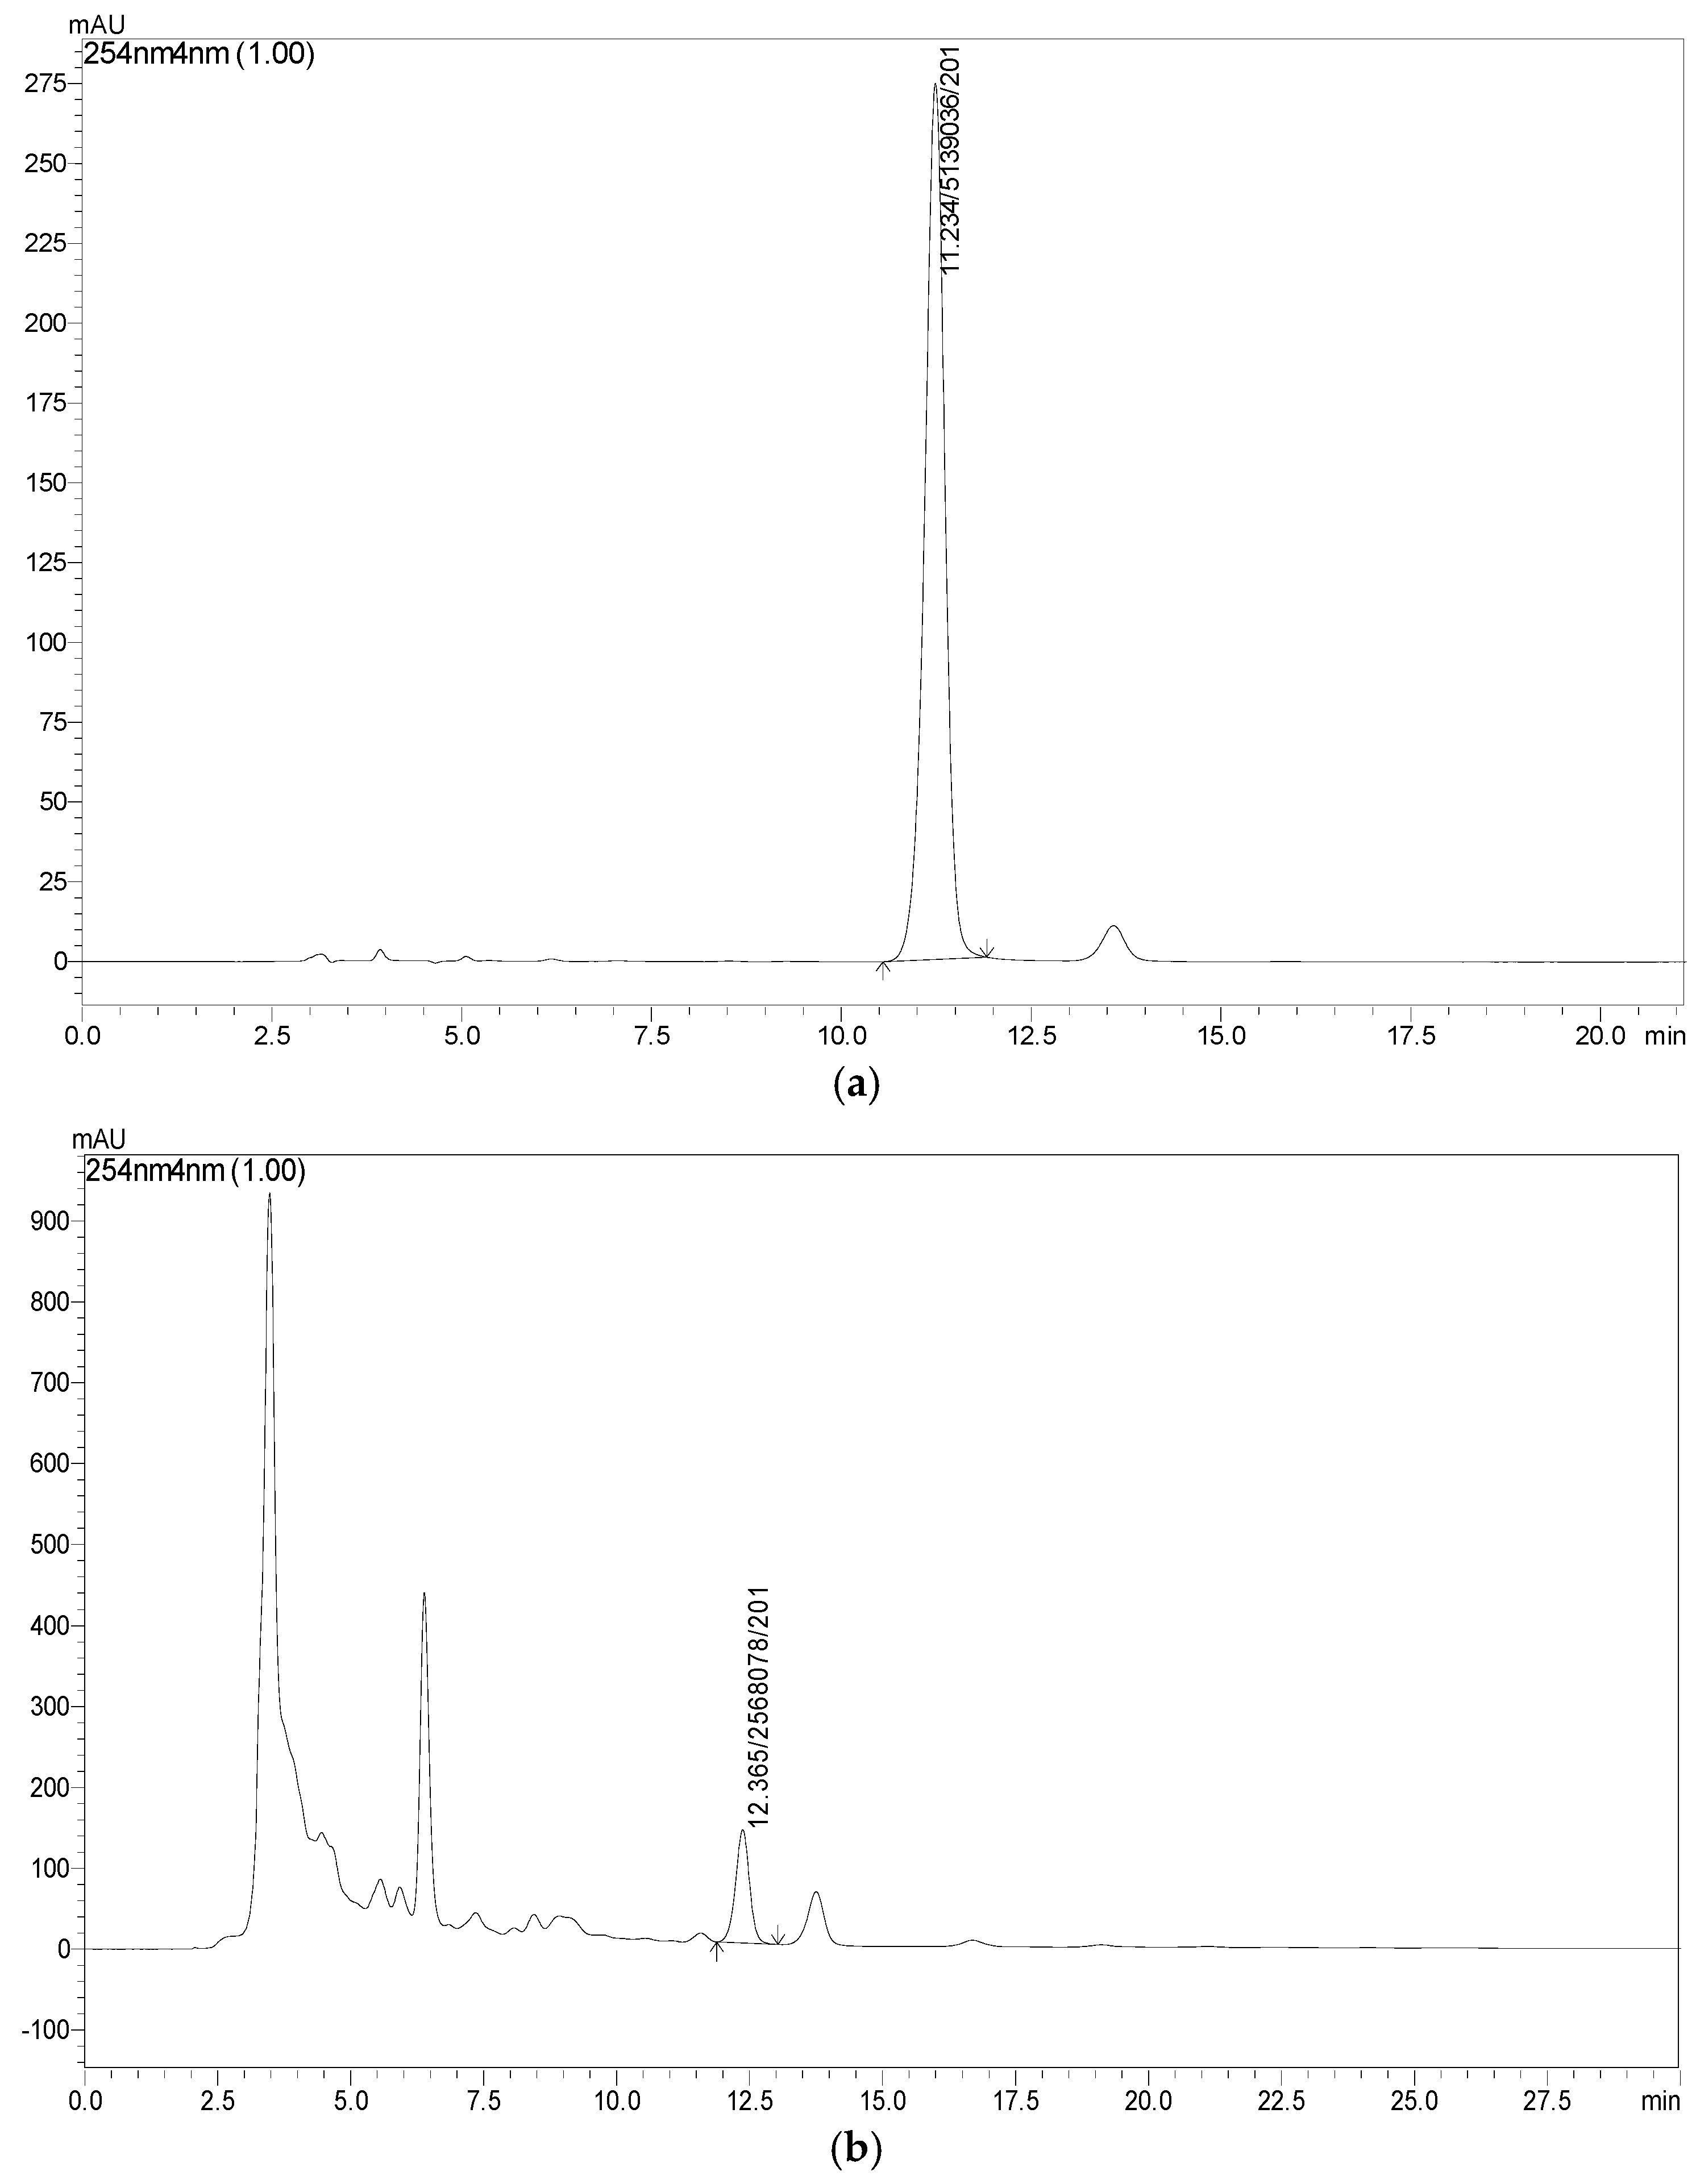
4.2. RP-HPLC Analysis of PHELA® Extract

The RP-HPLC analysis data reveals the presence of emodin at an amount of 1.64% (w/w) using external standard calibration technique. The r2 value was 0.997 under the isocratic elution using the optimized mobile phase methanol and water (80:20) with Rt of 11.14 min (Figure 2).

4.3. Safety Assessment of PHELA® Extract

The results obtained from in-vitro cytotoxicity assay shows that the extract has a CC50 value of 1250.45 ± 1.24 µg/mL where doxorubicin showed much more toxic against HepG2 cells with CC50 value of 5.25 ± 0.24 μg/mL at 24 h. The results indicate that the test material is least toxic in HepG2 cell line which justifies its safety aspects.
The interaction potential of the PHELA® formulation with different cytochromeP450 isozymes was performed using CYP450 isozymes inhibition assay to understand the safety aspect. Respective positive controls for each isozyme were used to confirm the assay precision. IC50 value of the extract and standards against CYP3A4 and CYP2D6 isozymes are represented in Figure 3. The IC50 values were found to be 0.2317 ± 2.14 and 0.2817 ± 3.65mg/mL against CYP3A4 and CYP2D6 for the extract. Results indicated that the PHELA® extracts showed the least interaction potential against both the CYP-isozymes compared to standard inhibitors. The IC50 values for the standards were 0.0643 ± 1.12 and 0.0739 ± 1.69 mg/mL respectively (Table 2).

4.4. Antibacterial and Anti-Biofilm Activity of PHELA® Extract

Determination of MIC and MBC

The antibacterial potency was evaluated using a 96 well microtitre plate broth dilution method against two strains of Gram-positive (S. aureus and B. substilis) and Gram-negative (E. coli and P. aeruginosa) bacteria. Streptomycin and ampicillin were used as positive control against Gram-positive and Gram-negative microorganisms, respectively. The MIC and MBC values were given in Table 3. From the bacterial susceptibility assay, PHELA® extract was found to be active against both gram-positive and gram-negative bacteria in a dose-dependent manner. The PHELA® extract showed the highest MIC value of 0.3125 ± 0.019 mg/mL against S. aureus.

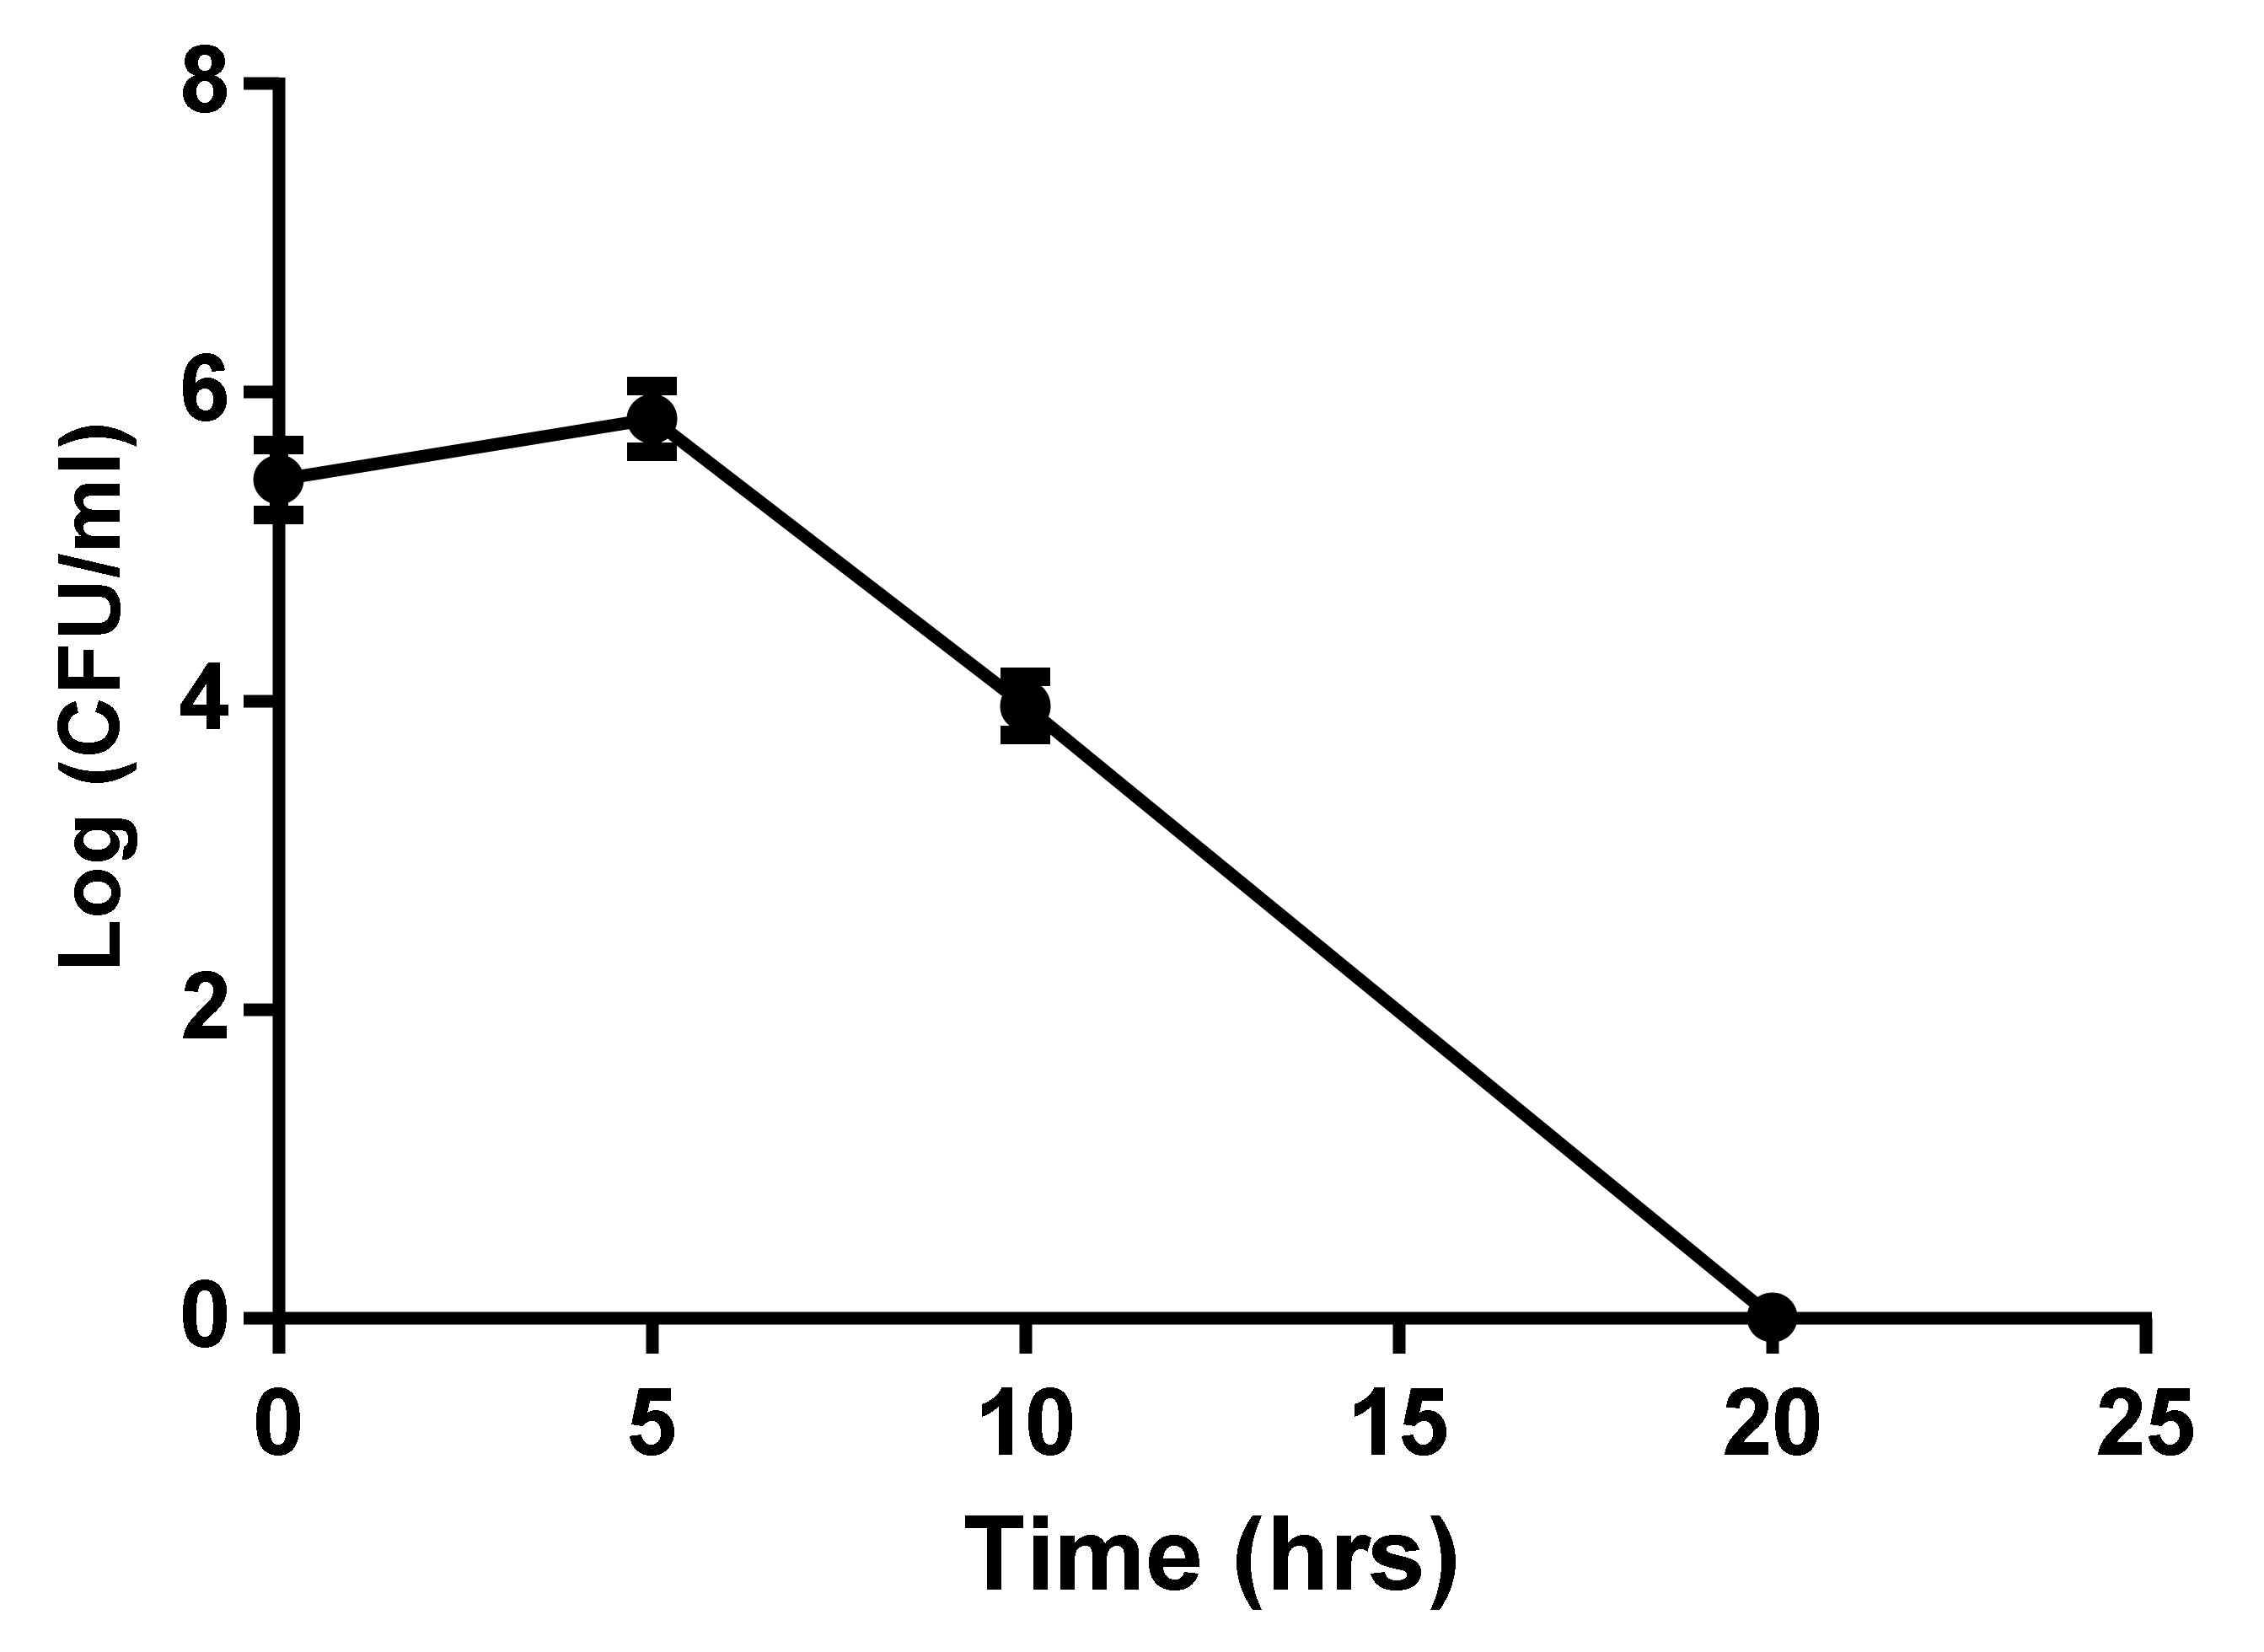
4.5. Growth Curve Analysis

Growth curve experiments demonstrated that PHELA® extract inhibited the growth of gram-positive microorganisms. Count been done in multiplication of dilution factor although almost no colony was found after 20 h treatment set (Figure 4).

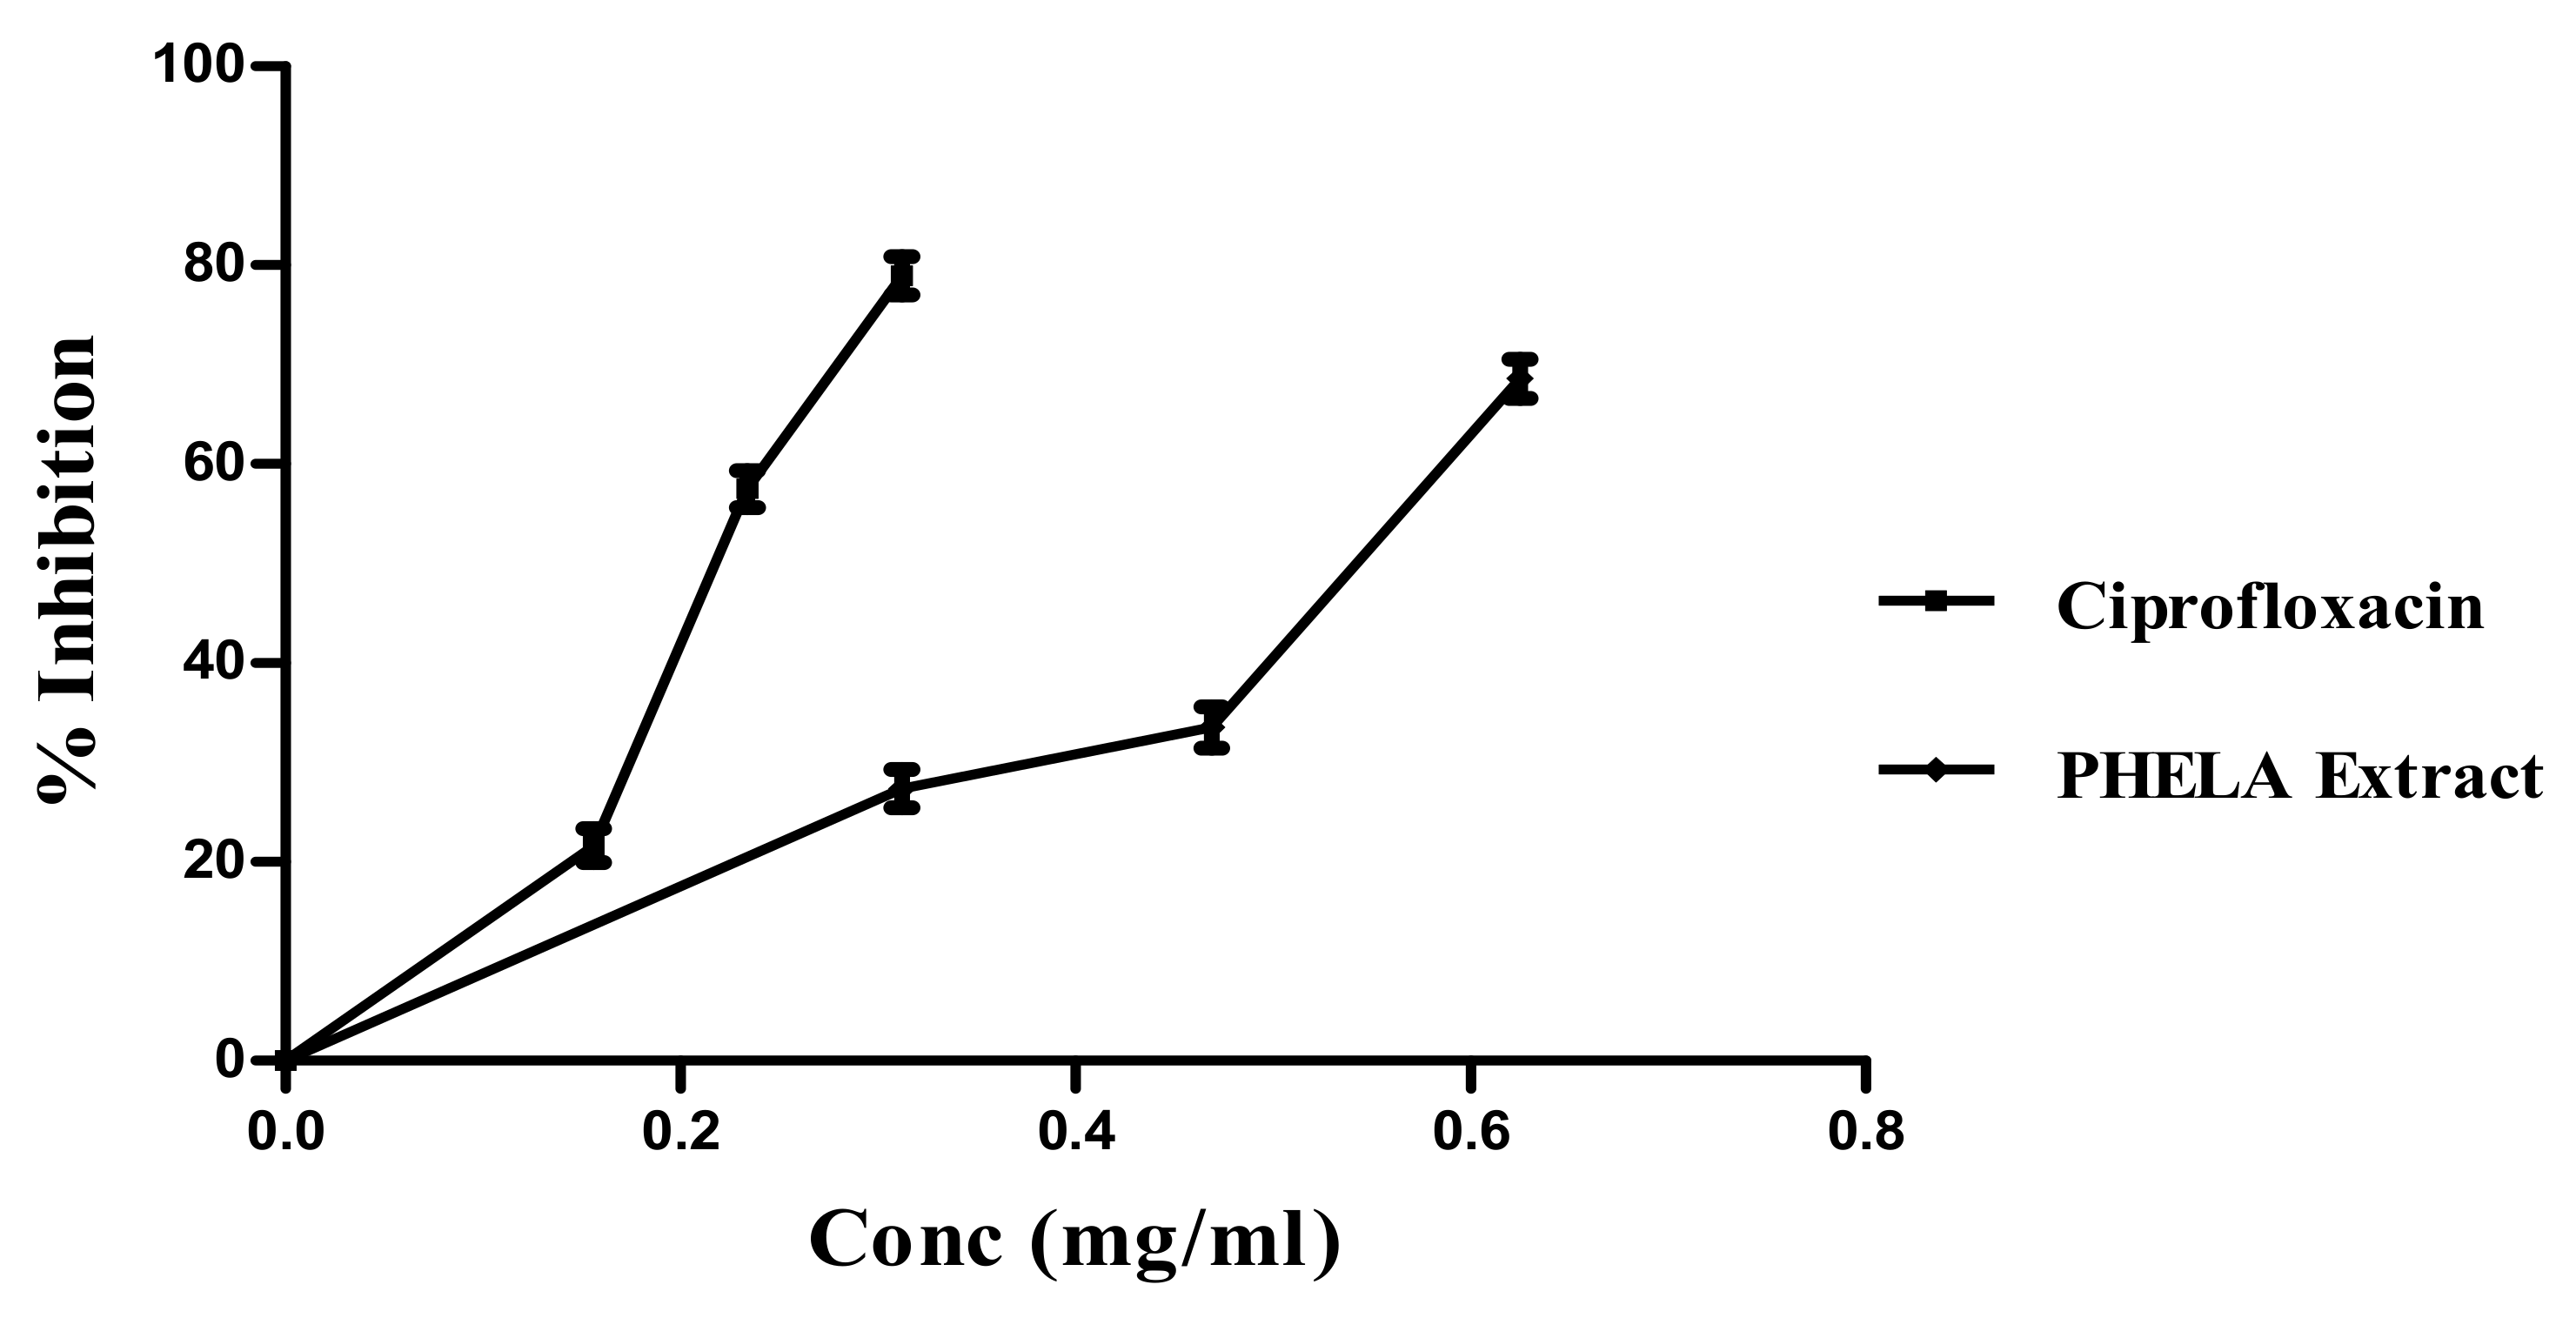
4.6. Effect of PHELA® on Formation of Biofilm

A comparable concentration-dependent decrease in biofilm formation was observed by PHELA® extract and Ciprofloxacin treatment. The extract produced 27.38 ± 1.57, 33.55 ± 1.68 and 68.59 ± 1.60% (0.312, 0.469 and 0.625 mg/mL) reduction in the biofilm produced by S. aureus where in case of ciprofloxacin the standard antimicrobial agent produced 21.67 ± 1.37, 57.53 ± 1.53 and 78.92 ± 1.57% (0.156, 0.234 and 0.312 mg/mL) inhibition of biofilm formation (Figure 5).
There is a great utility of AFM for studying single-cell bacteria. It allows the measurement of the mechanical properties of biofilms with high spatial resolution in terms of rms, skewness, kurtosis and Gaussian distribution. The images of control showed an increase in statistical parameters (Sq, Spk, Svk, Sa, Ssk, Ska, Sdr, Sz, etc.) as compared to the PHELA® and standard treated biofilm as calculated (Figure 6, Figure 7 and Figure 8). The most representative as the images obtained from the scans contain information about all the statistical parameters, and this information provided better visualization of the surface topology, three-dimensional micrographs (Table 4) [30].

5. Discussion

A biofilm is an evolving form of microbes that depend on the supra-cellular association that develops from the formation of the EPS matrix. Prevention of microbial cell attachment to surfaces is a better approach to inhibiting biofilm growth. The use of herbal medicine was found to be useful for decreasing microbial colony formation on surfaces which can afterwards turn into infections and become a major concern for immune-compromised patients [38,39,40]. Pretreatment of the surface with plant extracts produces an unfavorable film that promotes detachment, thereby reducing the surface adhesion. Although plant-derived antibacterial compounds generally demonstrate a lower degree of antimicrobial activity, the present study showed a dose-dependent reduction in biofilm formation by S. aureus, which remains a common causative organism associated with both nosocomial and community-acquired infections and wounds.
Antimicrobial activity of plant extracts is attributed to the presence of numerous bioactive secondary metabolites which are important components for exerting antimicrobial activity [41]. Many studies showed natural product-derived secondary metabolites with poor antimicrobial properties may exhibit synergy with different antimicrobial agents. Qualitative or quantitative characterization of herbal extract has enormous implications for validating its quality and the safety of the optimal concentrations of bio-active constituent present therein [42]. The data regarding the UPLC-ESI-QTOF/MS analysis shows the presence of seven metabolites in the extract from different phytochemical classes. The flavonoid derivative, Hesperidin methyl chalcone has anti-inflammation, skin wound healing, antimicrobial properties [43]. Martynoside was reported to be the most active compound from Boscia albitrunca, having potent antibacterial property against B. subtilis and K. pneumoniae [44]. Carnosol from Salvia officinalis was reported to potentiate the antimicrobial property of ethidium bromide, erythromycin and tetracycline [36]. In positive ionization mode, two compounds were identified to be present in the extract. Isoliquiritin, a flavonoid glycoside was characterized as is one of the major flavonoid glycoside extracted from Glycyrrhiza uralensis Fisch which helped to improve the antibacterial effect of meropenem, on NDM-1-positive Enterobacteria [37]. Another compound namely Emodin was found to be principal component in P. cucumerina possessing anti-biofilm and anti-virulence activities [45]. A study by Yan et al., showed emodin significantly decreased S. aureus biofilm growth in a dose-dependent manner by interrupting the release of extracellular DNA and inhibited expression of the biofilm-related genes by real-time RT-PCR [46]. The data regarding the RP-HPLC analysis shows the presence of emodin. These tentatively identified phytocompounds may contribute to the antibacterial and anti-biofilm property based on the available research works on individual phytocompounds. The statistical parameters calculated from AFM data showed a significant reduction in biofilm formation by PHELA® extract as compared to the standard drug ciprofloxacin. AFM provide a unique insight into the control of microbial populations within clinical and industrial environments. The PHELA® extract showed a significant reduction in statistical parameters as compared to the standard treated group [47]. The growth curve analysis data shows that the MBC concentration of PHELA® extract inhibited the growth at different time intervals at different dilutions and almost no colony was found after 20 h treatment set.
The traditional poly herbal formulations which have been used for several hundred years by the traditional practitioners are thought to be safe for their therapeutic efficacy. However, the interaction of these herbal components with drug metabolizing enzymes may alter the pharmacokinetic profile leads to clinically significant drug–drug or herb–drug interaction [48].
The interaction potential of the PHELA® formulation with different cytochromeP450 isozymes was examined using the CYP450 isozymes inhibition assay to understand the safety aspect. This assay was based on the ability of herb or herbal formulation to vie with the different fluorogenic substrate for different CYP isoforms. High throughput screening (HTS) for fluorimetric CYP inhibition is the most rapid and cost-effective approach to test the inhibition potential. The probe substrates used in these assays are derivatives of coumarin, which after dealkylation by CYPs generates fluorescent products. Respective positive controls for each isozyme were used to confirm the assay precision. Results indicated that the PHELA® extracts showed the least interaction potential against both the CYP-isozymes compared to standard inhibitors.
CYP3A4 mostly expressed in the human liver and intestine. It is possibly the most significant drug-metabolizing enzyme in humans which covers up to 60% of the total hepatic cytochrome P450 content [49]. Over 60% of drug candidates presently in use are bio-transformed by this drug metabolizing enzyme. This CYP isoform shows significant interaction with macrolide antibiotics, anti-arrhythmics drugs, benzodiazepine, immunomodulators, antiretroviral, prokinetic agents, calcium channel blockers, HMG CoA reductase etc. [50,51]. Besides these, it is also involved in the metabolism of testosterone, progesterone and androstenedione [52,53]. The CYP2D6 subclass is mainly expressed in duodenum and brain and comprises about 2% of total hepatic cytochrome P450 content. It involves biotransformation of over 70 different drug candidates through oxidation. Different therapeutic classes of drugs, like β-adrenergic blockers, antiarrhythmics, antipsychotics, antidepressants, and narcotic analgesics are the substrates for this isozyme [54,55,56].
It should be noted that simultaneous co-administration of potentially interacting herbs/herbal formulation with drugs cases altered pharmacokinetic profile resulting in unwanted toxicity. The data from the CYP450 isozyme inhibitory assay showed that the PHELA® formulation having higher IC50 values as compared to the standard inhibitor and thus will not be causing any harmful adverse reaction upon co-administration with the above-mentioned therapeutic classes of drugs.

6. Conclusions

New approaches should be applied for the control of biofilms because of the increased resistance of bacterial biofilms to different antimicrobial agents. In the present investigation, evaluation of therapeutic efficacy of PHELA® formulation as an anti-infective through translational of traditional knowledge and its ability to prevent biofilm formation has been evaluated along with standardization by RP-HPLC. The standardized extract showed a dose-dependent reduction in biofilm formation by S. aureus. The least cytotoxic effect on HepG2 cell line and the cytochromeP450 isozyme inhibitory assay confirms its safety upon co-administration with CYP450 3A4 and 2D6 substrates drug candidates. It may be concluded that the PHELA® extract may serve as a safe anti-infective agent against certain gram-positive bacteria might be due to its varied secondary plant constituents.
The present findings suggest that the PHELA® formulation may provide a safe and effective alternative to treat infectious diseases caused by S. aureus, particularly through inhibition of biofilm formation. The identified phytocompounds may contribute to the antibacterial and anti-biofilm property.

Author Contributions

Conceptualization, M.G.M., P.K.M. and S.K.; methodology, B.D., R.B., S.T. and A.K.; software, B.D.; validation, B.D., R.B., A.K. and S.T.; formal analysis, B.D.; investigation, B.D., R.B.; resources, P.K.M., M.G.M. and S.K.; data curation, B.D.; writing—original draft preparation, B.D.; writing—review and editing, P.K.M. and M.G.M.; visualization, B.D., P.K.M. and M.G.M.; supervision, P.K.M., M.G.M. and S.K.; project administration, P.K.M., M.G.M. and S.K.; funding acquisition, M.G.M. All authors have read and agreed to the published version of the manuscript.

Funding

The PHELA® has been funded by the Government of the Republic of South Africa through the Department of Science and Innovation and their IKS Based Innovations and Technology Development DSI CON: 0000/2021. The APC is funded by the Department of Pharmacology IKS Unit University of the Free State Bloemfontein Republic of South Africa.

Institutional Review Board Statement

Not applicable.

Informed Consent Statement

Not applicable.

Data Availability Statement

Not applicable.

Acknowledgments

The authors are thankful to the International Bilateral Cooperation Division, Department of Science and Technology, Government of India, New Delhi, India for financial support through DST-India & South Africa Project (DST No.-DST/INT/South Africa/P-17/2016) and DST-NRF Unique Grant No. 104775 UFS Entity 1 047 N1418 for this work. We acknowledge the involvement and meaningful participation of Traditional Health Practitioner, the late Anthony Imbuwana from South Africa and sharing their knowledge with us.

Conflicts of Interest

The authors declare that they have no conflict of interest.

Abbreviations

EPSExtracellular polymeric substances
MHBMuller Hinton Broth
ATCCAmerican Type Culture Collection
PHAEHydro-alcoholic extract of PHELA®
RP-HPLCReverse Phase- High Performance Liquid Chromatography
PDAPhotodiode Array
CYPCytochrome
MICMinimum Inhibitory Concentration
MBCMinimum Bactericidal Concentration
AFMAtomic Force Microscopy
SqRoot Mean Square
SpkReduced peak height
SvkReduced valley depth
SaRoughness Average
SskSurface skewness
SkaCoefficient of kurtosis
SdrSurface Area Ratio
Sz% Maximum height
r2correlation coefficient
RtRetention time

References

  1. Costerton, J.W.; Stewart, P.S.; Greenberg, E.P. Bacterial Biofilms: A Common Cause of Persistent Infections. Science 1999, 284, 1318–1322. [Google Scholar] [CrossRef] [Green Version]
  2. Mah, T.-F.C.; O’Toole, G.A. Mechanisms of biofilm resistance to antimicrobial agents. Trends Microbiol. 2001, 9, 34–39. [Google Scholar] [CrossRef]
  3. Hugo, W.B.; Denyer, S.P.; Hodges, N.A.; Gorman, S.P. Hugo and Russell’s Pharmaceutical Microbiology, 7th ed.; Blackwell Science: Malden, MA, USA, 2004. [Google Scholar]
  4. Flemming, H.-C.; Wingender, J.; Szewzyk, U.; Steinberg, P.; Rice, S.A.; Kjelleberg, S. Biofilms: An emergent form of bacterial life. Nat. Rev. Microbiol. 2016, 14, 563–575. [Google Scholar] [CrossRef]
  5. Neu, T.R.; Lawrence, J.R. Innovative techniques, sensors, and approaches for imaging biofilms at different scales. Trends Microbiol. 2015, 23, 233–242. [Google Scholar] [CrossRef] [PubMed]
  6. Bjarnsholt, T.; Jensen, P.Ø.; Burmølle, M.; Hentzer, M.; Haagensen, J.A.J.; Hougen, H.P.; Calum, H.; Madsen, K.G.; Moser, C.; Molin, S.; et al. Pseudomonas aeruginosa tolerance to tobramycin, hydrogen peroxide and polymorphonuclear leukocytes is quorum-sensing dependent. Microbiology 2005, 151 Pt 2, 373–383. [Google Scholar] [CrossRef] [Green Version]
  7. Essawi, T.; Srour, M. Screening of some Palestinian medicinal plants for antibacterial activity. J. Ethnopharmacol. 2000, 70, 343–349. [Google Scholar] [CrossRef]
  8. Guarrera, P.M. Traditional phytotherapy in Central Italy (Marche, Abruzzo, and Latium). Fitoterapia 2005, 76, 1–25. [Google Scholar] [CrossRef]
  9. Mukherjee, P.K. Evaluation of Herbal Drugs for Antimicrobial and Parasiticidal Effects. In Quality Control and Evaluation of Herbal Drugs; Mukherjee, P.K., Ed.; Elsevier: Amsterdam, The Netherlands, 2019; pp. 573–598. [Google Scholar]
  10. Sen, T.; Karmakar, S.; Sarkar, R. Evaluation of Natural Products against Biofilm-Mediated Bacterial Resistance. In Evidence-Based Validation of Herbal Medicine; Mukherjee, P.K., Ed.; Elsevier: Amsterdam, The Netherlands, 2015; pp. 321–338. [Google Scholar]
  11. Colalto, C. Herbal interactions on absorption of drugs: Mechanisms of action and clinical risk assessment. Pharmacol. Res. 2010, 62, 207–227. [Google Scholar] [CrossRef]
  12. Ma, H. The Formulation, Manufacture and Evaluation of Capsules Containing Freeze-Dried Aqueous Extracts of Leonotis Leonorus or Mentha Longifolia. 2006. Available online: http://etd.uwc.ac.za/xmlui/bitstream/handle/11394/1925/Ma_MPHARM_2006.pdf?isAllowed=y&sequence=1 (accessed on 8 May 2021).
  13. Taylor, L. The Healing Power of Rainforest Herbs: A Guide to Understanding and Using Herbal Medicinals; Square One Publishers: Garden City Park, NY, USA, 2005; pp. 243–253. [Google Scholar]
  14. Lekhooa, M.R.; Walubo, A.; du Plessis, J.B.; Matsabisa, M.G. The development and use of a drug-induced immunosuppressed rat-model to screen Phela for mechanism of immune stimulation. J. Ethnopharmacol. 2017, 206, 8–18. [Google Scholar] [CrossRef]
  15. Das, B.; Kar, A.; Matsabisa, M.; Mukherjee, P. Anti-Cholinesterase Potential of Standardized Extract of PHELA a Traditional South African Medicine Formulation. J. Herb. Med. 2002, 22, 100348. [Google Scholar] [CrossRef]
  16. Lekhooa, M.; Walubo, A.; Du Plessis, J.J.; Matsabisa, M.C.; Molefe, D. Evaluation of traditional medicines I: Identification of Phela using different chromatographic techniques. Afr. J. Tradit. Complement. Altern. Med. 2012, 9, 27–39. [Google Scholar] [CrossRef] [PubMed] [Green Version]
  17. Lekhooa, M.; Walubo, A.; Du Plessis, J.J.; Matsabisa, M.G. Evaluation of traditional medicines II: The use of metabolite peak-kinetics to monitor PHELA in rat plasma. Afr. J. Tradit. Complement. Altern. Med. 2012, 9, 73–80. [Google Scholar]
  18. Husein, A.; Ali-shtayeh, M.S.; Jondi, W.; Zatar, N.; Al-Nuri, M.A. High Performance Liquid Chromatographic Method for Quantitative Determination of Emodin in Rumex Cyprius Marb, Spectrophotometric Studies. Int. J. Sci. Basic Appl. Res. 2014, 18, 217–222. [Google Scholar]
  19. Kar, A.; Mukherjee, P.K.; Saha, S.; Banerjee, S.; Goswami, D.; Matsabisa, M.G.; Charoensub, R.; Duangyodd, T. Metabolite profiling and evaluation of CYP450 interaction potential of ‘Trimada’—An Ayurvedic formulation. J. Ethnopharmacol. 2021, 266, 113457. [Google Scholar] [CrossRef] [PubMed]
  20. Bahadur, S.; Mukherjee, P.K.; Milan Ahmmed, S.K.; Kar, A.; Harwansh, R.K.; Pandit, S. Metabolism-mediated interaction potential of standardized extract of Tinospora cordifolia through rat and human liver microsomes. Indian J. Pharmacol. 2016, 48, 576–581. [Google Scholar]
  21. Wiegand, I.; Hilpert, K.; Hancock, R.E.W. Agar and broth dilution methods to determine the minimal inhibitory concentration (MIC) of antimicrobial substances. Nat. Protoc. 2008, 3, 163–175. [Google Scholar] [CrossRef]
  22. Balouiri, M.; Sadiki, M.; Ibnsouda, S.K. Methods for in vitro evaluating antimicrobial activity: A review. J. Pharm. Anal. 2016, 6, 71–79. [Google Scholar] [CrossRef] [PubMed] [Green Version]
  23. Sarkar, R.; Chaudhary, S.K.; Sharma, A.; Yadav, K.K.; Nema, N.K.; Sekhoacha, M.; Karmakar, S.; Braga, F.C.; Matsabisa, M.G.; Mukherjee, P.K.; et al. Anti-biofilm activity of Marula—A study with the standardized bark extract. J. Ethnopharmacol. 2014, 154, 170–175. [Google Scholar] [CrossRef]
  24. Pompilio, A.; Scocchi, M.; Pomponio, S.; Guida, F.; Di Primio, A.; Fiscarelli, E.; Gennaro, R.; Di Bonaventura, G. Antibacterial and anti-biofilm effects of cathelicidin peptides against pathogens isolated from cystic fibrosis patients. Peptides 2011, 32, 1807–1814. [Google Scholar] [CrossRef]
  25. Azeredo, J.; Azevedo, N.F.; Briandet, R.; Cerca, N.; Coenye, T.; Costa, A.R.; Desvaux, M.; Di Bonaventura, G.; Hébraud, M.; Jaglic, Z.; et al. Critical review on biofilm methods. Crit. Rev. Microbiol. 2017, 43, 313–351. [Google Scholar] [CrossRef] [Green Version]
  26. Wright, C.J.; Shah, M.K.; Powell, L.C.; Armstrong, I. Application of AFM from microbial cell to biofilm. Scanning 2010, 32, 134–149. [Google Scholar] [CrossRef] [PubMed]
  27. Oh, Y.J.; Lee, N.R.; Jo, W.; Jung, W.K.; Lim, J.S. Effects of substrates on biofilm formation observed by atomic force microscopy. Ultramicroscopy 2009, 109, 874–880. [Google Scholar] [CrossRef]
  28. Gordon, V.D.; Davis-Fields, M.; Kovach, K.; Rodesney, C.A. Biofilms and mechanics: A review of experimental techniques and findings. J. Phys. D Appl. Phys. 2017, 50, 223002. [Google Scholar] [CrossRef]
  29. Chatterjee, S.; Biswas, N.; Datta, A.; Dey, R.; Maiti, P.K. Atomic force microscopy in biofilm study. Microscopy 2014, 63, 269–278. [Google Scholar] [CrossRef] [PubMed]
  30. Kunti, A.K.; Sharma, S.K.; Gupta, M. A Comparative Study on Structural Growth of Copper Oxide Deposited by dc-MS and HiPIMS. ECS J. Solid State Sci. Technol. 2016, 5, 650–655. [Google Scholar] [CrossRef]
  31. Halabalaki, M.; Urbain, A.; Paschali, A.; Mitakou, S.; Tillequin, F.; Skaltsounis, A.-L. Quercetin and Kaempferol 3-O-[alpha-l-Rhamnopyranosyl-(1 → 2)-alpha-l-arabinopyranoside]-7-O-alpha-l-rhamnopyranosides from Anthyllis hermanniae: Structure Determination and Conformational Studies. J. Nat. Prod. 2011, 74, 1939–1945. [Google Scholar] [CrossRef]
  32. Calvano, C.D.; Cataldi, T.R.I.; Kögel, J.F.; Monopoli, A.; Palmisano, F.; Sundermeyer, J. Structural Characterization of Neutral Saccharides by Negative Ion MALDI Mass Spectrometry Using a Superbasic Proton Sponge as Deprotonating Matrix. J. Am. Soc. Mass Spectrom. 2017, 28, 1666–1675. [Google Scholar] [CrossRef]
  33. Okada, H.; Fukushi, E.; Yamamori, A.; Kawazoe, N.; Onodera, S.; Kawabata, J.; Shiomi, N. Novel fructopyranose oligosaccharides isolated from fermented beverage of plant extract. Carbohydr. Res. 2010, 345, 414–418. [Google Scholar] [CrossRef]
  34. Tayler, N.M.; Boya, C.A.; Herrera, L.; Moy, J.; Ng, M.; Pineda, L.; Almanza, A.; Rosero, S.; Coronado, L.M.; Correa, R.; et al. Analysis of the antiparasitic and anticancer activity of the coconut palm (Cocos nucifera L. ARECACEAE) from the natural reserve of Punta Patiño, Darién. PLoS ONE 2019, 14, e0214193. [Google Scholar] [CrossRef]
  35. Grzegorczyk-Karolak, I.; Kiss, A.K. Determination of the phenolic profile and antioxidant properties of Salvia viridis L. Shoots: A comparison of aqueous and hydroethanolic extracts. Molecules 2018, 23, 1468. [Google Scholar] [CrossRef] [Green Version]
  36. Horiuchi, K.; Shiota, S.; Kuroda, T.; Hatano, T.; Yoshida, T.; Tsuchiya, T. Potentiation of antimicrobial activity of aminoglycosides by carnosol from Salvia officinalis. Biol. Pharm. Bull. 2007, 30, 287–290. [Google Scholar] [CrossRef] [Green Version]
  37. Wang, Y.; Sun, X.; Kong, F.; Xia, L.; Deng, X.; Wang, D.; Wang, J. Specific NDM-1 Inhibitor of Isoliquiritin Enhances the Activity of Meropenem against NDM-1-positive Enterobacteriaceae in vitro. Int. J. Environ. Res. Public Health 2020, 17, 2162. [Google Scholar] [CrossRef] [PubMed] [Green Version]
  38. Cerca, N.; Martins, S.; Pier, G.B.; Oliveira, R.; Azeredo, J. The relationship between inhibition of bacterial adhesion to a solid surface by sub-MICs of antibiotics and subsequent development of a biofilm. Res. Microbiol. 2005, 156, 650–655. [Google Scholar] [CrossRef] [Green Version]
  39. Bavington, C.; Page, C. Stopping Bacterial Adhesion: A Novel Approach to Treating Infections. Respiration 2005, 72, 335–344. [Google Scholar] [CrossRef]
  40. Lieberman, D. Pseudomonal infections in patients with COPD: Epidemiology and management. Am. J. Respir. Med. Drugs Devices Interv. 2003, 2, 459–468. [Google Scholar] [CrossRef] [PubMed]
  41. Cowan, M.M. Plant Products as Antimicrobial Agents. Clin. Microbiol. Rev. 1999, 12, 564. [Google Scholar] [CrossRef] [Green Version]
  42. Mukherjee, P.K. Evidence-Based Validation of Herbal Medicine; Elsevier: Amsterdam, The Netherlands, 2015; p. 537. [Google Scholar] [CrossRef]
  43. Man, M.; Qiang, Y.; Bin, E.; Peter, M. Benefits of Hesperidin for Cutaneous Functions. Evid.-Based Complement. Altern. Med. 2019, 2019, 2676307. [Google Scholar] [CrossRef] [PubMed] [Green Version]
  44. Pendota, S.C.; Aderogba, M.A.; Van Staden, J. In vitro antimicrobial activity of extracts and an isolated compound from Boscia albitrunca leaves. S. Afr. J. Bot. 2015, 96, 91–93. [Google Scholar] [CrossRef] [Green Version]
  45. Zhou, J.; Bi, S.; Chen, H.; Chen, T.; Yang, R.; Li, M.; Fu, Y.; Jia, A.Q. Anti-Biofilm and Antivirulence Activities of Metabolites from Plectosphaerella cucumerina against Pseudomonas aeruginosa. Front. Microbiol. 2017, 8, 769. [Google Scholar] [CrossRef] [Green Version]
  46. Yan, X.; Gu, S.; Shi, Y.; Cui, X.; Wen, S.; Ge, J. The effect of emodin on Staphylococcus aureus strains in planktonic form and biofilm formation in vitro. Arch. Microbiol. 2017, 199, 1267–1275. [Google Scholar] [CrossRef]
  47. Kunti, A.K.; Sekhar, K.C.; Pereira, M.; Gomes, M.J.M.; Sharma, S.K. Oxygen partial pressure induced effects on the microstructure and the luminescence properties of pulsed laser deposited TiO2 thin films. AIP Adv. 2017, 7, 015021. [Google Scholar] [CrossRef] [Green Version]
  48. Mukherjee, P.K.; Rai, S.; Bhattacharya, S.; Wahile, A.; Saha, B.P. Marker analysis of polyherbal formulation, Triphala—A well known Indian Traditional Medicine. Indian J. Tradit. Knowl. 2008, 7, 379–383. [Google Scholar]
  49. Waxman, D. P450 Gene Induction by Structurally Diverse Xenochemicals: Central Role of Nuclear Receptors CAR, PXR, and PPAR. Arch. Biochem. Biophys. 1999, 369, 11–23. [Google Scholar]
  50. McKinnon, R.; Burgess, W.; Hall, P.; Roberts-Thomson, S.; González, J.F.; McManus, M. Characterisation of CYP3A gene subfamily expression in human gastrointestinal tissues. Gut 1995, 36, 259–267. [Google Scholar] [CrossRef] [PubMed] [Green Version]
  51. Shimada, T.; Yamazaki, H.; Mimura, M.; Inui, Y.; Guengerich, F. Interindividual variations in human liver cytochrome P-450 enzymes involved in the oxidation of drugs, carcinogens and toxic chemicals: Studies with liver microsomes of 30 Japanese and 30 Caucasians. J. Pharmacol. Exp. Ther. 1994, 270, 414–423. [Google Scholar]
  52. Pelkonen, O.; Mäenpää, J.; Taavitsainen, P.; Rautio, A.; Raunio, H. Inhibition and induction of human cytochrome P450 (CYP) enzymes. Xenobiotica 1999, 28, 1203–1253. [Google Scholar] [CrossRef]
  53. Guengerich, F. Cytochrome P-450 3A4: Regulation and role in drug metabolism. Annu. Rev. Pharmacol. Toxicol. 1999, 39, 1–17. [Google Scholar] [CrossRef]
  54. Imaoka, S.; Yamada, T.; Hiroi, T.; Hayashi, K.; Sakaki, T.; Yabusaki, Y.; Funae, Y. Multiple forms of human P450 expressed in Saccharomyces cerevisiae. Systematic characterization and comparison with those of the rat. Biochem. Pharmacol. 1996, 51, 1041–1050. [Google Scholar] [CrossRef]
  55. Pelkonen, O.; Raunio, H. Metabolic Activation of Toxins: Tissue-Specific Expression and Metabolism in Target Organs. Environ. Health Perspect. 1997, 105 (Suppl. 4), 767–774. [Google Scholar] [PubMed]
  56. Danielson, P. The Cytochrome P450 Superfamily: Biochemistry, Evolution and Drug Metabolism in Humans. Curr. Drug Metab. 2003, 3, 561–597. [Google Scholar] [CrossRef]
Figure 1. UPLC-QTOF-MS/MS total ion chromatogram for PHELA® extract in negative ionization mode (a) and negative ionization mode (b).
Molecules 27 01219 g001aMolecules 27 01219 g001b
Figure 2. RP-HPLC chromatograms for standard emodin (a) and PHELA® extract (b).
Molecules 27 01219 g002
Figure 3. CYP3A4 (a) and CYP2D6 (b) inhibitory effect of PHELA® extract and standard inhibitors.
Molecules 27 01219 g003
Figure 4. Growth curve of S. aureus against PHELA® extract.
Molecules 27 01219 g004
Figure 5. S. aureus biofilm inhibition of PHELA® extract and ciprofloxacin.
Molecules 27 01219 g005
Figure 6. AFM image of S. aureus biofilm surface (untreated) formed on the polycarbonate membrane filter taken at the 1 × 1 μm scan area in the tapping mode. (a) Height topography 3D, (b) The structure and complete surface coverage of the biofilm, and (c) Height distribution pattern.
Molecules 27 01219 g006
Figure 7. AFM image of S. aureus biofilm surface (treated with standard antimicrobial agent) formed on the polycarbonate membrane filter taken at the 1 × 1 μm scan area in the tapping mode. (a) Height topography 3D and (b) The structure and complete surface coverage of the biofilm, and (c) Height distribution pattern.
Molecules 27 01219 g007
Figure 8. AFM image of S. aureus biofilm surface (treated with PHELA® extract) formed on the polycarbonate membrane filter taken at the 1 × 1 μm scan area in the tapping mode. (a) Height topography in three dimensions, (b) The structure and complete surface coverage of the biofilm, and (c) Height distribution pattern.
Molecules 27 01219 g008aMolecules 27 01219 g008b
Table 1. Possible compounds tentatively identified in PHELA® hydro-alcohol extracts using UPLC-ESI-QTOF-MS correspond to peaks as depicted in Figure 1 in both negative modes followed by positive ionization mode.
Rt (min)Compound NameChemical FormulaAcquired
[M-H] m/z Ratio
Theoretical [M-H] m/z RatioCalculated Accurate Mass (Da)Mass Error (ppm)References
0.66-0-α-D-glucopyranosyl-D-fructoseC12H22O11341.1089341.1084342.11621.5[32]
6.7Quercetin-3-O-alpha-l-rhamnopyranosyl(1-2)-beta-D-glucopyranoside-7-O-alpha-l-rhamnopyranosideC34H44O19755.2406755.2399756.24760.9[31,33]
6.8Hesperidin methyl chalconeC29H36O15623.1974623.1976624.2054−0.3[34]
7.9MartynosideC31H40O15651.2285651.2289652.2366−0.6[35]
13.4CarnosolC20H26O4331.1906331.1909330.1831−0.9[36]
Rt(min)Compound nameChemical formulaAcquired
[M+H]+ m/z
Theoretical [M+H]+ m/zCalculated accurate mass (Da)Mass error (ppm)References
10.18IsoliquiritinC21H22O9419.1349419.1342418.12631.7[37]
11.4EmodinC15H9O5269.0448269.0450268.0371−0.7[38]
Table 2. IC50 values (µg/mL) of PHELA® formulation and individual plant extracts against CYP3A4 and CYP2D6 isozyme by the PHELA® formulation and individual plant extracts.
Name of the PlantCYP3A4
(mg/mL) ± SEM
CYP2D6
(mg/mL) ± SEM
PHELA® formulation0.2317 ± 2.140.2817 ± 3.65
Positive controlKetoconazoleFluoxetine
0.0643 ± 1.120.0739 ± 1.69
Table 3. MIC and MBC values for PHELA® extract.
Gram-Positive BacteriaMIC (mg/mL)MBC (mg/mL)
S. aureus0.3125 ± 0.019<1.00
B. substilis0.356 ± 0.007>1.00
Gram-negative bacteria
P. auregenosa0.625 ± 0.017>1.25
E. coli0.512 ± 0.011>1.5
MIC: Minimum inhibitory concentration; MBC: Minimum bactericidal concentration.
Table 4. Statistical parameters for AFM analysis.
Statistical ParametersControlStandardPHELA® Extract
Root Mean Square (Sq)9.165 nm4.344 nm3.523 nm
Reduced peak height (Spk)36 nm14.12 nm17.51 nm
Reduced valley depth (Svk)28.56 nm14.75 nm10.42 nm
Roughness Average (Sa)7.30 nm3.52 nm2.81 nm
Surface skewness (Ssk)0.190.140.4
Coefficient of kurtosis (Ska)0.070.190.27
Surface Area Ratio (Sdr) %5.981.751.90
Maximum height (Sz)64.56 nm28.87 nm27.93 nm
Publisher’s Note: MDPI stays neutral with regard to jurisdictional claims in published maps and institutional affiliations.

