
Preparation, Characterization, and Evaluation of Liposomes Containing Oridonin from Rabdosia rubescens

Abstract
:1. Introduction
2. Materials and Methods
2.1. Materials and Reagents
2.2. Extraction and Purification of Ori from R. rubescens
2.2.1. Ultrasound-Assisted Extraction
2.2.2. Experimental Design
2.2.3. Purification and Identification of Ori by PHPLC
2.3. Preparation and Characterization of Ori Liposomes
2.3.1. Preparation of Ori Liposomes
2.3.2. Optimization of Ori Liposomes Preparation
2.3.3. Characterization of Ori Liposomes
2.4. Cytotoxity Test
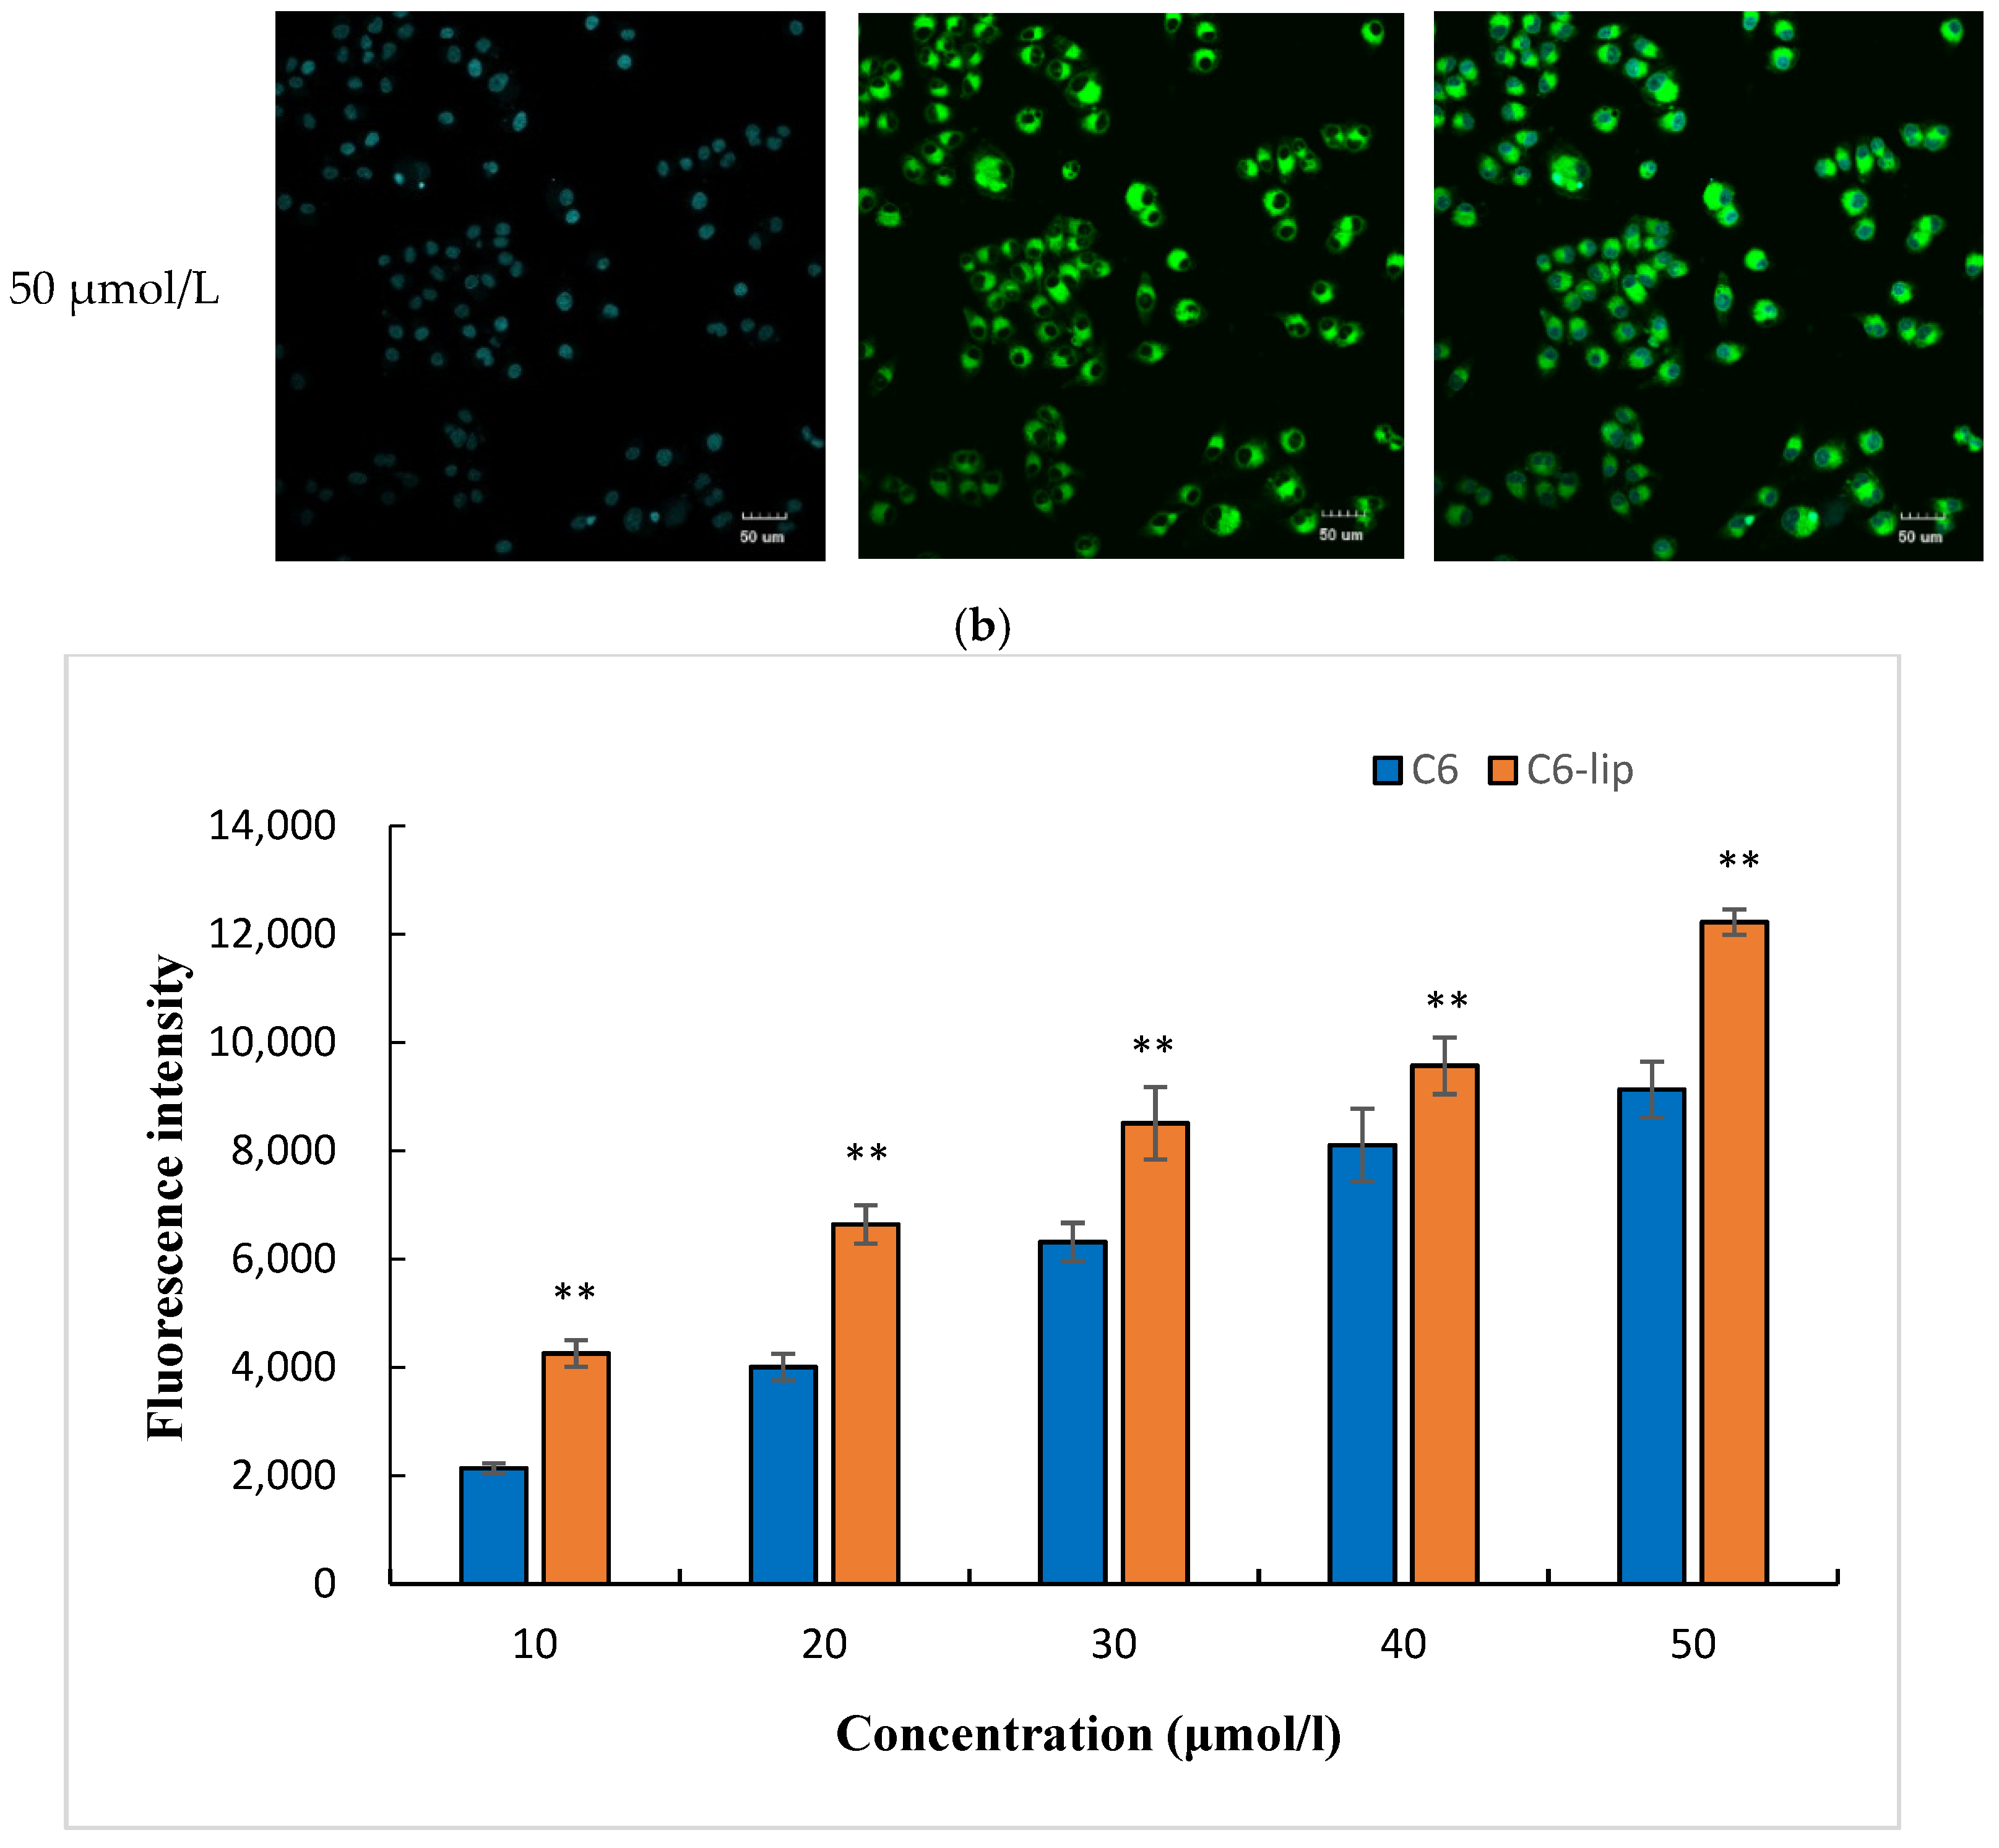
2.5. Cellular Uptake Study
2.6. Statistical Analysis
3. Results and Discussion
3.1. Extraction and Purification of Ori from R. rubescens
3.1.1. Single Factor Experimental Analysis
3.1.2. Optimization of UAE by RSM
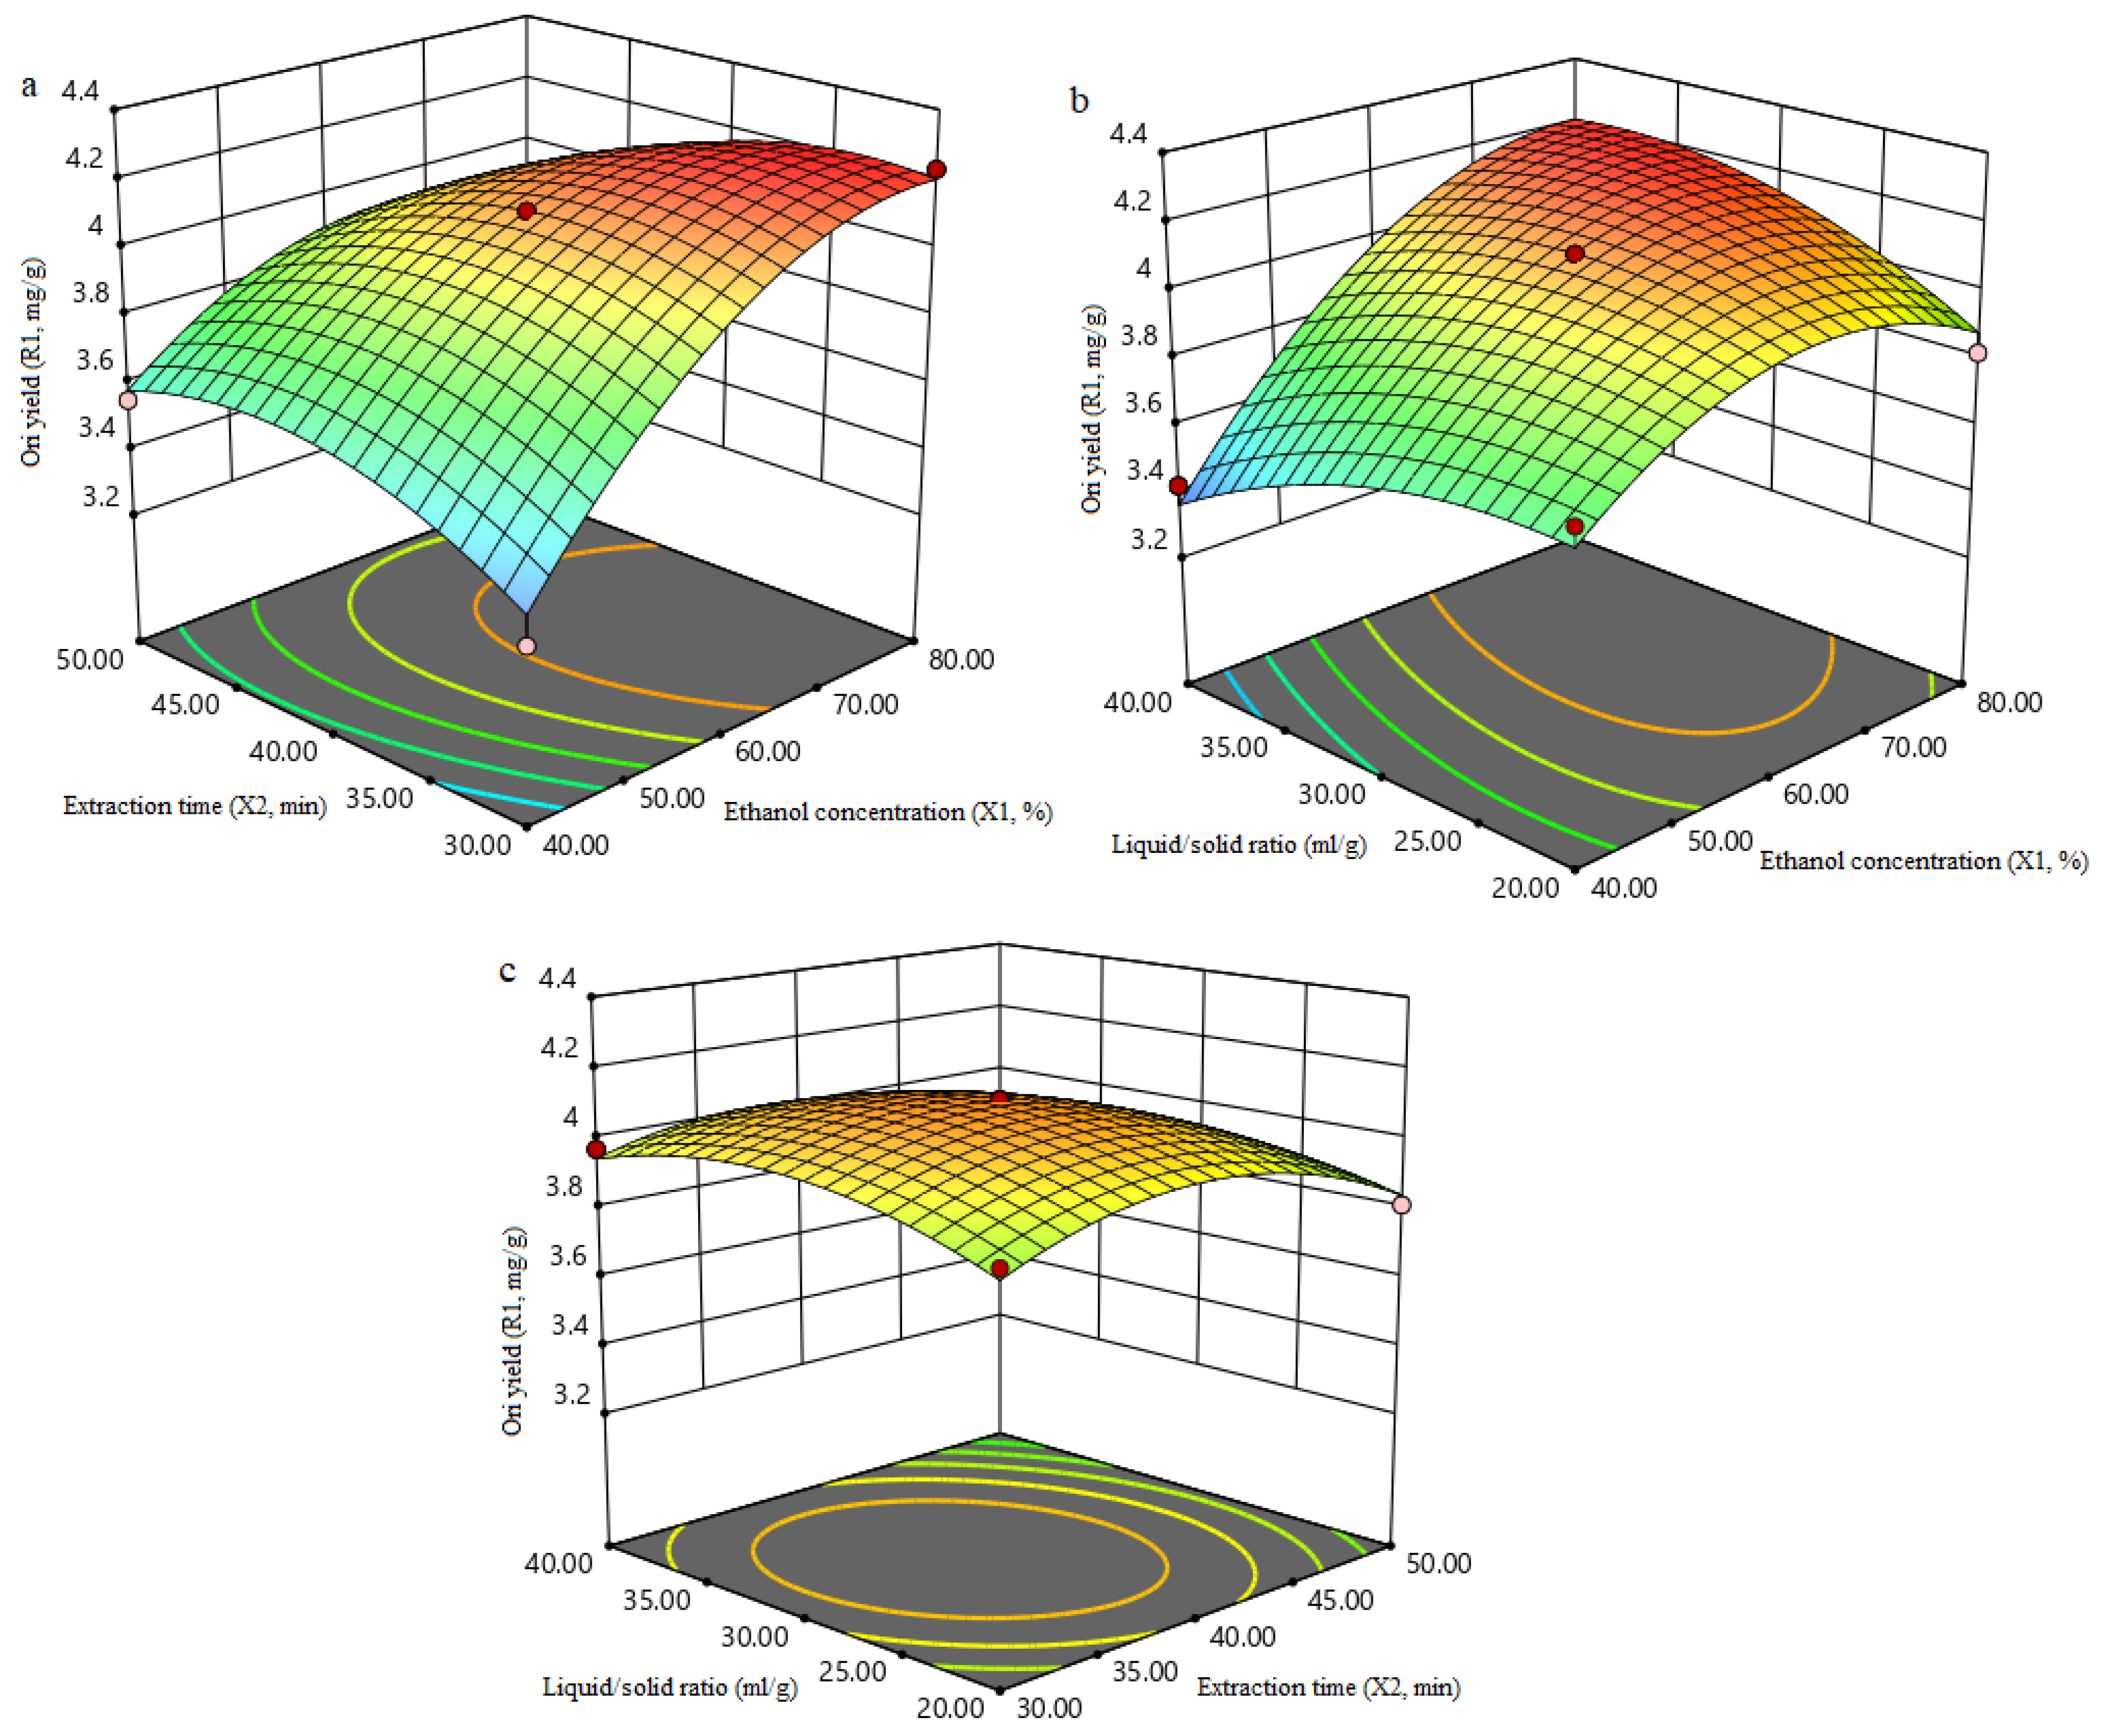
3.1.3. Analysis of Response Surfaces
3.1.4. Verification of Predictive Model
3.1.5. Purity and Identification of Ori
3.2. Optimization of Liposomes Preparation by RSM
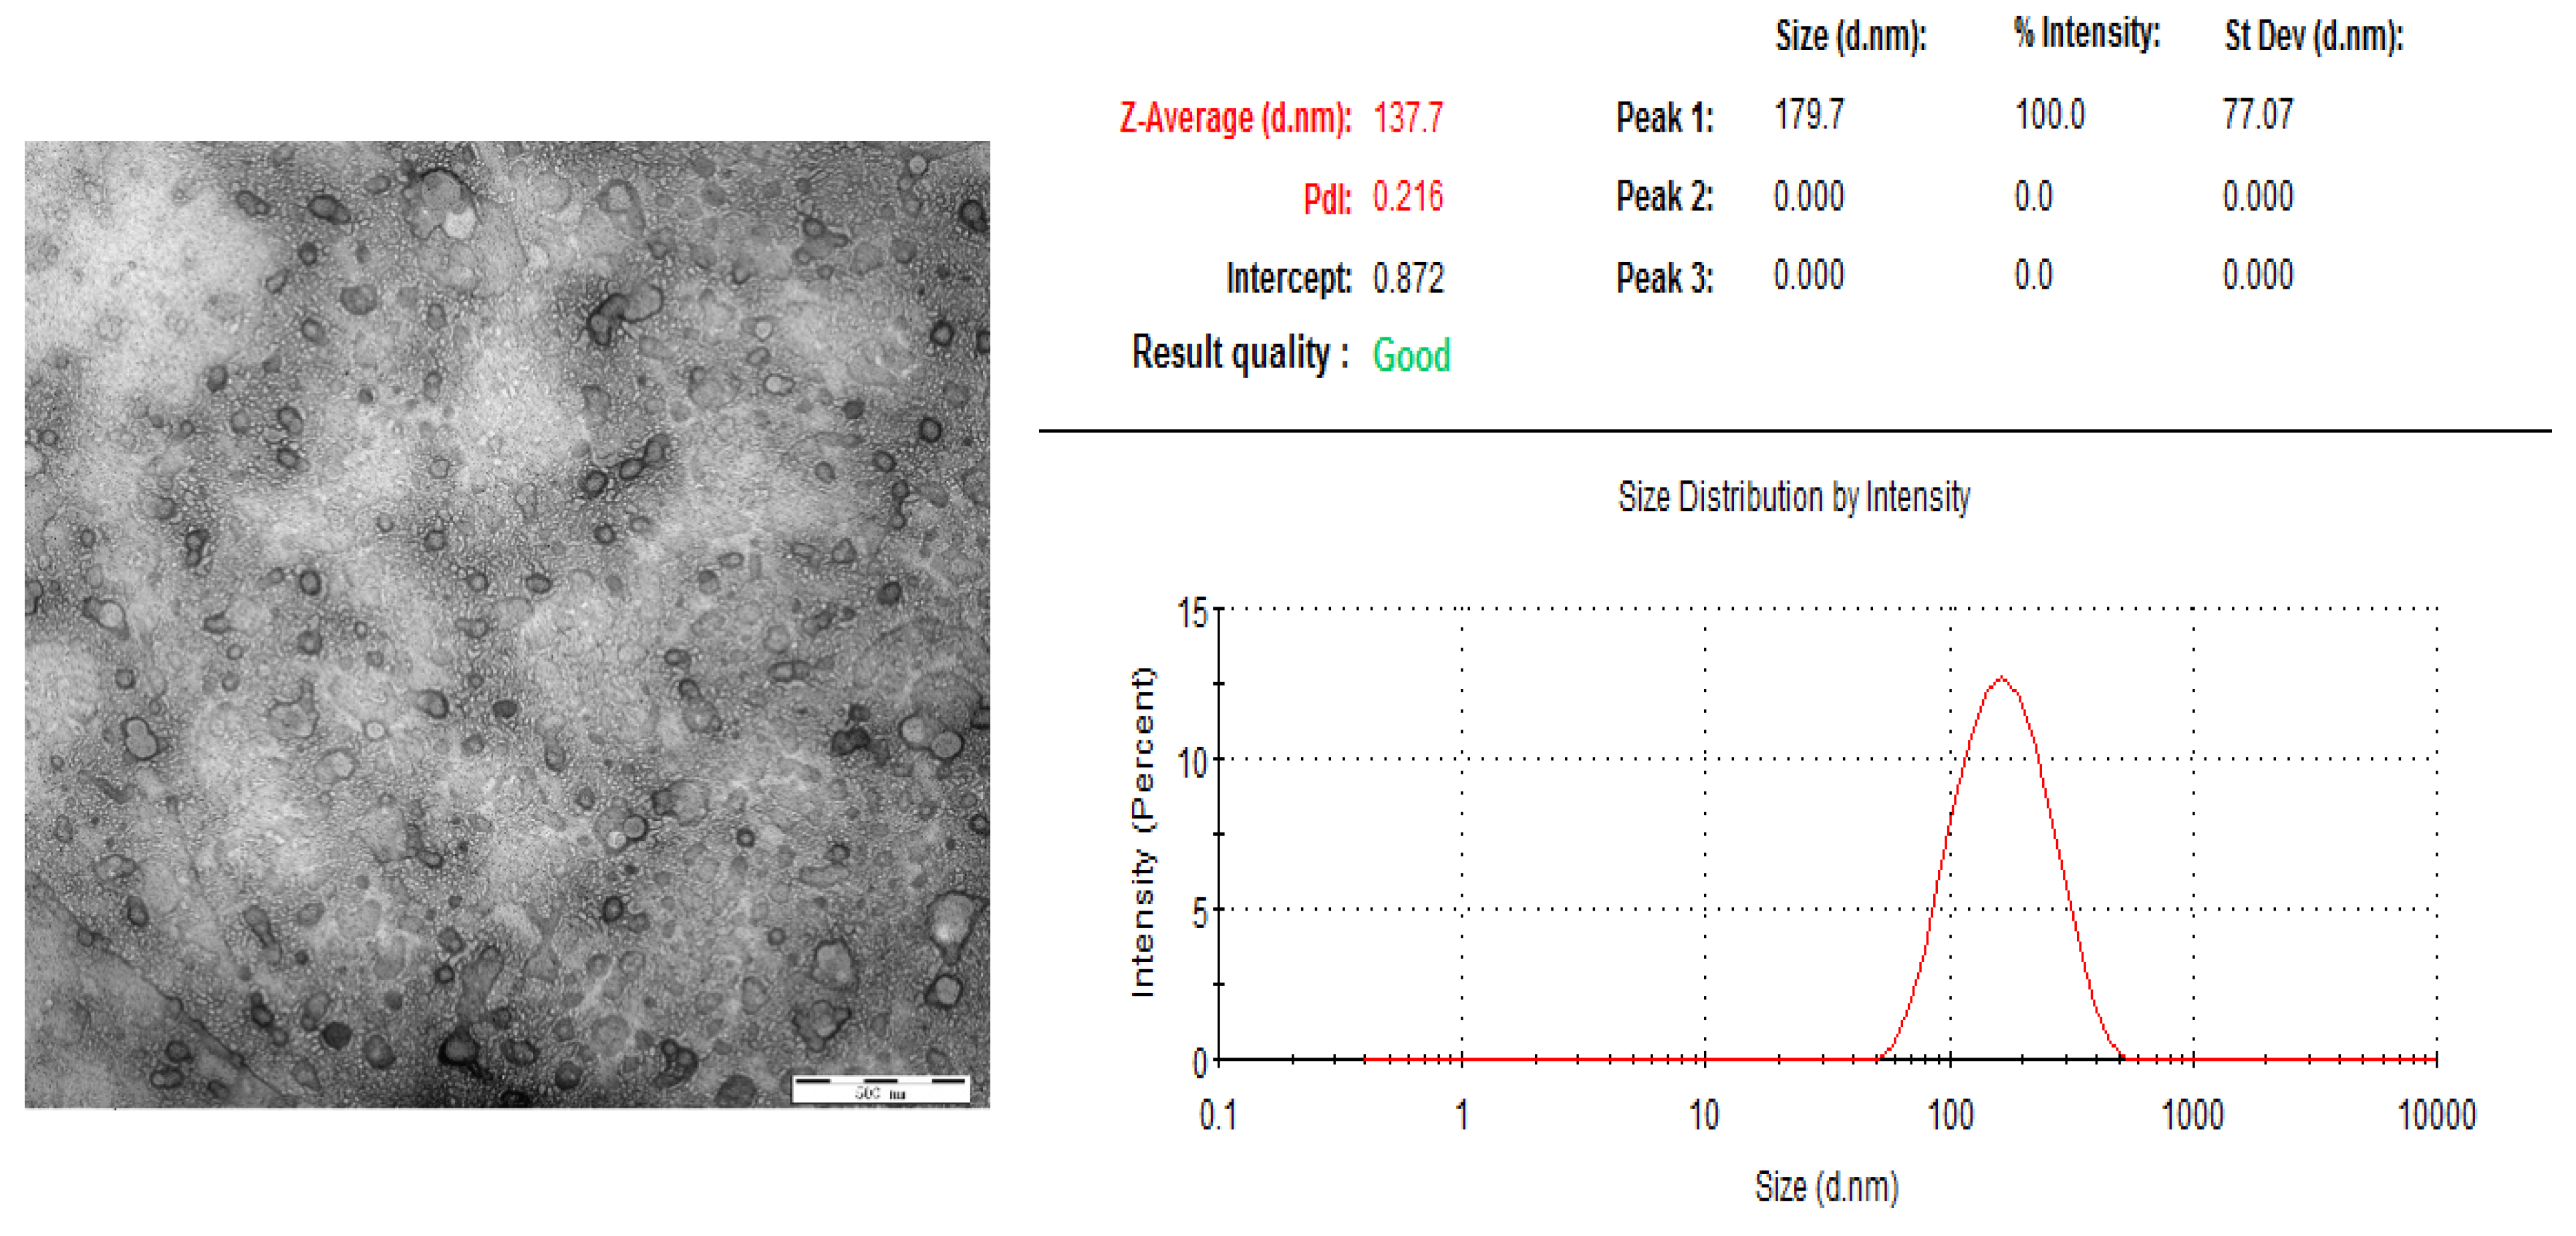
3.3. Characterization of Ori Liposomes
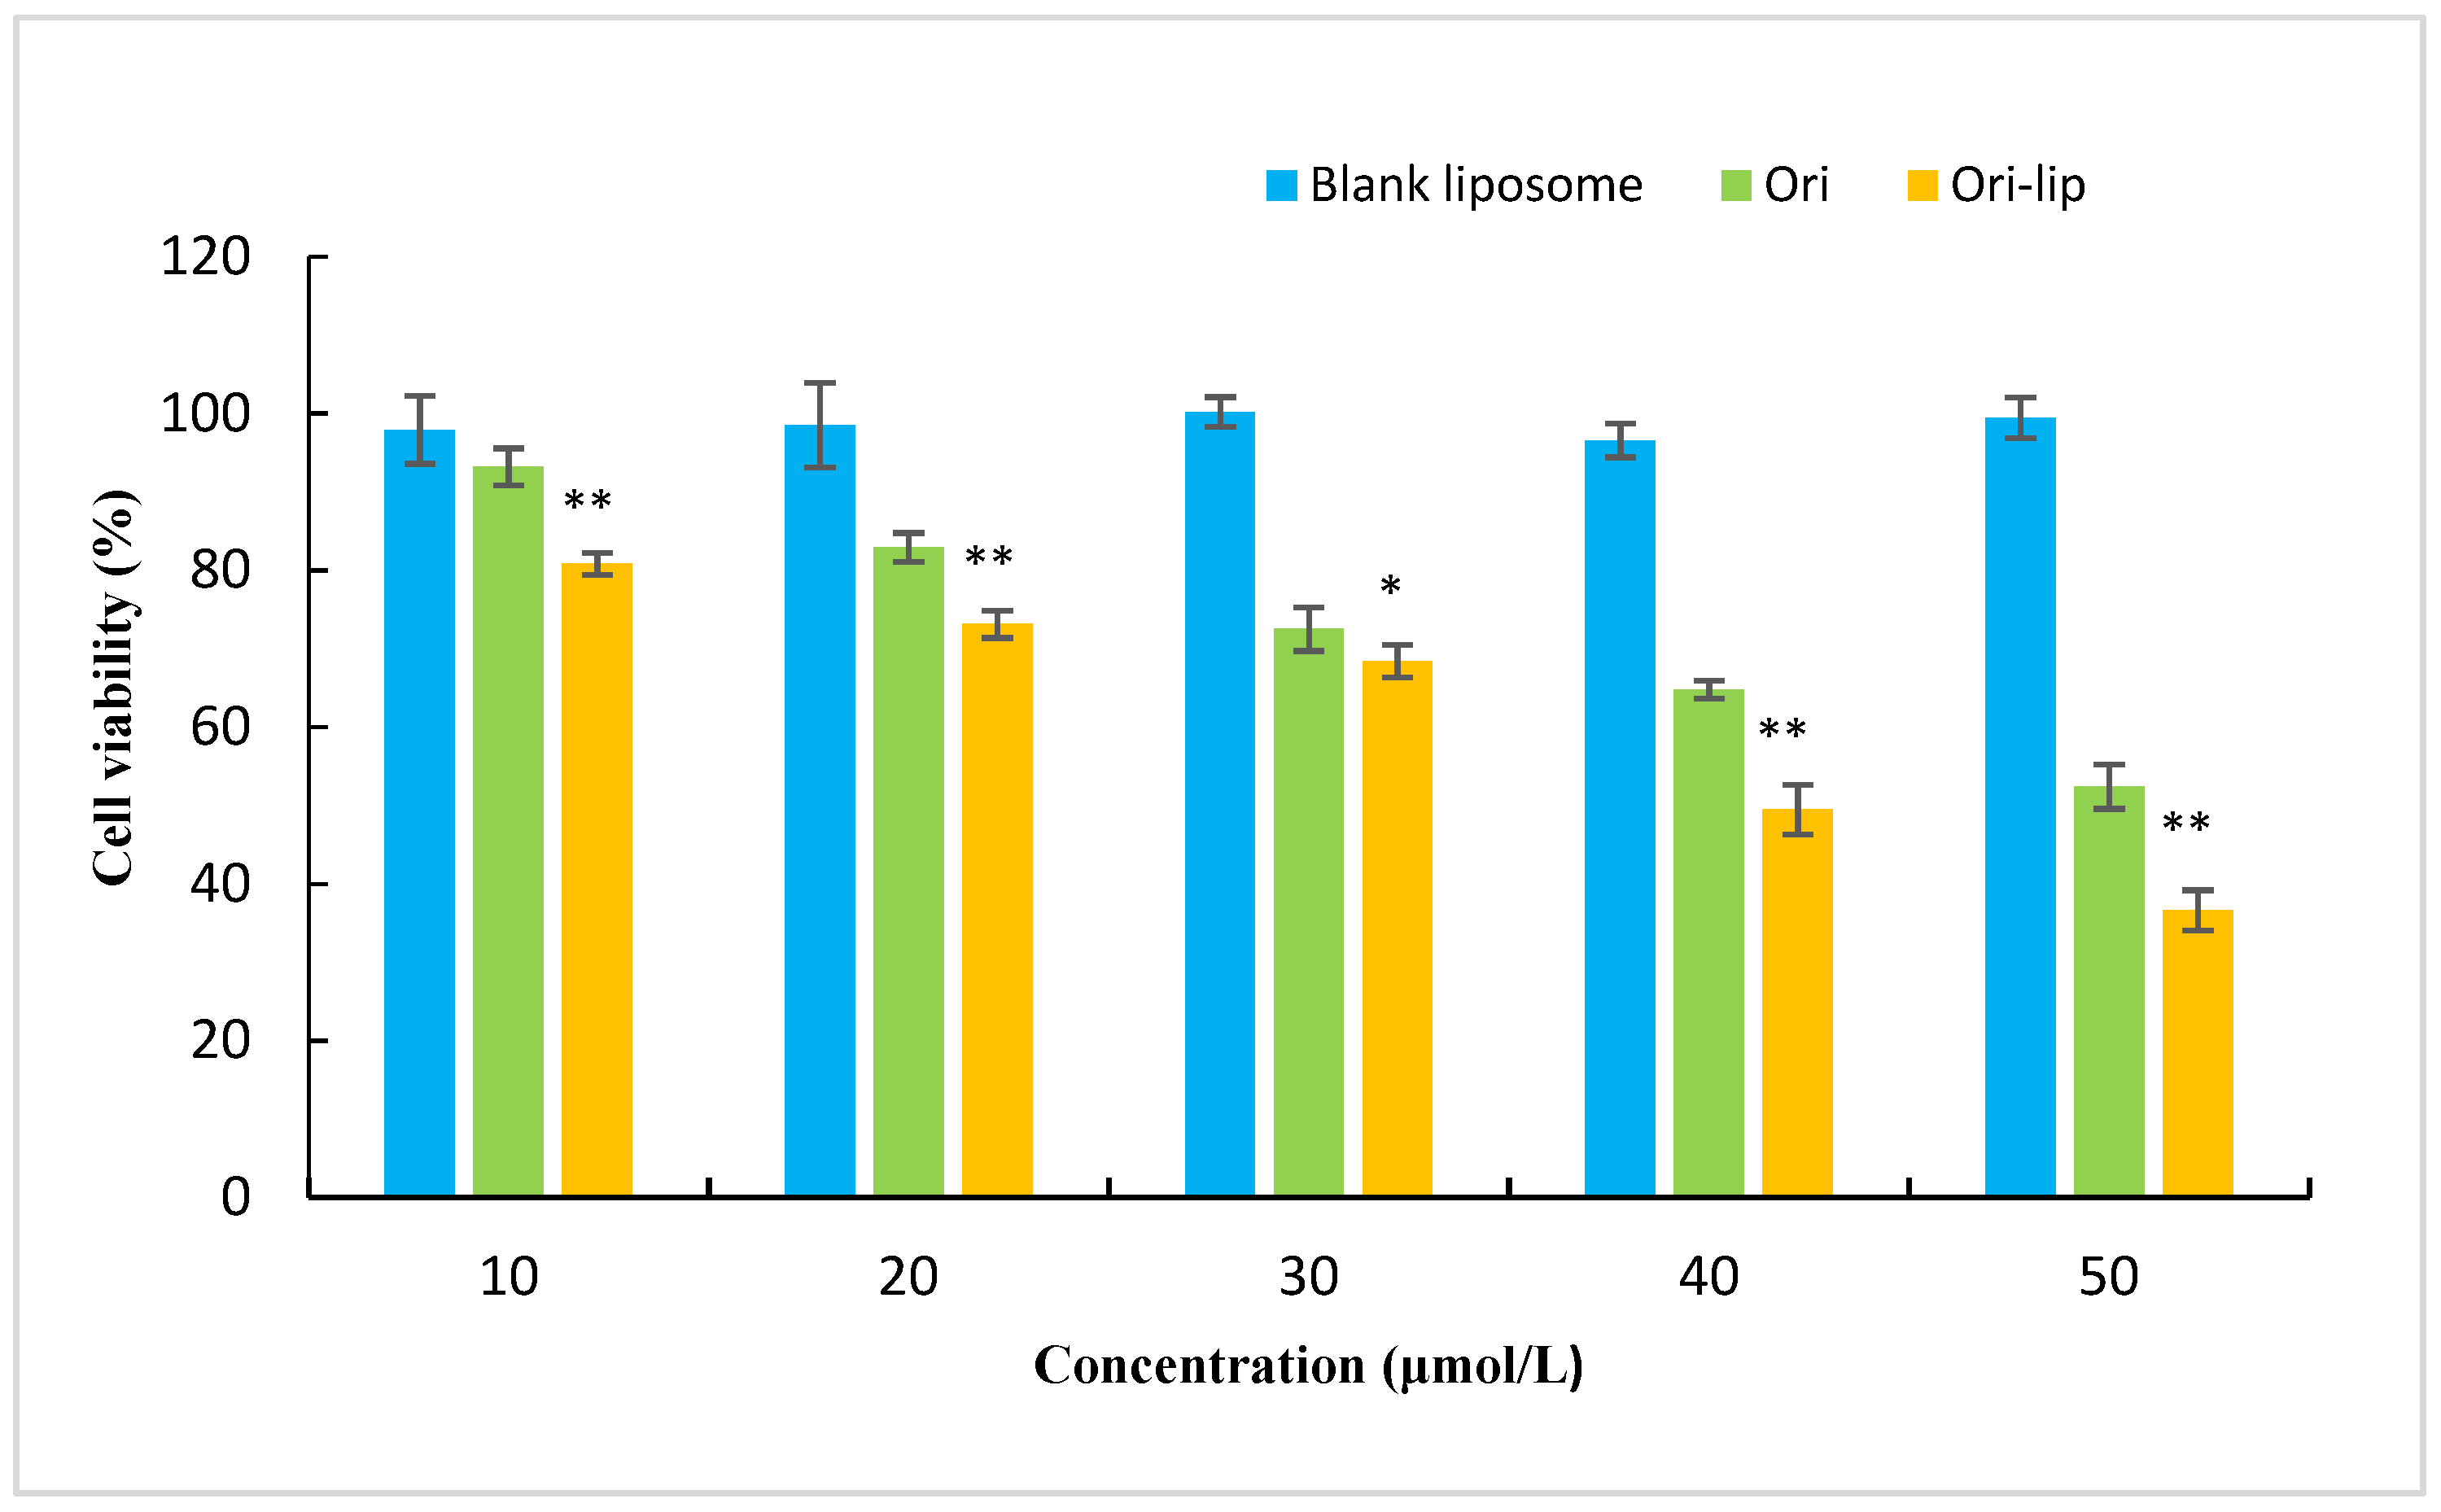
3.4. Cytotoxity Test
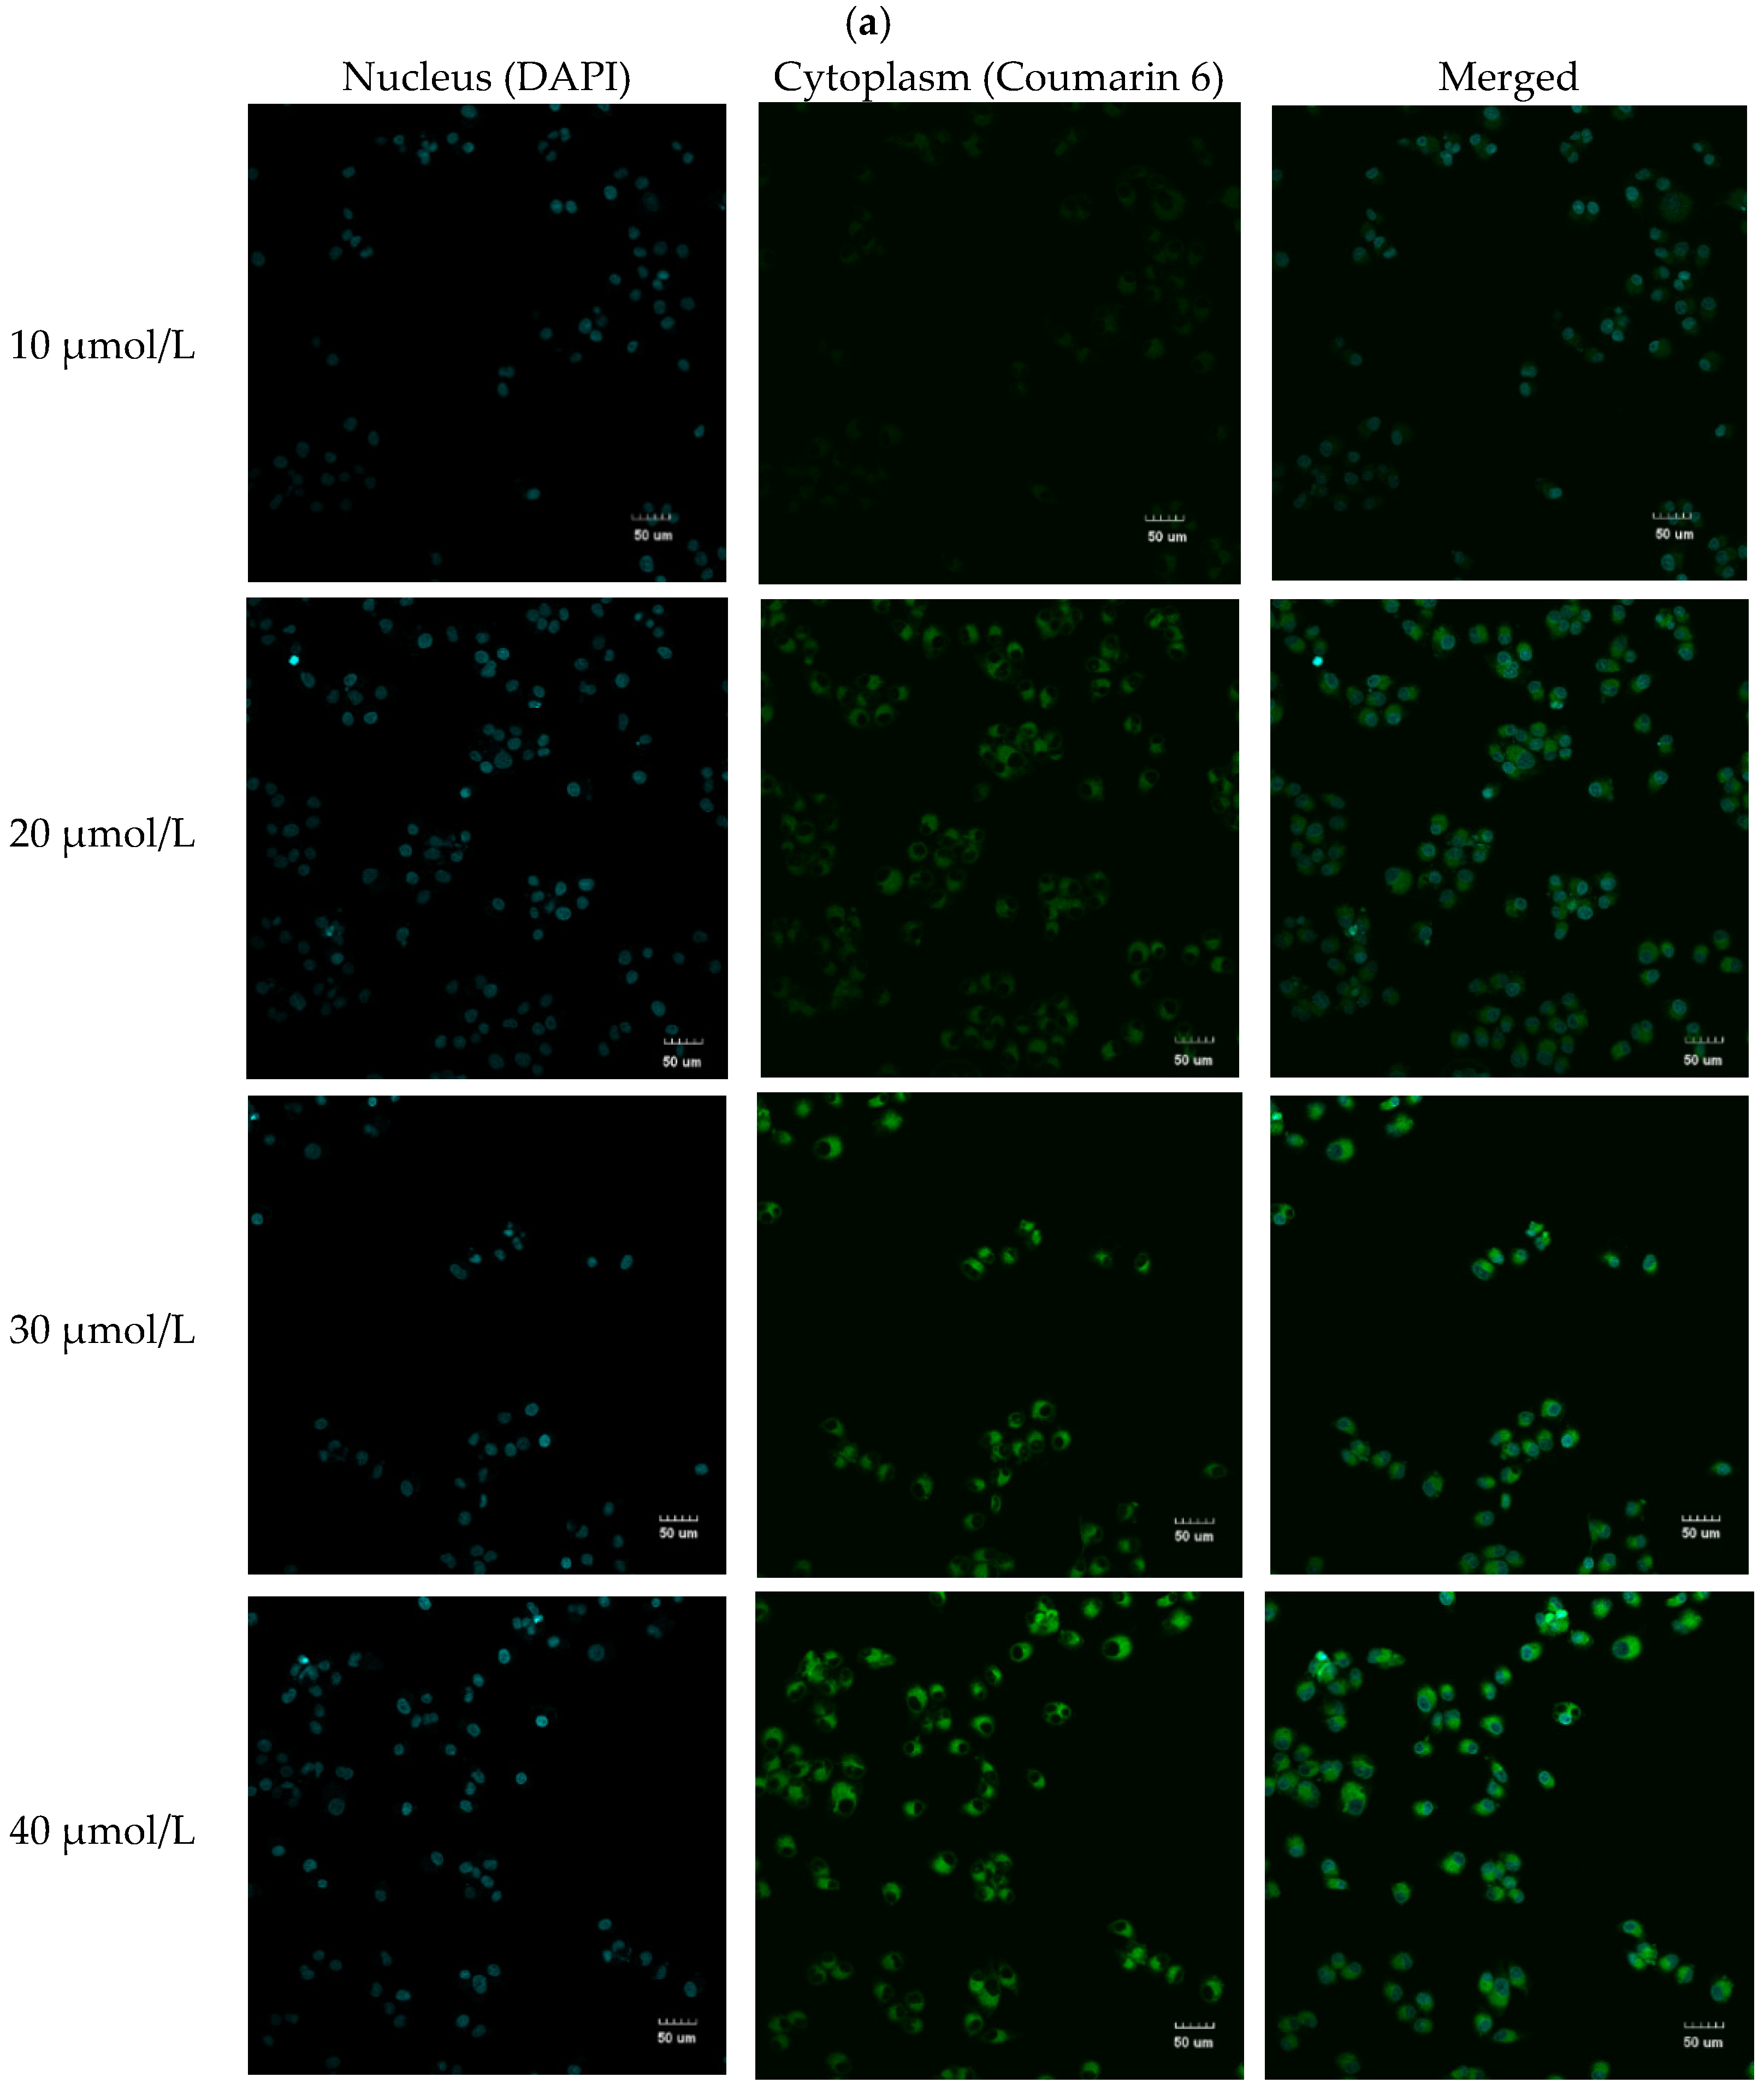
3.5. Cell Uptake Assay
4. Conclusions
Supplementary Materials
Author Contributions
Funding
Institutional Review Board Statement
Informed Consent Statement
Data Availability Statement
Acknowledgments
Conflicts of Interest
References
- Zhou, G.B.; Kang, H.; Wang, L.; Gao, L.; Liu, P.; Xie, J.; Zhang, F.X.; Weng, X.Q.; Shen, Z.X.; Chen, J.; et al. Oridonin, a diterpenoid extracted from medicinal herbs, targets AML1-ETO fusion protein and shows potent antitumor activity with low adverse effects on t(8;21) leukemia in vitro and in vivo. Blood 2007, 109, 3441–3450. [Google Scholar] [CrossRef] [PubMed]
- Li, D.; Han, T.; Liao, J.; Hu, X.; Xu, S.; Tian, K.; Gu, X.; Cheng, K.; Li, Z.; Hua, H.; et al. Oridonin, a Promising ent-Kaurane Diterpenoid Lead Compound. Int. J. Mol. Sci. 2016, 17, 1395. [Google Scholar] [CrossRef] [PubMed]
- Wang, Y.; Zhu, Z. Oridonin inhibits metastasis of human ovarian cancer cells by suppressing the mTOR pathway. Arch. Med. Sci. 2019, 15, 1017–1027. [Google Scholar] [CrossRef] [PubMed]
- Bu, H.Q.; Shen, F.; Cui, J. The inhibitory effect of oridonin on colon cancer was mediated by deactivation of TGF-beta1/Smads-PAI-1 signaling pathway in vitro and vivo. OncoTargets Ther. 2019, 12, 7467–7476. [Google Scholar] [CrossRef] [Green Version]
- Jiang, J.H.; Pi, J.; Jin, H.; Cai, J.Y. Oridonin-induced mitochondria-dependent apoptosis in esophageal cancer cells by inhibiting PI3K/AKT/mTOR and Ras/Raf pathways. J. Cell. Biochem. 2019, 120, 3736–3746. [Google Scholar] [CrossRef]
- Lou, S.; Xu, J.; Wang, B.; Li, S.; Ren, J.; Hu, Z.; Xu, B.; Luo, F. Downregulation of lncRNA AFAP1-AS1 by oridonin inhibits the epithelial-to-mesenchymal transition and proliferation of pancreatic cancer cells. Acta Biochim. Biophys. Sin. 2019, 51, 814–825. [Google Scholar] [CrossRef]
- He, H.; Jiang, H.; Chen, Y.; Ye, J.; Wang, A.; Wang, C.; Liu, Q.; Liang, G.; Deng, X.; Jiang, W.; et al. Oridonin is a covalent NLRP3 inhibitor with strong anti-inflammasome activity. Nat. Commun. 2018, 9, 2550. [Google Scholar] [CrossRef] [Green Version]
- Yuan, Z.; Ouyang, P.; Gu, K.; Rehman, T.; Zhang, T.; Yin, Z.; Fu, H.; Lin, J.; He, C.; Shu, G.; et al. The antibacterial mechanism of oridonin against methicillin-resistant Staphylococcus aureus (MRSA). Pharm. Biol. 2019, 57, 710–716. [Google Scholar] [CrossRef] [Green Version]
- Xu, L.; Bi, Y.; Xu, Y.; Zhang, Z.; Xu, W.; Zhang, S.; Chen, J. Oridonin inhibits the migration and epithelial-to-mesenchymal transition of small cell lung cancer cells by suppressing FAK-ERK1/2 signalling pathway. J. Cell. Mol. Med. 2020, 24, 4480–4493. [Google Scholar] [CrossRef]
- Yang, J.; Ren, X.; Zhang, L.; Li, Y.; Cheng, B.; Xia, J. Oridonin inhibits oral cancer growth and PI3K/Akt signaling pathway. Biomed. Pharmacother. 2018, 100, 226–232. [Google Scholar] [CrossRef]
- Wu, J.; Ding, Y.; Chen, C.H.; Zhou, Z.; Ding, C.; Chen, H.; Zhou, J.; Chen, C. A new oridonin analog suppresses triple-negative breast cancer cells and tumor growth via the induction of death receptor 5. Cancer Lett. 2016, 380, 393–402. [Google Scholar] [CrossRef] [PubMed]
- Xia, S.; Zhang, X.; Li, C.; Guan, H. Oridonin inhibits breast cancer growth and metastasis through blocking the Notch signaling. Saudi Pharm. J. 2017, 25, 638–643. [Google Scholar] [CrossRef] [PubMed]
- Lu, J.; Chen, X.; Qu, S.; Yao, B.; Xu, Y.; Wu, J.; Jin, Y.; Ma, C. Oridonin induces G2/M cell cycle arrest and apoptosis via the PI3K/Akt signaling pathway in hormone-independent prostate cancer cells. Oncol. Lett. 2017, 13, 2838–2846. [Google Scholar] [CrossRef] [PubMed] [Green Version]
- Luo, D.; Yi, Y.; Peng, K.; Liu, T.; Yang, J.; Liu, S.; Zhao, W.; Qu, X.; Yu, W.; Gu, Y.; et al. Oridonin derivatives as potential anticancer drug candidates triggering apoptosis through mitochondrial pathway in the liver cancer cells. Eur. J. Med. Chem. 2019, 178, 365–379. [Google Scholar] [CrossRef] [PubMed]
- Gregoriadis, G.; Ryman, B.E. Liposomes as carriers of enzymes or drugs: A new approach to the treatment of storage diseases. Biochem. J. 1971, 124, 58. [Google Scholar] [CrossRef] [Green Version]
- Musumeci, T.; Bonaccorso, A.; De Gaetano, F.; Larsen, K.L.; Pignatello, R. A physico-chemical study on amphiphilic cyclodextrin/liposomes nanoassemblies with drug carrier potential. J. Liposome Res. 2020, 30, 407–416. [Google Scholar] [CrossRef]
- Parak, K. Rational drug loading of liposomes revisited. J. Control. Release 2017, 252, 125. [Google Scholar] [CrossRef]
- Abu Lila, A.S.; Ishida, T.; Kiwada, H. Targeting anticancer drugs to tumor vasculature using cationic liposomes. Pharm. Res. 2010, 27, 1171–1183. [Google Scholar] [CrossRef]
- Bezerra, C.F.; de Alencar Júnior, J.G.; de Lima Honorato, R.; Dos Santos AT, L.; Pereira da Silva, J.C.; Gusmão da Silva, T.; Leal, A.; Rocha, J.E.; de Freitas, T.S.; Tavares Vieira, T.A.; et al. Antifungal activity of farnesol incorporated in liposomes and associated with fluconazole. Chem. Phys. Lipids 2020, 233, 104987. [Google Scholar] [CrossRef]
- Gonzalez Gomez, A.; Hosseinidoust, Z. Liposomes for Antibiotic Encapsulation and Delivery. ACS Infect. Dis. 2020, 6, 896–908. [Google Scholar] [CrossRef]
- Kleijnen, J.P.C. Response surface methodology. In Handbook of Simulation Optimization; Fu, M.C., Ed.; Springer: New York, NY, USA, 2015; pp. 81–104. [Google Scholar]
- Umair, M.; Jabbar, S.; Nasiru, M.M.; Lu, Z.; Zhang, J.; Abid, M.; Murtaza, M.A.; Kieliszek, M.; Zhao, L. Ultrasound-Assisted Extraction of Carotenoids from Carrot Pomace and Their Optimization through Response Surface Methodology. Molecules 2021, 26, 6763. [Google Scholar] [CrossRef] [PubMed]
- Li, L.; Chen, Y.; Ma, Y.; Wang, Z.; Wang, T.; Xie, Y. Optimization of Taxol Extraction Process Using Response Surface Methodology and Investigation of Temporal and Spatial Distribution of Taxol in Taxus mairei. Molecules 2021, 26, 5485. [Google Scholar] [CrossRef] [PubMed]
- Mei, Y.; Xu, J.; Zhao, J.; Feng, N.; Liu, Y.; Wei, L. An HPLC method for determination of oridonin in rabbits using isopsoralen as an internal standard and its application to pharmacokinetic studies for oridonin-loaded nanoparticles. J. Chromatogr. B 2008, 869, 138–141. [Google Scholar] [CrossRef] [PubMed]
- Ren, G.; Liu, D.; Guo, W.; Wang, M.; Wu, C.; Guo, M.; Ai, X.; Wang, Y.; He, Z. Docetaxel prodrug liposomes for tumor therapy: Characterization, in vitro and in vivo evaluation. Drug Deliv. 2016, 23, 1272–1281. [Google Scholar] [CrossRef] [Green Version]
- Adla, S.K.; Tonduru, A.K.; Kronenberger, T.; Kudova, E.; Poso, A.; Huttunen, K.M. Neurosteroids: Structure-Uptake Relationships and Computational Modeling of Organic Anion Transporting Polypeptides (OATP)1A2. Molecules 2021, 26, 5662. [Google Scholar] [CrossRef]
- Yang, Q.Q.; Gan, R.Y.; Ge, Y.Y.; Zhang, D.; Corke, A.H. Ultrasonic Treatment Increases Extraction Rate of Common Bean (Phaseolus vulgaris L.). Antioxidants 2019, 8, 83. [Google Scholar] [CrossRef] [Green Version]
- Yu, M.; Wang, B.; Qi, Z.; Xin, G.; Li, W. Response surface method was used to optimize the ultrasonic assisted extraction of flavonoids from Crinum asiaticum. Saudi J. Biol. Sci. 2019, 26, 2079–2084. [Google Scholar] [CrossRef]
- Wang, Q.; Wang, Y.; Huang, M.; Hayat, K.; Kurtz, N.C.; Wu, X.; Ahmad, M.; Zheng, F. Ultrasound-assisted alkaline proteinase extraction enhances the yield of pecan protein and modifies its functional properties. Ultrason. Sonochem. 2021, 80, 105789. [Google Scholar] [CrossRef]
- Lounasvuori, M.M.; Kelly, D.; Foord, J.S. Carbon black as low-cost alternative for electrochemical sensing of phenolic compounds. Carbon 2018, 129, 252–257. [Google Scholar] [CrossRef]
- He, F.; Bai, Y.; Wang, J.; Wei, J.; Yu, C.; Li, S.; Yang, W.; Han, C. Isolation and purification of oridonin from the whole plant of Isodon rubescens by high-speed counter-current chromatography. Molecules 2011, 16, 7949–7957. [Google Scholar] [CrossRef] [Green Version]
- Danaei, M.; Dehghankhold, M.; Ataei, S.; Hasanzadeh Davarani, F.; Javanmard, R.; Dokhani, A.; Khorasani, S.; Mozafari, M.R. Impact of Particle Size and Polydispersity Index on the Clinical Applications of Lipidic Nanocarrier Systems. Pharmaceutics 2018, 10, 57. [Google Scholar] [CrossRef] [PubMed] [Green Version]
- Han, B.; Yang, Y.; Chen, J.; Tang, H.; Sun, Y.; Zhang, Z.; Wang, Z.; Li, Y.; Li, Y.; Luan, X.; et al. Preparation, Characterization, and Pharmacokinetic Study of a Novel Long-Acting Targeted Paclitaxel Liposome with Antitumor Activity. Int. J. Nanomed. 2020, 15, 553–571. [Google Scholar] [CrossRef] [PubMed] [Green Version]
- Ravar, F.; Saadat, E.; Gholami, M.; Dehghankelishadi, P.; Mahdavi, M.; Azami, S.; Dorkoosh, F.A. Hyaluronic acid-coated liposomes for targeted delivery of paclitaxel, in-vitro characterization and in-vivo evaluation. J. Control. Release 2016, 229, 10–22. [Google Scholar] [CrossRef] [PubMed]
- Pretor, S.; Bartels, J.; Lorenz, T.; Dahl, K.; Finke, J.H.; Peterat, G.; Krull, R.; Al-Halhouli, A.T.; Dietzel, A.; Büttgenbach, S.; et al. Cellular uptake of coumarin-6 under microfluidic conditions into HCE-T cells from nanoscale formulations. Mol. Pharm. 2015, 12, 34–45. [Google Scholar] [CrossRef]
- Kou, L.; Sun, J.; Zhai, Y.; He, Z. The endocytosis and intracellular fate of nanomedicines: Implication for rational design. Asian J. Pharm. Sci. 2013, 8, 1–10. [Google Scholar] [CrossRef] [Green Version]


| Independent Variables | Code | −1 | 0 | 1 |
|---|---|---|---|---|
| Ethanol concentration (%) | X1 | 40 | 60 | 80 |
| Extraction time (min) | X2 | 30 | 40 | 50 |
| Liquid/solid ratio (mL/g) | X3 | 20:1 | 30:1 | 40:1 |
| Independent Variables | Code | −1 | 0 | 1 |
|---|---|---|---|---|
| Ultrasonic time (min) | X1 | 20 | 40 | 60 |
| Soybean phospholipids/drug ratio (g/g) | X2 | 6:1 | 8:1 | 10:1 |
| Temperature of water bath (°C) | X3 | 40 | 50 | 60 |
| Ethanol Concentration | Extraction Time (min) | Liquid/Solid Ratio (mL/g) | Ori Yield (mg/g) | ||
|---|---|---|---|---|---|
| Experimental | Predicted | ||||
| 1 | 0 | −1 | 1 | 3.96 | 3.94 |
| 2 | 0 | 0 | 0 | 4.11 | 4.11 |
| 3 | −1 | 1 | 0 | 3.56 | 3.58 |
| 4 | 0 | 0 | 0 | 4.11 | 4.11 |
| 5 | −1 | 0 | 1 | 3.42 | 3.36 |
| 6 | −1 | −1 | 0 | 3.31 | 3.4 |
| 7 | 1 | 1 | 0 | 3.89 | 3.8 |
| 8 | 0 | 1 | −1 | 3.81 | 3.83 |
| 9 | 0 | 1 | 1 | 3.73 | 3.76 |
| 10 | 0 | −1 | −1 | 3.90 | 3.87 |
| 11 | 0 | 0 | 0 | 4.11 | 4.11 |
| 12 | 1 | −1 | 0 | 4.23 | 4.21 |
| 13 | 0 | 0 | 0 | 4.11 | 4.11 |
| 14 | 1 | 0 | 1 | 4.15 | 4.21 |
| 15 | −1 | 0 | −1 | 3.75 | 3.7 |
| 16 | 1 | 0 | −1 | 3.82 | 3.88 |
| 17 | 0 | 0 | 0 | 4.11 | 4.11 |
| Ultrasonic Time | Soybean Phospholipids/Drug | Temperature of Water Bath | EE (%) | ||
|---|---|---|---|---|---|
| Experimental | Predicted | ||||
| 1 | 0 | 0 | 0 | 83.89 | 82.66 |
| 2 | −1 | 0 | −1 | 63.14 | 62.67 |
| 3 | 0 | 1 | −1 | 70.13 | 72.15 |
| 4 | 1 | 0 | 1 | 73.62 | 74.09 |
| 5 | 0 | 0 | 0 | 81.92 | 82.66 |
| 6 | 1 | 1 | 0 | 79.52 | 77.53 |
| 7 | −1 | −1 | 0 | 60.95 | 62.94 |
| 8 | −1 | 0 | 1 | 66.63 | 66.66 |
| 9 | 1 | 0 | −1 | 69.91 | 69.88 |
| 10 | 0 | 0 | 0 | 83.67 | 82.66 |
| 11 | 0 | −1 | 1 | 71 | 68.98 |
| 12 | 0 | −1 | −1 | 70.56 | 69.03 |
| 13 | −1 | 1 | 0 | 77.34 | 75.78 |
| 14 | 0 | 0 | 0 | 80.61 | 82.66 |
| 15 | 0 | 0 | 0 | 83.23 | 82.66 |
| 16 | 1 | −1 | 0 | 74.28 | 75.84 |
| 17 | 0 | 1 | 1 | 78.87 | 80.4 |
| Effects | Source | Sum of Squares | Degree of Freedom (DF) | Mean Square | F Value | p-Value |
|---|---|---|---|---|---|---|
| model | 802.47 | 9 | 89.16 | 18.55 | 0.0004 a | |
| Linear | X1 | 107.09 | 1 | 107.09 | 22.28 | 0.0022 a |
| X2 | 105.63 | 105.63 | 21.97 | 0.0022 a | ||
| X3 | 33.54 | 33.54 | 6.98 | 0.0334 a | ||
| Interaction | X1X2 | 31.08 | 31.08 | 6.47 | 0.0385 a | |
| X1X3 | 0.0121 | 0.0121 | 0.0025 | 0.9614 b | ||
| X2X3 | 17.22 | 17.22 | 3.58 | 0.1003 b | ||
| Quadratic | X12 | 205.04 | 205.04 | 42.65 | 0.0003 a | |
| X22 | 29.86 | 29.86 | 6.21 | 0.0414 a | ||
| X32 | 228.13 | 1 | 228.13 | 47.46 | 0.0002 a | |
| Residual | 33.65 | 7 | 4.81 | |||
| Lack of fit | 26.04 | 3 | 8.68 | 4.56 | 0.0883 b | |
| Pure error | 7.61 | 4 | 1.90 | |||
| Cor. total | 836.12 | 16 |
Publisher’s Note: MDPI stays neutral with regard to jurisdictional claims in published maps and institutional affiliations. |
© 2022 by the authors. Licensee MDPI, Basel, Switzerland. This article is an open access article distributed under the terms and conditions of the Creative Commons Attribution (CC BY) license (https://creativecommons.org/licenses/by/4.0/).
Share and Cite
Wang, Y.; Wang, M.; Lin, F.; Zhang, X.; Zhao, Y.; Guo, C.; Wang, J. Preparation, Characterization, and Evaluation of Liposomes Containing Oridonin from Rabdosia rubescens. Molecules 2022, 27, 860. https://doi.org/10.3390/molecules27030860
Wang Y, Wang M, Lin F, Zhang X, Zhao Y, Guo C, Wang J. Preparation, Characterization, and Evaluation of Liposomes Containing Oridonin from Rabdosia rubescens. Molecules. 2022; 27(3):860. https://doi.org/10.3390/molecules27030860
Chicago/Turabian StyleWang, Yinyue, Mai Wang, Feier Lin, Xinyan Zhang, Yongming Zhao, Chunyan Guo, and Jin Wang. 2022. "Preparation, Characterization, and Evaluation of Liposomes Containing Oridonin from Rabdosia rubescens" Molecules 27, no. 3: 860. https://doi.org/10.3390/molecules27030860
APA StyleWang, Y., Wang, M., Lin, F., Zhang, X., Zhao, Y., Guo, C., & Wang, J. (2022). Preparation, Characterization, and Evaluation of Liposomes Containing Oridonin from Rabdosia rubescens. Molecules, 27(3), 860. https://doi.org/10.3390/molecules27030860