Communication

Understanding Parahydrogen Hyperpolarized Urine Spectra: The Case of Adenosine Derivatives

National Institute of Chemical Physics and Biophysics, Akadeemia tee 23, 12618 Tallinn, Estonia
*
Author to whom correspondence should be addressed.
These authors contributed equally to this work.
Molecules 2022, 27(3), 802; https://doi.org/10.3390/molecules27030802
Submission received: 31 December 2021 / Revised: 19 January 2022 / Accepted: 21 January 2022 / Published: 26 January 2022

Abstract

:
Parahydrogen hyperpolarization has emerged as a promising tool for sensitivity-enhanced NMR metabolomics. It allows resolution and quantification of NMR signals of certain classes of low-abundance metabolites that would otherwise be undetectable. Applications have been implemented in pharmacokinetics and doping drug detection, demonstrating the versatility of the technique. Yet, in order for the method to be adopted by the analytical community, certain limitations have to be understood and overcome. One such question is NMR signal assignment. At present, the only reliable way to establish the identity of an analyte that gives rise to certain parahydrogen hyperpolarized NMR signals is internal standard addition, which can be laborious. Herein we show that analogously to regular NMR metabolomics, generating libraries of hyperpolarized analyte signals is a viable way to address this limitation. We present hyperpolarized spectral data of adenosines and give an early example of identifying them from a urine sample with the small library. Doing so, we verify the detectability of a class of diagnostically valuable metabolites: adenosine and its derivatives, some of which are cancer biomarkers, and some are central to cellular energy management (e.g., ATP).

Graphical Abstract

1. Introduction

Nuclear Magnetic Resonance spectroscopy (NMR) is among the most successful analytical techniques for metabolomics research. NMR has found widespread application in the field due to its high reproducibility, quantitative nature, and the ability to provide relatively simple analyte identification by structural information embedded into NMR signals or comparison with spectral databases [1]. These strengths have allowed NMR metabolomics studies to be conducted in a vast array of research fields, ranging from food science to medical research and biomarker discovery. Yet, all applications are limited by the sensitivity of NMR, excluding the detection of a large and interesting part of the metabolome that appears below the NMR limit of detection (LOD) [2].
Nuclear hyperpolarization techniques have been developed to increase NMR sensitivity by generating non-Boltzmann nuclear polarization, thereby boosting sensitivity [3]. Out of several hyperpolarization techniques available, parahydrogen hyperpolarization has lately garnered attention in the analysis of biological fluids. In particular, the parahydrogen (pH2) hyperpolarized chemosensing technique [4] has been used for the study of various biological mixtures such as flavor compounds in coffee extracts [4] and whiskey [5]. A modification of the technique has been demonstrated to work in SPE extracts of human urine [6] and in (almost) whole urine [7], allowing for the detection of endogenous urinary metabolites below the LOD of regular NMR.

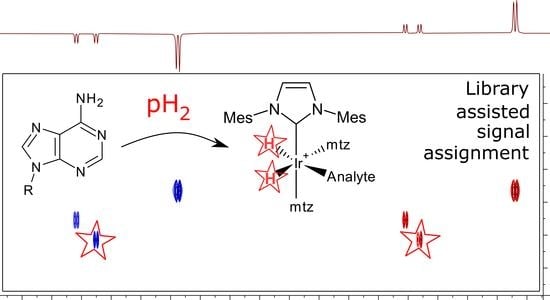
1.1. Parahydrogen Hyperpolarized Chemosensing

Instead of directly measuring NMR signals of analytes 1 (Figure 1), hyperpolarized chemosensing relies on the ability of 1 to reversibly bind to an iridium-based catalyst 2. Upon binding, complex 3 is formed that presents two pH2 sourced hydride signals’ doublets (Figure 1) at the −20…−30 ppm region. Chemical shifts of complex 3 hydride resonances are characteristic to each analyte 1 and function as their chemosensors [4]. Intensities of the hydride signals are up to 1000-fold enhanced [6] and the atypical detection region allows for the separation of hyperpolarized dilute analyte signals from the more abundant not-catalyst-interacting analytes. However, it also gives rise to three limitations: analyte scope, quantification, and signal assignment.
Analyte scope of the method is limited by its chemoselectivity, making it less universal than traditional NMR as it detects only analytes capable of binding to 2. Yet, chemoselectivity can also be viewed as a strength—the method enhances signals which would otherwise be undetectable and enables the resolution of their hydride resonances in the atypical −20…−30 ppm region instead of the crowded 0…10 ppm region [4]. Furthermore, the complexity of published hyperpolarized urine spectra [6,7,8,9] demonstrates that even the catalyst’s limited chemical scope allows for the detection of large numbers of metabolites. The list of known 2 binding analytes is growing and includes, on top of nitrogenous heteroaromatics, pyruvate [10], tagged oligopeptides [11,12], amino acids [13,14], nitriles [15], and sulfur heteroaromatics [16], suggesting the chemoselectivity envelope is wide.
The method is not quantitative in the same way as traditional 1H NMR, since multi-pulse NMR detection schemes and analyte-specific complex 3 dissociation kinetics [17], hydrogen exchange rate and relaxation [18] properties are involved. However, similarly to regular 2D NMR [19], quantification can be achieved by analyte-specific calibration curves [4,5,6,7,8,9,13]. When exact values are not necessary, concentrations can be estimated by comparison of signals representing chemically similar analytes [13].
Signal assignment is arguably the most notable limitation hindering wider adoption of the technique. Since hydride signals do not carry as much structural information as traditional NMR, the only reliable way of assigning signals has proven to be internal standard addition [4,7,9]. The most practical pulse sequence for hyperpolarized chemosensing [6], which can also be carried out as very fast experiments [20], resolves hydride signals (red in Figure 1) according to their mutual zero quantum (ZQ) frequency in the indirect dimension of 2D spectra. Signals of structurally similar analytes have been found to form linear patterns in the 2D ZQ plots ([6] and Figure 2). These patterns aid identification [6,9] but the physical explanation for their formation has not been described yet.
Notably, chemical shifts of hydride signals of different complexes 3 have proven to be largely identical in methanolic urine samples and in simple methanol solutions [7]. Consequently, it should be feasible to compile libraries of analyte signals, which could be applied for signal assignment in complex samples. Herein we present our work on compiling the first such library by establishing a group of valuable metabolites, rationalizing their interactions with a catalyst 2 and applying the small initial library to a biofluid derived sample. We suggest this work presents a practical workflow for understanding complex hyperpolarized spectra and for developing new applications.

1.2. Analytical Value of Adenosine Derivatives

Adenine, the nitrogenous base of adenosine, was among the first biological analytes detected by its iridium-bound derivative’s hydride signals [21], suggesting that the study of its different modifications should be feasible. Adenosine has been hyperpolarized by 2 in a SABRE experiment [22], and adenosine detection by hyperpolarized chemosensing has been demonstrated in urine SPE extracts [6] and minimally altered urine [7]. In terms of (bio)analytical utility, the concentrations of adenosine and its methylated derivatives in urine correlate to increased protein turnover in several pathological processes [23], including tumors [24]. The urine of cancer patients is expected to contain elevated concentrations of methylated adenosines [25], such as 1-methyladenosine 1b (Table 1). N6-methyladenosine 1c and 2′-O-methyladenosine 1d have been suggested as cancer biomarkers [26,27] that increase in correlation to tumor size [28]. Urinary concentration of these analytes is in the sub- to low-µM region [29], excluding their detection by regular NMR and rendering them attractive targets for methodology development.
Phosphorylated adenosines (AMP, ADP, and ATP), on the other hand, form the central pinnacle of cellular energy metabolism. While AMP and ADP are also present in urine in low concentrations [29], the more attractive analytical utility of all three may lie in bioenergetics research, uncovering the mechanisms of chemical energy production, and utilization in healthy and malignant cells [30]. 31P NMR has traditionally been used for the selective detection of such phosphometabolites in complex cellular extracts, but the lower sensitivity of 31P NMR, in combination with the low concentrations of such analytes, has required extensive acquisition times [31]. The detection and resolution of such analytes by hyperpolarized chemosensing would present a further practical application.

2. Results

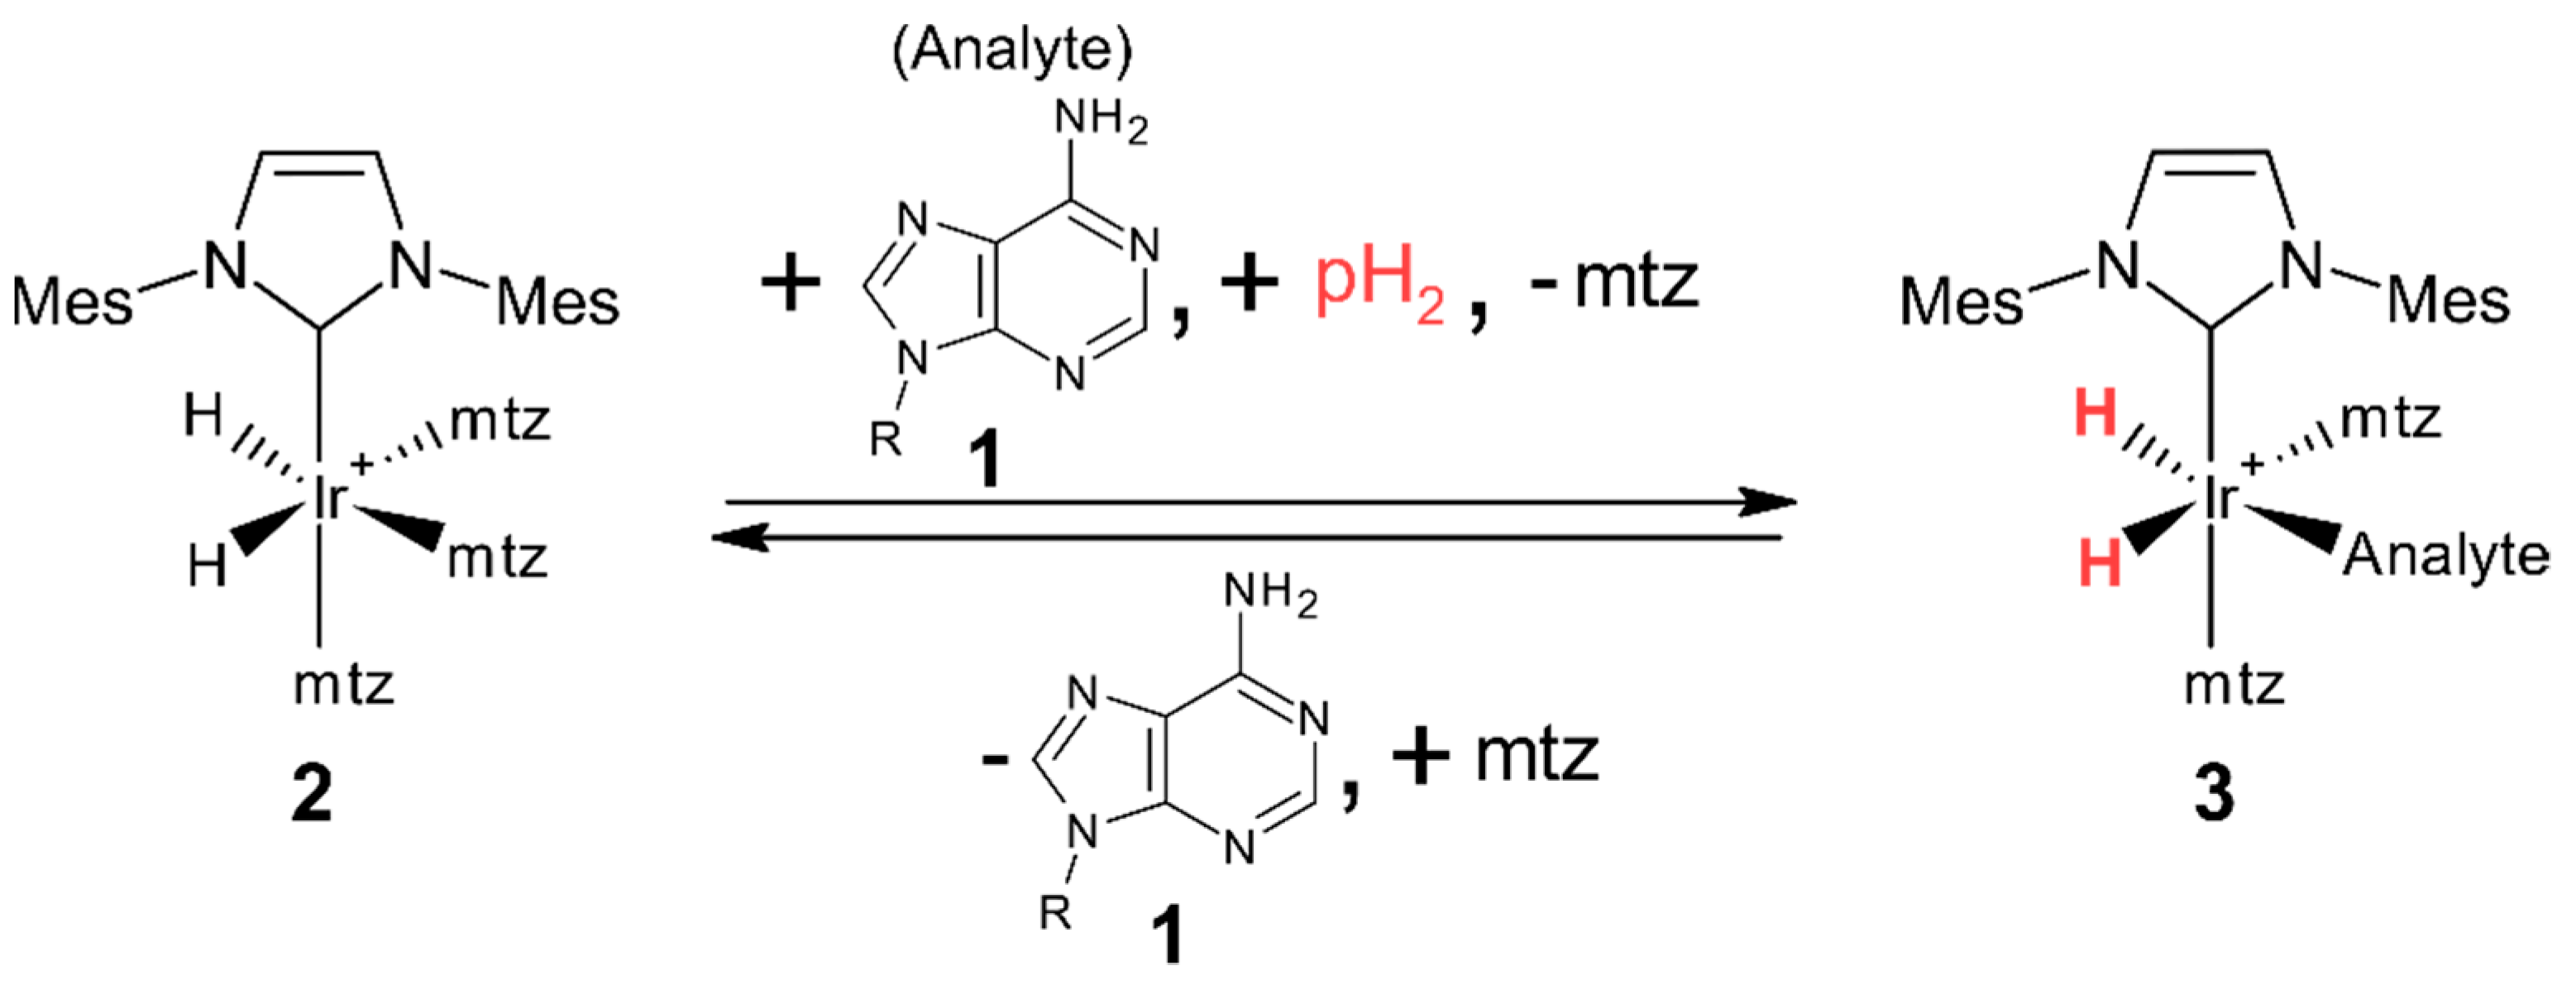
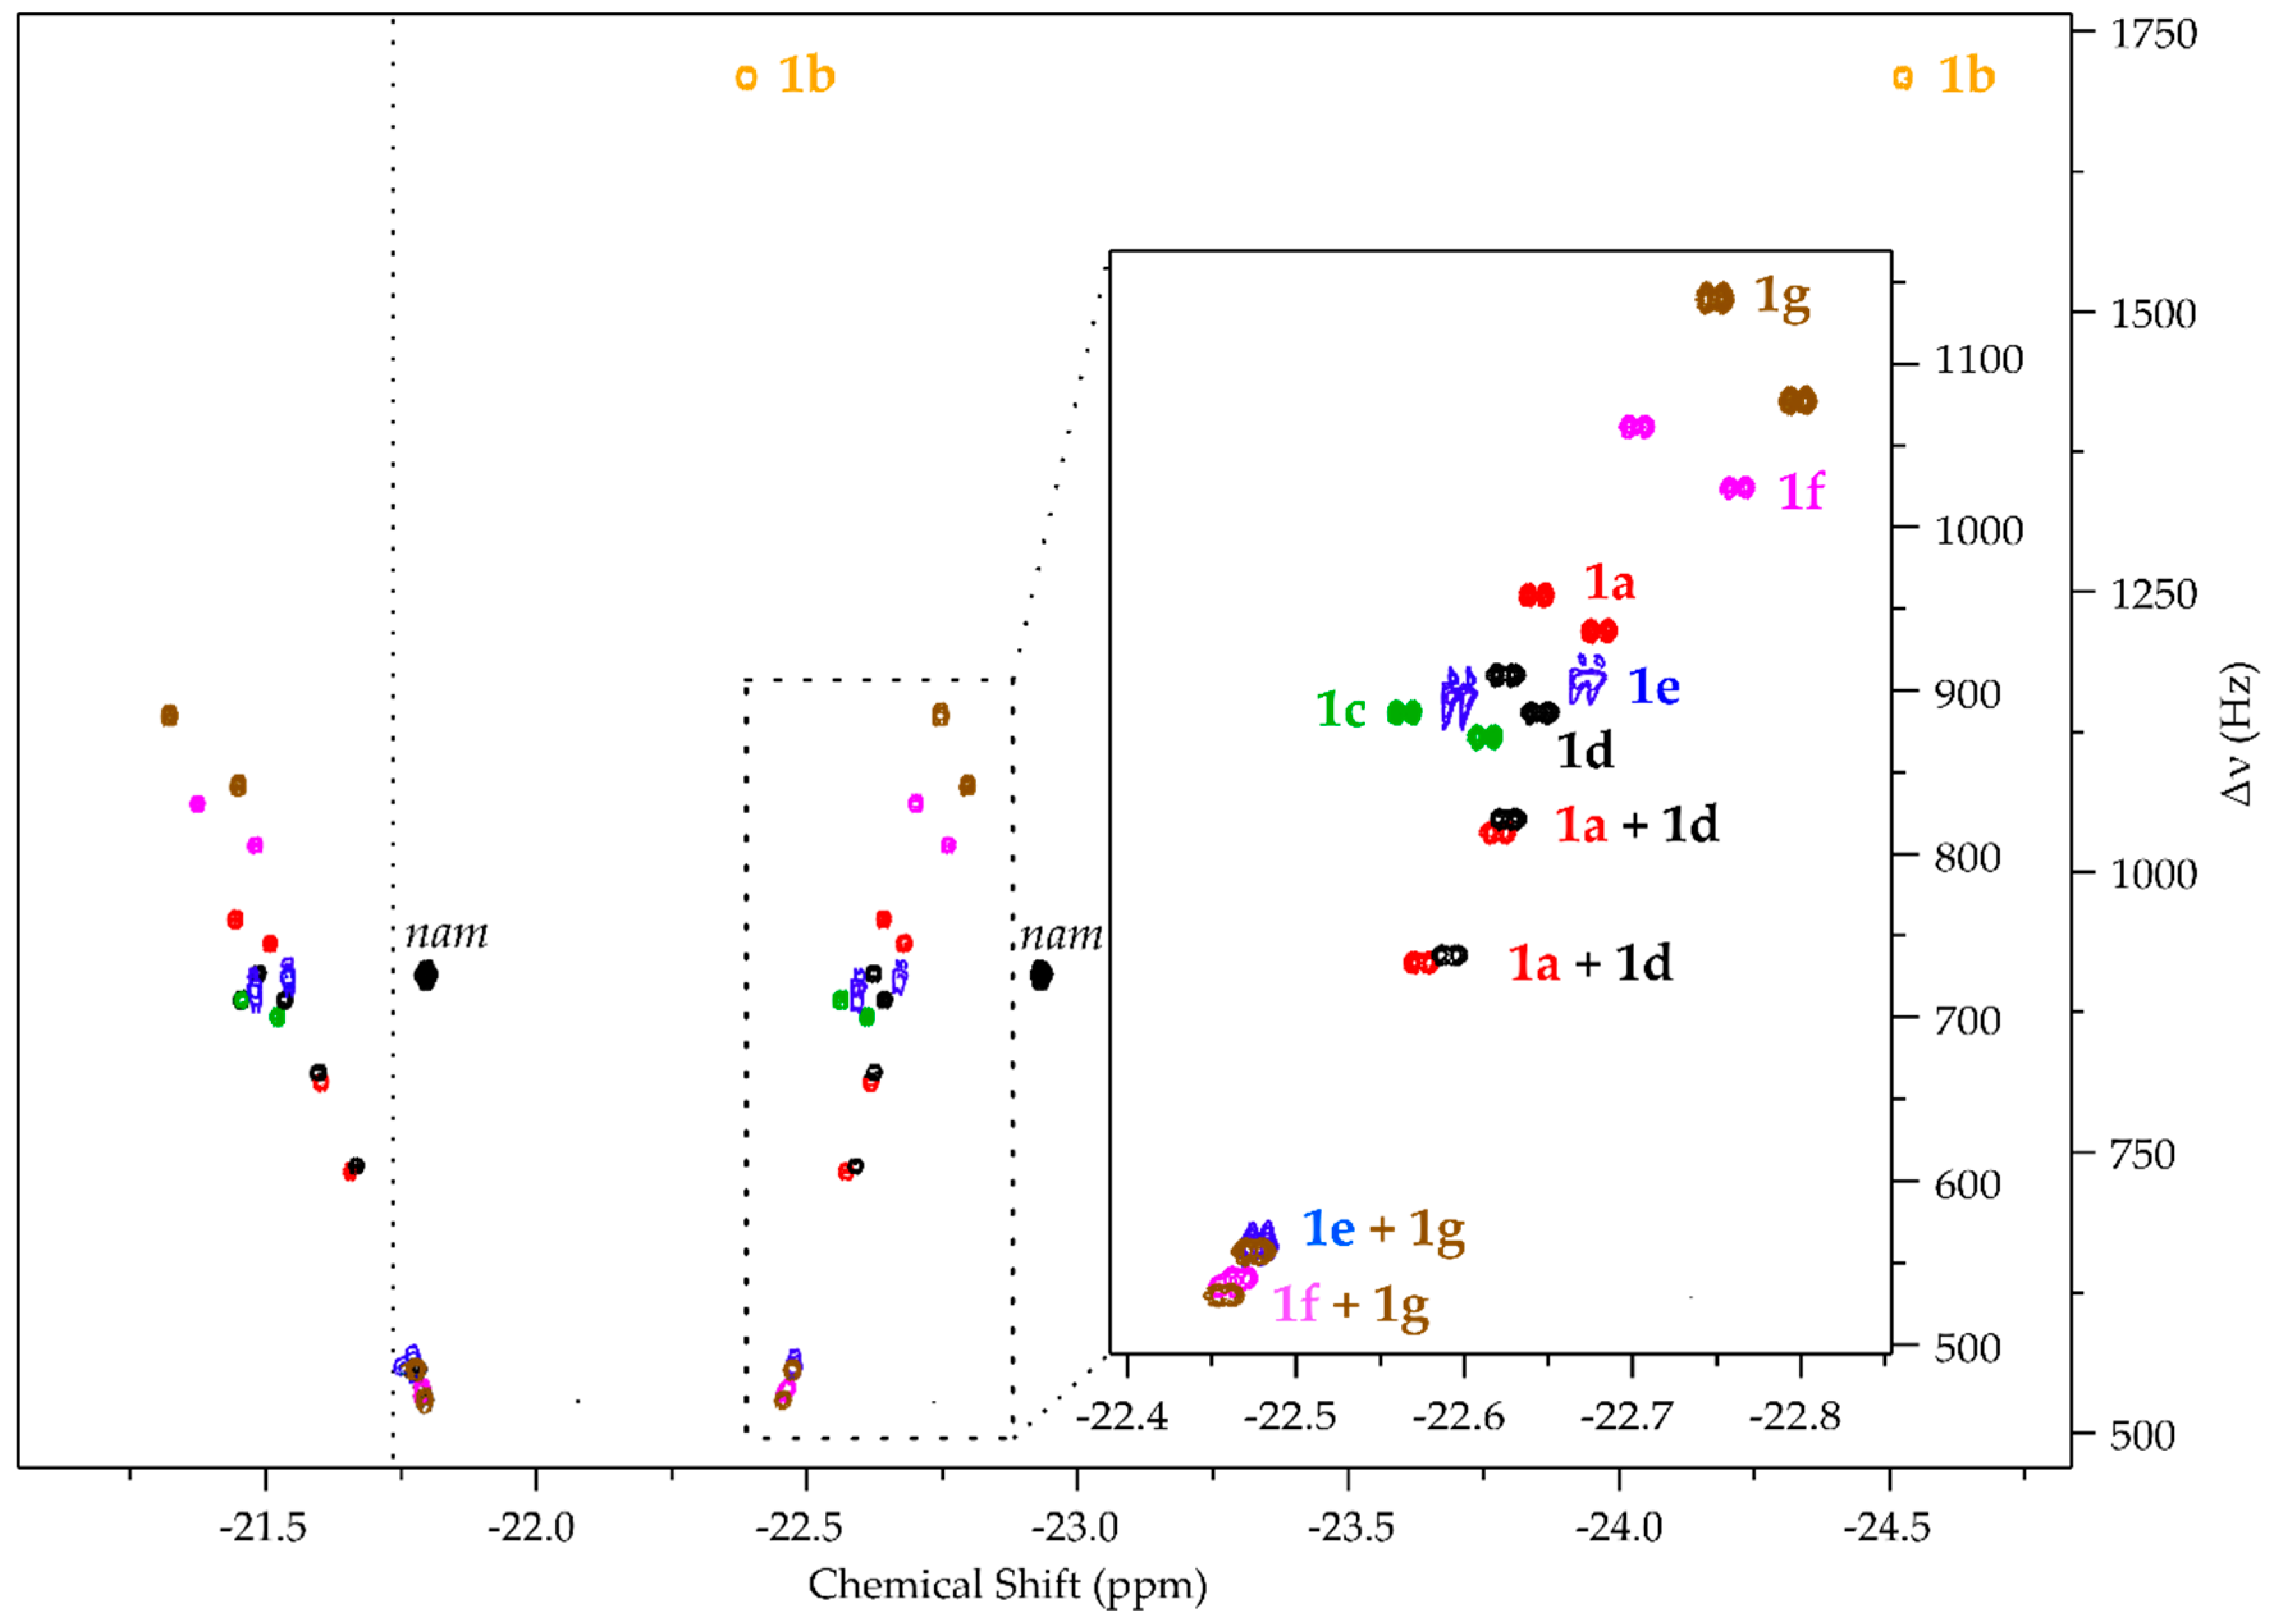
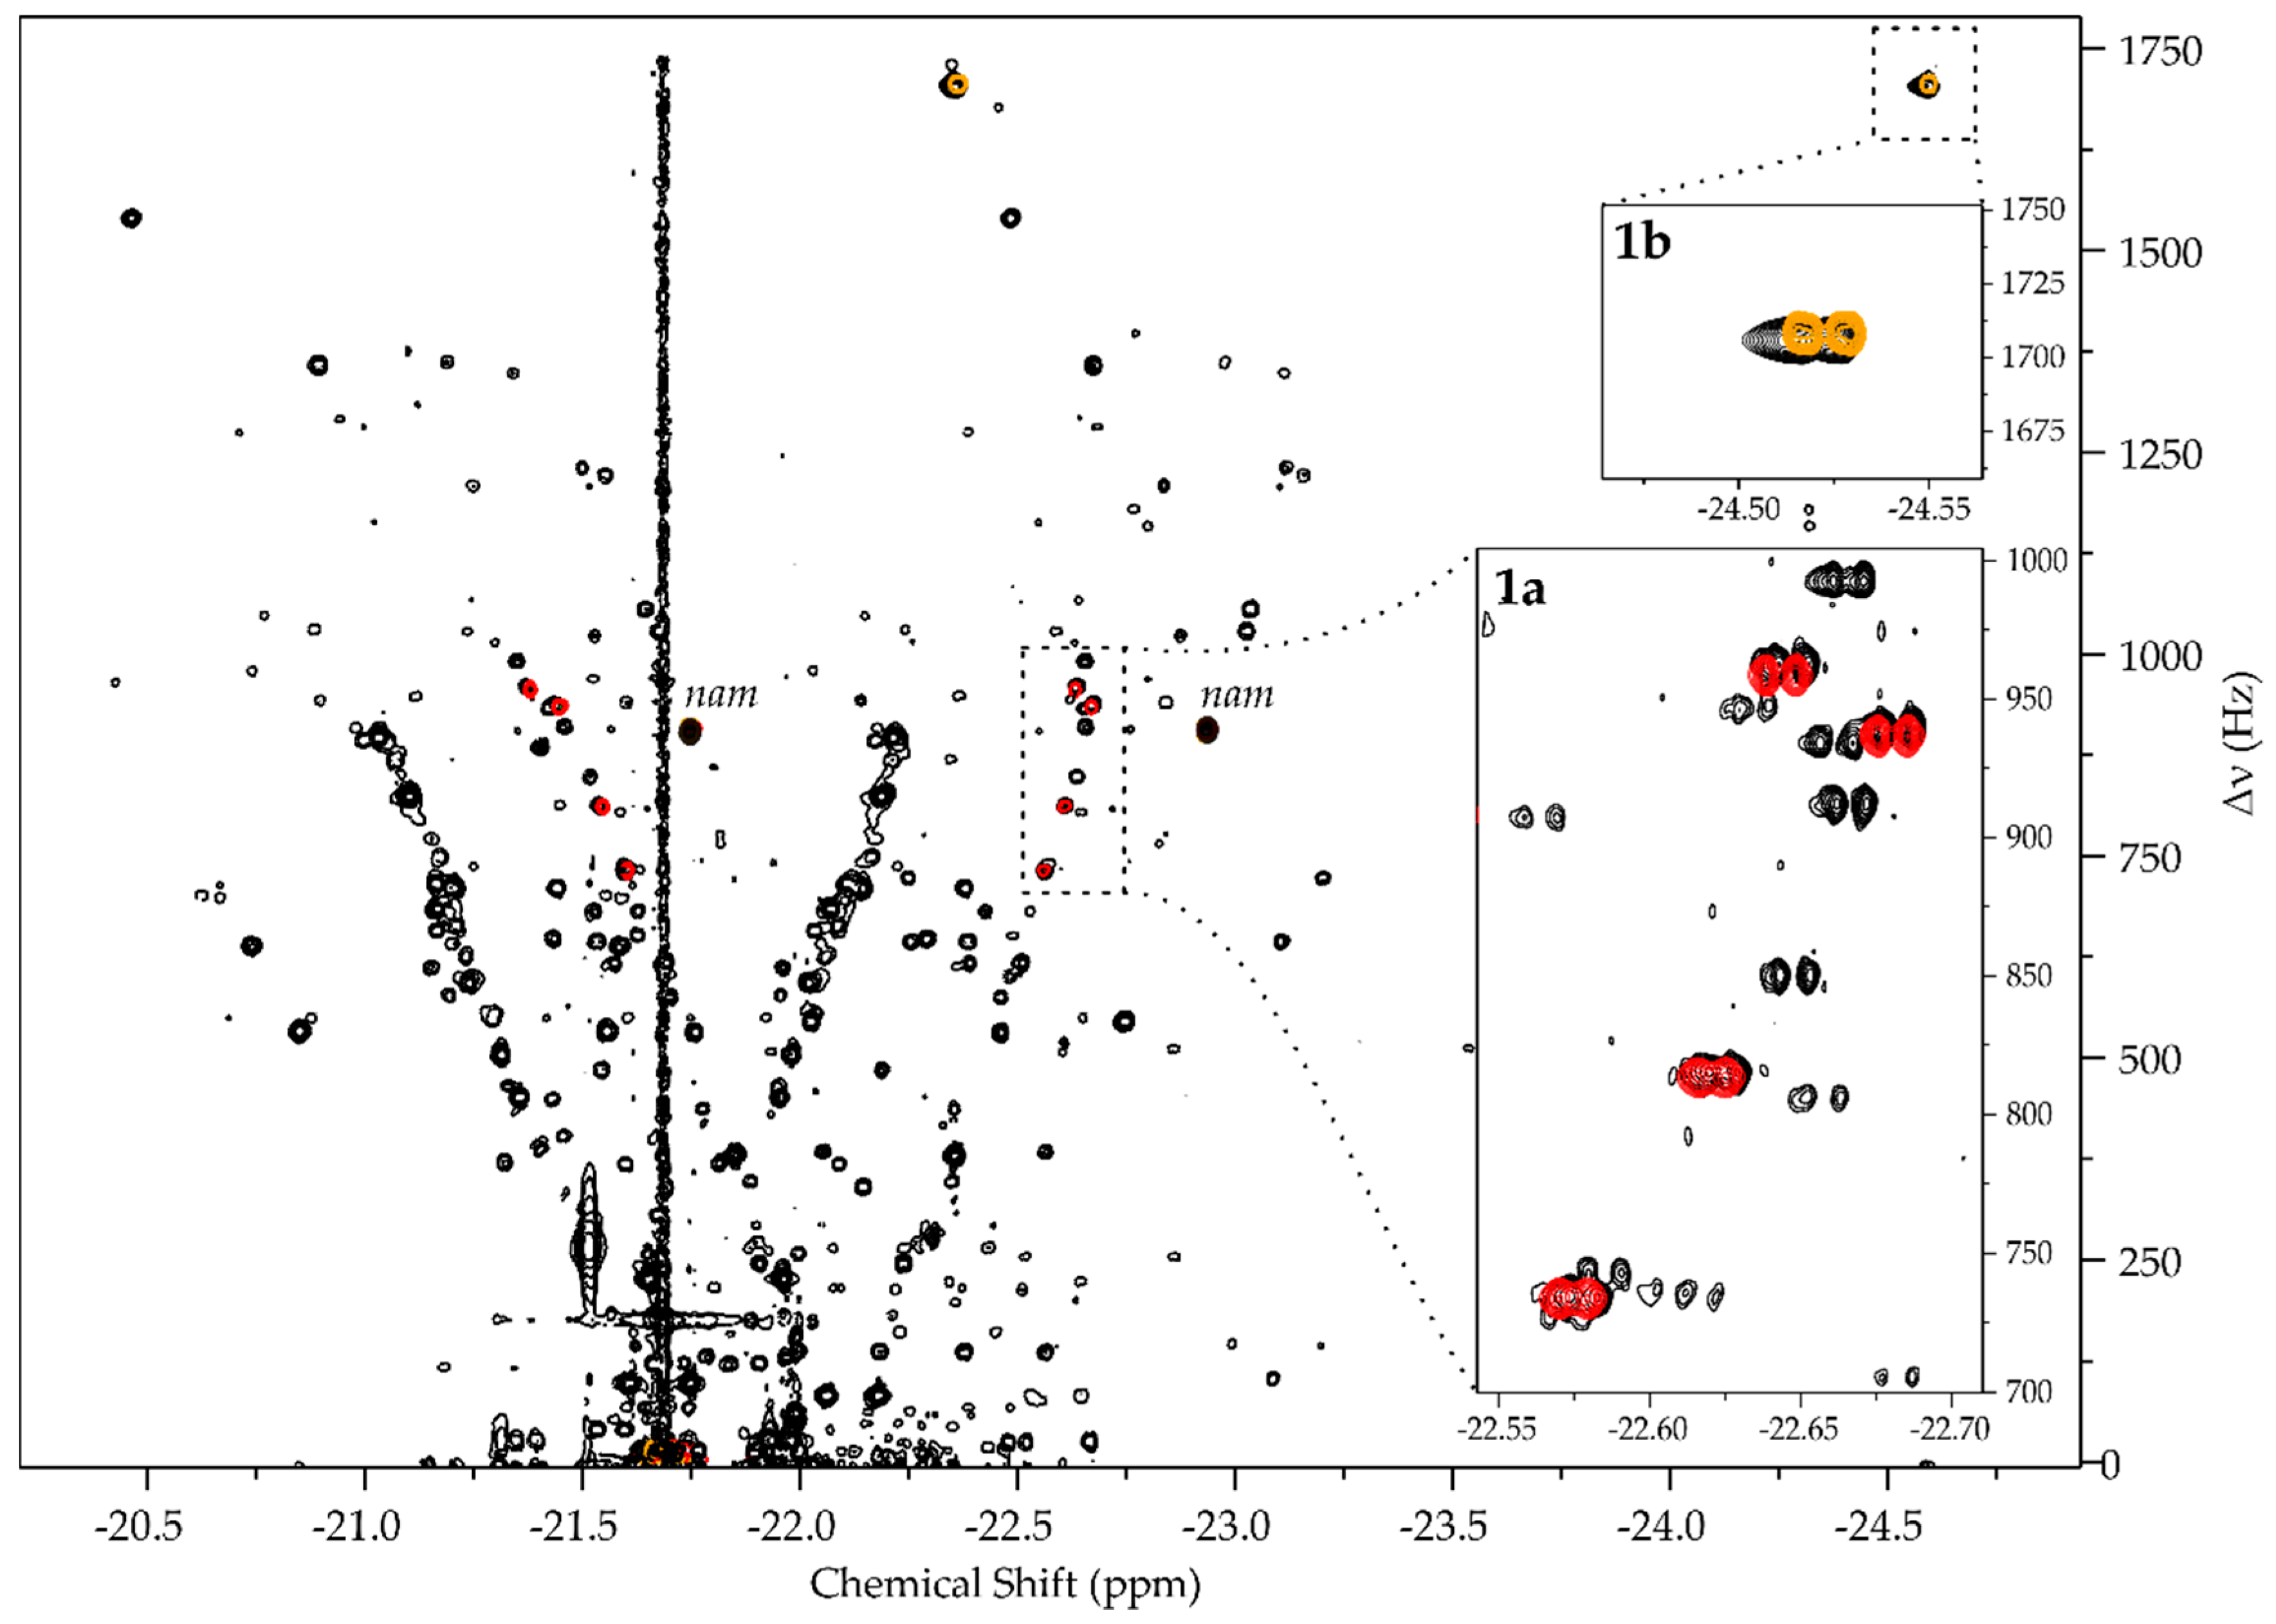
Building the Library

Our strategy consisted of recording the hyperpolarized hydride spectra of a series of adenosine derivatives to confirm if the chemical modification of an analyte relatively far away from its catalyst binding site would incur detectable differences on hydride chemical shifts. Data acquired for this purpose would also comprise the initial small library that can be used to assign signals in biological samples. According to Wood et al., adenine binds iridium from its 1-, 3- and 9-positions [21] of the purine structure (see structure in Table 1). It can be assumed that adenosine also binds 2 via its nitrogenous base. However, the 9-position is occupied by the ribose moiety in adenosine, leaving only two sites accessible.
The test system used for evaluating a series of adenosine derivatives 1a1g (Table 1) consisted of typical concentrations of the catalyst and cosubstrate (1.2 mM of 2, 18-fold excess of mtz over iridium) [9], 100 µM of an analyte, and 20 µM of nicotinamide (nam). A relatively high analyte concentration was chosen for the convenient detection of the analyte in good SNR conditions and nam was used as the internal reference for hydride chemical shifts. Adenosine 1a has been observed previously to give rise to four pairs of hydride signals [6], which was also seen herein (Figure 2 and Figure S2). Since the catalytic center of 2 is prochiral, it forms two diastereomers upon coordination to a chiral analyte (see discussion in SI of ref. [13]). As 1a has two possible binding sites, the expected number of hydride signals is doubled, yielding four pairs of signals.
The four pairs of hydride resonances of 1a complex were two- to three-fold less intense than the signals corresponding to five-fold less concentrated nam (Figure S1), since 1a is distributed among four diastereomeric complexes, whereas all of catalyst bound nam (achiral, single binding site) contributes to a single pair of hydride signals. Moreover, the detection conditions (e.g., 2 and mtz concentration, sample temperature) may be less optimal for 1a as hyperpolarization efficiencies are likely to be different due to differences in analyte and hydrogen exchange and relaxation parameters associated with either analyte. Importantly, hydride signal integrals for analytes 1a1d and 1e1g were found to deviate two-fold within the two groups of similar analytes (e.g., among 1a1d and 1e1g). Between the groups, the largest signal 1a and weakest 1f deviated by five-fold. This suggests that approximate quantification of similar adenosines can be carried out by comparing their signals.
In comparison to 1a, the 2′-O-methylated 1d gave the most similar signal response, yielding a pattern of four pairs of hydride signals that are slightly shifted (Figure 2). This proves that modification of an analyte relatively far away from the binding site manifests detectable influences on hydride signals. Although half of the hydride signals corresponding to 1a and 1d partially overlap, others are well-resolved. N6-methylated 1c, on the other hand, gives only two signal responses [6], presumably because N6-methylation inhibits N1 binding due to added nearby steric bulk. Confirming the actual binding regimes, however, remains the subject for future work.
N1-methylated 1b gives the most unexpected spectral pattern, which has also been observed before [6,7]: it seems to give rise to just a single pair of hydride signals that are noticeably shifted in the spectrum. These two signals, upon closer observation, have some internal structure (Figure S3), suggesting that they may be due to two closely overlapping diastereomers. That would explain the number of signals, since one of the catalyst binding sites (N1) is blocked for 1b, but not their chemical shifts. It is known that N1-methylation of adenine base [32,33] forces it to adopt a different tautomeric (imine) form (Figure S4) and strongly affects its basicity [34]. We suggest this is the reason for the noticeable difference of their catalyst complex hydride chemical shifts, although the exact active catalyst binding site remains unknown.
In the bioenergetics application scenario, detection and resolution of adenosine, AMP, ADP, and ATP is required. It was found that modification of adenosine with different numbers of phosphate groups at its most distant 5′-O-position rendered all four resolvable by their catalyst complex hydride signals. Unlike for 1a, two of the four diastereomeric complex hydride signal pairs overlap totally for 1e (AMP; Figure 2 and Figure S5) and partially for 1f (ADP) and 1g (ATP; Figure 2 and Figure S5). The same signals also overlap among all three, but the other hydride signal pairs are well-resolved. Unlike for any other analyte, 1e signals were found to be of irregular shape on the 2D ZQ spectrum. This was caused by a change in hydride signal chemical shifts during 2D acquisition (see comparison of 1D hydride spectra at sample preparation and 1.5 h later in Figure S6). Since nam signals remain at the same frequency, we suggest that this change is not caused by processes interfering with the catalyst or mtz, but may be the result of gradual deuteration of the analyte during acquisition. A similar process was observed for pyridine by Sellies et al. [13] with similar magnitude changes to the chemical shifts occurring (here 11.5 Hz for the rightmost doublet).

3. Discussion

The acquired information can be used for signal assignment when hydride spectral database is superimposed onto complex spectra of biofluids (Figure 3). That way, signals of compounds in the database could be easily recognized. Herein, this was tested on a urine SPE extract, which was prepared with an SPE protocol modified from previous work [8].
Since the protocol was directed toward the extraction of apolar to mildly polar analytes, the detection of phosphonucleotides 1e, 1f, and 1g was not expected. The retention of other tested analytes was possible, considering 1a1c were identified by spiking in a similarly prepared SPE extract [6]. Overlaying the database and the experimental spectrum demonstrated an overlap of signals from 1a and 1b, whereas at the expected locations of 1c and 1d, SNR was too weak to confirm the analytes.
The inability to detect 1c and 1d may have been caused by two factors. Firstly, the particular urine sample was obtained from a healthy non-smoking volunteer without any known underlying disease. The lack of medical conditions that are expected to increase urinary methylated adenosine concentrations is likely to contribute to their low abundance in the tested sample. There are alternative SPE procedures that would provide more effective retention of adenosines by covalent bonding to the ribose cis-diol moiety [35], if detection of the less abundant derivatives is desired.
Secondly, since the work was aimed toward verifying the resolution of the analytes and confirming the applicability of the concept of libraries, maximum sensitivity was not a priority. Consequently, all spectra were acquired with 50% pH2 and without a cryoprobe, which has been commonly applied in prior instances of hyperpolarized chemosensing in urine samples [6,7,8,9,13]. A cryoprobe would further increase sensitivity by three- to four-fold [36], while increasing pH2 enrichment to 100% would result in an additional threefold increase [37]. Hence, an order of magnitude sensitivity increase would be available by upgrading both the pH2 source and the NMR probe.
All things considered, the ability to assign low-µM 1a and 1b on a room temperature probe by library overlap is a positive result that demonstrates the feasibility of the strategy. Moreover, measured chemical shifts of 1a, 1b, and 1c hydride signals coincide with an earlier report [6], suggesting that such libraries would have universality over different instrumentation and different SPE sample preparation procedures. Hereby we have demonstrated the following concepts:
  • pH2 hyperpolarized chemosensing is remarkably sensitive to relatively small changes in analyte structure, allowing for the resolution of series of structurally highly similar metabolites, including closely related isomers (i.e., 1b, 1c, 1d).
  • Libraries (Table S1) can be built for the assignment of specific families of metabolites. With a few exceptions (e.g., 1b), the observation of Sellies et al. [6] that signals of similar analytes form linear patterns in the ZQ spectra holds.
  • Libraries can be applied by a straightforward superposition of experimental and database spectra.
  • The databases would have universality across different instruments, laboratories, and variations in sample preparation procedures.
This work adds to the pH2 hyperpolarization toolbox, presenting a strategy for understanding the complex hydride spectra from the parahydrogen hyperpolarized chemosensing experiment. Building practical applications by using the spectral data provided herein, and adding to this data, will be the focus of our future work.

4. Materials and Methods

NMR experiments were conducted at sample temperature of 25 °C on an 800 MHz Bruker Avance III spectrometer equipped with a 5 mm TXI probe. Hyperpolarization was carried out in 5 mm Norell S-5-500-IPV-7 pressure tubes with a previously described hyperpolarization setup [9]. pH2 was prepared in flow, as described previously [9]. Hyperpolarized 1D SEPP spectra (Figures S1–S3, S5 and S6) and hyperpolarized 2D ZQ spectra (Figure 2 and Figure 3) were acquired with previously published pulse sequences [6], utilizing high power hard pulses and shaped reburp pulses that covered all signals of interest. One-dimensional spectra were acquired in 64 scans. Two-dimensional data were acquired in 320 increments over 2500 Hz in f1, except for 1b and urine SPE extract, for which 512 increments were acquired over 3500 Hz spectral width. Two scans per increment were acquired in all cases. Processing was done following earlier described principles [6,9] with Mestrenova 14.2 software.
Waters Oasis HLB® 6 mL / 200 mg cartridges were used for solid phase extraction (SPE). Methanol used to activate the cartridges was obtained from Honeywell Riedel-de Haën™. Analytes were eluted with, and experiments were conducted in, methanol-d4 obtained from Deutero Gmbh. 1-methyladenosine was acquired from Cayman Chemicals. Nicotinamide and adenosine were acquired from TCI Chemicals. N6-methyladenosine and 2′-O-methyladenosine were acquired from Carbosynth. AMP, ADP, and ATP were obtained from Sigma Aldrich. All chemicals were used as supplied. Catalyst 2 precursor [Ir(Cl)(COD)(Imes)] and cosubstrate 1-methyl-1,2,3-triazol (mtz) were synthesized in-house by the same methods [6,7,9] as previously described.
1…2 mM stock solutions of all analytes in methanol-d4 were prepared gravimetrically. NMR samples were prepared by adding 150 µL of 4.8 mM solution of [Ir(Cl)(COD)(Imes)], 13 µL of 1 M stock solution of mtz, and 37 µL of methanol-d4 to a pressure tube, pressurizing the sample under 5 bar of H2, shaking the tube and allowing the catalyst to convert to its active form 2 in 2 h. Then, appropriate amounts of analyte stock solutions and methanol-d4 were added to reach 1.2 mM concentration of 2, 20 µM of nam and 100 µM of the particular analyte in 600 µL of total sample volume. The tube was connected to the hyperpolarization setup [9] for NMR experiments.
A urine sample was collected from a healthy non-smoking volunteer as morning first midstream urine and frozen at −80 °C. Prior to analysis, the sample was thawed over a room temperature water bath, pH-adjusted to 8.0 with 1 M NaOH and centrifuged for 12 min at 1825× g. SPE of the resulting urine sample was carried out by activating the SPE cartridge with 5 mL of methanol, conditioning it with 3 mL of 10 mM pH 8.0 phosphate buffer., loading 5 mL of urine and eluting it by light nitrogen overpressure above the cartridge (approx. 2–3 mL/min). The cartridge was washed with 3 mL of 10 mM pH 8.0 phosphate buffer and dried for 30 min with a nitrogen flow generated by 1 bar N2 overpressure above the cartridge. Finally, analytes were eluted by adding 1.2 mL of methanol-d4, which yielded approximately 800 µL of extract. For hyperpolarization experiments, 450 µL of the extract was mixed with the preactivated solution of 2 and mtz (1.2 mM final concentration of 2, 18-fold excess of mtz).

Supplementary Materials

The following supporting information is available online, Figure S1: Hyperpolarized 1D hydride spectrum of adenosine 1a sample; Figure S2: Hyperpolarized 1D spectra of the hydride spectral regions of the same samples as main text Figure 2; Figure S3: The structure of 1b hydride signals; Figure S4: 1-Methyladenosine 1b neutral iminium tautomer; Figure S5: Comparison of 1D hydride spectra of AMP (1e), ADP (1f) and ATP (1g); Figure S6: 1D hyperpolarized hydride spectra of the same 1e containing sample within minutes from preparing the sample (red) and 1 h later (black); Table S1: Library of hydride chemical shifts of complexes 3 for adenosine derivatives 1.

Author Contributions

Conceptualization, I.R.; methodology, K.A., N.R. and I.R.; investigation, K.A., N.R. and I.R.; writing—original draft preparation, I.R.; writing—review and editing, K.A. and N.R.; funding acquisition, K.A. and I.R. All authors have read and agreed to the published version of the manuscript.

Funding

This research was funded by the Estonian Research Council, grant number PSG11, and the Archimedes Foundation, Center of Excellence project TK134.

Institutional Review Board Statement

Urine sample handling was approved by the Estonian Research Ethics Committee of the National Institute for Health Development of Estonia (Decision No. 686). Urine sample used in this study was donated by a healthy adult (37 years of age). Excess urine sample material was discarded in accordance with local regulations on handling human-derived samples.

Informed Consent Statement

Informed consent was obtained from all subjects involved in the study.

Data Availability Statement

The data presented in this study are openly available in Mendeley Data at 10.17632/3cwxd4d472.1.

Conflicts of Interest

The authors declare no conflict of interest.

Sample Availability

Compounds 1a1g and nam were acquired commercially. Samples of catalyst 2 precursor [Ir(Cl)(COD)(Imes)] and cosubstrate 1-methyl-1,2,3-triazol (mtz) are available from the authors.

References

  1. Emwas, A.-H.M.; Salek, R.M.; Griffin, J.L.; Merzaban, J. NMR-based metabolomics in human disease diagnosis: Applications, limitations, and recommendations. Metabolomics 2013, 9, 1048–1072. [Google Scholar] [CrossRef]
  2. Markley, J.L.; Brüschweiler, R.; Edison, A.S.; Eghbalnia, H.R.; Powers, R.; Raftery, D.; Wishart, D.S. The future of NMR-based metabolomics. Curr. Opin. Biotechnol. 2017, 43, 34–40. [Google Scholar] [CrossRef] [PubMed] [Green Version]
  3. Kovtunov, K.V.; Pokochueva, E.V.; Salnikov, O.G.; Cousin, S.F.; Kurzbach, D.; Vuichoud, B.; Jannin, S.; Chekmenev, E.Y.; Goodson, B.M.; Barskiy, D.A.; et al. Hyperpolarized NMR Spectroscopy: D-DNP, PHIP, and SABRE Techniques. Chem.-Asian J. 2018, 13, 1857–1871. [Google Scholar] [CrossRef] [PubMed] [Green Version]
  4. Hermkens, N.K.J.; Eshuis, N.; van Weerdenburg, B.J.A.; Feiters, M.C.; Rutjes, F.P.J.T.; Wijmenga, S.S.; Tessari, M. NMR-Based Chemosensing via p-H2 Hyperpolarization: Application to Natural Extracts. Anal. Chem. 2016, 88, 3406–3412. [Google Scholar] [CrossRef] [Green Version]
  5. Hermkens, N.K.J.; Aspers, R.L.E.G.; Feiters, M.C.; Rutjes, F.P.J.T.; Tessari, M. Trace analysis in water-alcohol mixtures by continuous p-H2 hyperpolarization at high magnetic field. Magn. Reson. Chem. 2018, 56, 633–640. [Google Scholar] [CrossRef] [Green Version]
  6. Sellies, L.; Reile, I.; Aspers, R.L.E.G.; Feiters, M.C.; Rutjes, F.P.J.T.; Tessari, M. Parahydrogen induced hyperpolarization provides a tool for NMR metabolomics at nanomolar concentrations. Chem. Commun. 2019, 55, 7235–7238. [Google Scholar] [CrossRef]
  7. Ausmees, K.; Reimets, N.; Reile, I. Parahydrogen hyperpolarization of minimally altered urine samples for sensitivity enhanced NMR metabolomics. Chem. Commun. 2022, 58, 463–466. [Google Scholar] [CrossRef]
  8. Reile, I.; Eshuis, N.; Hermkens, N.K.J.; van Weerdenburg, B.J.A.; Feiters, M.C.; Rutjes, F.P.J.T.; Tessari, M. NMR detection in biofluid extracts at sub-uM concentrations via para-H2 induced hyperpolarization. Analyst 2016, 141, 4001–4005. [Google Scholar] [CrossRef] [Green Version]
  9. Reimets, N.; Ausmees, K.; Vija, S.; Reile, I. Developing Analytical Applications for Parahydrogen Hyperpolarization: Urinary Elimination Pharmacokinetics of Nicotine. Anal. Chem. 2021, 93, 9480–9485. [Google Scholar] [CrossRef]
  10. Adelabu, I.; TomHon, P.; Kabir, M.S.H.; Nantogma, S.; Abdulmojeed, M.; Mandzhieva, I.; Ettedgui, J.; Swenson, R.E.; Krishna, M.C.; Goodson, B.M.; et al. Order-Unity 13C Nuclear Polarization of [1-13C]Pyruvate in Seconds and the Interplay of Water and SABRE Enhancement. ChemPhysChem 2022, 23, e202100839. [Google Scholar] [CrossRef]
  11. Ratajczyk, T.; Gutmann, T.; Bernatowicz, P.; Buntkowsky, G.; Frydel, J.; Fedorczyk, B. NMR Signal Enhancement by Effective SABRE Labeling of Oligopeptides. Chem.-Eur. J. 2015, 21, 12616–12619. [Google Scholar] [CrossRef] [PubMed]
  12. Ratajczyk, T.; Buntkowsky, G.; Gutmann, T.; Fedorczyk, B.; Mames, A.; Pietrzak, M.; Puzio, Z.; Szkudlarek, P.G. Magnetic Resonance Signal Amplification by Reversible Exchange of Selective PyFALGEA Oligopeptide Ligands Towards Epidermal Growth Factor Receptors. ChemBioChem 2021, 22, 855–860. [Google Scholar] [CrossRef] [PubMed]
  13. Sellies, L.; Aspers, R.L.E.G.; Feiters, M.C.; Rutjes, F.P.J.T.; Tessari, M. Parahydrogen Hyperpolarization Allows Direct NMR Detection of α-Amino Acids in Complex (Bio)mixtures. Angew. Chem. Int. Ed. 2021, 60, 26954–26959. [Google Scholar] [CrossRef] [PubMed]
  14. Pravdivtsev, A.N.; Buntkowsky, G.; Duckett, S.B.; Koptyug, I.V.; Hövener, J.-B. Parahydrogen-Induced Polarization of Amino Acids. Angew. Chem. Int. Ed. 2021, 60, 23496–23507. [Google Scholar] [CrossRef]
  15. Kim, S.; Min, S.; Chae, H.; Jeong, H.J.; Namgoong, S.K.; Oh, S.; Jeong, K. Hyperpolarization of Nitrile Compounds Using Signal Amplification by Reversible Exchange. Molecules 2020, 25, 3347. [Google Scholar] [CrossRef]
  16. Shchepin, R.V.; Barskiy, D.A.; Coffey, A.M.; Goodson, B.M.; Chekmenev, E.Y. NMR Signal Amplification by Reversible Exchange of Sulfur-Heterocyclic Compounds Found In Petroleum. ChemistrySelect 2016, 1, 2552–2555. [Google Scholar] [CrossRef] [Green Version]
  17. Hermkens, N.K.J.; Feiters, M.C.; Rutjes, F.P.J.T.; Wijmenga, S.S.; Tessari, M. High field hyperpolarization-EXSY experiment for fast determination of dissociation rates in SABRE complexes. J. Magn. Reson. 2017, 276, 122–127. [Google Scholar] [CrossRef]
  18. Sellies, L.; Aspers, R.L.E.G.; Tessari, M. Determination of hydrogen exchange and relaxation parameters in PHIP complexes at micromolar concentrations. Magn. Reson. 2021, 2, 331–340. [Google Scholar] [CrossRef]
  19. Giraudeau, P. Quantitative 2D liquid-state NMR. Magn. Reson. Chem. 2014, 52, 259–272. [Google Scholar] [CrossRef]
  20. Aspers, R.L.E.G.; Tessari, M. An approach to fast 2D nuclear magnetic resonance at low concentration based on p-H2-induced polarization and nonuniform sampling. Magn. Reson. Chem. 2021, 59, 1236–1243. [Google Scholar] [CrossRef]
  21. Wood, N.J.; Brannigan, J.A.; Duckett, S.B.; Heath, S.L.; Wagstaff, J. Detection of Picomole Amounts of Biological Substrates by para -Hydrogen-Enhanced NMR Methods in Conjunction with a Suitable Receptor Complex. J. Am. Chem. Soc. 2007, 129, 11012–11013. [Google Scholar] [CrossRef] [PubMed]
  22. Hövener, J.-B.; Schwaderlapp, N.; Lickert, T.; Duckett, S.B.; Mewis, R.E.; Highton, L.A.R.; Kenny, S.M.; Green, G.G.R.; Leibfritz, D.; Korvink, J.G.; et al. A hyperpolarized equilibrium for magnetic resonance. Nat. Commun. 2013, 4, 2946. [Google Scholar] [CrossRef] [PubMed] [Green Version]
  23. Seidel, A.; Brunner, S.; Seidel, P.; Fritz, G.I.; Herbarth, O. Modified nucleosides: An accurate tumour marker for clinical diagnosis of cancer, early detection and therapy control. Br. J. Cancer 2006, 94, 1726–1733. [Google Scholar] [CrossRef] [PubMed] [Green Version]
  24. Patejko, M.; Struck-Lewicka, W.; Siluk, D.; Waszczuk-Jankowska, M.; Markuszewski, M.J. Urinary Nucleosides and Deoxynucleosides. In Advances in Clinical Chemistry; Elsevier: Amsterdam, The Netherlands, 2018; Volume 83, pp. 1–51. ISBN 9780128152072. [Google Scholar]
  25. Struck, W.; Siluk, D.; Yumba-Mpanga, A.; Markuszewski, M.; Kaliszan, R.; Markuszewski, M.J. Liquid chromatography tandem mass spectrometry study of urinary nucleosides as potential cancer markers. J. Chromatogr. A 2013, 1283, 122–131. [Google Scholar] [CrossRef] [PubMed]
  26. Hsu, W.-Y.; Chen, C.-J.; Huang, Y.-C.; Tsai, F.-J.; Jeng, L.-B.; Lai, C.-C. Urinary Nucleosides as Biomarkers of Breast, Colon, Lung, and Gastric Cancer in Taiwanese. PLoS ONE 2013, 8, e81701. [Google Scholar] [CrossRef]
  27. Seidel, A.; Seidel, P.; Manuwald, O.; Herbarth, O. Modified nucleosides as biomarkers for early cancer diagnose in exposed populations. Environ. Toxicol. 2015, 30, 956–967. [Google Scholar] [CrossRef]
  28. Altobelli, E.; Angeletti, P.M.; Latella, G. Role of Urinary Biomarkers in the Diagnosis of Adenoma and Colorectal Cancer: A Systematic Review and Meta-Analysis. J. Cancer 2016, 7, 1984–2004. [Google Scholar] [CrossRef] [Green Version]
  29. Bouatra, S.; Aziat, F.; Mandal, R.; Guo, A.C.; Wilson, M.R.; Knox, C.; Bjorndahl, T.C.; Krishnamurthy, R.; Saleem, F.; Liu, P.; et al. The human urine metabolome. PLoS ONE 2013, 8, e73076. [Google Scholar] [CrossRef] [Green Version]
  30. Pavlova, N.N.; Thompson, C.B. The Emerging Hallmarks of Cancer Metabolism. Cell Metab. 2016, 23, 27–47. [Google Scholar] [CrossRef] [Green Version]
  31. Pucar, D.; Dzeja, P.P.; Bast, P.; Gumina, R.J.; Drahl, C.; Lim, L.; Juranic, N.; Macura, S.; Terzic, A. Mapping hypoxia-induced bioenergetic rearrangements and metabolic signaling by 18O-assisted 31P NMR and 1H NMR spectroscopy. Mol. Cell. Biochem. 2004, 256, 281–289. [Google Scholar] [CrossRef] [Green Version]
  32. Dreyfus, M.; Dodin, G.; Bensaude, O.; Dubois, J.E. Tautomerism of purines. 2. Amino-imino tautomerism in 1-alkyladenines. J. Am. Chem. Soc. 1977, 99, 7027–7037. [Google Scholar] [CrossRef]
  33. Lippert, B.; Schöllhorn, H.; Thewalt, U. Metal-stabilized rare tautomers of nucleobases. 4. on the question of adenine tautomerization by a coordinated platinum(II). Inorg. Chim. Acta 1992, 198–200, 723–732. [Google Scholar] [CrossRef]
  34. Kapinos, L.E.; Operschall, B.P.; Larsen, E.; Sigel, H. Understanding the Acid-Base Properties of Adenosine: The Intrinsic Basicities of N1, N3 and N7. Chem.-Eur. J. 2011, 17, 8156–8164. [Google Scholar] [CrossRef]
  35. Lu, Z.; Wang, Q.; Wang, M.; Fu, S.; Zhang, Q.; Zhang, Z.; Zhao, H.; Liu, Y.; Huang, Z.; Xie, Z.; et al. Using UHPLC Q-Trap/MS as a complementary technique to in-depth mine UPLC Q-TOF/MS data for identifying modified nucleosides in urine. J. Chromatogr. B 2017, 1051, 108–117. [Google Scholar] [CrossRef]
  36. Kovacs, H.; Moskau, D.; Spraul, M. Cryogenically cooled probes—A leap in NMR technology. Prog. Nucl. Magn. Reson. Spectrosc. 2005, 46, 131–155. [Google Scholar] [CrossRef]
  37. Natterer, J.; Bargon, J. Parahydrogen induced polarization. Prog. Nucl. Magn. Reson. Spectrosc. 1997, 31, 293–315. [Google Scholar] [CrossRef]
Figure 1. The principle of chemosensing by pH2-induced hyperpolarization [4]. Complexes 3 are transient in nature, which is necessary for the incorporation of a new analyte and fresh pH2. Mes denotes 1,3,5-trimethylphenyl group, known as mesityl group; mtz denotes 1-methyl-1,2,3-triazol.
Molecules 27 00802 g001
Figure 2. Hyperpolarized 2D ZQ spectra [6] of the adenosines’ library. Spectra of all compounds have been recorded separately, referenced to nam signal (using −22.935 ppm for right hand hydride signal [6]) and superimposed. For clarity, all hydride signals for a certain compound are presented in the same color, although the doublet pairs are detected in opposite phase. All analytes (1a1g) present at least two clearly resolved signal pairs. The dominating signal of complex 2 (dotted line at −21.74 ppm, see Figure S1 Supplementary Materials) was omitted from the spectra by convolution filtering. See Figure S2 for hyperpolarized hydrides’ 1D spectra of all analytes and Table S1 for chemical shifts of hydride signals.
Molecules 27 00802 g002
Figure 3. Hyperpolarized 2D ZQ spectrum of urine SPE extract overlayed with spectra of (1a) (red) and (1b) (beige), referenced to nam signal (using −22.935 ppm for right hand hydride signal [6]). All hydride signals of the same analyte are presented in the same color, although the doublet pairs are detected in opposite phase [6].
Molecules 27 00802 g003
Table 1. Adenosines used in the study.
Molecules 27 00802 i001
AnalyteNoR @ 1R @ 6R @ 2′R @ 5′
Adenosine1aHHHH
1-Methyladenosine *1bCH3HHH
6N-Methyladenosine1cHCH3HH
2′-O-Methyladenosine1dHHCH3H
AMP1eHHHPO3H
ADP1fHHHPO3-PO3H
ATP1gHHHPO3-PO3-PO3H
* 1b likely adopts the neutral imino conformer structure in methanol (see Figure S4).
Publisher’s Note: MDPI stays neutral with regard to jurisdictional claims in published maps and institutional affiliations.

