
Aquaphotomics Research of Cold Stress in Soybean Cultivars with Different Stress Tolerance Ability: Early Detection of Cold Stress Response

 ,
,  and
and 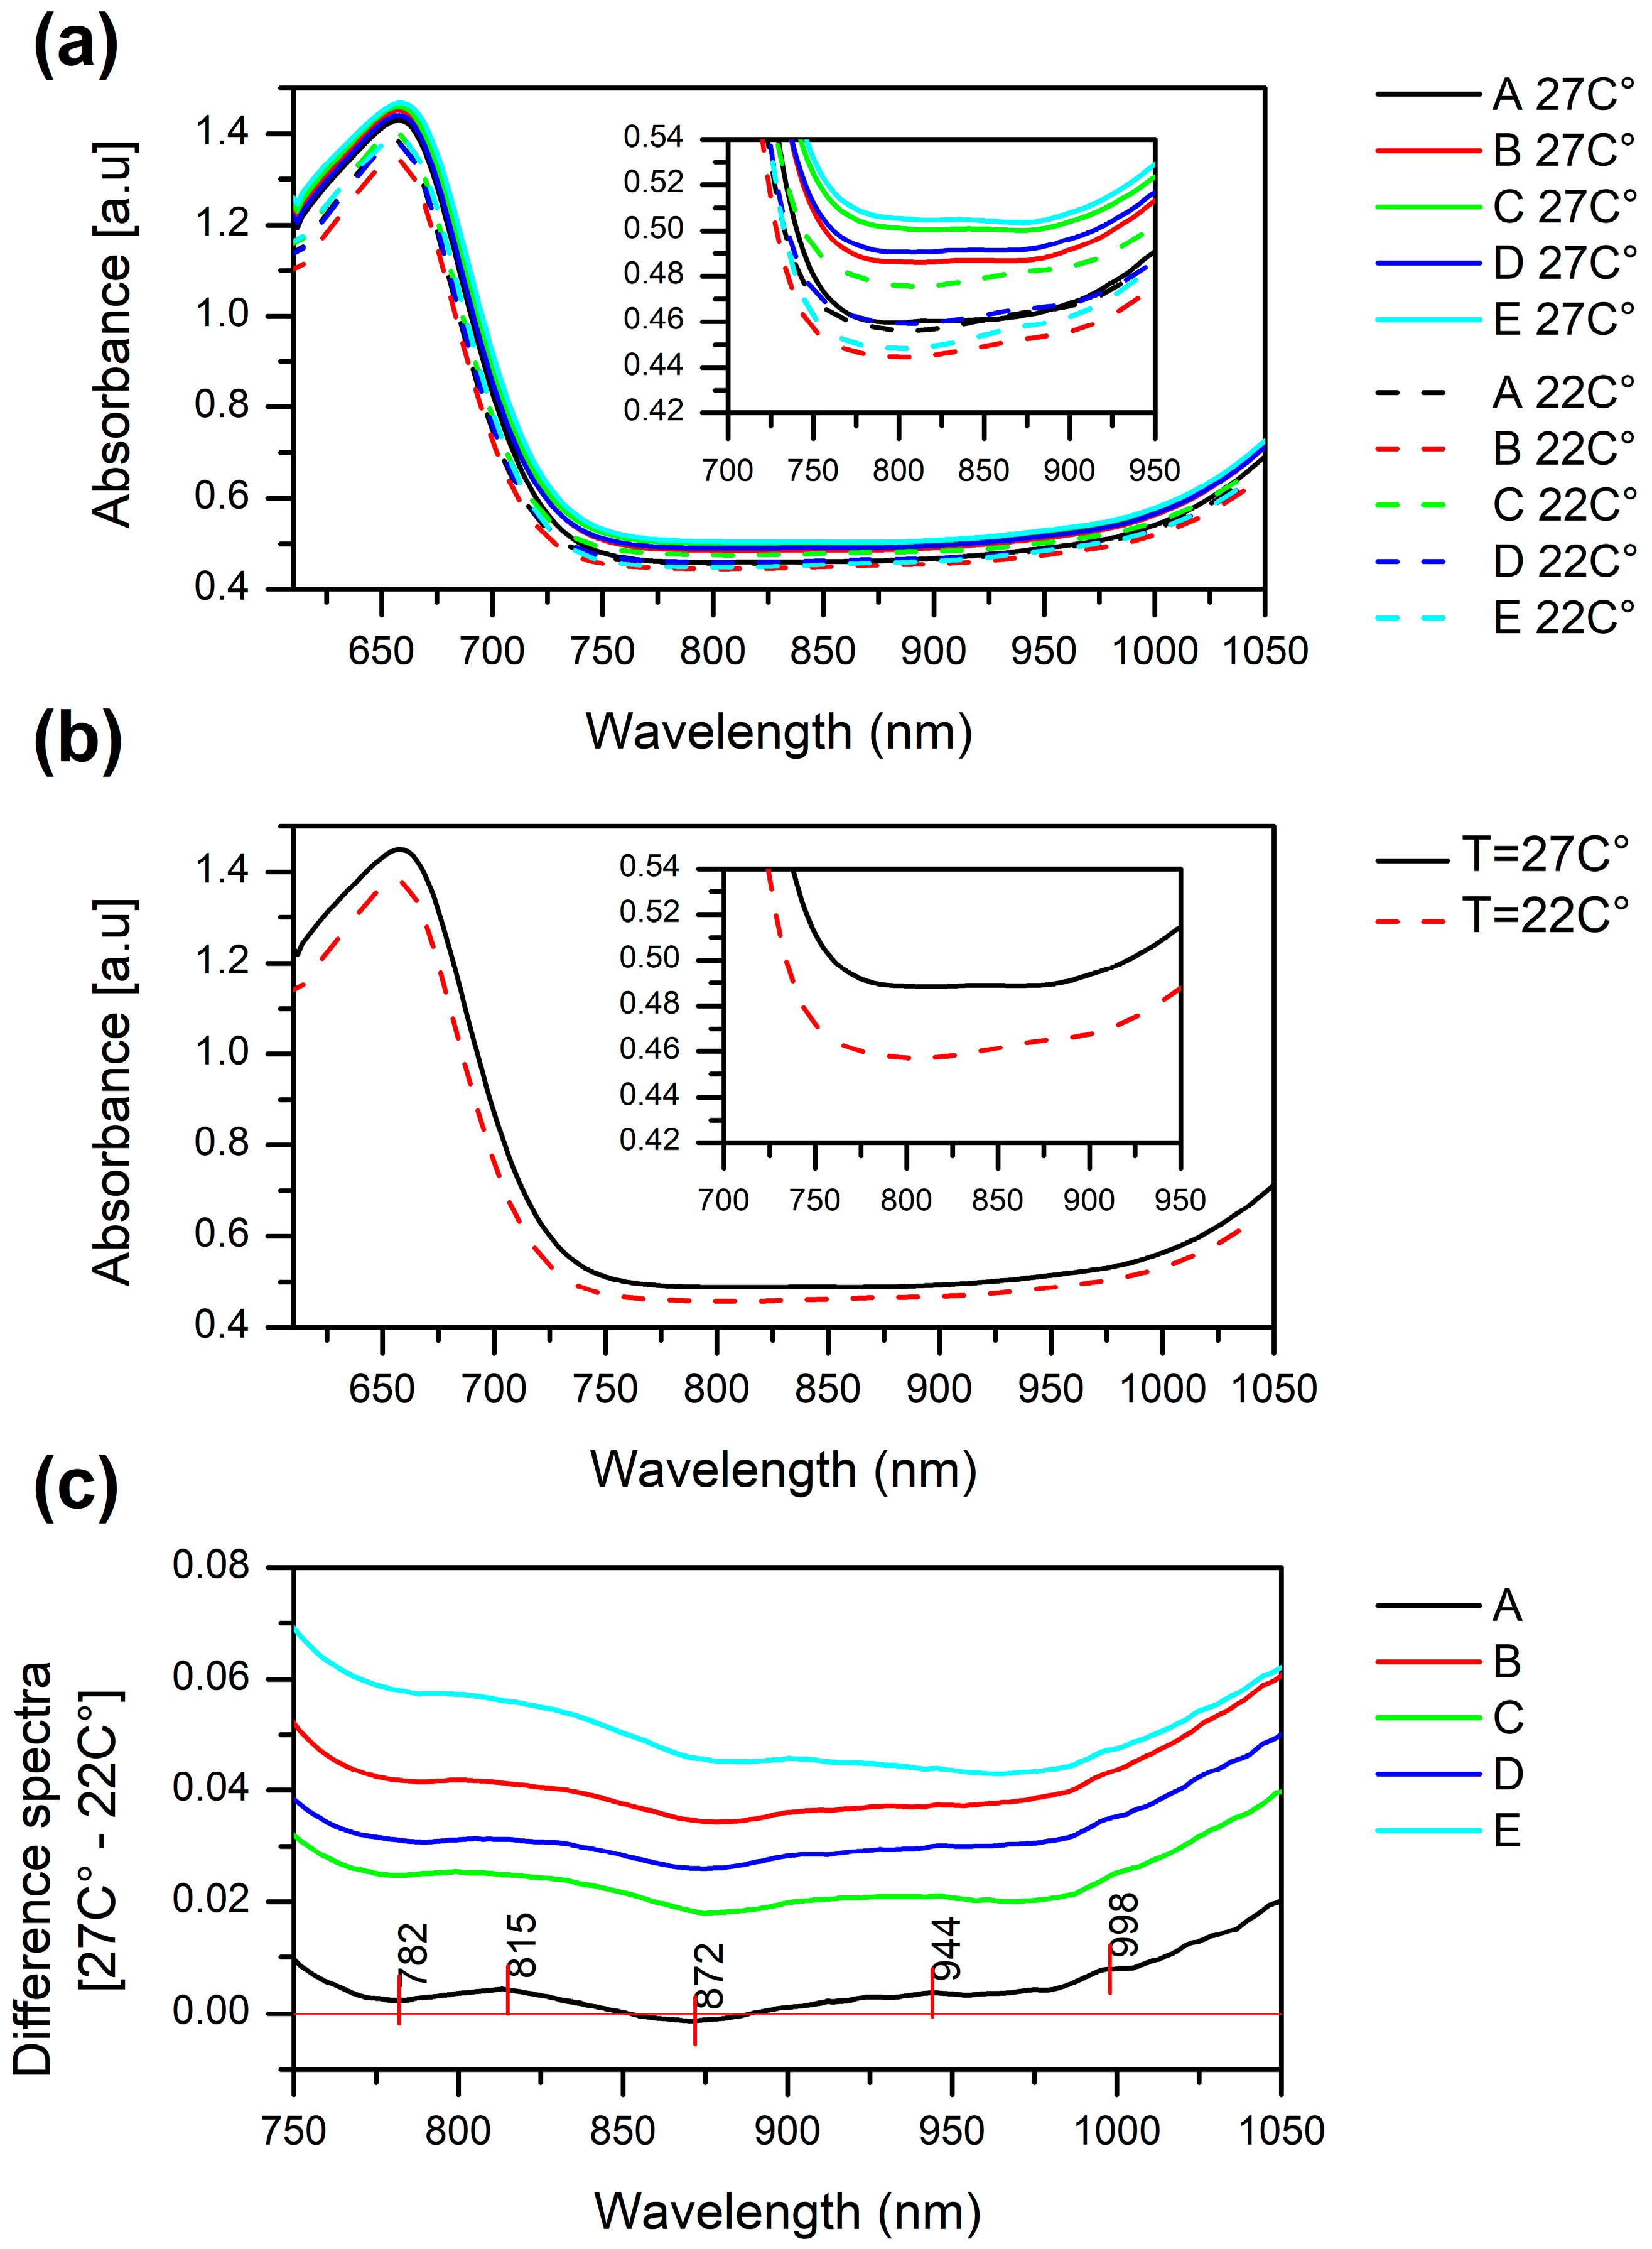
Abstract
:1. Introduction
2. Results
2.1. Raw Absorbance Spectra of Stressed and Non-Stressed Soybean Plants
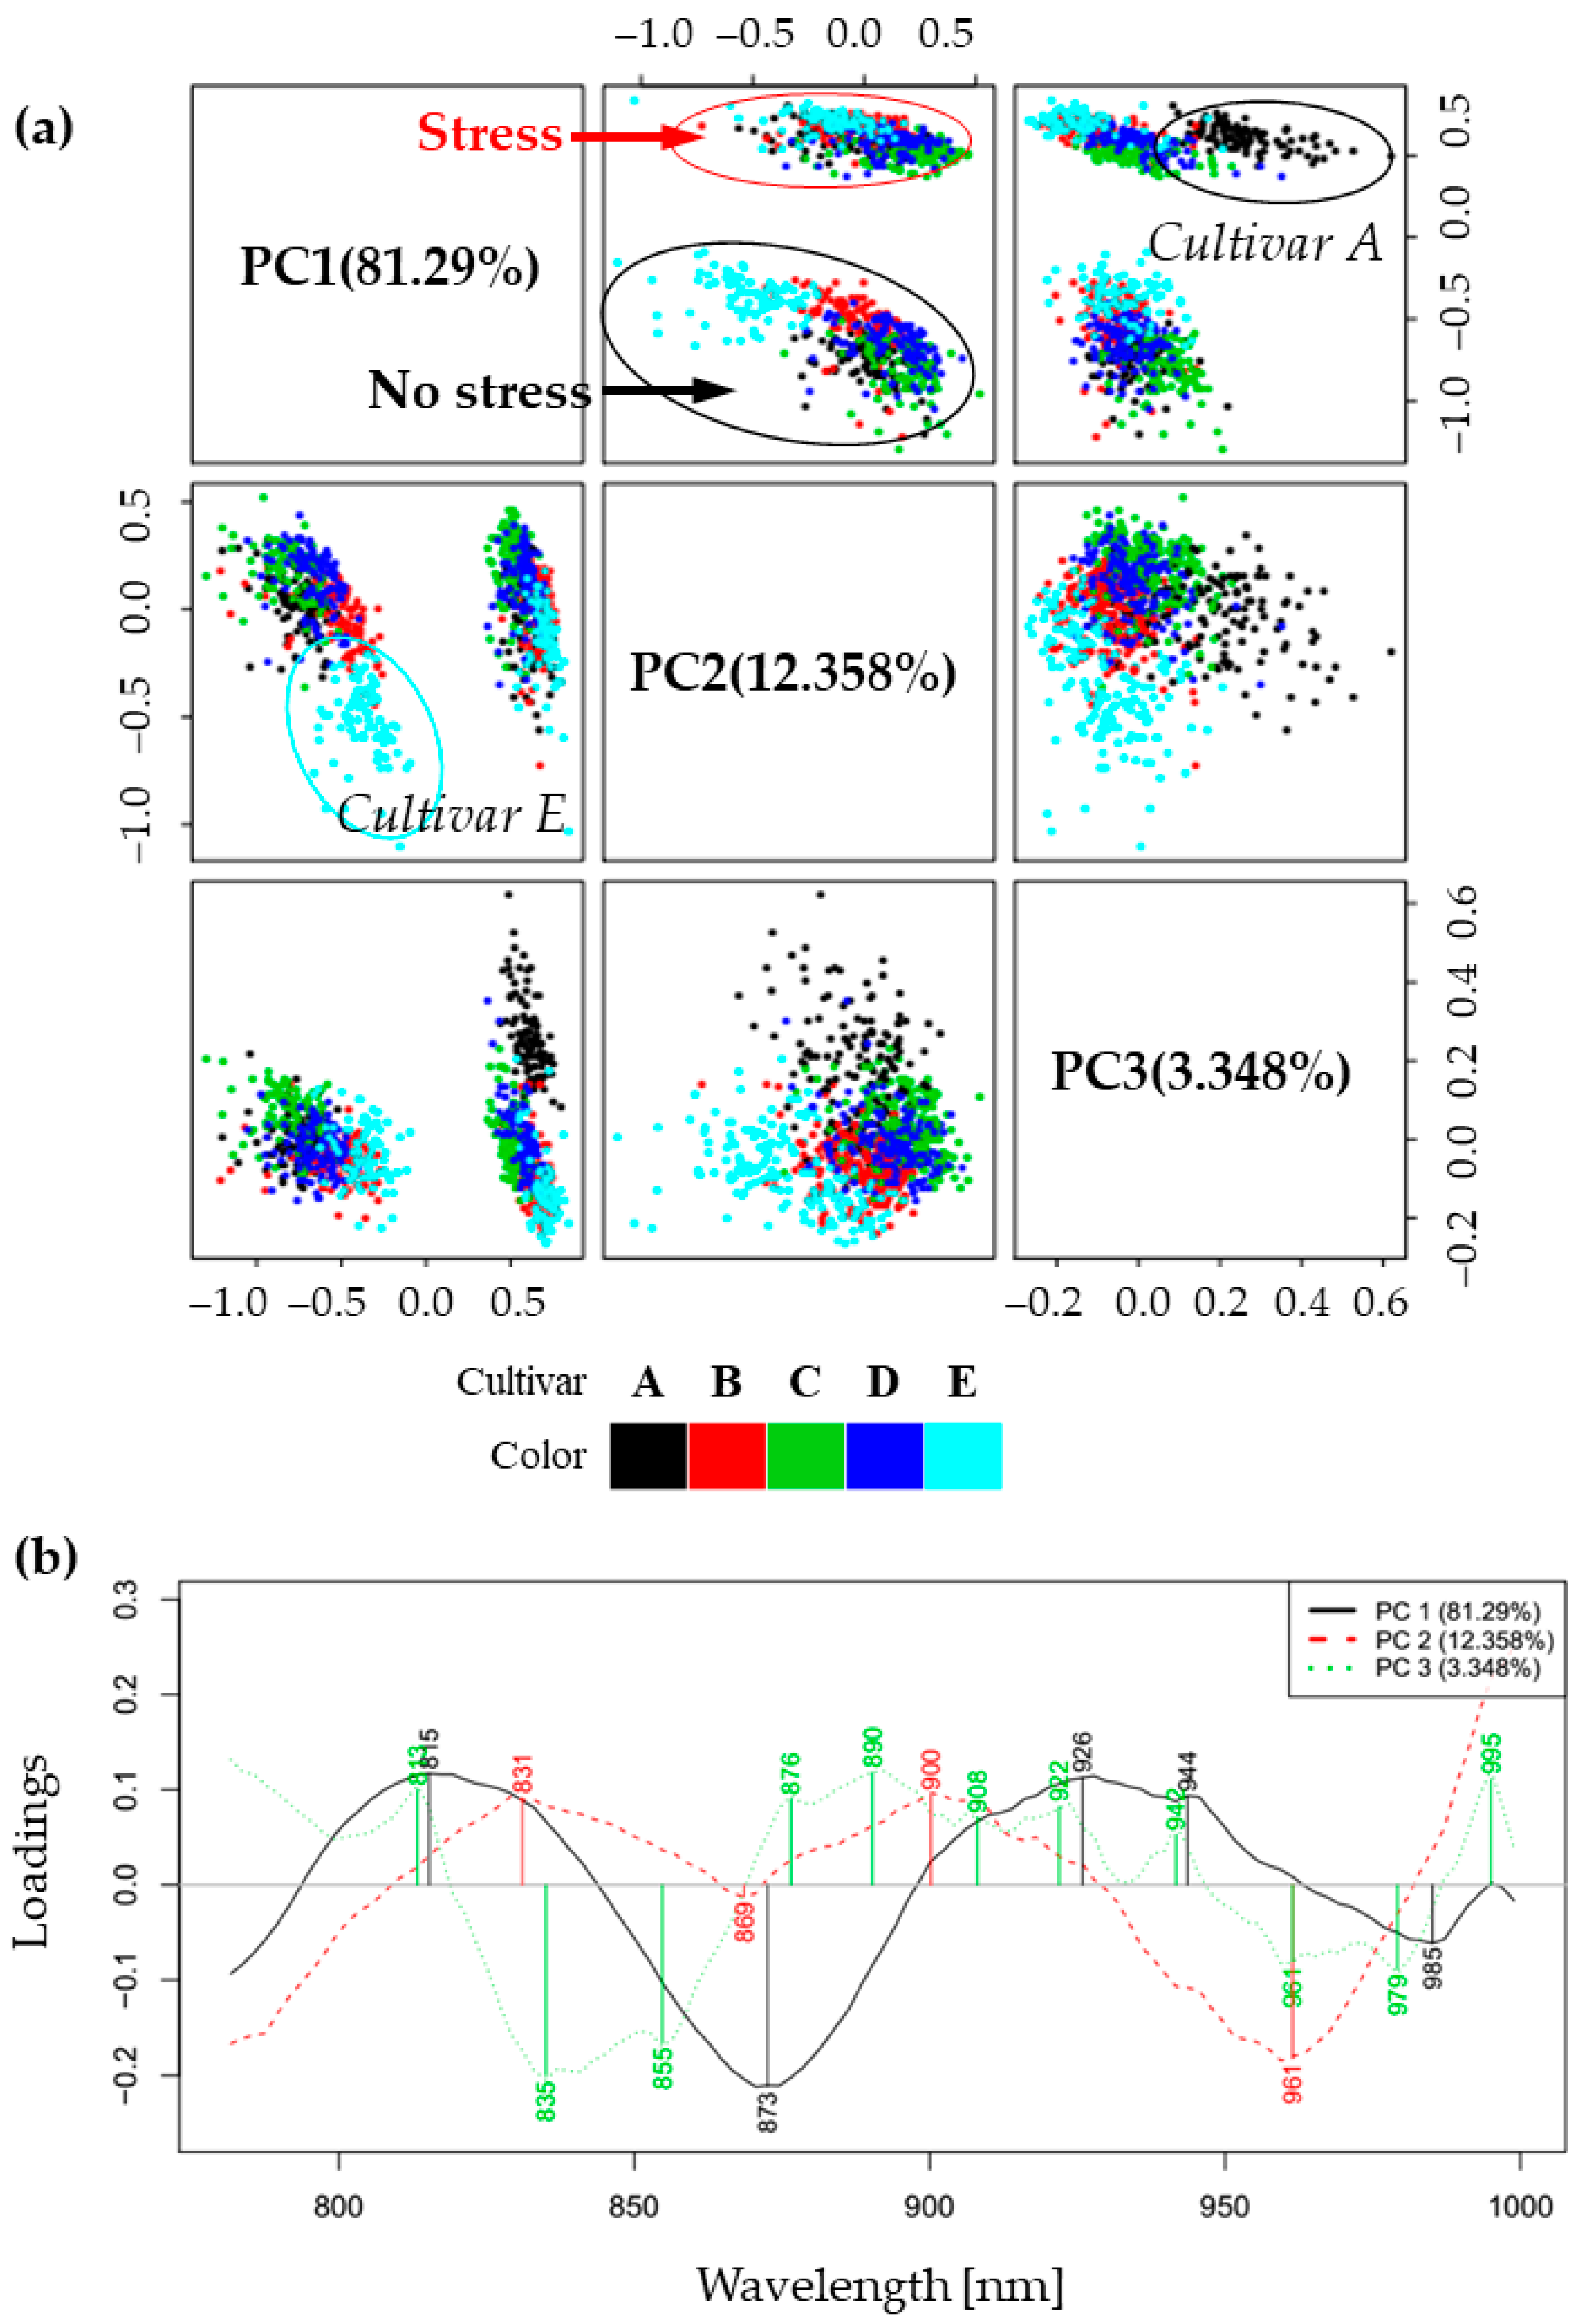
2.2. Principal Component Analysis (PCA)—Exploratory Analysis of Cold Stress Effects on Spectra of Soybean Cultivars’ Leaves
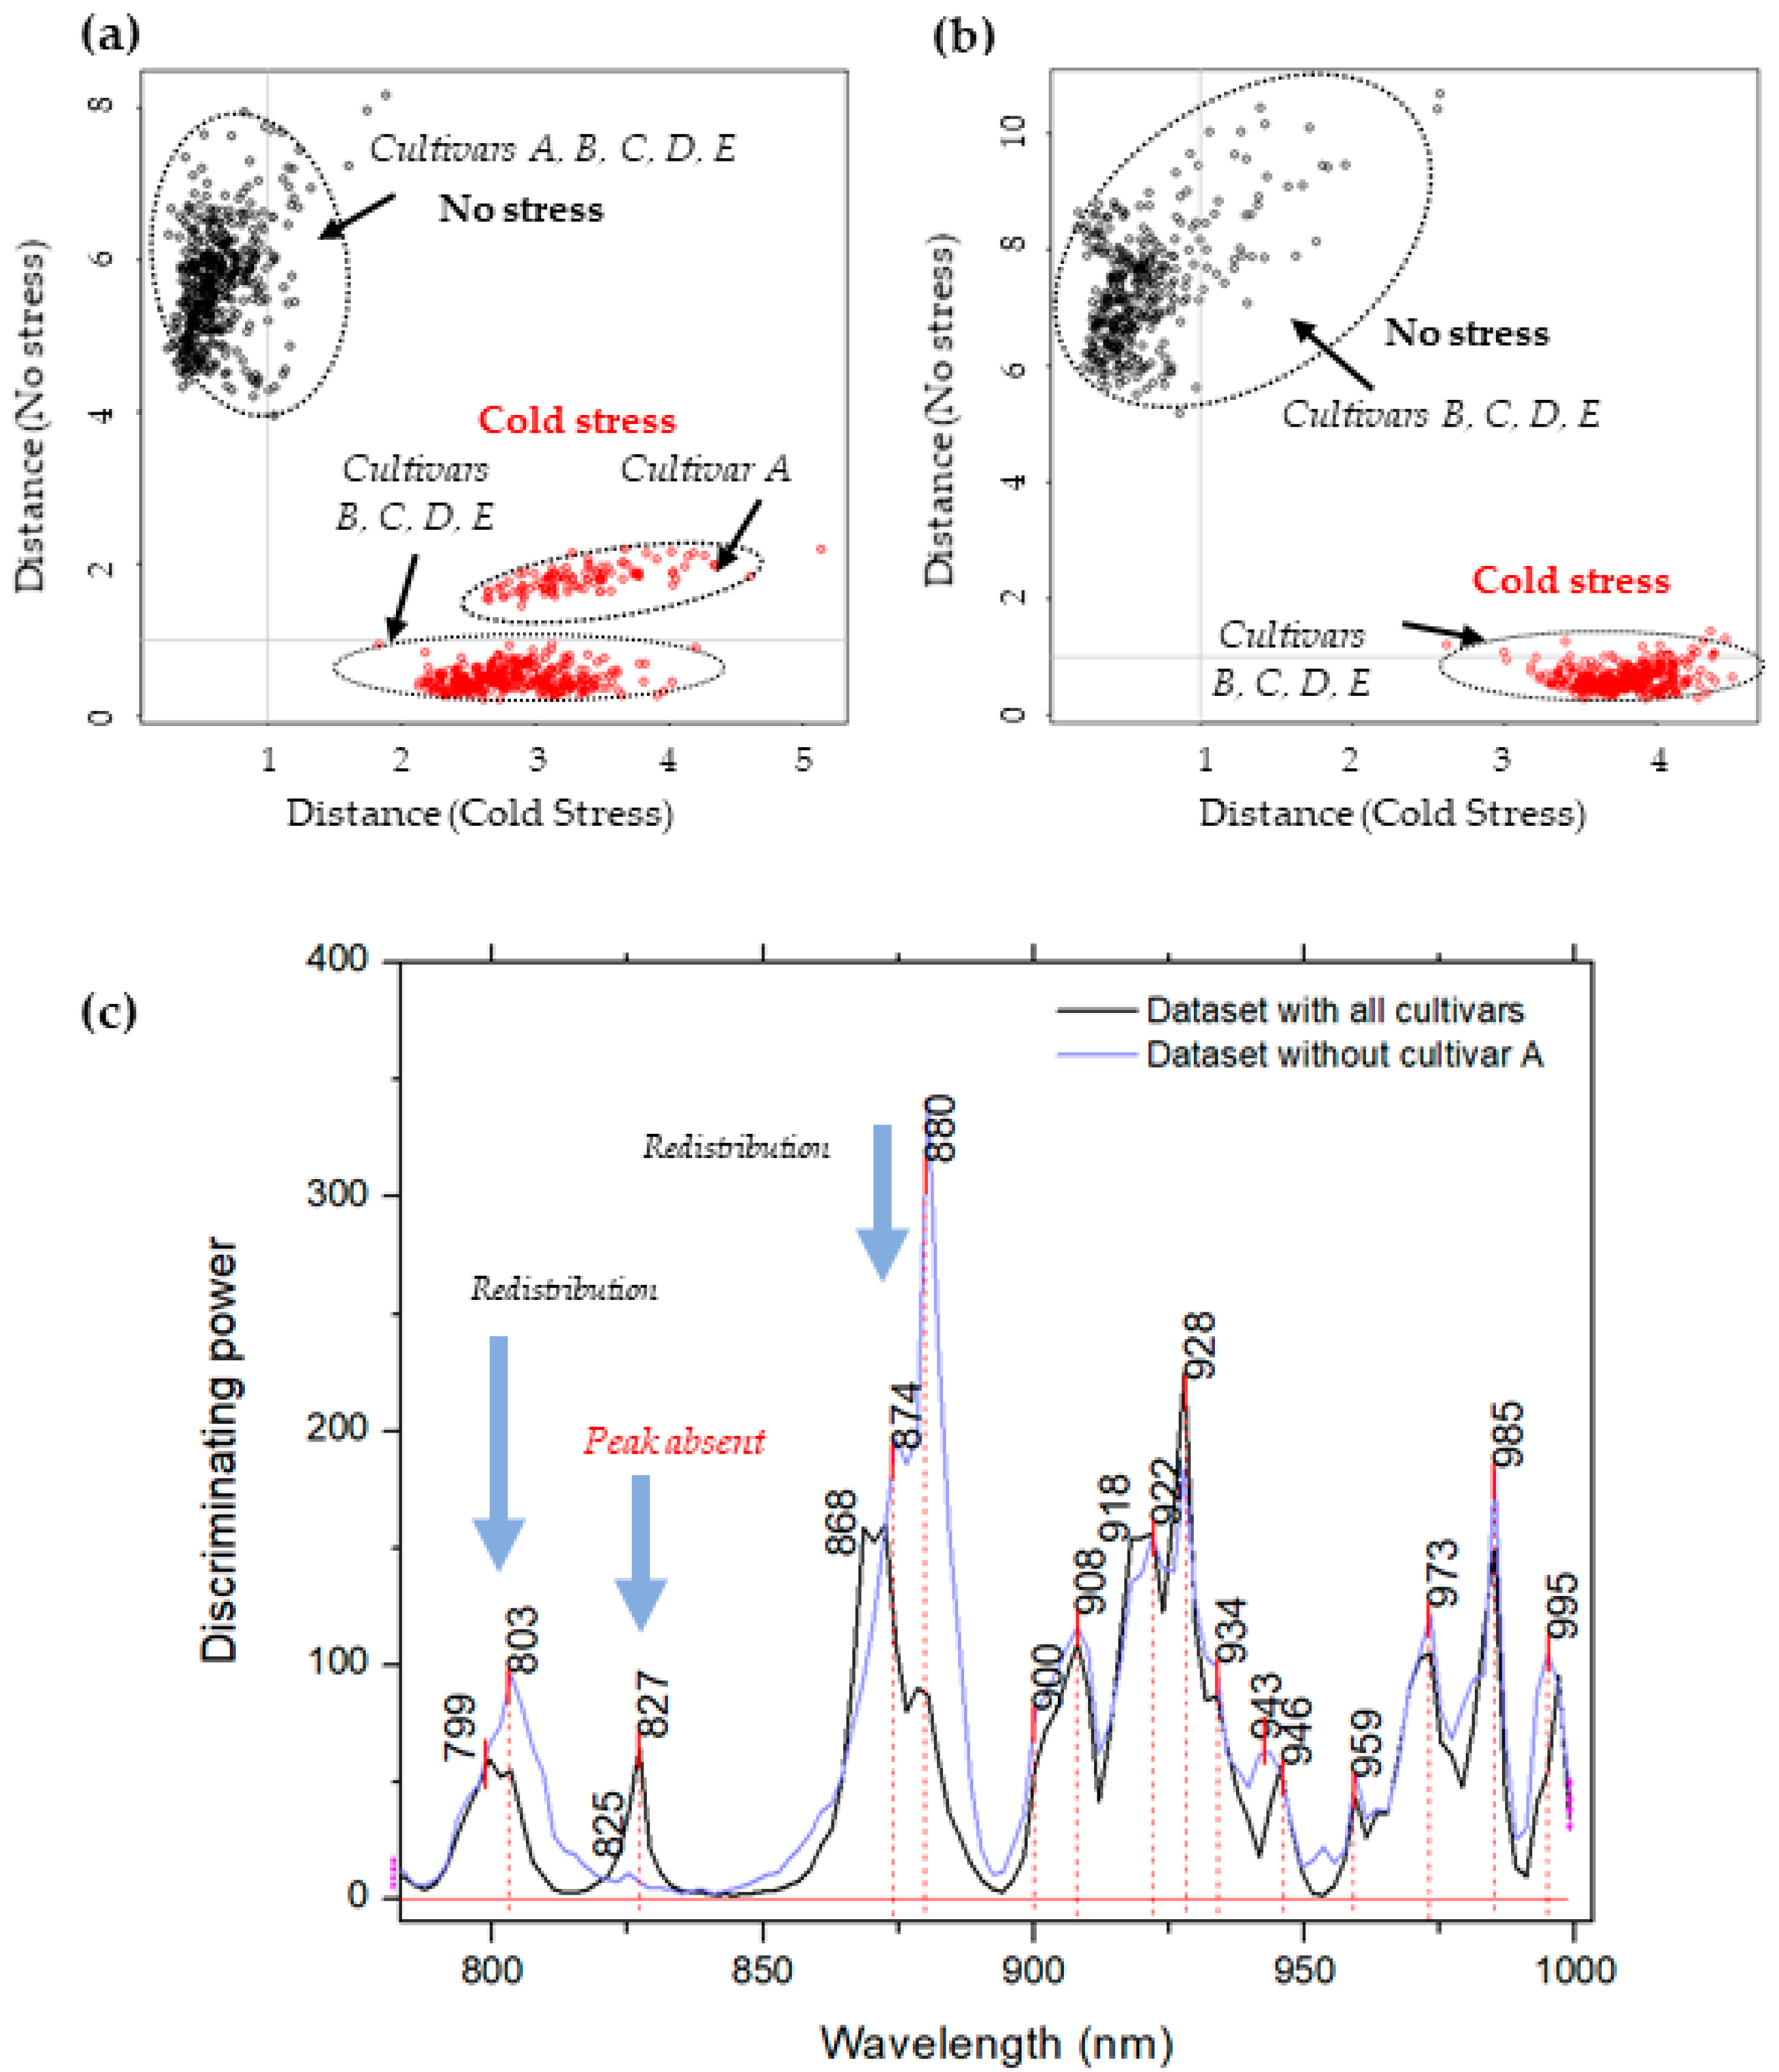
2.3. Soft Independent Modeling of Class Analogies for Detection of Plants’ Response to Cold Stress—Discrimination of Non-Stressed and Stressed Plants
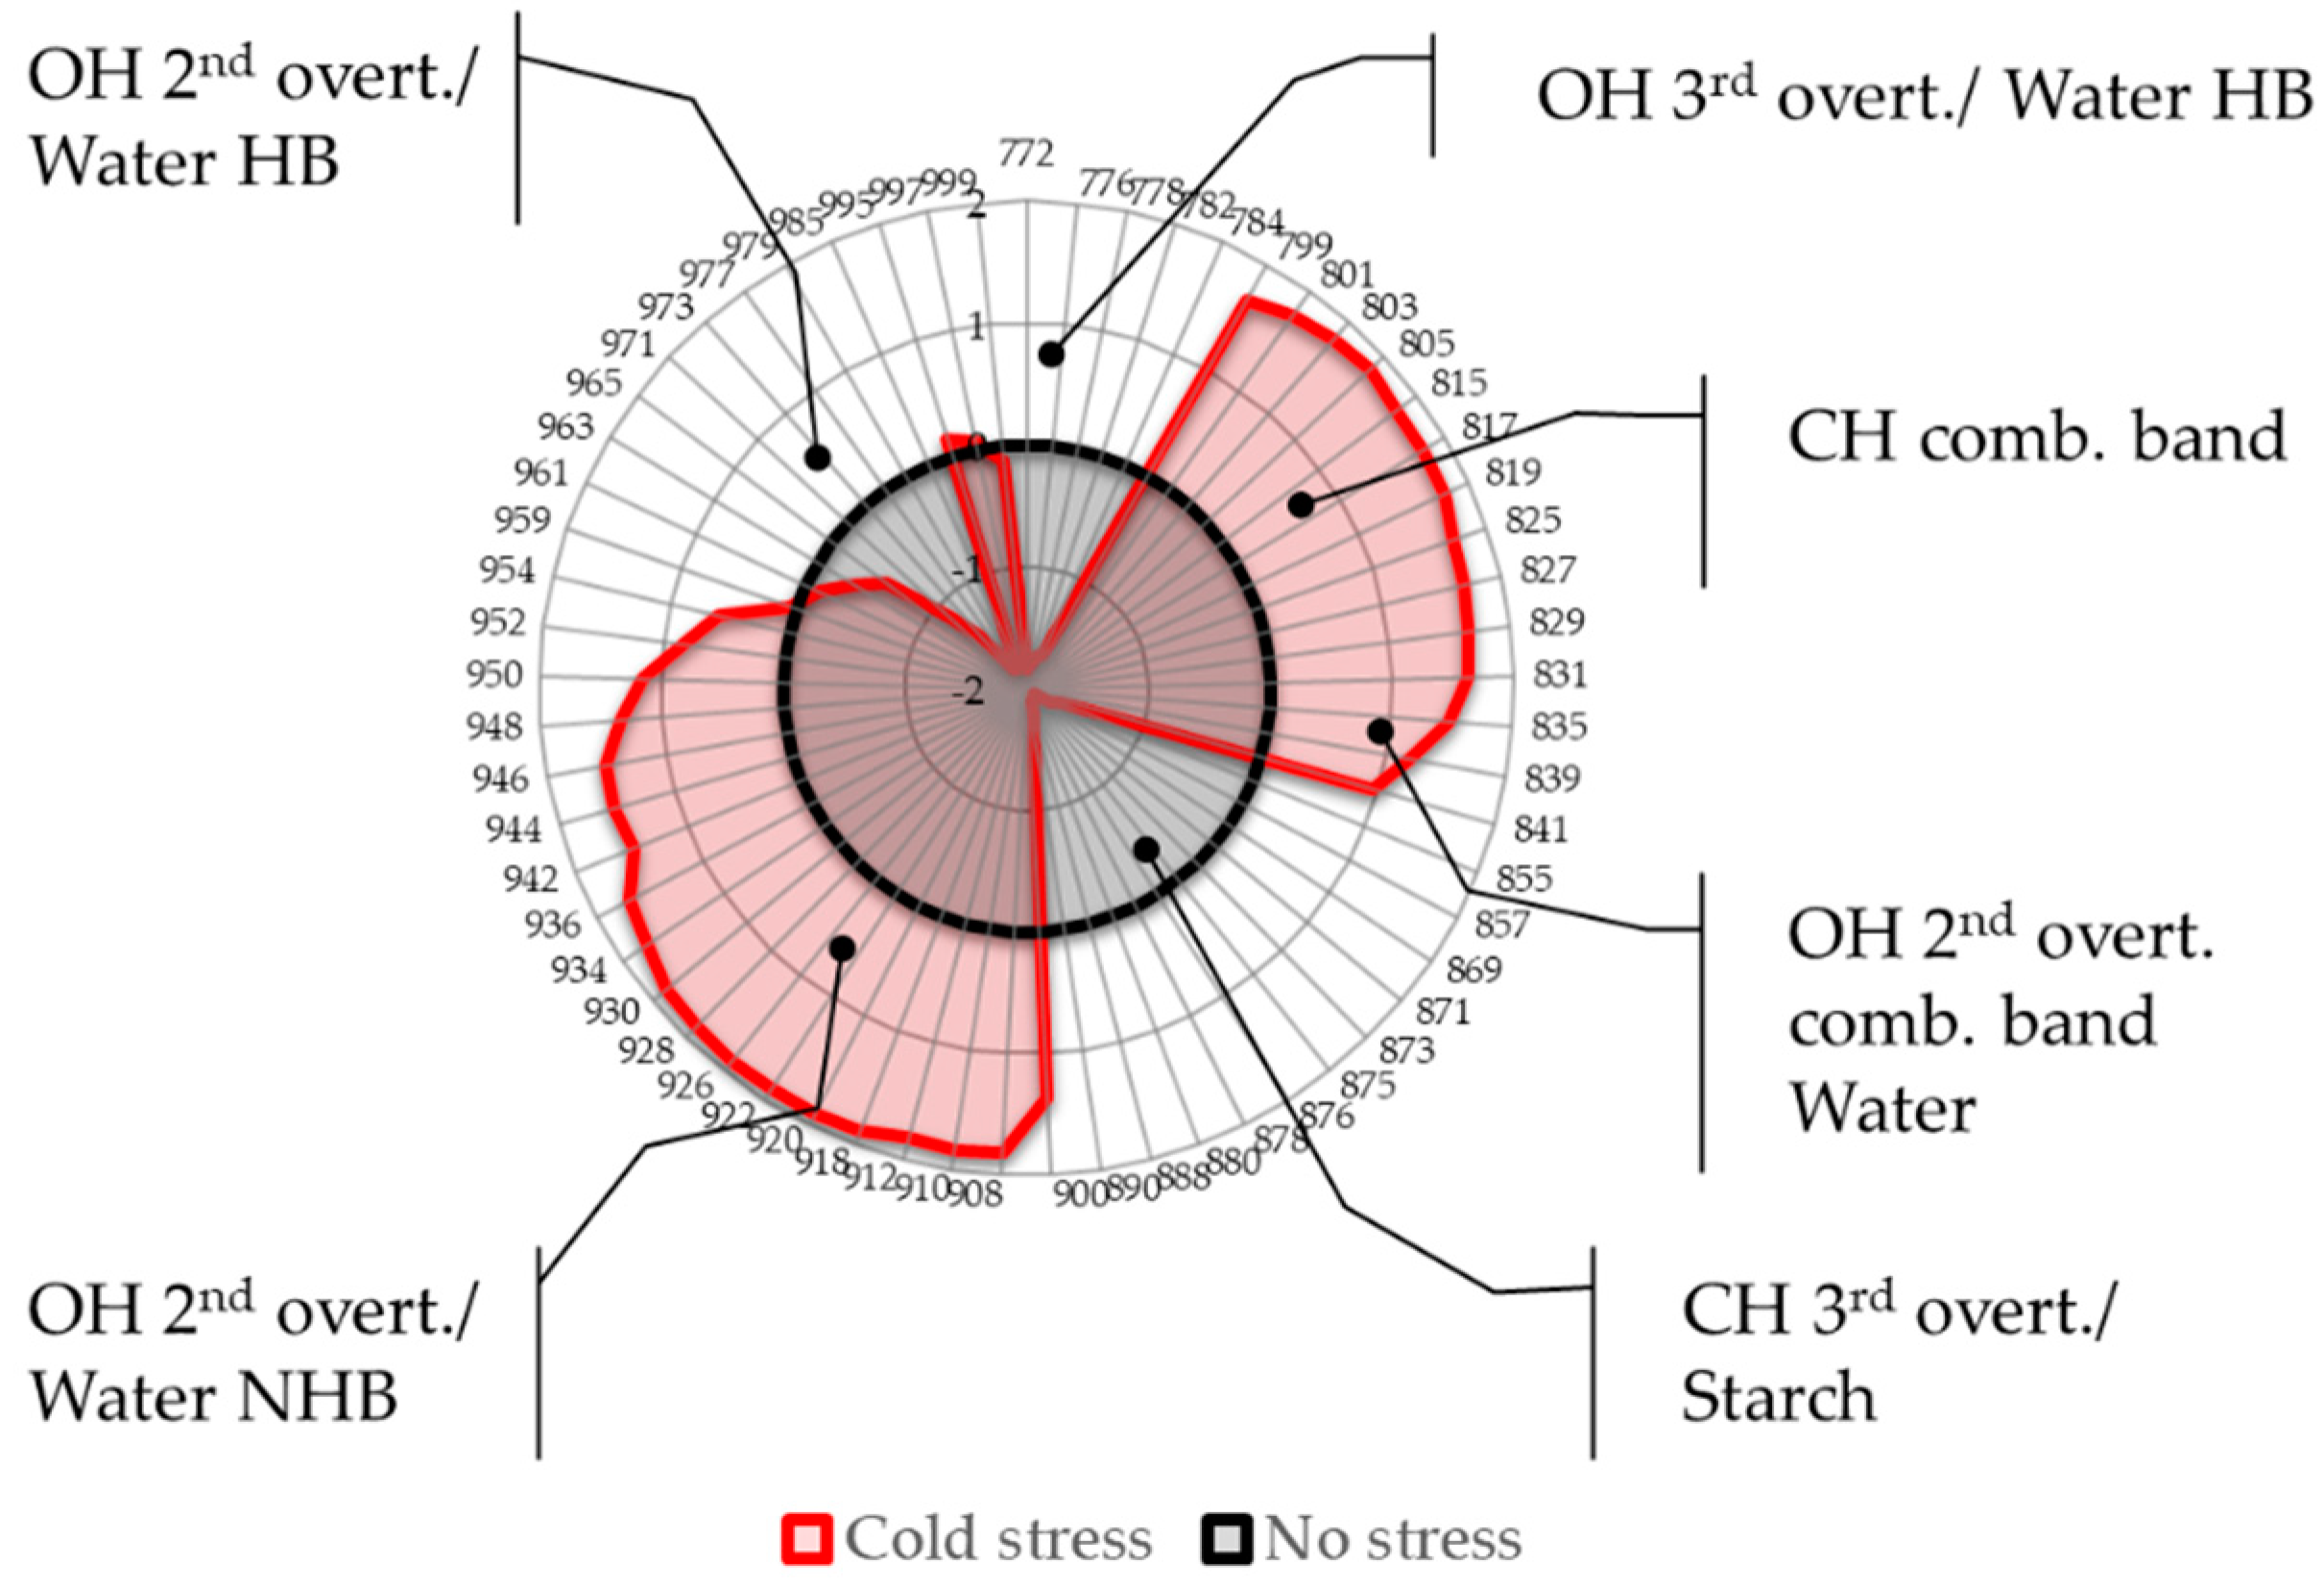
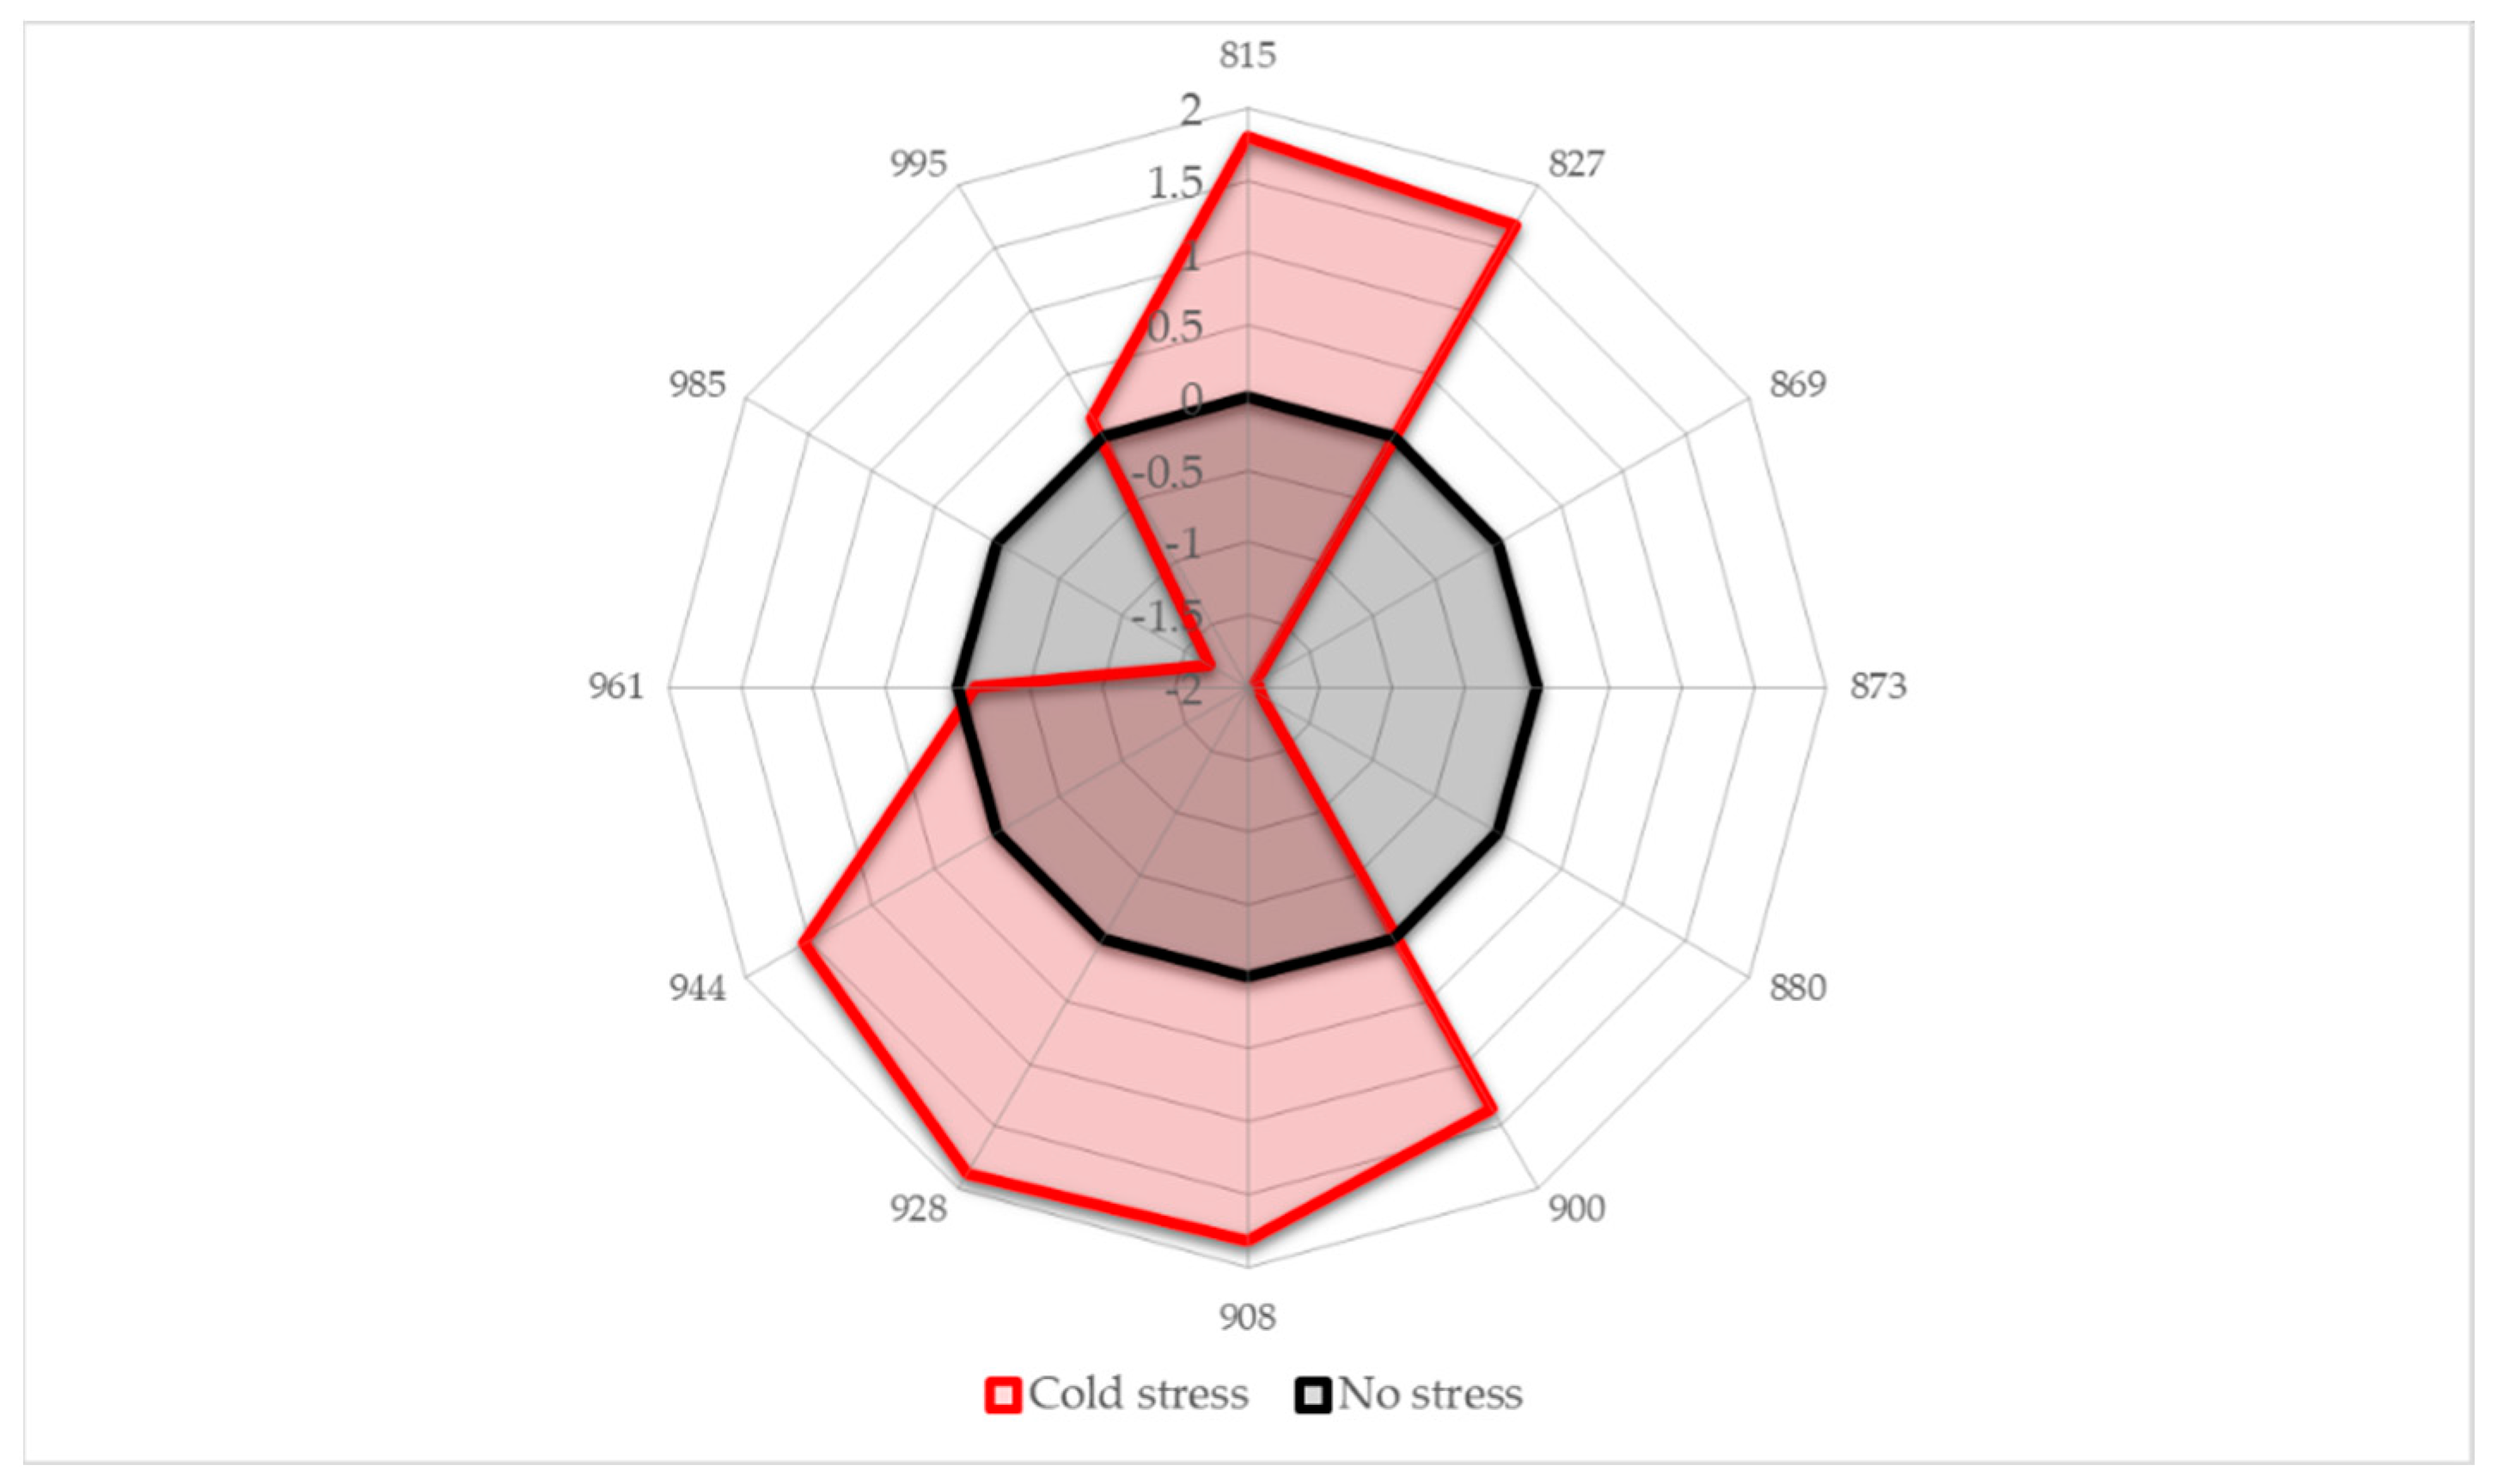
2.4. Aquagrams
- Region 800–830 nm: absorbance region that we tentatively assigned to CH of carbohydrates or hydrocarbons, not excluding their cumulative effect on the water molecular structure. The literature sources report the following absorbance bands and their interpretation in this range: 810 nm—related to oxidative metabolism in various cell types and cell proliferation [3,7,8,9,10,11], 815 nm—related to oxidation and the state of chloroplasts [61], 813 nm—absorbance band of aliphatic hydrocarbons [58,62], such as ethylene—a plant hormone with a role in the regulation of oxidative stress [63], shown to be produced during temperature stress in soybean leading to the oxidative injury [64]. The region also contains absorbance bands that may be attributed to water; specifically, 827–830 nm can be an absorbance band of small protonated clusters [46,51,59,65,66], while 814–816 nm a protein–water interaction (unpublished data) or carbohydrate–water interaction ([67], unpublished data). The temperature stress resulted in a marked increase in absorbance in this region.
- Region 830–840 nm: Absorbing region of both carbohydrates and water, with water being a stronger absorber [35]. Centered at 836 nm is the second overtone of the combination band of water [39]. According to numerous sources, the 835–841 nm can be attributed to water highly influenced by temperature [59,60,68,69,70,71]. Several absorbance bands of small proton hydrates are identified within this region: at 837 nm-(+H(H2O), +H(H2O)2), +H(H2O)4, +H(H2O)6 [46,51,59,65,66] and at 841–841.5 nm-(+H(H2O), +H(H2O)2), +H(H2O)4, (H+·(H2O)5) +H(H2O)6 [46,51,59,65,66]. The absorbance at wavelength 840 nm was found to be related to the sample pathlength [60].
- Region 841–900 nm: In this region both water and carbohydrates absorb, but at 870–890 nm is a strong absorbance region of carbohydrates [35,72], in particular the band 878 nm can be attributed to starch [72], major component of the leaves, and one of the key molecules mediating plant responses to abiotic stress, reported to decrease in response to abiotic stress independently of plant species [73]. The absorbance in this region shows a decrease in response to imposed temperature stress.
- Region 900–959 nm: second overtone of water, the region that can be attributed to various water molecular species that are not involved in hydrogen bonding, i.e., less hydrogen-bonded water. The literature sources show rich information on particular absorbance bands corresponding to the specific water molecular conformations, which can all be connected to their respective locations in the first overtone region (1350–1439 nm), encompassing C1 to C6 Water Matrix Coordinates—WAMACs, that is, water solvation shells, proton hydrates, water vapor, trapped water, free water molecules and the hydration band [26,74,75]. The aquagram shows increased absorbance in this region after temperature stress, which is consistent with our previous findings of biotic stress [28].
- Region 960–1000 nm: Second overtone of water, the region that can be attributed to various water molecular species that participate in hydrogen bonding, i.e., hydrogen-bonded water. Similar to the previous region, this one can be related to the WAMACs C7 to C11 in the first overtone of water, that is: water dimers, water solvation shells, physi-adsorbed water or bulk water, and water molecules with 2, 3 and 4 hydrogen bonds [26,74]. The aquagram shows decreased absorbance in this region after temperature stress (with the exception of a very small increase at 995 nm) in agreement with what was also observed in region 1, from the 3rd overtone of the same absorbance bands.
3. Discussion
4. Materials and Methods
4.1. Plant Materials
4.2. Experimental Protocol—Experimental Conditions for Cold Stress Investigation
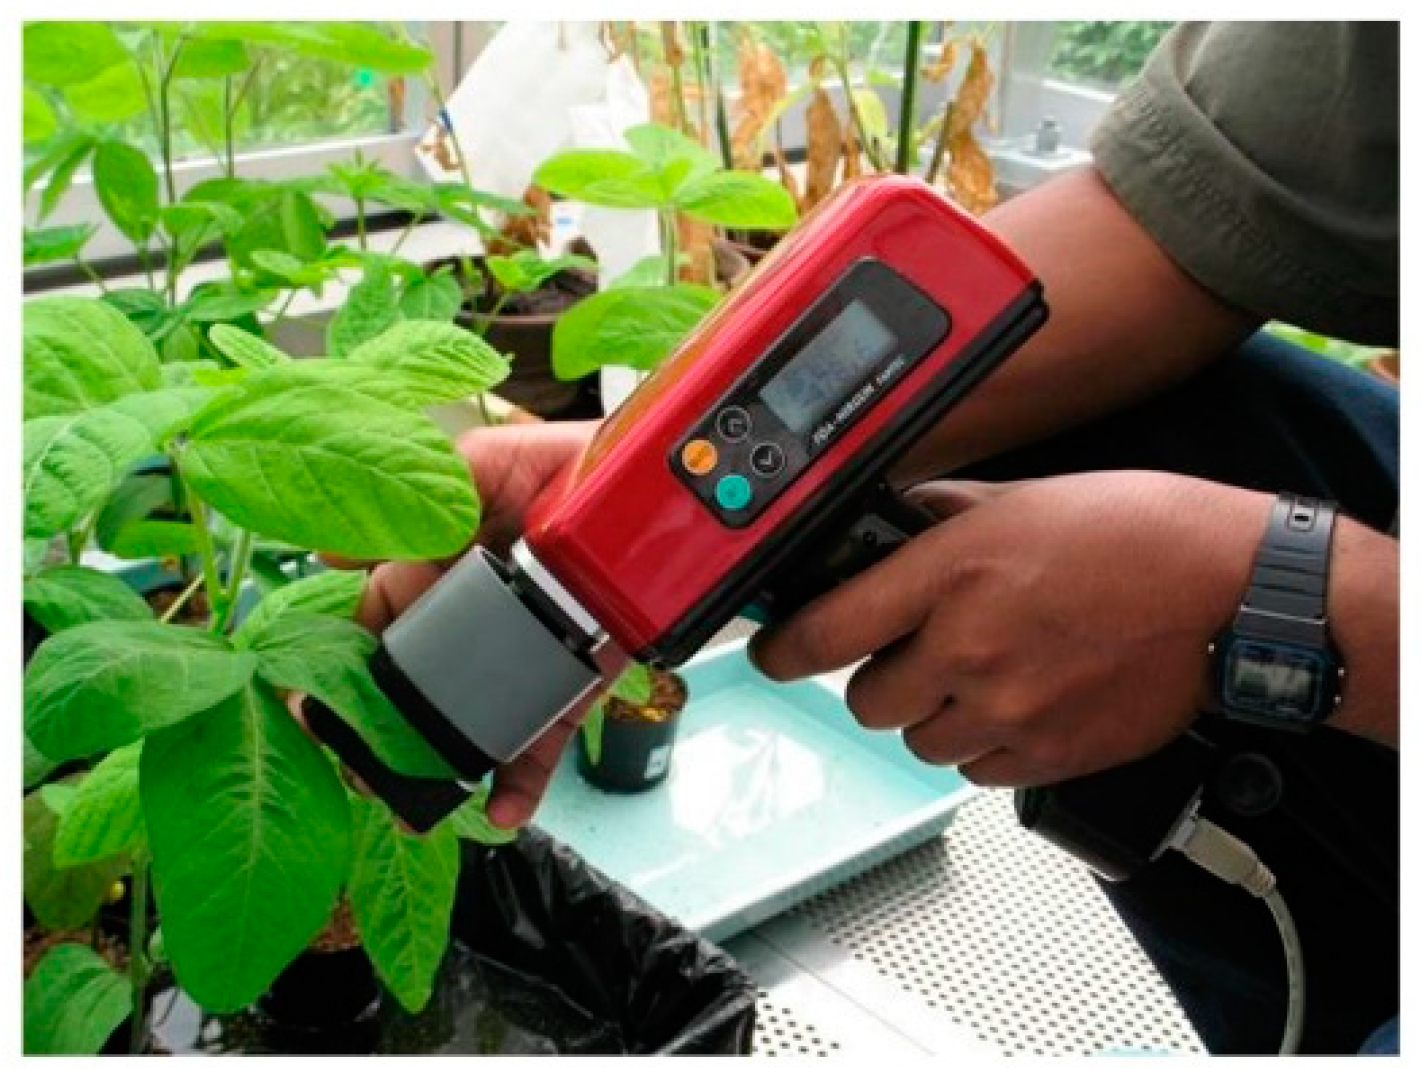
4.3. NIR Spectroscopy Measurements
4.4. Data Processing and Analysis
5. Conclusions
Author Contributions
Funding
Institutional Review Board Statement
Informed Consent Statement
Data Availability Statement
Acknowledgments
Conflicts of Interest
References
- Liu, K.S. Chemistry and nutritional value of soybean. In Soybean: Chemistry, Technology, and Utilization; Chapman & Hall: New York, NY, USA, 1997; p. 532. ISBN 9780834212992. [Google Scholar]
- Thao, N.P.; Tran, L.-S.P. Potentials toward genetic engineering of drought-tolerant soybean. Crit. Rev. Biotechnol. 2012, 32, 349–362. [Google Scholar] [CrossRef] [PubMed]
- Wu, Z.; Schenk-Hamlin, D.; Zhan, W.; Ragsdale, D.W.; Heimpel, G.E. The Soybean Aphid in China: A Historical Review. Ann. Entomol. Soc. Am. 2009, 97, 209–218. [Google Scholar] [CrossRef]
- Schor, A.; Fossati, A.; Soldat, A.; Stamp, P. Cold tolerance in soybean (Glycine max L. Merr.) in relation to flowering habit, pod set and compensation for lost reproductive organs. Eur. J. Agron. 1993, 2, 173–178. [Google Scholar] [CrossRef]
- Ohnishi, S.; Miyoshi, T.; Shirai, S. Low temperature stress at different flower developmental stages affects pollen development, pollination, and pod set in soybean. Environ. Exp. Bot. 2010, 69, 56–62. [Google Scholar] [CrossRef]
- Yamaguchi, N.; Ohnishi, S.; Miyoshi, T. Screening for Chilling-Tolerant Soybeans at the Flowering Stage Using a Seed Yield- and Maturity-Based Evaluation Method. Crop Sci. 2018, 58, 312. [Google Scholar] [CrossRef]
- Rys, M.; Szaleniec, M.; Skoczowski, A.; Stawoska, I.; Janeczko, A. FT-Raman spectroscopy as a tool in evaluation the response of plants to drought stress. Open Chem. 2015, 13, 1091–1100. [Google Scholar] [CrossRef]
- Cheesbrough, T.M. Decreased growth temperature increases soybean stearoyl-acyl carrier protein desaturase activity. Plant Physiol. 1990, 93, 555–559. [Google Scholar] [CrossRef] [Green Version]
- Nouri, M.-Z.; Toorchi, M.; Komatsu, S. Proteomics Approach for Identifying Abiotic Stress Responsive Proteins in Soybean. In Soybean-Molecular Aspects of Breeding; In Tech Open Limited: London, UK, 2011. [Google Scholar]
- Funatsuki, H.; Kawaguchi, K.; Matsuba, S.; Sato, Y.; Ishimoto, M. Mapping of QTL associated with chilling tolerance during reproductive growth in soybean. Theor. Appl. Genet. 2005, 111, 851–861. [Google Scholar] [CrossRef]
- Funatsuki, H.; Ohnishi, S. Recent Advances in Physiological and Genetic Studies on Chilling Tolerance in Soybean. Japan Agric. Res. Q. JARQ 2009, 43, 95–101. [Google Scholar] [CrossRef] [Green Version]
- Kurosaki, H.; Yumoto, S. Effects of Low Temperature and Shading during Flowering on the Yield Components in Soybeans. Plant Prod. Sci. 2003, 6, 17–23. [Google Scholar] [CrossRef]
- Sanghera, G.S.; Wani, S.H.; Hussain, W.; Singh, N.B. Engineering Cold Stress Tolerance in Crop Plants. Curr. Genomics 2011, 12, 30–43. [Google Scholar] [CrossRef] [PubMed] [Green Version]
- Rodziewicz, P.; Swarcewicz, B.; Chmielewska, K.; Wojakowska, A.; Stobiecki, M. Influence of abiotic stresses on plant proteome and metabolome changes. Acta Physiol. Plant. 2014, 36, 1–19. [Google Scholar] [CrossRef] [Green Version]
- Balestrasse, K.B.; Tomaro, M.L.; Batlle, A.; Noriega, G.O. The role of 5-aminolevulinic acid in the response to cold stress in soybean plants. Phytochemistry 2010, 71, 2038–2045. [Google Scholar] [CrossRef] [PubMed]
- Xing, W.; Rajashekar, C. Glycine betaine involvement in freezing tolerance and water stress in Arabidopsis thaliana. Environ. Exp. Bot. 2001, 46, 21–28. [Google Scholar] [CrossRef]
- Miura, K.; Tada, Y. Regulation of water, salinity, and cold stress responses by salicylic acid. Front. Plant Sci. 2014, 5, 4. [Google Scholar] [CrossRef] [Green Version]
- Chinnusamy, V.; Zhu, J.; Zhu, J.-K. Cold stress regulation of gene expression in plants. Trends Plant Sci. 2007, 12, 444–451. [Google Scholar] [CrossRef]
- Lee, T.-M.; Lur, H.-S.; Chu, C. Role of abscisic acid in chilling tolerance of rice (Oryza sativa L.) seedlings. Plant Sci. 1997, 126, 1–10. [Google Scholar] [CrossRef]
- Bhandari, K.; Nayyar, H. Low Temperature Stress in Plants: An Overview of Roles of Cryoprotectants in Defense. In Physiological Mechanisms and Adaptation Strategies in Plants Under Changing Environment; Springer: New York, NY, USA, 2014; pp. 193–265. [Google Scholar]
- Abdel Latef, A.A.H.; Chaoxing, H. Arbuscular mycorrhizal influence on growth, photosynthetic pigments, osmotic adjustment and oxidative stress in tomato plants subjected to low temperature stress. Acta Physiol. Plant. 2011, 33, 1217–1225. [Google Scholar] [CrossRef]
- Sakudo, A.; Suganuma, Y.; Kobayashi, T.; Onodera, T.; Ikuta, K. Near-infrared spectroscopy: Promising diagnostic tool for viral infections. Biochem. Biophys. Res. Commun. 2006, 341, 279–284. [Google Scholar] [CrossRef]
- van der Meer, F.; De Jong, S.; Bakker, W. Imaging Spectrometry: Basic Analytical Techniques. In Imaging Spectrometry: Basic Principles and Prospective Applications (Remote Sensing and Digital Image Processing, 4); Kluwer Academic: Dordrecht, The Netherlands, 2002; pp. 17–62. [Google Scholar]
- Jinendra, B. Near Infrared Spectroscopy and Aquaphotomics: Novel Tool for Biotic and Abiotic Stress Diagnosis of Soybean. Ph.D. Thesis, Kobe University, Kobe, Japan, 2011. [Google Scholar]
- Lee, H.; Kim, M.S.; Song, Y.-R.; Oh, C.-S.; Lim, H.-S.; Lee, W.-H.; Kang, J.-S.; Cho, B.-K. Non-destructive evaluation of bacteria-infected watermelon seeds using visible/near-infrared hyperspectral imaging. J. Sci. Food Agric. 2017, 97, 1084–1092. [Google Scholar] [CrossRef]
- Tsenkova, R. Aquaphotomics: Dynamic spectroscopy of aqueous and biological systems describes peculiarities of water. J. Near Infrared Spectrosc. 2009, 17, 303–313. [Google Scholar] [CrossRef]
- Muncan, J.; Tsenkova, R. Aquaphotomics-From Innovative Knowledge to Integrative Platform in Science and Technology. Molecules 2019, 24, 2742. [Google Scholar] [CrossRef] [PubMed] [Green Version]
- Jinendra, B.; Tamaki, K.; Kuroki, S.; Vassileva, M.; Yoshida, S.; Tsenkova, R. Near infrared spectroscopy and aquaphotomics: Novel approach for rapid in vivo diagnosis of virus infected soybean. Biochem. Biophys. Res. Commun. 2010, 397, 685–690. [Google Scholar] [CrossRef] [PubMed]
- Beck, E.H.; Fettig, S.; Knake, C.; Hartig, K.; Bhattarai, T. Specific and unspecific responses of plants to cold and drought stress. J. Biosci. 2007, 32, 501–510. [Google Scholar] [CrossRef] [PubMed]
- Levitt, J. Responses of Plants to Environmental Stress, Volume 1: Chilling, Freezing, and High Temperature Stresses; Academic Press: New York, NY, USA, 1980. [Google Scholar]
- Kuroki, S.; Tsenkova, R.; Moyankova, D.P.; Muncan, J.; Morita, H.; Atanassova, S.; Djilianov, D. Water molecular structure underpins extreme desiccation tolerance of the resurrection plant Haberlea rhodopensis. Sci. Rep. 2019, 9, 3049. [Google Scholar] [CrossRef] [PubMed] [Green Version]
- Olascoaga, B. Leaf Optical Properties and Dynamics of Photosynthetic Activity. Ph.D. Thesis, Faculty of Agriculture and Forestry of the University of Helsinki, Helsinki, Finland, 2018. [Google Scholar]
- Sims, D.A.; Gamon, J.A. Relationships between leaf pigment content and spectral reflectance across a wide range of species, leaf structures and developmental stages. Remote Sens. Environ. 2002, 81, 337–354. [Google Scholar] [CrossRef]
- Kaspary, T.E.; Lamego, F.P.; Cutti, L.; Aguiar, A.C.M.; Bellé, C. Determination of photosynthetic pigments in fleabane biotypes susceptible and resistant to the Herbicide Glyphosate. Planta Daninha 2014, 32, 417–426. [Google Scholar] [CrossRef] [Green Version]
- McGlone, V.A.; Kawano, S. Firmness, dry-matter and soluble-solids assessment of postharvest kiwifruit by NIR spectroscopy. Postharvest Biol. Technol. 1998, 13, 131–141. [Google Scholar] [CrossRef]
- Golic, M.; Walsh, K.; Lawson, P. Short-wavelength near-infrared spectra of sucrose, glucose, and fructose with respect to sugar concentration and temperature. Appl. Spectrosc. 2003, 57, 139–145. [Google Scholar] [CrossRef]
- Abe, H.; Kusama, T.; Kawano, S.; Iwamoto, M. Analysis of hydrogen bond state of water by band decomposition of near infrared absorption spectrum. Bunko Kenkyu 1995, 44, 247–253. [Google Scholar] [CrossRef] [Green Version]
- Osborne, B.; Fearn, T.; Hindle, P. Practical NIR Spectroscopy with Applications in Food and Beverage Analysis-UCL Discovery, 2nd ed.; Longman Scientific and Technical: Essex, UK, 1993. [Google Scholar]
- Chaplin, M. Water Structure and Science. Available online: http://www1.lsbu.ac.uk/water/water_vibrational_spectrum.html (accessed on 29 January 2019).
- Hossain, M.M.; Liu, X.; Qi, X.; Lam, H.-M.; Zhang, J. Differences between soybean genotypes in physiological response to sequential soil drying and rewetting. Crop J. 2014, 2, 366–380. [Google Scholar] [CrossRef] [Green Version]
- Büning-Pfaue, H. Analysis of water in food by near infrared spectroscopy. Food Chem. 2003, 82, 107–115. [Google Scholar] [CrossRef]
- Afzal, A.; Duiker, S.W.; Watson, J.E. Leaf thickness to predict plant water status. Biosyst. Eng. 2017, 156, 148–156. [Google Scholar] [CrossRef] [Green Version]
- Yildiztugay, E.; Ozfidan-Konakci, C.; Kucukoduk, M. Improvement of cold stress resistance via free radical scavenging ability and promoted water status and photosynthetic capacity of gallic acid in soybean leaves. J. Soil Sci. Plant Nutr. 2017, 17, 366–384. [Google Scholar] [CrossRef] [Green Version]
- Peñuelas, J.; Filella, I. Visible and near-infrared reflectance techniques for diagnosing plant physiological status. Trends Plant Sci. 1998, 3, 151–156. [Google Scholar] [CrossRef]
- Kumar, L.; Schmidt, K.; Dury, S.; Skidmore, A. Imaging spectroscopy and vegetation science. In Imaging Spectrometry: Basic Principles and Prospective Applications; Van der Meer, S.M., De Jong, S.M., Eds.; Kluwer Academic: Dordrecht, The Netherlands, 2001; pp. 111–155. [Google Scholar]
- Headrick, J.M.; Diken, E.G.; Walters, R.S.; Hammer, N.I.; Christie, R.A.; Cui, J.; Myshakin, E.M.; Duncan, M.A.; Johnson, M.A.; Jordan, K.D. Spectral signatures of hydrated proton vibrations in water clusters. Science 2005, 308, 1765–1769. [Google Scholar] [CrossRef]
- Shin, J.-W.W.; Hammer, N.I.; Diken, E.G.; Johnson, M.A.; Walters, R.S.; Jaeger, T.D.; Duncan, M.A.; Christie, R.A.; Jordan, K.D. Infrared signature of structures associated with the H+(H 2O)n (n = 6 to 27) clusters. Science 2004, 304, 1137–1140. [Google Scholar] [CrossRef] [Green Version]
- Robertson, W.H.; Diken, E.G.; Price, E.A.; Shin, J.-W.; Johnson, M.A. Spectroscopic determination of the OH− solvation shell in the OH−·(H2O)n clusters. Science 2003, 299, 1367–1372. [Google Scholar] [CrossRef]
- Suzuki, T. Hydrogen-bond studies of thin film water using near-infrared spectroscopy in the 970 nm spectral region. Appl. Surf. Sci. 2002, 187, 261–265. [Google Scholar] [CrossRef]
- Ozaki, Y. Applications in Chemistry. In Near-Infrared Spectroscopy. Principles, Instruments, Applications; Siesler, H.W., Ozaki, Y., Kawata, S., Heise, H., Eds.; Wiley-VCH Verlag GmbH: Weinheim, Germany, 2002; pp. 179–213. ISBN 3527301658. [Google Scholar]
- Mizuse, K.; Fujii, A. Tuning of the Internal Energy and Isomer Distribution in Small Protonated Water Clusters H+(H2O)4–8: An Application of the Inert Gas Messenger Technique. J. Phys. Chem. A 2012, 116, 4868–4877. [Google Scholar] [CrossRef]
- Zuzak, K.J.; Naik, S.C.; Alexandrakis, G.; Hawkins, D.; Behbehani, K.; Livingston, E. Intraoperative bile duct visualization using near-infrared hyperspectral video imaging. Am. J. Surg. 2008, 195, 491–497. [Google Scholar] [CrossRef]
- Wilson, R.H.; Nadeau, K.P.; Jaworski, F.B.; Tromberg, B.J.; Durkin, A.J. Review of short-wave infrared spectroscopy and imaging methods for biological tissue characterization. J. Biomed. Opt. 2015, 20, 030901. [Google Scholar] [CrossRef]
- Kukreti, S.; Cerussi, A.E.; Tromberg, B.J.; Gratton, E. Intrinsic tumor biomarkers revealed by novel double-differential spectroscopic analysis of near-infrared spectra. J. Biomed. Opt. 2007, 12, 020509. [Google Scholar] [CrossRef]
- Zuzak, K.J.; Naik, S.C.; Alexandrakis, G.; Hawkins, D.; Behbehani, K.; Livingston, E.H. Characterization of a Near-Infrared Laparoscopic Hyperspectral Imaging System for Minimally Invasive Surgery. Anal. Chem. 2007, 79, 4709–4715. [Google Scholar] [CrossRef]
- Blomquist, G.; Johansson, E.; Söderström, B.; Wold, S. Data analysis of pyrolysis—Chromatograms by means of simca pattern recognition. J. Anal. Appl. Pyrolysis 1979, 1, 53–65. [Google Scholar] [CrossRef]
- Brereton, R.G. Multivariate Pattern Recognition in Chemometrics: Illustrated by Case Studies; Elsevier Science Publishers: Amsterdam, The Netherlands, 1992; ISBN 9780080868363. [Google Scholar]
- Workman, J.J.; Weyer, L. Practical Guide and Spectral Atlas for Interpretive Near-Infrared Spectroscopy, 2nd ed.; CRC Press Taylor & Francis Group: Boca Raton, FL, USA, 2012; ISBN 978-1-4398-7526-1. [Google Scholar]
- Kovacs, Z.; Muncan, J.; Ohmido, N.; Bazar, G.; Tsenkova, R. Water Spectral Patterns Reveals Similarities and Differences in Rice Germination and Induced Degenerated Callus Development. Plants 2021, 10, 1832. [Google Scholar] [CrossRef]
- Miyamoto, K.; Kitano, Y. Non-Destructive Determination of Sugar Content in Satsuma Mandarin Fruit by near Infrared Transmittance Spectroscopy. J. Near Infrared Spectrosc. 1995, 3, 227–237. [Google Scholar] [CrossRef]
- Klughammer, C.; Schreiber, U. Analysis of Light-Induced Absorbance Changes in the Near-Infrared Spectral Region I. Characterization of Various Components in Isolated Chloroplasts. Z. Naturforsch. C J. Biosci. 1991, 46, 233–244. [Google Scholar] [CrossRef]
- Williams, P.; Antoniszyn, J.; Manley, M. Near Infrared Technology: Getting the Best out of Light; AFRICAN SUN MeDIA: Stellenbosch, South Africa, 2019; ISBN 978-1-928480-30-3. [Google Scholar]
- Ishibashi, Y.; Koda, Y.; Zheng, S.H.; Yuasa, T.; Iwaya-Inoue, M. Regulation of soybean seed germination through ethylene production in response to reactive oxygen species. Ann. Bot. 2013, 111, 95–102. [Google Scholar] [CrossRef] [Green Version]
- Djanaguiraman, M.; Prasad, P.V.V.; Al-Khatib, K. Ethylene perception inhibitor 1-MCP decreases oxidative damage of leaves through enhanced antioxidant defense mechanisms in soybean plants grown under high temperature stress. Environ. Exp. Bot. 2011, 71, 215–223. [Google Scholar] [CrossRef]
- Ojamäe, L.; Shavitt, I.; Singer, S.J. Potential energy surfaces and vibrational spectra of H5O2+ and larger hydrated proton complexes. Int. J. Quantum Chem. 1995, 56, 657–668. [Google Scholar] [CrossRef]
- Rhine, P.; Williams, D.; Hale, M.; Querry, M.R. Infrared Optical Constants of Aqueous Solutions of Electrolytes. Acids and Bases. J. Phys. Chem. 1974, 78, 1405–1410. [Google Scholar] [CrossRef]
- Tsenkova, R.; Muncan, J. Aquaphotomics for Bio-diagnostics in Dairy-Applications of Near-Infrared Spectroscopy; Springer Nature Singapore Pte Ltd.: Singapore, 2021; ISBN 978-981-16-7113-5. [Google Scholar]
- Chauchard, F.; Roger, J.M.; Bellon-Maurel, V. Correction of the Temperature Effect on near Infrared Calibration—Application to Soluble Solid Content Prediction. J. Near Infrared Spectrosc. 2004, 12, 199–205. [Google Scholar] [CrossRef]
- Kawano, S.; Abe, H.; Iwamoto, M. Development of a Calibration Equation with Temperature Compensation for Determining the Brix Value in Intact Peaches. J. Near Infrared Spectrosc. 1995, 3, 211–218. [Google Scholar] [CrossRef]
- Langford, V.S.; McKinley, A.J.; Quickenden, T.I. Temperature dependence of the visible-near-infrared absorption spectrum of liquid water. J. Phys. Chem. A 2001, 105, 8916–8921. [Google Scholar] [CrossRef]
- Bell, J.T.; Krohn, N.A. The near-infrared spectra of water and heavy water at temperatures between 25 and 39. deg. J. Phys. Chem. 1970, 74, 4006. [Google Scholar] [CrossRef]
- Williams, P.; Norris, K.H. Near Infrared Technology in the Agricultural and Food Industries; American Association of Cereal Chemists: St Paul, MN, USA, 1987. [Google Scholar]
- Thalmann, M.; Santelia, D. Starch as a determinant of plant fitness under abiotic stress. New Phytol. 2017, 214, 943–951. [Google Scholar] [CrossRef] [Green Version]
- Malegori, C.; Muncan, J.; Mustorgi, E.; Tsenkova, R.; Oliveri, P. Analysing the water spectral pattern by near-infrared spectroscopy and chemometrics as a dynamic multidimensional biomarker in preservation: Rice germ storage monitoring. Spectrochim. Acta Part A Mol. Biomol. Spectrosc. 2022, 265, 120396. [Google Scholar] [CrossRef]
- Kojić, D.; Tsenkova, R.; Tomobe, K.; Yasuoka, K.; Yasui, M. Water confined in the local field of ions. ChemPhysChem 2014, 15, 4077–4086. [Google Scholar] [CrossRef]
- Ge, Z.; Cavlnato, A.G.; Callls, J.B. Noninvasive Spectroscopy for Monitoring Cell Density in a Fermentation Process. Anal. Chem. 1994, 66, 808–890. [Google Scholar] [CrossRef]
- Wang, Y.; Huang, Y.Y.; Wang, Y.; Lyu, P.; Hamblin, M.R. Red (660 nm) or near-infrared (810 nm) photobiomodulation stimulates, while blue (415 nm), green (540 nm) light inhibits proliferation in human adipose-derived stem cells. Sci. Rep. 2017, 7, 1–10. [Google Scholar] [CrossRef] [PubMed]
- Karu, T.I.; Afanasyeva, N.I.; Kolyakov, S.F.; Pyatibrat, L.V.; Welser, L. Changes in Absorbance of Monolayer of Living Cells Induced by Laser Radiation at 633, 670 and 820 nm. IEEE J. Sel. Top. Quantum Electron. 2001, 7, 982–988. [Google Scholar] [CrossRef]
- Amaroli, A.; Ferrando, S.; Benedicenti, S. Photobiomodulation Affects Key Cellular Pathways of all Life-Forms: Considerations on Old and New Laser Light Targets and the Calcium Issue. Photochem. Photobiol. 2019, 95, 455–459. [Google Scholar] [CrossRef] [Green Version]
- Bhattacharya, M.; Dutta, A. Computational modeling of the photon transport, tissue heating, and cytochrome C oxidase absorption during transcranial near-infrared stimulation. Brain Sci. 2019, 9, 179. [Google Scholar] [CrossRef] [Green Version]
- Xantheas, S.S. Theoretical Study of Hydroxide Ion-Water Clusters. J. Am. Chem. Soc. 1995, 117, 10373–10380. [Google Scholar] [CrossRef]
- Roth, M.S.; Deheyn, D.D. Effects of cold stress and heat stress on coral fluorescence in reef-building corals. Sci. Rep. 2013, 3, 1421. [Google Scholar] [CrossRef] [Green Version]
- Muncan, J.; Aouadi, B.; Tsenkova, R. New perspectives in plant and plant-based food quality determination: Aquaphotomics. In Plant-Based Bioactives, Functional Foods, Beverages and Medicines: Processing, Analysis and Health Benefit; Goyal, M.R., Kovacs, Z., Nath, A., Suleria, H., Eds.; Apple Academic Press, Taylor and Francis: Palm Bay, FL, USA, 2020. [Google Scholar]
- Du, Y.; Zhao, Q.; Chen, L.; Yao, X.; Zhang, W.; Zhang, B.; Xie, F. Effect of drought stress on sugar metabolism in leaves and roots of soybean seedlings. Plant Physiol. Biochem. 2020, 146, 1–12. [Google Scholar] [CrossRef]
- Herritt, M.T.; Fritschi, F.B. Characterization of Photosynthetic Phenotypes and Chloroplast Ultrastructural Changes of Soybean (Glycine max) in Response to Elevated Air Temperatures. Front. Plant Sci. 2020, 11, 153. [Google Scholar] [CrossRef]
- Humplík, J.F.; Lazár, D.; Husičková, A.; Spíchal, L. Automated phenotyping of plant shoots using imaging methods for analysis of plant stress responses-A review. Plant Methods 2015, 11, 1–10. [Google Scholar] [CrossRef] [Green Version]
- Idso, S.B.; Reginato, R.J.; Radin, J.W. Leaf diffusion resistance and photosynthesis in cotton as related to a foliage temperature based plant water stress index. Agric. Meteorol. 1982, 27, 27–34. [Google Scholar] [CrossRef]
- Buitrago, M.F.; Groen, T.A.; Hecker, C.A.; Skidmore, A.K. Changes in thermal infrared spectra of plants caused by temperature and water stress. ISPRS J. Photogramm. Remote Sens. 2016, 111, 22–31. [Google Scholar] [CrossRef]
- Merlot, S.; Mustilli, A.C.; Genty, B.; North, H.; Lefebvre, V.; Sotta, B.; Vavasseur, A.; Giraudat, J. Use of infrared thermal imaging to isolate Arabidopsis mutants defective in stomatal regulation. Plant J. 2002, 30, 601–609. [Google Scholar] [CrossRef] [PubMed] [Green Version]
- Funatsuki, H.; Matsuba, S.; Kawaguchi, K.; Murakami, T.; Sato, Y. Methods for evaluation of soybean chilling tolerance at the reproductive stage under artificial climatic conditions. Plant Breed. 2004, 123, 558–563. [Google Scholar] [CrossRef]
- Funatsuki, H.; Kurosaki, H.; Murakami, T.; Matsuba, S.; Kawaguchi, K.; Yumoto, S.; Sato, Y. Deficiency of a cytosolic ascorbate peroxidase associated with chilling tolerance in soybean. Theor. Appl. Genet. 2003, 106, 494–502. [Google Scholar] [CrossRef] [PubMed]
- Yamaguchi, N.; Yamazaki, H.; Ohnishi, S.; Suzuki, C.; Hagihara, S.; Miyoshi, T.; Senda, M. Method for selection of soybeans tolerant to seed cracking under chilling temperatures. Breed. Sci. 2014, 64, 103–108. [Google Scholar] [CrossRef] [PubMed] [Green Version]
- Kasai, A.; Ohnishi, S.; Yamazaki, H.; Funatsuki, H.; Kurauchi, T.; Matsumoto, T.; Yumoto, S.; Senda, M. Molecular Mechanism of Seed Coat Discoloration Induced by Low Temperature in Yellow Soybean. Plant Cell Physiol. 2009, 50, 1090–1098. [Google Scholar] [CrossRef] [PubMed] [Green Version]
- Wang, Z.; Reddy, V.R.; Quebedeaux, B. Growth and photosynthetic responses of soybean to short-term cold temperature. Environ. Exp. Bot. 1997, 37, 13–24. [Google Scholar] [CrossRef]
- Robison, J.; Arora, N.; Yamasaki, Y.; Saito, M.; Boone, J.; Blacklock, B.; Randall, S. Glycine max and Glycine soja are capable of cold acclimation. J. Agron. Crop Sci. 2017, 203, 553–561. [Google Scholar] [CrossRef] [Green Version]
- Cowe, I.A.; McNicol, J.W. The Use of Principal Components in the Analysis of Near-Infrared Spectra. Appl. Spectrosc. 1985, 39, 257–266. [Google Scholar] [CrossRef]
- Dhanoa, M.S.; Barnes, R.J.; Lister, S.J. Standard Normal Variate Transformation and De-trending of Near-Infrared Diffuse Reflectance Spectra. Appl. Spectrosc. 1989, 43, 772–777. [Google Scholar]
- Tsenkova, R.; Munćan, J.; Pollner, B.; Kovacs, Z. Essentials of Aquaphotomics and Its Chemometrics Approaches. Front. Chem. 2018, 6, 363. [Google Scholar] [CrossRef]
- Wold, S.; Sjostrom, M. SIMCA: A Method for Analyzing Chemical Data in Terms of Similarity and Analogy. In Chemometrics: Theory and Application; Kowalski, B.R., Ed.; American Chemical Society: San Francisco, CA, USA, 1977; pp. 243–282. [Google Scholar]
- Wold, S.; Albano, C.; Dunn, W.J.; Edlund, U.; Esbensen, K.; Geladi, P.; Hellberg, S.; Johansson, E.; Lindberg, W.; Sjöström, M. Multivariate Data Analysis in Chemistry. In Chemometrics; Springer: Dordrecht, The Netherlands, 1984; pp. 17–95. [Google Scholar]
- Pollner, B.; Kovacs, Z. R-Package aquap2-Multivariate Data Analysis Tools for R including Aquaphotomics Methods 2016. Available online: https://www.aquaphotomics.com/aquap2/ (accessed on 20 December 2021).
- R Development Core Team R: A Language and Environment for Statistical Computing 2017. Available online: https://www.r-project.org/ (accessed on 20 December 2021).


Publisher’s Note: MDPI stays neutral with regard to jurisdictional claims in published maps and institutional affiliations. |
© 2022 by the authors. Licensee MDPI, Basel, Switzerland. This article is an open access article distributed under the terms and conditions of the Creative Commons Attribution (CC BY) license (https://creativecommons.org/licenses/by/4.0/).
Share and Cite
Muncan, J.; Jinendra, B.M.S.; Kuroki, S.; Tsenkova, R. Aquaphotomics Research of Cold Stress in Soybean Cultivars with Different Stress Tolerance Ability: Early Detection of Cold Stress Response. Molecules 2022, 27, 744. https://doi.org/10.3390/molecules27030744
Muncan J, Jinendra BMS, Kuroki S, Tsenkova R. Aquaphotomics Research of Cold Stress in Soybean Cultivars with Different Stress Tolerance Ability: Early Detection of Cold Stress Response. Molecules. 2022; 27(3):744. https://doi.org/10.3390/molecules27030744
Chicago/Turabian StyleMuncan, Jelena, Balasooriya Mudiyanselage Siriwijaya Jinendra, Shinichiro Kuroki, and Roumiana Tsenkova. 2022. "Aquaphotomics Research of Cold Stress in Soybean Cultivars with Different Stress Tolerance Ability: Early Detection of Cold Stress Response" Molecules 27, no. 3: 744. https://doi.org/10.3390/molecules27030744
APA StyleMuncan, J., Jinendra, B. M. S., Kuroki, S., & Tsenkova, R. (2022). Aquaphotomics Research of Cold Stress in Soybean Cultivars with Different Stress Tolerance Ability: Early Detection of Cold Stress Response. Molecules, 27(3), 744. https://doi.org/10.3390/molecules27030744