Article

Antioxidant, Antimicrobial Activities and Characterization of Polyphenol-Enriched Extract of Egyptian Celery (Apium graveolens L., Apiaceae) Aerial Parts via UPLC/ESI/TOF-MS

1
Pharmacognosy Department, Faculty of Pharmacy, October 6 University, Sixth of October City 12511, Egypt
2
Microbiology & Immunology Department, Faculty of Pharmacy, The British University in Egypt (BUE), Cairo 11837, Egypt
3
Pharmacognosy Department, Faculty of Pharmacy, The British University in Egypt (BUE), Cairo 11837, Egypt
*
Author to whom correspondence should be addressed.
Authors contributed equally to the work.
Molecules 2022, 27(3), 698; https://doi.org/10.3390/molecules27030698
Submission received: 28 December 2021 / Revised: 13 January 2022 / Accepted: 18 January 2022 / Published: 21 January 2022

Abstract

:
Medicinal plant extracts are increasingly considered a major source of innovative medications and healthcare products. This study focused on preparing a polyphenol enriched water extract of Egyptian celery “Apium graveolens L., Apiaceae” aerial parts (TAE) in an endeavor to accentuate its antioxidant capacity as well as its antimicrobial activity. (TAE) of celery was partitioned against different organic solvents to yield dichloromethane (DCM), ethyl acetate (EAC), and butanol (BUOH) fractions. (TAE) and the organic fractions thereof besides the remaining mother liquor (ML) were all screened for their antioxidant capacity using various protocols viz. monitoring the reducing amplitudes for ferric ions (FRAP), and radical scavenging potentials of oxygen (ORAC), 2,2’-azino-bis-3-ethylbenzothiazoline-6-sulfonic acid (ABTS), 2,2-diphenyl-1-picrylhydrazyl (DPPH), and metal chelation assays. The examination procedure revealed both (TAE) extract and (DCM) fraction, to pertain the highest antioxidant potentials, where the IC50 of the (TAE) using ABTS and metal chelation assays were ca. 34.52 ± 3.25 and 246.6 ± 5.78 µg/mL, respectively. The (DCM) fraction recorded effective results using the FRAP, ORAC, and DPPH assays ca. 233.47 ± 15.14 and 1076 ± 25.73 μM Trolox equivalents/mg sample and an IC50 474.4 ± 19.8 µg/mL, respectively. Additionally, both (TAE) and (DCM) fraction exerted antimicrobial activities recording inhibition zones (mm) (13.4 ± 1.5) and (12.0 ± 1.0) against Staphylococcus aureus and (11.0 ± 1.2) and (10.0 ± 1.3) against Escherichia coli, respectively, with no anti-fungal activity. Minimum inhibitory concentration (MIC) of (TAE) and (DCM) fraction were 1250 and 2500 µg/mL, respectively. UPLC/ESI/TOF-MS unveiled the chemical profile of both (TAE) and (DCM) fraction to encompass a myriad of active polyphenolic constituents including phenylpropanoids, coumarins, apigenin, luteolin, and chrysoeriol conjugates.

1. Introduction

Over the past two decades many edible and medicinal plants have been screened for their antioxidant profiles and indeed have proven to be safe substitutes to some commonly used synthetic antioxidants. Assessment of the antioxidant potential of natural drug extracts is frequently a starting point to validate a variety of other key physiological actions [1]. The correlation between high antioxidant capacities in any plant extract and antidiabetic, anti-inflammatory, antiaging, and anticancer activities has become an established concept in phytotherapy [2]. Additionally, natural antioxidants in the diet proved to boost human immune defenses and prevent oxidative damage to cellular components [3]. However, validation of this capacity requires an array of assessment methods rather than a single assay, to cover the various mechanisms of antioxidant response. Generally, a panel of assays is required to establish antioxidant potential of plant extracts in vitro by various mechanisms viz. radical scavenging, metal chelation, and reducing power assays. Polyphenols have repeatedly proven to be role-playing constituents contributing to strong antioxidant activities in foods and several plant extracts [4,5]. Water extraction of medicinal plants is a relevant approach for pooling of polyphenolic components, as well as generating a safer and more convenient extract/product for certification [5].
Celery (Apium graveolens L., Apiaceae) is both a culinary herb and a medicinal plant of wide distribution around the world since antiquity. Powdered celery seeds are used as a spice for their agreeably palatable taste and aromatic odor. In folk medicine it is used as a diuretic, or brewed for relieving hypertension, bronchial asthma, liver and spleen complaints [6]. Chemical examination of celery resulted in recognition and isolation of several flavonoids viz. apigenin, hesperitin, luteolin, and quercitrin conjugates in addition to several well-known phenolic and cinnamic acid derivatives [7]. As a member of the Apiaceae, coumarins of different classes, mainly furanocoumarins, have also been reported in celery [8]. For its rich and diverse contents of phenolic compounds, minerals and vitamin contents, celery has antioxidant, antimicrobial, as well as plethora of other pharmacologically evident actions [9].
The current investigation aimed to validate the antioxidant capacity of the polyphenol enriched water extract (TAE) of celery aerial parts as well as its fractions and the remaining mother liquor upon using different investigation protocols viz. examination of the reducing power (FRAP), scavenging different oxidants (ORAC, ABTS, DPPH), and metal chelation strength. Additionally, the antimicrobial activity of (TAE) and its organic fractions are screened against strains of Gram-positive Staphylococcus aureus, Gram-negative Escherichia coli, and Candida albicans fungi. Finally, the metabolome of the polyphenol-enriched extract (TAE) of celery and its active fractions are assessed using UPLC/ESI/TOF-MS to characterize the metabolic fingerprint promoting their biological activities.

2. Results

2.1. Evaluation of the Antioxidant Activity In Vitro

In this study the antioxidant capacity of a polyphenol enriched extract (TAE) of celery “Apium graveolens L.” aerial parts prepared by aqueous extraction and fractions thereof viz. dichloromethane (DCM), ethyl acetate (EAC), butanol (BUOH), and the remaining mother liquor (ML) prepared as described in material and method Section 4.2, were examined by an array of in vitro assays. A total of 5 assays have been implemented to verify the antioxidant activity of celery (TAE) and fractions thereof through exploring different mechanisms. The examination included probing the reduction capacity of ferric ions to the ferrous state upon incorporation of tested extracts (FRAP), radicle scavenging capacity of three different oxidants viz. ORAC, ABTS, and DPPH, and finally, measurement of the chelation power of the extracts. It has been observed that (TAE) as well as its fractions afforded appreciable antioxidant potentials with the different evaluation protocols as illustrated in (Table 1).
Experimental results also mutually pointed out the (DCM) fraction to pertain the highest antioxidant activity upon using FRAP, ORAC, and DPPH assays. In FRAP and ORAC, the total antioxidant activities have been assessed in Trolox equivalents to record 233.47 ± 15.14 and 1076 ± 45.9 μM TE/mg, respectively. In DPPH protocol, the calculated IC50 was 474.4 ± 19.8 µg/mL for (DCM) fraction followed by (EAC) then total aqueous extract (TAE) being 591.4 ± 27.05 and 930.8 ± 42.5 µg/mL, respectively. (TAE) also exhibited effective antioxidant activity upon using other assays as ABTS and metal chelation protocols with recorded IC50 values 34.52 ± 3.25 µg/mL and 246.6 ± 5.78 μM eq/mg, respectively. For the record, the observed variability in results among different antioxidant protocols is due to difference in concentrations of tested samples, which is compulsory to work within the linear absorbance range of each assay. The results of all the antioxidant activity investigations are summarized in (Figure 1).

2.2. Evaluation of the Antimicrobial Activity

2.2.1. Well Diffusion Assay

The antimicrobial properties of (TAE) extract and its fractions in addition to (ML) at a concentration of 20% w/v against Staphylococcus aureus, Escherichia coli, and Candida albicans were assessed in this study using the well diffusion assay. The results showed that (TAE) extract and (DCM) fraction suppressed the growth of the tested micro-organisms efficiently with variable potency as explained in Table 2.
The (TAE) extract and (DCM) fraction expressed the maximum zones of inhibition recording (13.4 ± 1.5 mm) and (12.0 ± 1.0 mm) against Staphylococcus aureus compared to (11.0 ± 1.2 mm) and (10.0 ± 1.3 mm) against Escherichia coli, respectively. (EAC), (BUOH), and (ML) fractions did not show any antibacterial activity against the tested bacteria. Regarding the antifungal activity assessment of all samples, none of the tested extracts showed remarkable zones of inhibition and consequently they had no antifungal activity against Candida albicans at selected concentrations.

2.2.2. Determination of Minimum Inhibitory Concentration (MIC)

The lowest concentration that inhibits the growth of bacteria was determined for the (TAE) extract and (DCM) fraction using the minimum inhibitory concentration assay. The results showed that (TAE) extract exhibited more potent antibacterial activity than (DCM) fraction, where total visual bacterial inhibition occurred at concentrations 1250 and 2500 µg/mL, respectively.

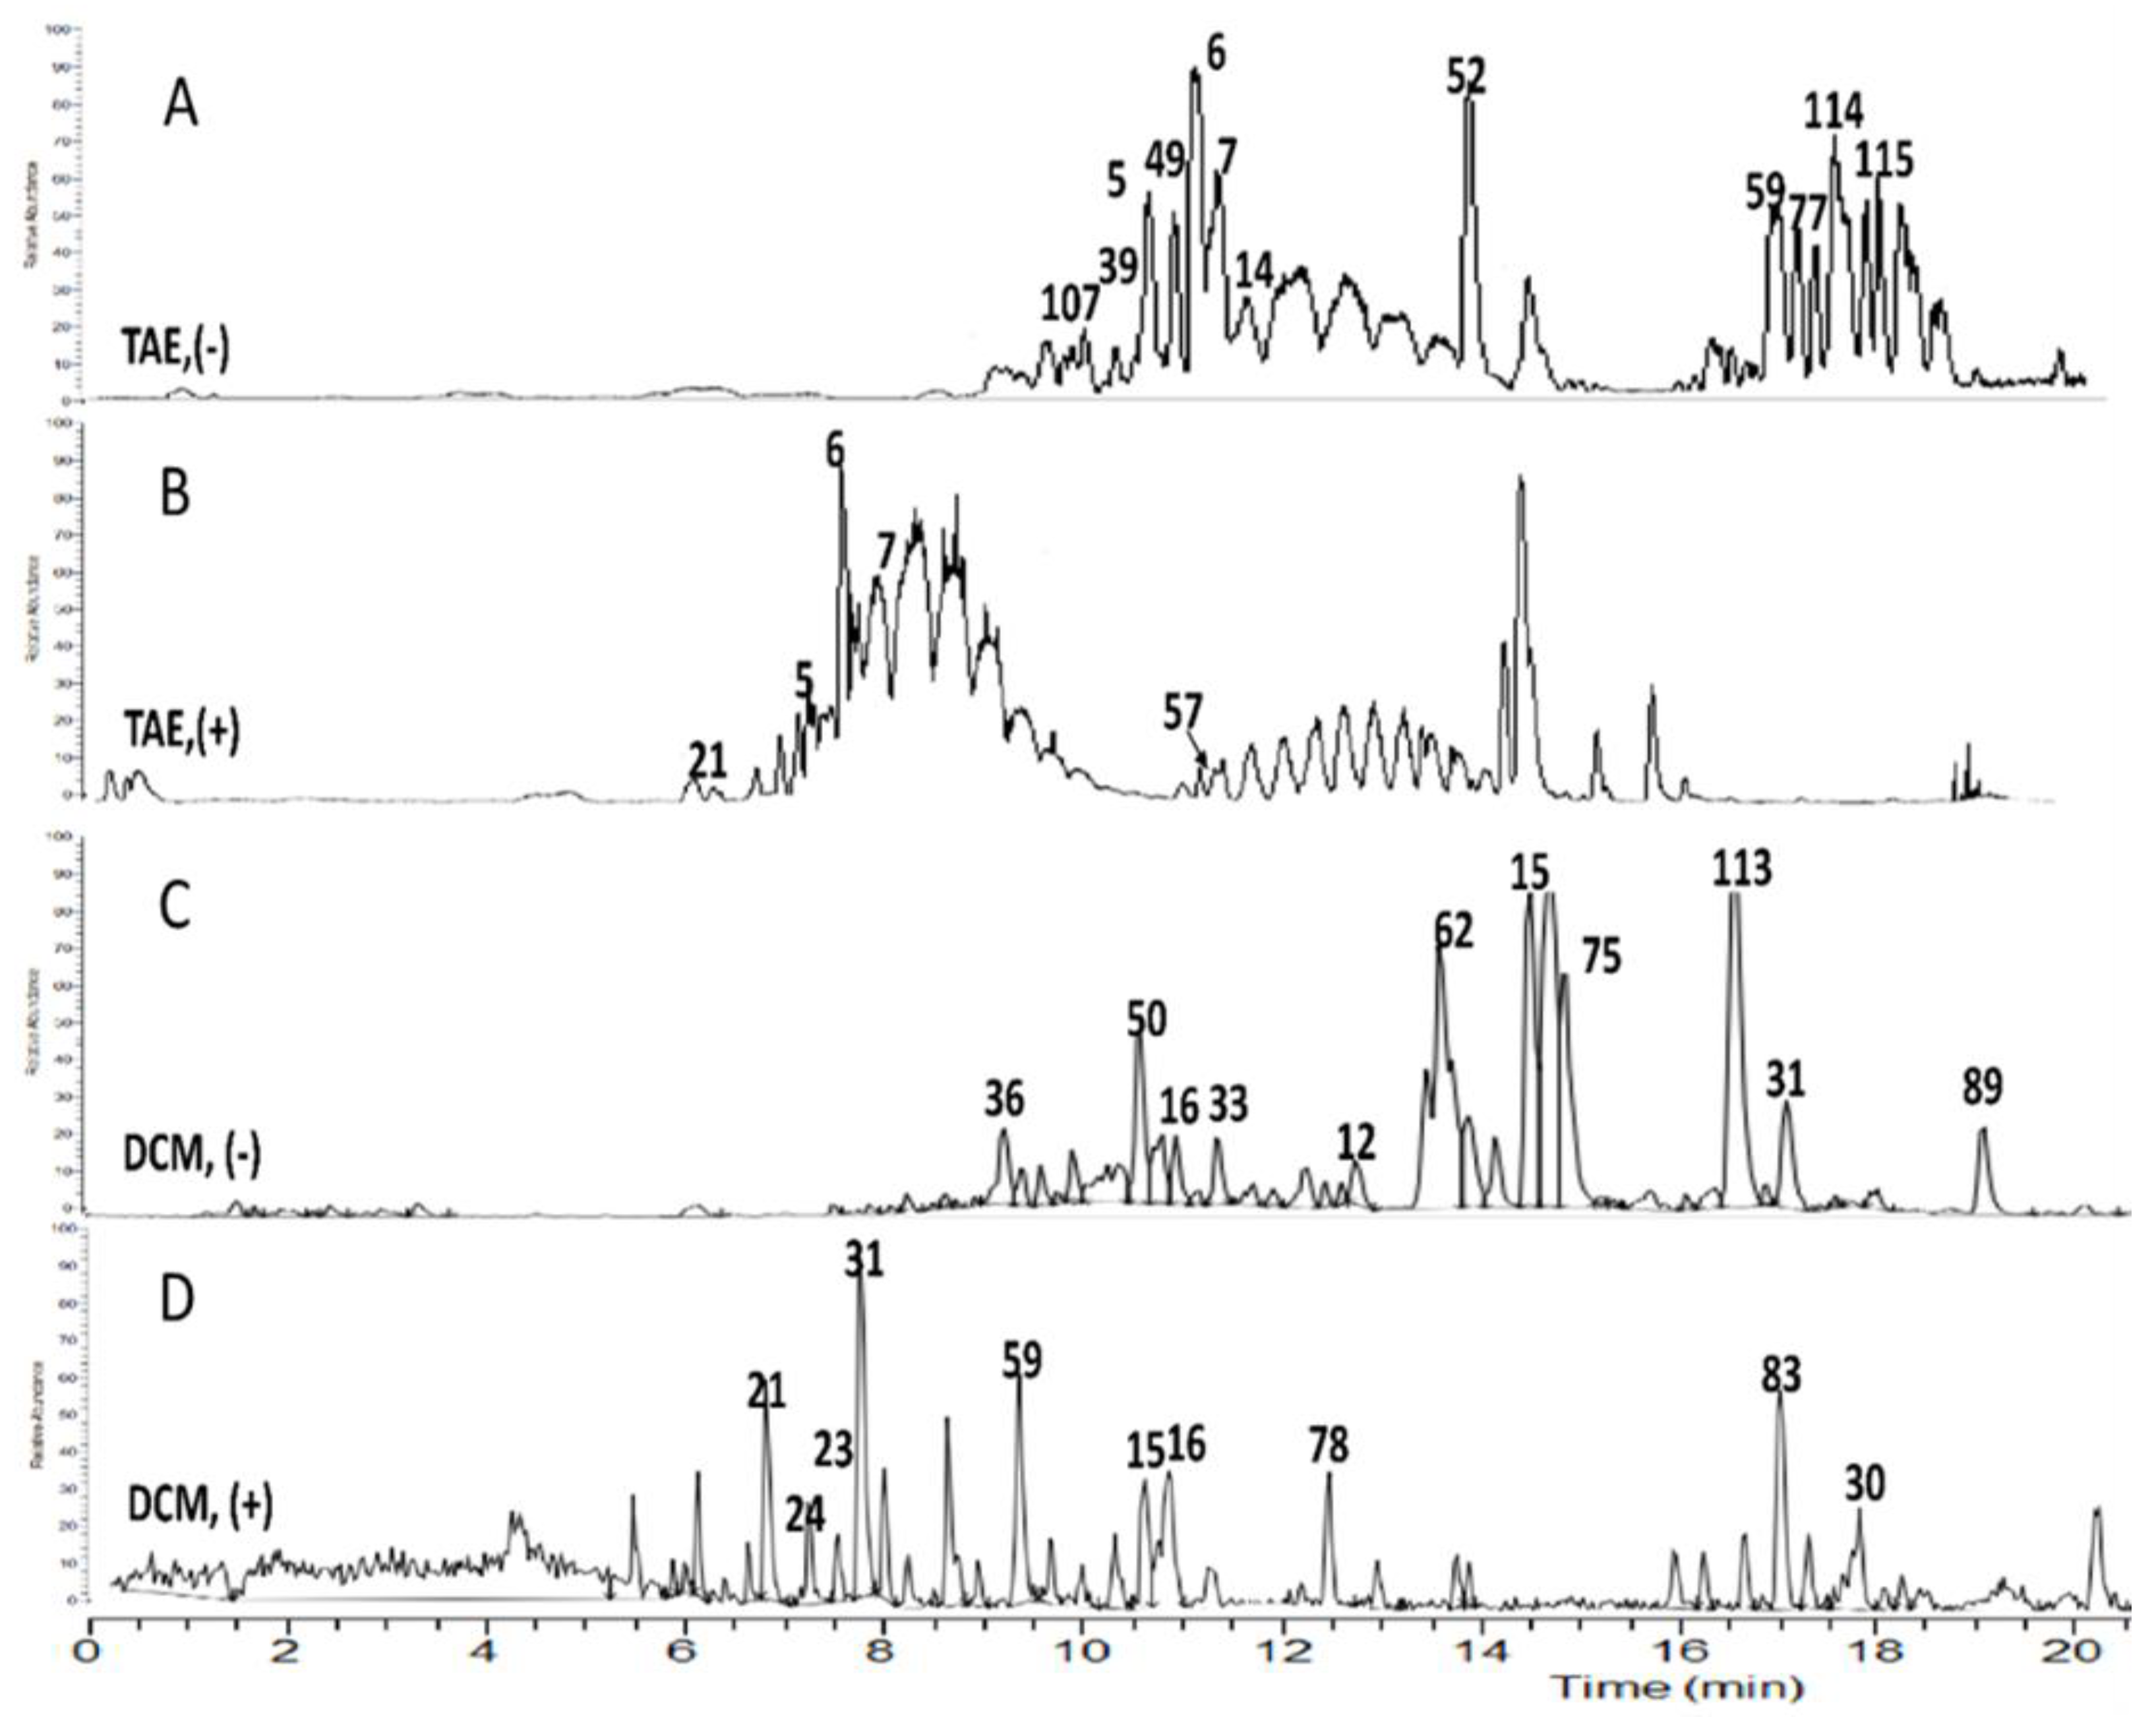
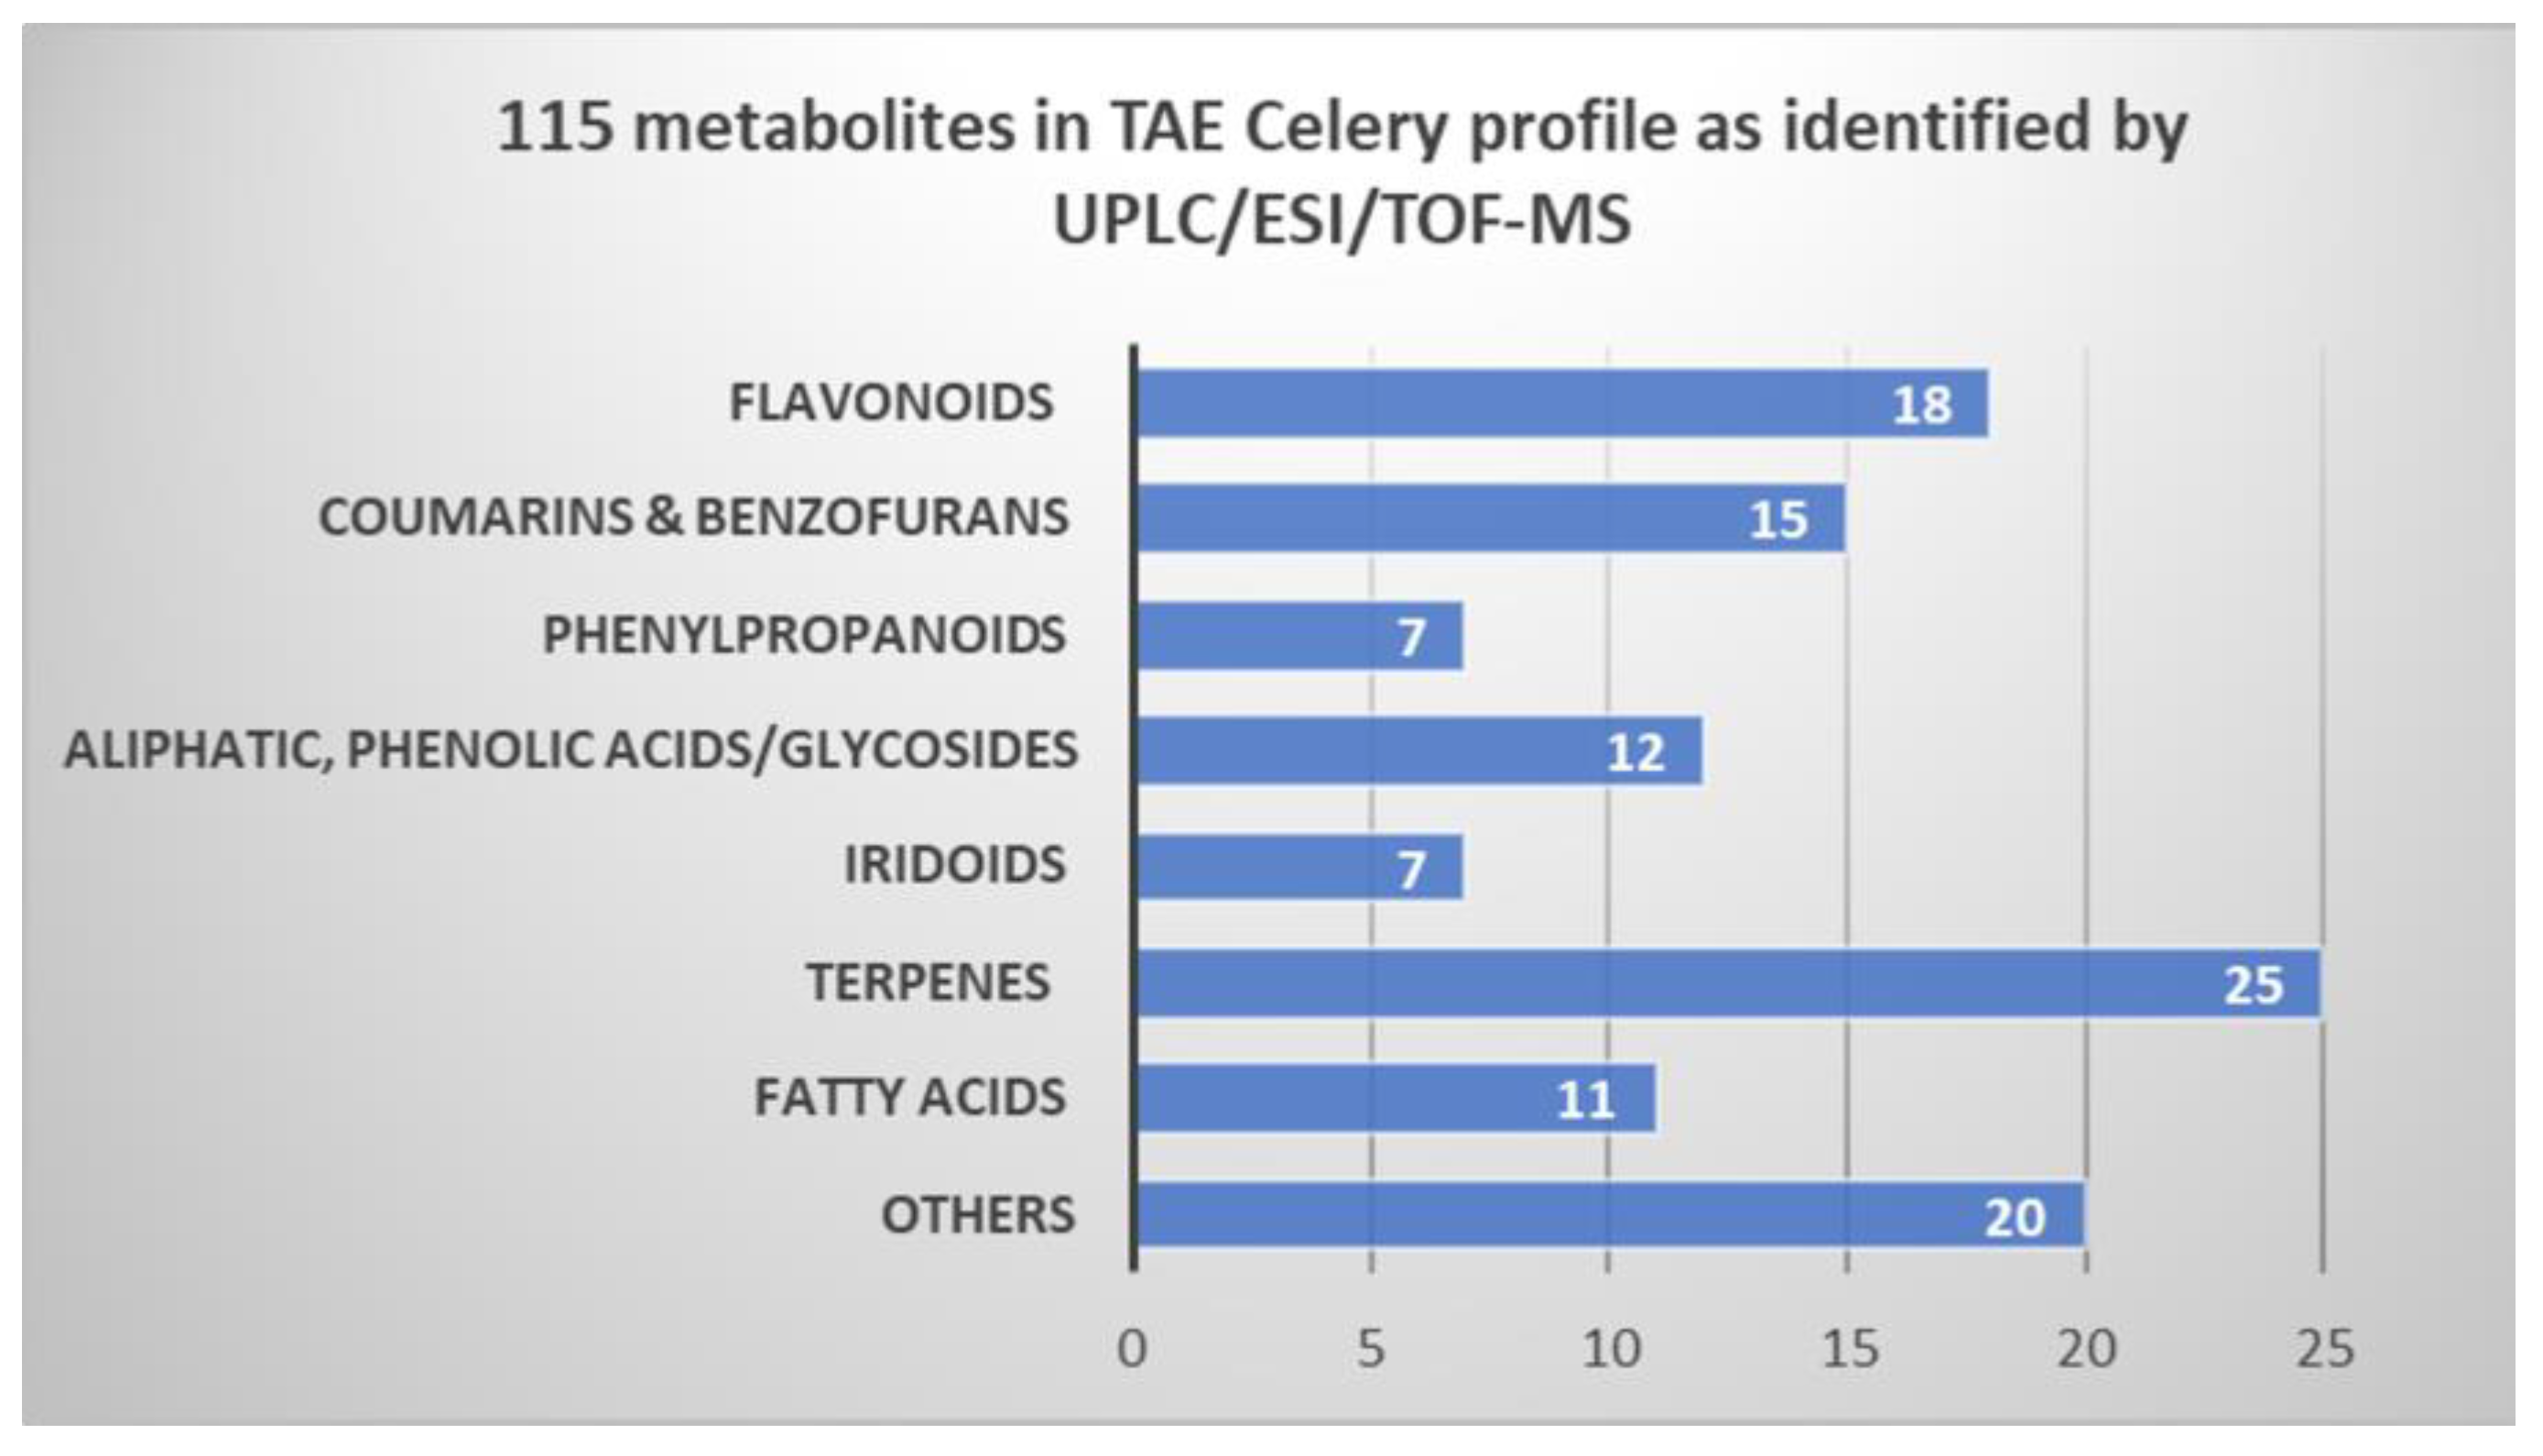
2.3. UPLC/ESI/TOF-MS Metabolic Profiling of (TAE) of Celery Aerial Parts

Metabolome profiling of (TAE) of celery aerial parts and (DCM) fraction thereof exhibiting promising antioxidant and antibacterial potentials was conducted using reversed phase UPLC/ESI/TOF-MS analysis. Base peak chromatograms representative of (TAE) in both negative and positive ionization modes are given in Figure 2A,B, whereas (DCM) chromatograms are depicted in Figure 2C,D, respectively.
The analytical setup adopted herein allowed for the simultaneous identification of 115 plant metabolites belonging to chemically variant classes within ca. 20 min that are listed in Table 3.
The following section discusses the identification of major secondary metabolites of biological merit and summarized in Figure 3.

2.3.1. Flavonoids

Celery (TAE) profile revealed abundancy in the flavonoid composition where 18 metabolites mainly flavones including apigenin, chrysoeriol, and luteolin aglycones and conjugates thereof as reported previously, in addition to one flavanol which was tentatively assigned as noidesol A (C-hexosyl methoxyflavanol) [10,11,12]. Apigenin conjugates dominated the celery (TAE) profile as it was assigned in half of the flavonoid configuration (9 metabolites) which could be attributed to the aqueous extraction method adopted. Chrysoeriol (3’-O-methyl derivative of luteolin) and its conjugates were assigned in 6 of the identified flavonoids based on the fragment ion m/z 299.05548 [M-H] with the predicted chemical formula [C16H11O6]. Luteolin-O-hexosyl pentoside (m/z 579.13342, peak 5), apiin (m/z 563.13843, peak 6), and chrysoeriol-O-hexosyl pentoside (m/z 593.14832, peak 7) were major peaks in negative mode (Figure 2), revealing neutral losses of (162 Da) and (132 Da) of the molecular ion, indicative of O-linked hexoside and pentose residues, respectively [13] (Figures S1–S3).
For example, peaks 3 and 4 (m/z 727.20697 [C32H39O19]+ and m/z 757.21661 [C33H41O20]+) at tR = 10.12 and 10.35 min., respectively, demonstrated similar fragment patterns and generating daughter ions at m/z 595.16425, 433.11163, 271.05960, and m/z 625.17542, 463.12268, 301.07040 Da, respectively, indicating O-linked pentose [M+1-132]+, O-linked pentose-hexose [M+1-132-162]+, and O-linked pentose-dihexose sugar moieties [M+1-132-162-162]+, respectively (Figures S4 and S5). Consequently, metabolite # 3 was annotated as apigenin-O-dihexosyl pentoside, whereas metabolite # 4 was annotated chrysoeriol-O-dihexosyl pentoside as reported in literature [14]. Similarly, peaks 9 and 10 (m/z 741.20148 Da [C36H37O17]+ and m/z 771.21106 Da [C37H39O18]+) at tR = 12.15 and 12.37, respectively, generated daughter ions representative for losses of [M+1-162]+, [M+1-162-146]+, [M+1-162-146-162]+, respectively, and supported an O-linked three sugar structure. Metabolites 9 and 10 were assigned to be apigenin-O-dihexosyl deoxy hexoside and chrysoeriol-O-dihexosyl deoxy hexoside, respectively (Figures S6 and S7).

2.3.2. Coumarins and Benzofurans

Coumarins are pervading and important biologically active secondary metabolites in the family Apiaceae as well as other plant families viz. Asteraceae, Moraceae, and Rutaceae [15]. Apiaceae harbors diverse chemical structures of coumarins which are regarded as chemotaxonomic markers [15]. The (TAE) profile of celery encompassed 15 coumarin compound of varying configurations viz. furanocoumarins (isopimpinellin and marmesin), furanochromone (khellin), hydroxycoumarins (methylumbelliferone and isofraxidin), coumarinolignoid (cleomiscosin A), and coumarin glycosides (aesculin).
A major coumarin metabolite was observed at tR= 14.69 min. Peak 32, at m/z 247.06464 Da [C13H11O5]+ with a daughter base peak at m/z 232.03647 Da and predicted chemical formula [C12H8O5]+ implying the loss of methyl group [M-CH3]+ was annotated as isopimpinellin (Figure S8) as reported by [16]. Similarly, a less abundant peak 21 at tR = 6.78 min. with molecular ion m/z 223.0602 Da, [C11H11O5]+ showed a base peak at m/z 208.03674 Da, [C10H8O5]+ for the loss of methyl group [M-CH3]+, and peak 21 was assigned to isofraxidin (Figure S9). Its O-hexoside derivative was assigned to peak 22 at tR = 7.41 min. with molecular ion m/z 383.09430 Da [C17H19O10] which generated a base peak at m/z 221.04509 Da [C11H9O5] designating the loss of hexosyl moiety (Figure S10).
Khellin is a major constituent of Ammi visnaga, and was identified in other species in family Apiaceae [17] and was assigned to the molecular ion m/z 261.07565 Da [C14H13O5]+ (peak 28 at tR = 13.53 min.) which showed a base peak at m/z 246.05215 Da [C13H10O5]+ referring to a loss of methyl group (Figure S11). Respectively, peak 25 (tR = 10.66 min.) was annotated as isopimpinellin-O-hexoside, with the molecular ion at m/z 409.11224 [C19H21O10]+ and base peak at m/z 247.06020 Da [C13H11O5]+ [M-162]+ referring to isopimpinellin after loss of O-hexosyl moiety (Figure S12).

2.3.3. Phenylpropanoids

Seven phenylpropanoids were identified in (TAE) of celery mainly as quinic acid conjugates as a consequent of extraction with water. Quinic acid fragments were observed in peaks 34 and 36 as base peaks at m/z 191.05551 Da with the predicted chemical formula [C7H11O6], in addition to fragments at m/z 179.03462 [C9H7O4] and m/z 163.03981 Da [C9H7O3] corresponding to caffeoyl and coumaroyl moieties, respectively (Figures S13 and S14). On the other hand, peak 37 at tR = 9.87 min. with molecular ion m/z 369.11801 Da, [C17H21O9]+ showed a base peak at m/z 177.05449 Da [C10H9O3]+ representing the loss of quinic moiety [M+1-191]+ (Figure S15). Phenylpropanoids have been already reported in family Apiaceae, and their antimicrobial and antioxidant activities are well established [18].

2.3.4. Terpenes

Plenty of low intensity peaks were ascribed to triterpenes and steroids (25 metabolite) in (TAE) profile of celery, which could be a result of aqueous extraction. Identified metabolites include 6 triterpenes (peaks # 70, 71, 73, 74, 83, and 84), 4 sesquiterpenes (peaks # 60, 61, 62, and 81), and a steroidal terpene (peaks # 68). The terpene glycosides citroside A (peak 63), was detected at tR = 9.31 min. at m/z 385.18555 Da with predicted chemical formula [C19H29O8], and the daughter fragment ion at m/z 205.1230 Da [C13H17O2] implies the neutral losses of a hexose and water portions [M+1-162-18]+ (Figure S16). Auraptene (peak 75 at tR = 16.72 min. at m/z 297.15207 Da [C19H21O3]) is a bioactive monoterpene coumarin ether which has been reported in celery to possess strong antioxidant and hepatoprotective activities [19] (Figure S17). A unique terpenoid ester, tschimganin, reported previously in family Apiaceae [20], was identified in (TAE) (peak 78 at tR = 17.79 min. at m/z 305.17484 Da [C18H25O4]+), showing a predominant fragments at m/z 273.14832 Da [C17H21O3]+ referring to the losses of hydroxyl and methyl moieties [M+1-17-15]+, respectively (Figure S18).

3. Discussion

Celery (TAE) extract and its (DCM) fraction, pertained the most significant antioxidant and antimicrobials potentials as described in previous Section 2.1 and Section 2.2. Hence, it was crucial to correlate the biological results with the chemical profiling of celery using UPLC/ESI/TOF-MS to understand the influence of these natural secondary metabolites as well as their previously reported mechanisms of action if present.

3.1. Evaluation of Antioxidant Activity in Correlation to UPLC/ESI/TOF-MS Metabolite Profiling

The polyphenol-enriched extract of celery aerial parts and its fractions exerted effective antioxidant activity upon using different antioxidant protocols in agreement with several in vitro and in vivo studies of alcoholic extract and juice of celery herb and seeds [7,21,22,23]. In the current study, results of thorough antioxidant examinations acknowledged both celery (TAE) and (DCM) as fractions with high antioxidant potential, hence characterizing their metabolome profile was performed using UPLC/ESI/TOF-MS. Under the analytical setup procedure described in Section 4.5.3, a total of 115 metabolites were separated and identified. The phytochemical constitution of celery (TAE) entailed a total of 18 flavone conjugates, 15 coumarin and benzofuran derivatives, 7 phenylpropanoids, 12 aliphatic and phenolic acids, and 25 terpenoid compounds as well as other metabolites as illustrated in Table 3 and Figure 2A,B in Section 2.3.
The flavonoid fingerprint of celery (TAE) was composed almost entirely of apigenin, luteolin, and chrysoeriol conjugates which were all reported to possess varying antioxidant features [24]. Owing to the aqueous extraction, the glycosidic configuration predominated the flavonoid fingerprint which imposes an impact on the overall antioxidant activity as research studies have conducted that glycoside are generally stronger antioxidants than their respective aglycones [25]. Apiin (peak 6, tR = 11.40), detected with high abundance in (TAE) of celery aerial parts is the apigenin flavone diglycoside marker of Apiaceae members, established antioxidant properties both in vitro and in vivo models (22). On the other hand, the (DCM) fraction seemed to pertain several coumarins which were assigned to the peaks of higher intensity observed in its UPLC/MS analytical chromatogram Figure 2C,D. Coumarins are characteristic heterocyclic compounds of superb thermal and photo stabilities and have been associated with several beneficial effects on human health. Coumarins of family Apiaceae and reported herein in the metabolite profiles of tested celery fractions, (TAE) and (DCM), have reported antioxidant activities [26]. Phenylpropanoids with their chief representative, caffeic acid have been recognized as potent antioxidants compounds in numerous in vitro and in vivo assays [27]. Phenolic acids and phenolic glycosides were also highly abundant metabolites in celery fractions owing to aqueous extraction (Figure 2A–D). The assigned phenolic acids in celery (TAE) and/or (DCM) extracts viz. elenolic and azelaic are recognized antioxidants, the former attributes for the natural antioxidant activity of extra virgin olive oil, while the latter is extensively employed in natural cosmetic preparations [28,29]. Based on these findings, it can be deduced that celery’s antioxidant effect is evidently related to its polyphenol enriched chemical profile.

3.2. Evaluation of Antimicrobial Activity in Correlation to UPLC/ESI/TOF-MS Metabolite Profiling

Apium graveolens extracts were screened for their antimicrobial effects against Staphylococcus aureus representing Gram-positive bacteria, Escherichia coli representing Gram-negative bacteria, and Candida albicans representing fungal strain. The antimicrobial effects were tested using well diffusion assay and MIC. Out of the 5 extracts tested, only (TAE) extract and (DCM) fractions were demonstrated to possess inhibition against Gram-positive and -negative strains ranging between 9–15 mm, while they did not give anti-fungal activity. The values of MIC of Apium graveolens (TAE) and (DCM) were 1250 and 2500 µg/mL, respectively; showing that (TAE) was more potent. A previous study on extract of celery recorded effective inhibitory action on both Staphylococcus aureus and S. epidermidis which proves the efficacy of celery as an antibacterial agent [30], whereas celery also proved its efficacy on cytokeratin and other healing factors in wounds of infected skin with methicillin resistant S. aureus strains as well [31]. Many studies have demonstrated the antimicrobial potency of plant extracts and their bioactive components—solely or in groups with other components—flavonoids being the highest phytochemical showing antibacterial [32] as well as antifungal activities [33]. The suggested mechanisms of antibacterial action are microbial plasma membrane degradation, DNA topoisomerase inhibition, and inhibition of microbial energy metabolism [32,34].
The results demonstrated in this study show that Apium graveolens (TAE) and (DCM) extracts inhibited bacterial growth in the test cultures. However, Candida albicans was resistant to all extracts at the applied concentrations. It could be observed that higher concentrations of the extracts possesed more bacterial inhibition. The slight differences in sensitivity to the effect of different extracts between the Gram-negative and Gram-positive bacteria shown in this study are supported by other studies in literature [35,36]. The mechanism which explains the weak susciptibility of Gram-negative bacteria is not exactly known. However, it may be attributed to the strong hydrophobic outer membrane of Gram-negative bacteria which acts as a strong permeability barrier [37]. The antibacterial effect of Apium graveolens (TAE) compared to (DCM) could be related to the high content of phenolics exmplified in flavonoids [38], as well as to some extent to its volatiles content, mainly the aromatic components and D-limonene, which could affect the polarity and consequently the degree of bacterial inhibition [39].

4. Material and Method

4.1. Chemicals, Reagents, and Microbial Strains

HPLC grade solvents—acetonitrile and methanol—were purchased from Thermo-Fisher Scientific Co. (Waltham, MA, USA). Mobile phase solvents viz. ammonium hydroxide and formic acid 98% were purchased from Sigma–Aldrich Co. (St. Louis, MO, USA). All other chemicals (TPTZ “tripyridyl-1- s-triazine”, AAPH “2,2′-azobis (2-amidinopropane) dihydrochloride”, ABTS “2, 2′-azino-bis (3- ethylbenzothiazoline-6-sulfonic acid), ferrous sulphate, DPPH (2,2-diphenyl-1-picryl-hydrazyl-hydrate), and solvents (dichloromethane, ethyl acetate, and butanol) were of analytical grades and bought from Sigma Aldrich Company.
Microbial strains tested represented Gram-positive bacteria [Staphylococcus aureus ATCC 25923], Gram-negative bacteria [Escherichia coli ATCC 25922], as well as one pathogenic fungus [Candida albicans RCMB 005003 (1) ATCC 10231].

4.2. Plant Material and Sample Preparation

Aerial parts of celery “Apium graveolens L.” were gathered in Spring from Fayoum governorate just before flowering, authenticated by Prof. Dr. Wafaa M. Amer, Cairo University Herbarium, Faculty of Science. Celery aerial parts were carefully dried in the shade then powdered. The polyphenol-enriched extract was prepared by macerating 750 g of the dried plant material in distilled water overnight. Total aqueous extract (TAE) was concentrated on rotary evaporator (R-210 evaporator, Büchi, Switzerland) till formation of a concentrated, viscous extract. Seventy-five ml of the concentrated extract was completely dried by lyophilization (LGJ-10, Mingyi, China, Dongguan, China) to yield 50 g of (TAE) for biological and UPLC/ESI/TOF-MS examinations. The remaining viscous extract was partitioned between organic solvents with increasing polarity viz. dichloromethane (DCM), ethyl acetate (EAC), and butanol (BUOH). Each organic fraction was evaporated to dryness to yield 1.58, 2.54, and 21.41 g, respectively, and the remaining mother liquor (ML) was also concentrated under vacuum and freeze dried (23.78 g).
Serial dilutions of the 5 samples—total aqueous extract (TAE) and fractions thereof viz. (DCM), (EAC), (BUOH), and (ML)—were prepared in concentrations of µg/mL for carrying out the array of antioxidant examination procedures as will be described within each protocol.

4.3. Evaluation of the Antioxidant Activity

All results assessed in all antioxidant protocols using the microplate reader FluoStar Omega (BMG LABTECK) and expressed as averages ± SD of triplicate measurements. The antioxidant capacity for the tested samples was expressed as μM Trolox equivalent “TE”/mg of each sample following the equation y = 0.0019x + 0.0874 (R2 = 0.9985) or y = 377.7x + 29731 (R2 = 0.9972) in FRAP or ORAC protocol, respectively.
IC50 values were calculated from free radical scavenging activity (% inhibition) versus log concentration of sample curve (µg/mL). IC50 values of tested samples in ABTS, DPPH, and metal chelation protocols were calculated using Graph pad Prism 6 with the data represented as mean ± SD of triplicate measurements using the equation:
Percentage inhibition = ((Blank average absorbance -Test average absorbance)/(Blank average absorbance)) × 100
The antioxidant capacity results of different samples were compared using ANOVA test followed by Tukey’s post hoc test, whereas significant p-value was (p < 0.05) using Graph pad prism 6.

4.3.1. FRAP Assay “Trolox Equivalent”

Antioxidant activity in vitro using ferric reducing antioxidant power “FRAP” was carried out on the 5 samples under examination: viz. (TAE), (DCM), (EAC), (BUOH), and (ML). FRAP antioxidant protocol was assessed as per the method described briefly by Benzie, I.F. and Strain, J.J. [40] with minor modifications to suit microplate recording. A freshly prepared TPTZ “tripyridyl-1-s-triazine” reagent (190 µL) (300 mM of buffer acetate PH 3.6 added to 10 mM of TPTZ dissolved in 40 mM of hydrochloric acid and 20 mM of ferric chloride mixed in ratios of 10:1:1 v/v/v; respectively) is added to each sample (10 µL) separately (concentration =1 µg/mL) in a 96-well plate. Triplicate reaction mixtures were incubated for half an hour in the dark at 37 °C, and the blue color distinctive of ferrous ion generation was measured at λ 593 nm. Trolox standard curve of prepared in 25, 50, 100, 200, 400, 600, and 800 µM serial dilutions.

4.3.2. ORAC Assay “Trolox Equivalent”

The ORAC “Oxygen Radical Absorbance Capacity” was carried out in vitro for the 5 test samples compared to Trolox standard. The method was conducted as per Liang et al. [41] with some modifications: 10-μL of each test prepared sample “1 mg/mL” was incubated separately with 30 μL of fluoresceine (100 nM) for 10 min at room temperature. Fluorescence measurement was conducted for 3 cycles (485 EX, 520 EM, nm-cycle time, 90 s) for measurements of the background followed by 70 μL of freshly prepared 2,2′-azobis (2-amidinopropane) dihydrochloride (AAPH) and 300 mM was added directly to each well “96-well plate, n = 3”. Fluorescence measurements (485 EX, 520 EM, nm) was continued for an hour at (40 cycles, each 90 s). Trolox standard curve was prepared using serial concentrations of 50, 100, 200, 400, 500, 800, and 1000 μM in 1 mM of methanol.

4.3.3. ABTS Radical Scavenging Assay

The antioxidant ABTS “2, 2′-azino-bis (3-ethylbenzothiazoline-6-sulfonic acid)” assay was conducted as in the method described by Arnao et al. [42] with minor modifications to suit microplate recording. ABTS reagent (192 mg) was dissolved in distilled H2O and adjusted to 50 mL. Then, 1 mL of the prepared solution was added to 17 µL (140 mM potassium persulphate). The mixture was left in the dark at room temperature for 24 h, and then 1 mL of the reaction mixture was completed to 50 mL with methanol to obtain a final ABTS reagent for the assay. The freshly prepared ABTS (190 µL) was mixed with each sample of volume of 10 µL in the 96-well plate (n = 6). The reaction was incubated in the dark for half an hour. The 5 test samples were prepared separately in serial dilutions of 5, 20, 40, 60, 80, and 100 µg/mL, whereas the Trolox standard serial concentrations were 1.64, 3.28, 6.57, 13.15, 26.31, and 39.47 µM. Quenching of ABTS coloration was measured at λ 734 nm.

4.3.4. DPPH Radical Scavenging Assay

The antioxidant IC50 of the 5 test samples were further investigated using DPPH free radical protocol following the procedure described by Boly et al. [43]. DPPH (100 μL) in concentration (0.1% in methanol) was added to each sample (100 μL) in a 96-well plate (n = 6). The reaction was incubated at 37 °C for 30 min. in the dark. The reduction in color intensity of the DPPH was measured at λ 540 nm. The samples’ serial dilution was prepared each from stock solution in methanol “1 mg/mL” in dilutions of 100–1000 µg/mL, whereas Trolox (100 µM in methanol) serial dilutions were 10, 15, 20, 30, 40, and 50 µM.

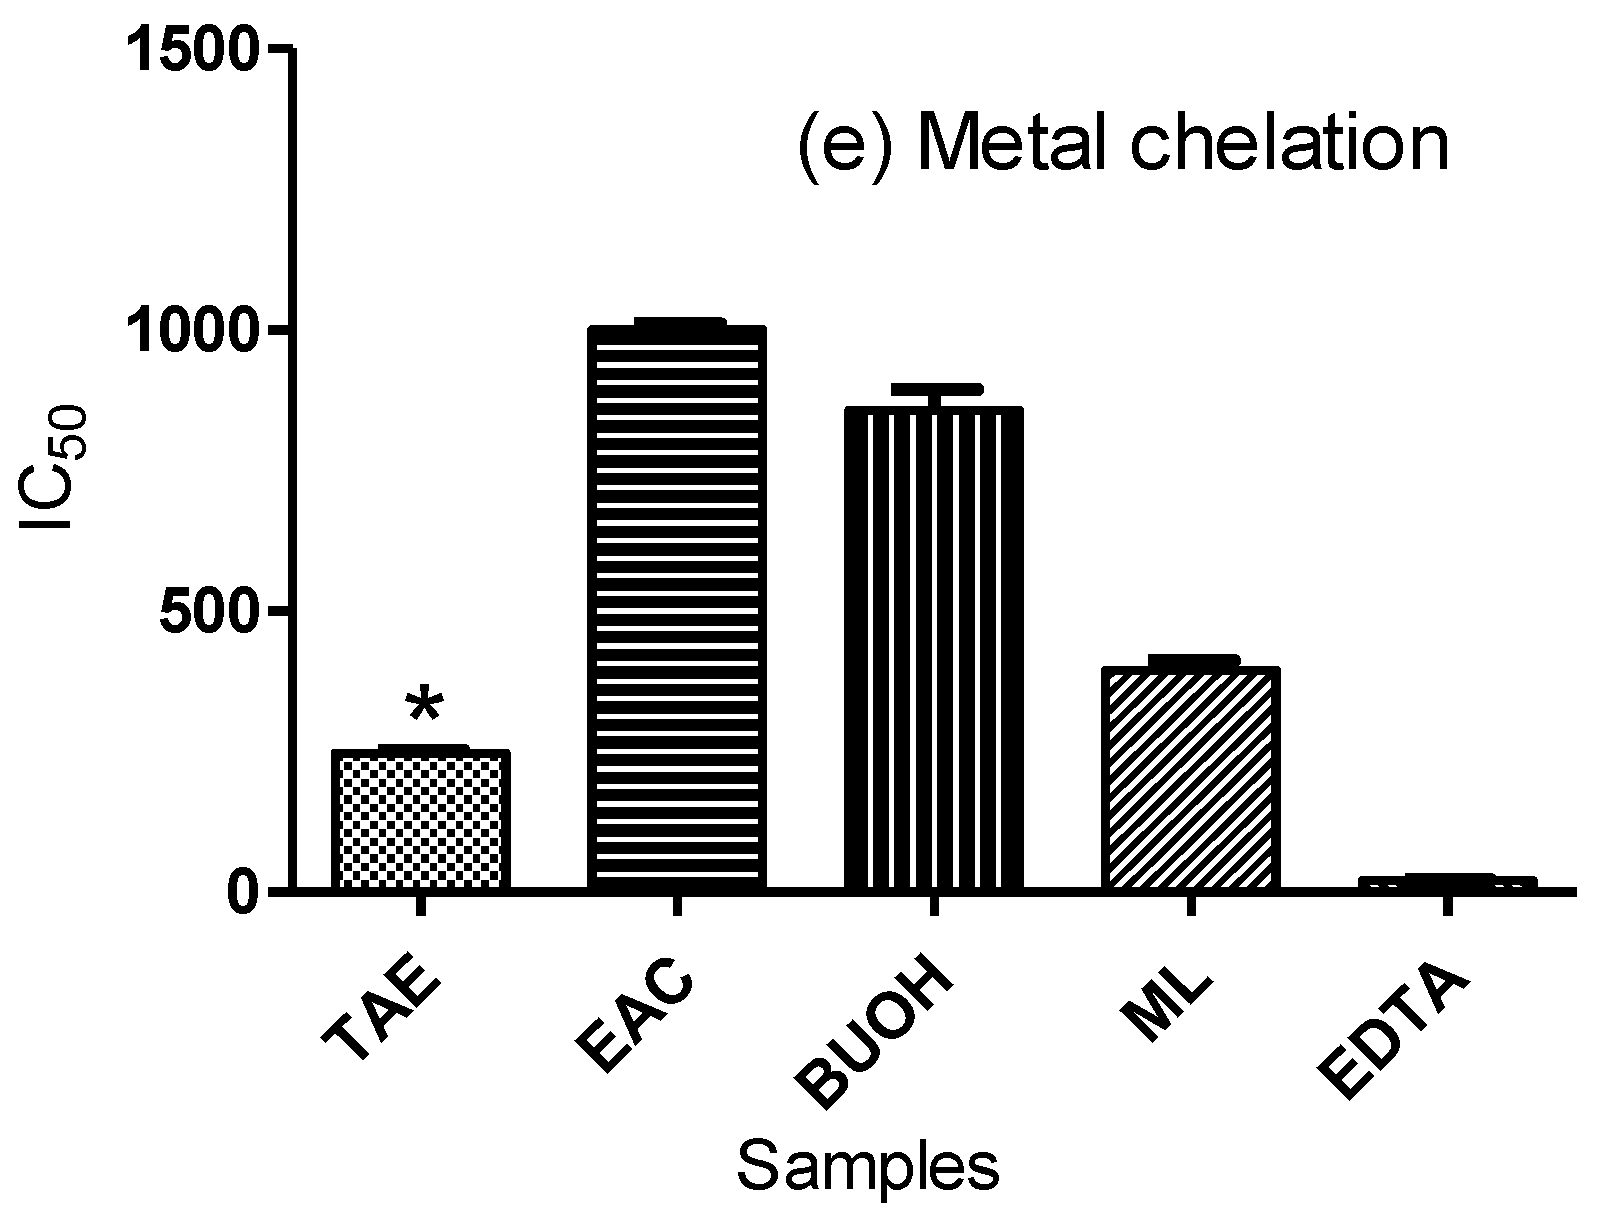
4.3.5. Metal Chelation Assay

Metal chelation assay was conducted as previously described by Santos et al. [44]. A 20 µL of freshly prepared ferrous sulphate (0.3 mM) was mixed with 50 µL of each of the 5 test samples separately in 96 well plate (n = 3). A 30 µL of ferrozine (0.8 mM) was added to each well. Serial dilutions of 200, 400, 600, 800, and 1000 µg/mL for each sample was prepared as well as EDTA serial dilutions of 2.5, 5, 10, 20, and 25 µM from (0.05 mM) stock solution. Reaction mixtures were left for 10 min in dark at 37 °C. Quenching of the generated color intensity was assessed at λ 562 nm.

4.4. Evaluation of the Antimicrobial Activity

4.4.1. Well Diffusion Assay

Both Staphylococcus aureus and Escherichia coli were pre-cultured in Mueller Hinton broth (MHB) overnight in a rotary shaker at 37 °C. Afterwards, each strain was adjusted at a concentration of 108 cells/mL using 0.5 of McFarland standard [45]. Sabouraud dextrose broth (SDB) was used to prepare fungal inoculum after the 48 h culture of fungal isolates [46]. The spore density of Candida albicans was adjusted to a final concentration of 106 spores/mL using a spectrophotometer (A595 nm). Screening of the antibacterial and antifungal activities of different samples was done using Agar well diffusion method [47]. Using a sterile Petri dish, one ml of fresh bacterial or fungi culture was pipetted in the center. Molten cooled Muller Hinton agar (MHA) for bacteria and Sabouraud dextrose agar (SDA) for fungi was then poured into the Petri dish containing the inoculum then mixed well. After agar solidification, a sterile cork borer was used to make wells into agar dishes containing inoculums (6 mm in diameter); each plate contained 6 wells. This was followed by addition of 100 μL of each extract (20% w/v) to respective wells in each dish. Then, the plates were refrigerated for 30 min to allow the diffusion of the extracts into the agar. Afterwards, the plates were incubated at 37 °C for 18 h. Antimicrobial activity was detected by measuring the zone of inhibition (including the wells diameter) appeared after the incubation period. Gentamycin (4 μg/mL) and ketoconazole (100 μg/mL) were used as positive controls for bacteria and fungi, respectively, while 10% DMSO was used as a negative control.

4.4.2. Minimum Inhibitory Concentration (MIC)

Broth dilution method was used for MIC determination using 96-well microplates. Serial dilutions (100 μL) of the tested extracts were used covering the concentration range of 62.5 to 4000 μg/mL in Mueller–Hinton broth (Sigma–Aldrich, St. Louis, MO, USA). Bacterial inocula (100 μL) were prepared from 18-h broth culture (containing 105 cfu/mL), then poured into the wells. This was followed by incubation at 37 °C for 24 h. Three triplicates were made.

4.5. Metabolite Profiling of Celery Extract Using UPLC/ESI/TOF-MS

4.5.1. Celery Extract Preparation

Examination was carried out in accordance to the procedure described by Mohammed et al. [48]. Stock solutions of the active celery extracts (TAE) and (DCM) were prepared using 50 mg of each extract, dissolved separately in 1 ml of a reconstitution solvent composed of (water:methanol:acetonitrile, 50:25:25 V/V). Mixtures were vortexed for 2 min, dissolved completely by ultra-sonication for 10 min then centrifuged at 10,000 rpm for 5 min. Fifty µL of stock solutions were diluted to 1000 µL using the reconstitution solvent to obtain a final concentration of 2.5 µg/µL. Ten µL of each prepared sample was injected in both positive and negative ionization modes. The LC-MS analysis procedure was also applied for blank, quality control samples, and internal standard used for validation of the experiment setup.

4.5.2. Instrument and Spectral Acquisition

The analysis was performed using an ExionLC analytical UHPLC system (SCIEX, Framingham, USA) equipped with a column (Waters, Xbridge C-18, 50 × 2.1 mm, 3 µm particle size) operated at 40 °C, and precolumn (In-Line filter discs, Phenomenex, 0.5 µm × 3.0 mm). There were 3 mobile phases used: mobile phase (A) 5 mM of ammonium formate buffer pH 3 in 1% methanol, mobile phase (B) 5 mM of ammonium formate buffer pH 8 in 1% methanol, and mobile phase (C) 100% acetonitrile. Solvents (B) and (C) were used for the negative ion mode, while solvents (A) and (C) were used for the positive ion mode. Gradient elution was performed at a flow rate of 0.3 mL/min at 40 °C, where from 0 to 1 min, isocratic (90% (A or B), 10% (C)), from 21 to 25 min, isocratic 10% (A) or (B), to 90% (C). From 25.01 to 28 min, elution was isocratic (90% (A or B), 10% (C)), until equilibrium.
Mass spectrometry was performed using a Triple TOF 5600+ system, operating in the ESI mode and having a Duo-Spray source (SCIEX, Concord, ON, Canada). The sprayer and declustering voltages were set at 4500 and 80 eV in the positive ESI mode, and −4500 and −80 V in the negative ESI mode. Source temperature = 600 °C, collision energy = 35 V/−35 V in positive/negative modes, CE spreading 20 V, and the ion tolerance for 10 ppm were used. IDA protocol (information-dependent acquisition) was used for TripleTOF5600+ operation. MS/MS data were generated using Analyst-TF 1.7.1 software. Full-scan MS and MS/MS information of high-resolution survey spectra from 50 to 1100 m/z were obtained.

4.5.3. UPLC/ESI/TOF-MS Data Processing

Peakview 2.2 software (SCIEX, Framingham, MA, USA) was used for data processing and to record the retention time and masses of the detected molecules (Tsugawa, Cajka et al. 2015). The detected masses ranged from 50 to 1000 Da. Metabolites were assigned tentatively by matching mass spectral data of the identified metabolites in both ionization modes with reported data provided in online libraries and databases (Human Metabolome Database and Pubchem), alongside retention times and fragmentation patterns comparison to reference standards whenever possible.

5. Conclusions

To cope with the growing demands of pharmaceutical industry for biologically active natural extracts it is crucial to extract medicinal plants in a proper manner. Medicinal plant extracts with evidently strong antioxidant activity will by far pertain to accentuated pharmacological actions. In this study, the polyphenol enriched extract prepared by water extraction of celery aerial parts exhibited evident antioxidant capacity in response to an array of different assays as well as promising antibacterial activity. UPLC/ESI/TOF-MS profiling verified the accumulation of flavonoids, phenylpropanoids, and other active secondary metabolites in this extract and recommends its incorporation in dietary supplements. The research workflow adopted herein can be applied to other edible and/or medicinal plants for probing their antioxidant and antimicrobial potentials as a preliminary step for exploring their pharmacological effectiveness.

Supplementary Materials

The following are available online, Figure S1: ESI-MS/MS Spectrum of peak (5) in the positive ion mode, Figure S2: ESI-MS/MS Spectrum of peak (6) in the negative ion mode, Figure S3: ESI-MS/MS Spectrum of peak (7) in the positive ion mode, Figure S4: ESI-MS/MS Spectrum of peak (3) in the positive ion mode, Figure S5: ESI-MS/MS Spectrum of peak (4) in the positive ion mode, Figure S6: ESI-MS/MS Spectrum of peak (9) in the positive ion mode, Figure S7: ESI-MS/MS Spectrum of peak (10) in the positive ion mode, Figure S8: ESI-MS/MS Spectrum of peak (32) in the positive ion mode, Figure S9: ESI-MS/MS Spectrum of peak (21) in the positive ion mode, Figure S10: ESI-MS/MS Spectrum of peak (22) in the negative ion mode, Figure S11: ESI-MS/MS Spectrum of peak (28) in the positive ion mode, Figure S12: ESI-MS/MS Spectrum of peak (25) in the positive ion mode, Figure S13: ESI-MS/MS Spectrum of peak (34) in the negative ion mode, Figure S14: ESI-MS/MS Spectrum of peak (36) in the negative ion mode, Figure S15: ESI-MS/MS Spectrum of peak (37) in the positive ion mode, Figure S16: ESI-MS/MS Spectrum of peak (63) in the negative ion mode, Figure S17: ESI-MS/MS Spectrum of peak (75) in the negative ion mode, Figure S18: ESI-MS/MS Spectrum of peak (78) in the positive ion mode.

Author Contributions

A.M.E., D.M.R., R.F.E.-K., D.M.E.-K. Conceptualization; Investigation, Methodology, and Data analysis, Writing—original draft, A.M.E., D.M.R., R.F.E.-K., D.M.E.-K.; Writing—review and editing, A.M.E., D.M.R., R.F.E.-K., D.M.E.-K.; Resources, A.M.E.; Equal contribution, A.M.E. and D.M.R. contributed equally to this work. All authors have read and agreed to the published version of the manuscript.

Funding

This research received no external funding.

Institutional Review Board Statement

Not applicable.

Informed Consent Statement

Not applicable.

Data Availability Statement

Data are available upon request from the corresponding author (A.M.E.).

Conflicts of Interest

The authors declare no conflict of interest.

Sample Availability

Samplesare available from the authors.

References

  1. Kelly, F.J. Use of antioxidants in the prevention and treatment of disease. J. Int. Fed. Clin. Chem. 1998, 10, 21–23. [Google Scholar] [PubMed]
  2. Zhang, Y.-J.; Gan, R.-Y.; Li, S.; Zhou, Y.; Li, A.-N.; Xu, D.-P.; Li, H.-B. Antioxidant Phytochemicals for the Prevention and Treatment of Chronic Diseases. Molecules 2015, 20, 21138–21156. [Google Scholar] [CrossRef] [PubMed]
  3. Halliwell, B. Protection against tissue damage in vivo by desferrioxamine: What is its mechanism of action? Free Radic. Biol. Med. 1989, 7, 645–651. [Google Scholar] [CrossRef]
  4. Li, A.-N.; Li, S.; Zhang, Y.-J.; Xu, X.-R.; Chen, Y.-M.; Li, H.-B. Resources and Biological Activities of Natural Polyphenols. Nutrients 2014, 6, 6020–6047. [Google Scholar] [CrossRef] [PubMed]
  5. Wong, S.P.; Leong, L.P.; Koh, J.H.W. Antioxidant activities of aqueous extracts of selected plants. Food Chem. 2006, 99, 775–783. [Google Scholar] [CrossRef]
  6. Branković, S.; Kitić, D.; Radenković, M.; Veljković, S.; Kostić, M.; Miladinović, B.; Pavlović, D. Hypotensive and cardioinhibotory effects of the aqueous and ethanol extracts of celery (Apium graveolens, Apiaceae). Acta Med. Median. 2010, 49, 13–16. [Google Scholar]
  7. Sorour, M.A.; Hassanen, N.H.M.; Ahmed, M.H.M. Natural Antioxidant Changes in Fresh and Dried celery (Apium graveolens). Am. J. Energy Eng. 2015, 3, 12. [Google Scholar] [CrossRef] [Green Version]
  8. Chaudhary, S.K.; Ceska, O.; Warrington, P.J.; Ashwood-Smith, M.J. Increased furocoumarin content of celery during storage. J. Agric. Food Chem. 1985, 33, 1153–1157. [Google Scholar] [CrossRef]
  9. Khairullah, A.R.; Solikhah, T.I.; Ansori, A.N.M.; Hidayatullah, A.R.; Hartadi, E.B.; Ram, S.C.; Fadholly, A. Review on the Pharmacological and Health Aspects of Apium Graveolens or Celery: An Update. Syst. Rev. Pharm. 2021, 12, 606–612. [Google Scholar]
  10. Brahmachari, G. Spectroscopic Properties of Natural Flavonoids; World Scientific: Singapore, 2018. [Google Scholar]
  11. Rasheed, D.M.; Emad, A.M.; Ali, S.F.; Ali, S.S.; Farag, M.A.; Meselhy, M.R.; Sattar, E.A. UPLC-PDA-ESI/MS metabolic profiling of dill shoots bioactive fraction; evidence of its antioxidant and hepatoprotective effects in vitro and in vivo. J. Food Biochem. 2021, 45, e13741. [Google Scholar] [CrossRef]
  12. Zhou, K.; Zhao, F.; Liu, Z.; Zhuang, Y.; Chen, L.; Qiu, F. Triterpenoids and Flavonoids from Celery (Apium graveolens). J. Nat. Prod. 2009, 72, 1563–1567. [Google Scholar] [CrossRef] [PubMed]
  13. Welch, C.R.; Wu, Q.; Simon, J.E. Recent Advances in Anthocyanin Analysis and Characterization. Curr. Anal. Chem. 2008, 4, 75–101. [Google Scholar] [CrossRef] [PubMed] [Green Version]
  14. Farag, M.A.; Khattab, A.R.; Maamoun, A.A.; Kropf, M.; Heiss, A.G. UPLC-MS metabolome-based classification of Lupinus and Lens seeds: A prospect for phyto-equivalency of its different accessions. Food Res. Int. 2018, 115, 379–392. [Google Scholar] [CrossRef] [PubMed]
  15. Matos, M.J.; Santana, L.; Uriarte, E.; Abreu, O.A.; Molina, E.; Yordi, E.G. Coumarins—An important class of phytochemicals. Phytochem.-Isol. Characterisation Role Hum. Health 2015, 25, 533–538. [Google Scholar]
  16. Dercks, W.; Trumble, J.; Winter, C. Impact of atmospheric pollution on linear furanocoumarin content in celery. J. Chem. Ecol. 1990, 16, 443–454. [Google Scholar] [CrossRef]
  17. Beltagy, A.M.; Beltagy, D.M. Chemical composition of Ammi visnaga L. and new cytotoxic activity of its constituents Khellin and Visnagin. J. Pharm. Sci. Res. 2015, 7, 285. [Google Scholar]
  18. Zengin, G.; Sinan, K.I.; Ak, G.; Mahomoodally, M.F.; Paksoy, M.Y.; Picot-Allain, C.; Glamočlija, J.; Sokovic, M.; Jekő, J.; Cziáky, Z.; et al. Chemical profile, antioxidant, antimicrobial, enzyme inhibitory, and cytotoxicity of seven Apiaceae species from Turkey: A comparative study. Ind. Crop. Prod. 2020, 153, 112572. [Google Scholar] [CrossRef]
  19. Fiorito, S.; Preziuso, F.; Sharifi-Rad, M.; Marchetti, L.; Epifano, F.; Genovese, S. Auraptene and umbelliprenin: A review on their latest literature acquisitions. Phytochem. Rev. 2020, 1–10. [Google Scholar] [CrossRef]
  20. Emad, A.M.; Ali, S.F.; Abdel-Rahman, E.A.; Meselhy, M.R.; Farag, M.A.; Ali, S.S.; Abdel-Sattar, E.A. Anti-inflammatory and antioxidant effects of Apium graveolens L. extracts mitigate against fatal acetaminophen-induced acute liver toxicity. J. Food Biochem. 2020, 44, e13399. [Google Scholar] [CrossRef]
  21. Kolarovic, J.; Popovic, M.; Zlinská, J.; Trivic, S.; Vojnovic, M. Antioxidant Activities of Celery and Parsley Juices in Rats Treated with Doxorubicin. Molecules 2010, 15, 6193–6204. [Google Scholar] [CrossRef] [Green Version]
  22. Li, P.; Jia, J.; Zhang, D.; Xie, J.; Xu, X.; Wei, D. In vitro and in vivo antioxidant activities of a flavonoid isolated from celery (Apium graveolens L. var. dulce). Food Funct. 2013, 5, 50–56. [Google Scholar] [CrossRef] [PubMed]
  23. Uddin, Z.; Shad, A.A.; Bakht, J.; Ullah, I.; Jan, S. In vitro antimicrobial, antioxidant activity and phytochemical screening of Apium graveolens. Pak. J. Pharm. Sci. 2015, 28, 1699–1704. [Google Scholar] [PubMed]
  24. Masuoka, N.; Matsuda, M.; Kubo, I. Characterisation of the antioxidant activity of flavonoids. Food Chem. 2012, 131, 541–545. [Google Scholar] [CrossRef]
  25. Xiao, J. Dietary flavonoid aglycones and their glycosides: Which show better biological significance? Crit. Rev. Food Sci. Nutr. 2017, 57, 1874–1905. [Google Scholar] [CrossRef]
  26. Al-Majedy, Y.; Al-Amiery, A.; Kadhum, A.A.; BakarMohamad, A. Antioxidant activity of coumarins. Syst. Rev. Pharm. 2017, 8, 24. [Google Scholar] [CrossRef]
  27. Gülçin, I. Antioxidant activity of caffeic acid (3,4-dihydroxycinnamic acid). Toxicology 2006, 217, 213–220. [Google Scholar] [CrossRef]
  28. Arsenie, L.V.; Lacatusu, I.; Oprea, O.; Bordei, N.; Bacalum, M.; Badea, N. Azelaic acid-willow bark extract-panthenol—Loaded lipid nanocarriers improve the hydration effect and antioxidant action of cosmetic formulations. Ind. Crop. Prod. 2020, 154, 112658. [Google Scholar] [CrossRef]
  29. Baldioli, M.; Servili, M.; Perretti, G.; Montedoro, G. Antioxidant activity of tocopherols and phenolic compounds of virgin olive oil. J. Am. Oil Chem. Soc. 1996, 73, 1589–1593. [Google Scholar] [CrossRef]
  30. Khotimah, H.; Diyantoro, D.W.I.; Sundari, A.S. Screening In Vitro Antimicrobial Activity of Celery (Apium graveolens) against Staphylococcus sp. Malays. J. Med. Health Sci. 2020, 16, 72–77. [Google Scholar]
  31. Prakoso, Y.A.; Rini, C.S.; Rahayu, A.; Sigit, M.; Widhowati, D. Celery (Apium graveolens) as a potential antibacterial agent and its effect on cytokeratin-17 and other healing promoters in skin wounds infected with methicillin-resistant Staphylococcus aureus. Vet. World 2020, 13, 865–871. [Google Scholar] [CrossRef]
  32. Mickymaray, S. Efficacy and Mechanism of Traditional Medicinal Plants and Bioactive Compounds against Clinically Important Pathogens. Antibiotics 2019, 8, 257. [Google Scholar] [CrossRef] [Green Version]
  33. Al Aboody, M.S.; Mickymaray, S. Anti-Fungal Efficacy and Mechanisms of Flavonoids. Antibiotics 2020, 9, 45. [Google Scholar] [CrossRef] [PubMed] [Green Version]
  34. Lim, S.S.; Selvaraj, A.; Ng, Z.Y.; Palanisamy, M.; Mickmaray, S.; Cheong, P.C.H.; Lim, R.L.H. Isolation of actinomycetes with antibacterial activity against multi-drug resistant bacteria. Malays. J. Microbiol. 2018, 14, 293–305. [Google Scholar] [CrossRef]
  35. Shelef, L. Antimicrobial effects of spices. J. Food Saf. 1984, 6, 29–44. [Google Scholar] [CrossRef]
  36. Farbood, M.I.; MacNeil, J.H.; Ostovar, K. Effect of Rosemary Spice Extractive on Growth of Microorganisms in Meats. J. Milk Food Technol. 1976, 39, 675–679. [Google Scholar] [CrossRef]
  37. Nikaido, H.; Vaara, M. Molecular basis of bacterial outer membrane permeability. Microbiol. Rev. 1985, 49, 1–32. [Google Scholar] [CrossRef] [PubMed]
  38. Christova-Bagdassarian, V.; Bagdassarian, K.S.; Atanassova, M. Phenolic profile: Antioxidant and antibacterial activities from the Apiaceae family (dry seeds). Mintage J. Pharm. Med. Sci. 2013, 2, 26–31. [Google Scholar]
  39. Suganya, S.; Bharathidasan, R.; Senthilkumar, G.; Madhanraj, P.; Panneerselvam, A. Antibacterial activity of essential oil extracted from Coriandrum sativam (L.) and GC-MS analysis. Chem. Pharm. Res. 2012, 4, 1846–1850. [Google Scholar]
  40. Benzie, I.F.F.; Strain, J.J. The ferric reducing ability of plasma (FRAP) as a measure of “antioxidant power”: The FRAP assay. Anal. Biochem. 1996, 239, 70–76. [Google Scholar] [CrossRef] [Green Version]
  41. Liang, Z.; Cheng, L.; Zhong, G.-Y.; Liu, R.H. Antioxidant and Antiproliferative Activities of Twenty-Four Vitis vinifera Grapes. PLoS ONE 2014, 9, e105146. [Google Scholar] [CrossRef]
  42. Arnao, M.B.; Cano, A.; Acosta, M. The hydrophilic and lipophilic contribution to total antioxidant activity. Food Chem. 2001, 73, 239–244. [Google Scholar] [CrossRef]
  43. Boly, R.; Lamkami, T.; Lompo, M.; Dubois, J.; Guissou, I. DPPH free radical scavenging activity of two extracts from Agelanthus dodoneifolius (Loranthaceae) leaves. Int. J. Toxicol. Pharmacol. Res. 2016, 8, 29–34. [Google Scholar]
  44. Santos, J.S.; Brizola, V.R.A.; Granato, D. High-throughput assay comparison and standardization for metal chelating capacity screening: A proposal and application. Food Chem. 2017, 214, 515–522. [Google Scholar] [CrossRef] [PubMed]
  45. Bhalodia, N.R.; Shukla, V. Antibacterial and antifungal activities from leaf extracts of Cassia fistula l.: An ethnomedicinal plant. J. Adv. Pharm. Technol. Res. 2011, 2, 104–109. [Google Scholar] [CrossRef]
  46. Nisha, M.; Subramanian, M.; Prathyusha, P.; Santhanakrishnan, R. Comparative studies on antimicrobial activity of Artemisia sieversiana Ehrhart. Ex. Willd. and Origanum vulgare L. Int. J. PharmTech Res. 2010, 2, 1124–1127. [Google Scholar]
  47. Daoud, A.; Malika, D.; Bakari, S.; Hfaiedh, N.; Mnafgui, K.; Kadri, A.; Gharsallah, N. Assessment of polyphenol composition, antioxidant and antimicrobial properties of various extracts of Date Palm Pollen (DPP) from two Tunisian cultivars. Arab. J. Chem. 2019, 12, 3075–3086. [Google Scholar] [CrossRef] [Green Version]
  48. Mohammed, H.A.; Khan, R.A.; Abdel-Hafez, A.A.; Abdel-Aziz, M.; Ahmed, E.; Enany, S.; Mahgoub, S.; Al-Rugaie, O.; Alsharidah, M.; Aly, M.S.A.; et al. Phytochemical Profiling, In Vitro and In Silico Anti-Microbial and Anti-Cancer Activity Evaluations and Staph GyraseB and h-TOP-IIβ Receptor-Docking Studies of Major Constituents of Zygophyllum coccineum L. Aqueous-Ethanolic Extract and Its Subsequent Fractions: An Approach to Validate Traditional Phytomedicinal Knowledge. Molecules 2021, 26, 577. [Google Scholar] [PubMed]
Figure 1. Antioxidant activities of aqueous celery extract and fractions thereof assessed by: (a) FRAP, (b) ORAC, (c) ABTS, (d) DPPH, (e) metal chelation protocols. TAE: total aqueous extract, DCM: dichloromethane fraction, EAC: ethyl acetate fraction, BUOH: butanol fraction, and ML: remaining mother liquor. In metal chelation protocol (e): DCM fraction was not detectable by this assay. *: significant antioxidant activity.
Molecules 27 00698 g001aMolecules 27 00698 g001b
Figure 2. Representative UPLC/TOF-MS base peak chromatograms of celery: (A) TAE in negative ESI mode, (B) TAE in positive ESI mode, (C) DCM in negative ESI mode, and (D) DCM in positive ESI mode. Annotated peak numbers follow those listed in Table 3.
Molecules 27 00698 g002
Figure 3. Phytochemical classes of the 115 metabolites tentatively identified in (TAE) extract using UPLC/ESI/TOF-MS.
Molecules 27 00698 g003
Table 1. Antioxidant activity of the total aqueous extract of celery aerial parts (TAE) and fractions thereof; (DCM), (EAC), (BUOH), and (ML) by various protocols.
Antioxidant AssayTAE
(Average ± SD)
DCM
(Average ± SD)
EAC
(Average ± SD)
BUOH
(Average ± SD)
ML
(Average ± SD)
FRAP
μM TE/mg sample
45.57 ± 4.46233.47 ± 15.1476.80 ± 9.6819.75 ± 19.7653.47 ± 5.02
ORAC
μM TE/mg sample
558.74 ± 45.901076 ± 25.73888.83 ± 70.50890.18 ± 53402.02 ± 23.18
ABTS “IC50
µg/ml
34.52 ± 3.2537.78 ± 1.24103.7 ± 4.4732.56 ± 0.09100.0 ± 0.58
DPPH “IC50
µg/ml
930.8 ± 42.50474.4 ± 19.80591.4 ± 27.051119 ± 62.30973.4 ± 50.21
Metal chelation “IC50
µg/ml
246.6 ± 5.78nd1000 ± 10.40856.7 ± 37.13394.1 ± 17.81
nd: not detected under experimental conditions.
Table 2. Antimicrobial activity of total aqueous extract of celery aerial parts (TAE) and fractions thereof; (DCM), (EAC), (BUOH), and (ML) against three microorganisms.
TAE
Average (mm) ± SD
DCM
Average (mm) ± SD
EAC
Average (mm) ± SD
BUOH
Average (mm) ± SD
ML
Average (mm) ± SD
Zones of inhibition
Staphylococcus aureus13.4 ± 1.512.0 ±1.0ndndnd
Escherichia coli11.0 ± 1.210.0 ± 1.3ndndnd
Candida albicansndndndndnd
nd: no zone of inhibition was detected.
Table 3. Metabolites tentatively identified in (TAE) and (DCM) of celery aerial parts (Apium graveolens L.) via UPLC/ESI/TOF-MS in negative and positive ESI ionization modes.
Peak #Rt (min.)Metabolite NameMol. Ion m/z (−)/(+)Elemental
Composition
Δ Mass
(ppm)
MS2 Ions m/z
(−)/(+)
DCM
Fraction
Flavonoids
18.00Noidesol A479.11841C22H23O120.02451.12241, 317.06561
29.53Apigenin-C-dihexoside593.14972/
595.16516
C27H29O15/
C27H31O15+
0.64/
−0.98
473.10767, 353.06583/577.15472, 457.11240, 325.07031
310.12Apigenin-O-dihexosyl pentoside727.20697C32H39O19+−1.42595.16425,433.11163, 271.05960
410.35Chrysoeriol-O-dihexosyl pentoside757.21661C33H41O20+−1.36625.17542,463.12268, 301.07040, 286.04706
510.85/10.95Luteolin-O-hexosyl pentoside *579.13342/
581.14941
C26H27O15/
C26H29O15+
1.77/
−1.18
447.09232,285.03989/449.10730,
287.05487
611.40/14.02Apiin *563.13843/
565.15326
C26H27O14/
C26H29O14+
1.96/
−3.401
431.09698,269.04495/433.11264, 271.06009
711.50/12.13Chrysoeriol-O-hexosyl pentoside *593.14832/
595.16650
C27H29O15/
C27H31O15+
2.96/
1.26
461.10800,299.05548, 284.03226/463.12268, 301.07031
812.10Chrysoeriol malonyl-O- hexosyl pentoside681.16431C30H33O18+0.12549.12354, 301.07050
912.15apigenin-O-dihexosyl deoxy hexoside739.1839/
741.20148
C36H35O17/
C36H37O17+
−1.41545.12793, 269.04468/579.14844, 433.11194, 271.05972
1012.37Chrysoeriol-O-hexoside deoxyhexoside hexoside771.21106C37H39O18+−1.53463.12256, 301.07043
1112.56Apigenin-O-acyl hexosyl pentoside607.16412C28H31O15+−2.68475.12262, 271.05981
1212.68Luteolin287.05487C15H11O6+−0.50270.14902, 258.05222+
1312.75Chrysoeriol acyl-O-hexosyl pentoside637.17535C29H33O16+−1.51505.13290, 301.07010
1413.31Apigenin diacyl-O-deoxyhexosyl pentoside *633.17981C30H33O15+−0.86501.13834, 271.05984
1513.39/13.43Apigenin269.04465/271.05981C15H9O5/
C15H11O5+
0.74/
−1.07
225.05508,149.02399/214.09019, 153.01828+
1613.73Chrysoeriol301.07059C16H13O6+−0.25286.04684, 181.04985+
1714.03Apigenin-O-hexosyl dimethyl caffoeyl-C-pentoside761.2627C37H45O17+7.79/
4.52
629.22205, 271.06000
1819.93Apigenin-O-acyl (trimethyl ether) methoxy galloyl quinoyl (acyl pentosyl) pentoside803.38306C42H59O15+−2.23671.34082, 271.05969
Coumarins and Benzofurans
190.95Methylumbelliferyl acetate217.048C12H9O4−6.94181.07140
202.30Aesculin339.07104C15H15O9−0.05177.01891
216.78Isofraxidin *223.0602C11H11O5+0.45208.03674, 163.03891
227.41Isofraxidin-O-hexoside383.0943C17H19O10−3.76221.04509, 193.05090
239.09Umbellifolide265.14282C15H21O4+−2.32247.13225,203.10645, 175.07507
249.90Dihydroxybiscoumarin323.05542C18H11O6+1.26295.05978, 267.06494, 149.02306
2510.66Isopimpinellin-O-hexoside409.11224C19H21O10+−1.67247.06020
2612.92Cleomiscosin A387.10712C20H19O8+−0.84369.09616, 337.07004, 161.05956
2713.05Licocoumarone341.1376C20H21O5+−2.20323.12717, 271.09604, 137.05949
2813.53Khellin261.07565C14H13O5+−0.38246.05215
2913.54Visnagin/Desmethoxykhellin231.065C13H11O4+−0.80216.04149, 175.03882+
3013.60Encecalin/methyleupatoriochromene233.11469C14H17O3+−10.86217.04517+
3114.35Senkyunolide F205.08675C12H13O3−4.04161.09692, 148.01640, 132.05791+
3214.70Isopimpinellin (Dimethoxypsoralen)247.06464C13H11O5+−1.34232.03647+
3316.48Marmesin245.08145C14H13O4−2.51203.03471, 161.02415+
Phenylpropanoids
344.17/3.70Caffeoylquinic acid353.08698/355.10165C16H17O9/C16H19O9+0.77/
−1.99
233.04478, 191.05551, 179.03462/337.09155, 289.07062, 193.04955, 163.03885
355.09Caffeic acid179.03452C9H7O4−3.55135.04529+
368.73/8.86Coumaroylquinic acid337.09204/339.10663C16H17O8/
C16H19O8+
0.73/
−2.40
191.05577, 163.03981/147.04385
379.84Feruloylquinic acid369.11801C17H21O9+0.00177.05449, 145.02818
3810.79Dillapional-O-dihexoside559.16492C24H31O15−1.48397.11212, 235.06065
3911.07Dimethoxyfuranohydrocoumaroyl-O-dihexoside *589.17474C25H33O161.12427.12338, 265.07101
4015.12Octyl methoxycinnamate291.19534C18H27O3+−0.45273.18475+
Aliphatic acids and Phenolic acids/glycosides
412.48Elenolic acid241.07C11H13O60.72153.01907, 109.02943+
423.09Hydroxyisophthalic acid181.01372C8H5O5−3.15137.02428
433.68Monotropeoside445.1333C19H25O12−1.62427.1212,385.1129, 269.1021
443.93Isopropylmalic acid175.06C7H11O53.31157.05049, 115.04002, 113.06070+
454.382-Hydroxyisocaproic acid hexoside293.12308C12H21O8−0.05131.07114+
465.31Vanilloloside317.12027C14H21O8+−8.91299.10376, 203.05258, 185.04211,
479.70Syringoylquinic acid371.09723C16H19O10−0.12249.06111
4811.09Hydroxypropofol O-glucuronide369.15372C18H25O8−1.83351.14371, 311.11267
4911.10Ptelatoside A *413.1438C19H25O100.23351.14352, 311.11240, 269.10214
5011.78Azelaic acid187.09712C9H15O43.39125.09694+
5111.82Ptelatoside B427.15964C20H27O10−0.55325.12830, 161.04520
5212.73Dihydrogalloyl-O-hexoside *329.19583C17H29O6−0.11161.04507+
Iridoids
531.34Adenosmoside363.16559C16H27O9−1.74241.00191+
542.61Geniposidic acid375.12534C16H23O10+−8.62313.12543, 231.08340
553.08Acetylloganic acid419.15076C18H27O11+−9.61357.15198, 275.11020
563.83Tudoside417.10211C17H21O12−1.54285.06100, 241.07098, 152.01129
576.36Geniposide *389.14102C17H25O10+−8.23327.14093, 245.09958,
588.50Sweroside357.11835C16H21O90.96193.05029
5916.01Valdiate *311.18552C17H27O5+0.71293.17484, 255.12274, 237.11218+
Terpenes
605.89Euonyminol365.14465C15H25O10−1.49303.14508, 263.11276, 221.10072
616.64Phyllaemblic acid B349.15143C15H25O9+−6.08331.12054, 193.12245, 127.03888
627.46Anisatin327.10745C15H19O80.02165.05574, 147.04503+
639.31Citroside A385.18555C19H29O8−0.38249.1127, 205.1230, 179.0558
649.75Unknown diterpene acetate371.22006C23H31O4+−4.38327.20108, 283.17490, 221.13826, 177.11200, 133.08582
659.98Unknown triterpene553.37134C31H53O8+−3.89535.35925, 351.23840, 267.13351
6610.02Corchoionoside B399.16492C19H27O9−0.10381.15445, 341.12338, 299.11298
6711.70Diacetoxyl epoxy-apotirucallenetetraol589.37207C34H53O8+−2.42513.32635
6812.45Fruticoside E645.40393C37H57O9−2.28569.35181, 511.31049
6913.22Unknown terpene469.33075C30H45O4+−1.04451.31940
7013.34Tragopogonsaponin A647.37665C36H55O10−3.59485.32437,
7113.36Quillaic acid487.34097C30H47O5+−1.71469.33044, 451.31979
7213.83Unknown terpene427.26733C23H39O7+−3.98409.25574, 269.13644
7315.36Amaranthussaponin955.48846C48H75O19−1.30731.43488, 523.37750, 453.33609
7416.43Momordicinin439.35724C30H47O2+0.42421.34732, 393.35141
7516.72Auraptene297.15207C19H21O3−7.82240.08189, 183.01169
7617.42Bacobitacin B599.31854C34H47O9+−4.87563.29681, 581.30725, 337.27313
7717.76Unknown terpene *573.30267C32H45O91.50409.23471, 391.22437, 317.06357, 243.02704
7817.79Tschimganin305.17484C18H25O4+0.34273.14832, 241.12218
7917.86Unknown terpene573.30249C32H45O9−5.79409.23468, 391.22430, 317.06351
8017.91Unknown terpene555.28174C28H43O113.15299.04340, 225.00691+
8118.20Acetyloxy torilolone293.1786C17H25O43.3596.95988
8219.10Unknown terpene409.23511C26H33O4−5.44152.99554
8323.83Yonogenin433.32993C27H45O4+−3.02307.19000, 293.17441, 149.02310
8426.62Acetoxy hydroxymethoxy-oleanene515.41339C33H55O4+7.57329.21429
Fatty acids
859.05Traumatic acid229.14305C12H21O4+−1.68211.13272, 193.12216
8614.11Trihydroxyoctadecenoic acid329.2326C18H33O51.06311.22211, 229.14413, 171.10242
8714.19Oxo octadecadienonic acid295.22662C18H31O3+−0.51277.21600+
8815.19Octadecenedioic acid313.23642C18H33O4−2.92295.22638, 277.21603
8917.06Octadecatrienoic acid311.2218C18H31O40.37-
9017.98Hydroxyoctadecadienoic (Coriolic acid)295.22693C18H31O30.54277.21640, 195.13849, 179.14368+
9118.85Stearyl citrate443.29956C24H43O7−1.74279.23203
9219.46Palmitoylhexitol419.29932C22H43O7−2.41255.23193
9319.80Methyl Linolenate293.24759C19H33O2+0.28261.22107, 243.21054+
9422.71Methyl linoleate295.26309C19H35O2+−0.23263.23694, 245.22644
9524.95Glyceryl ricinolpalmitein607.4917C37H67O6+−2.50589.48108
Others
961.69Mannitol181.0715C6H13O64.72163.0610, 101.02435
971.77Homovanillyl-O-hexoside343.10147C15H19O91.32181.05017, 163.03961
982.28Uralenneoside285.06085C12H13O81.25153.01913
995.39Celephthalide derivative405.21118C19H33O9−1.43405.21118
1005.70Acutilactone409.32681C25H45O4+−10.81276.21655, 160.13304
1015.87Benzyl-O-hexoside269.10275C13H17O6−2.92171.47818
1028.90Benzyl-O-hexosyl pentoside401.14337C18H25O10−2.13269.10239, 161.04523
1039.00Dactylorhin C351.12897C14H23O10−1.13333.11838, 267.07202, 249.06105
1049.19Dihomo-jasmonic acid237.14897C14H21O31.89171.11749
1059.67Glehlinoside C551.17535C26H31O13−1.03389.12271, 193.05025
1069.98Falcarindiol261.18484C17H25O2+−0.26219.17432, 205.12210
10710.07Citrusin A *537.19586C26H33O12−1.48489.17389, 327.12231
10810.41Hydroxydihydrojasmonic acid-O-hexoside435.18478C19H31O11−3.01389.18011
10911.27Celephthalide C371.1694C18H27O8−1.74354.15955
11012.10Hydroxymethyl Celephthalide C403.19452C19H31O9−4.31287.22067,
11112.90Unknown phthalate derivative353.19312C19H29O6+−7.77235.13074, 203.05276
11213.84Pterosin P235.13051C14H19O3+−10.04217.15845, 179.10645
11317.17Unknown595.28656C27H47O14/
C34H43O9
−1.5/
3.9
415.22418, 279.23230, 241.01138
11417.97Unknown *325.18344C14H29O8−6.93183.01180
11518.39Benthamianone *433.23505C28H33O4−5.28152.99571
*: Major metabolites detected in TAE of celery aerial parts by UPLC/ESI/TOF-MS analysis, +: major metabolites detected in DCM of celery aerial parts by UPLC/ESI/TOF-MS analysis.
Publisher’s Note: MDPI stays neutral with regard to jurisdictional claims in published maps and institutional affiliations.

