
Assessment of Staling Aldehydes in Lager Beer under Maritime Transport and Storage Conditions


Abstract
:1. Introduction
2. Results and Discussion
2.1. Aldehyde Profile of Fresh Lager Beers
2.2. Impact of Maritime Transportation on Beer: Aldehyde Evolution
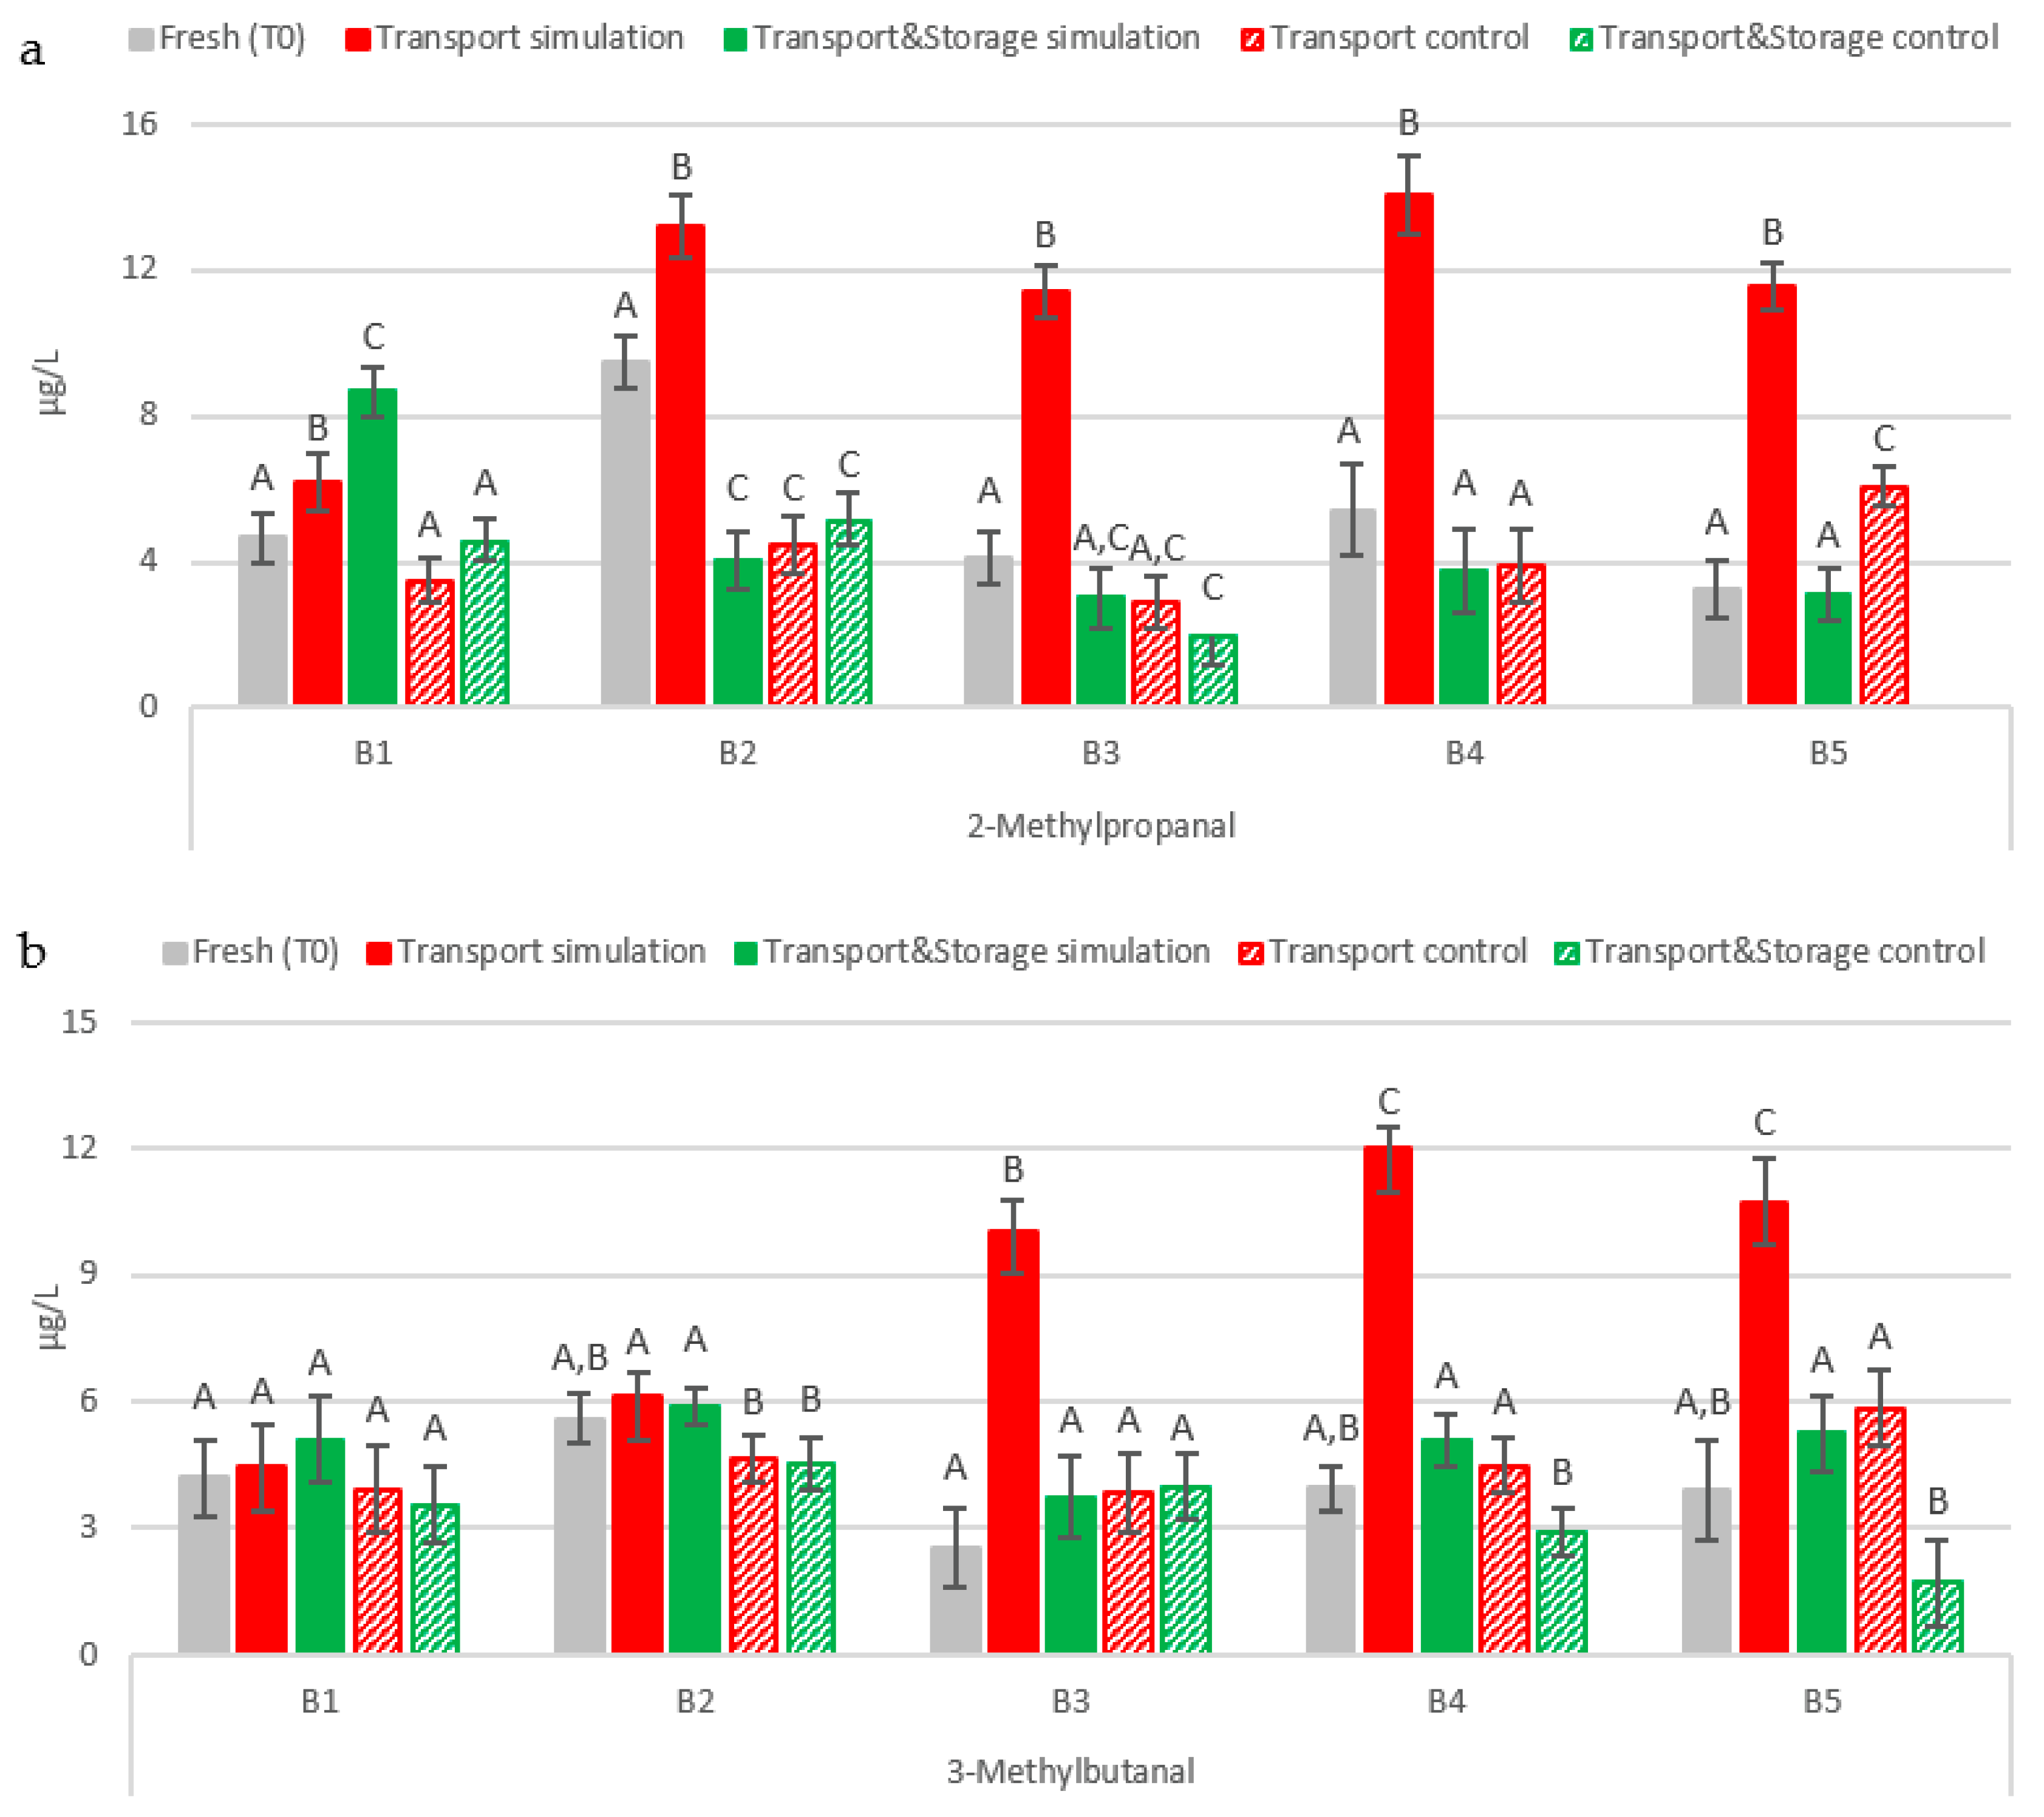
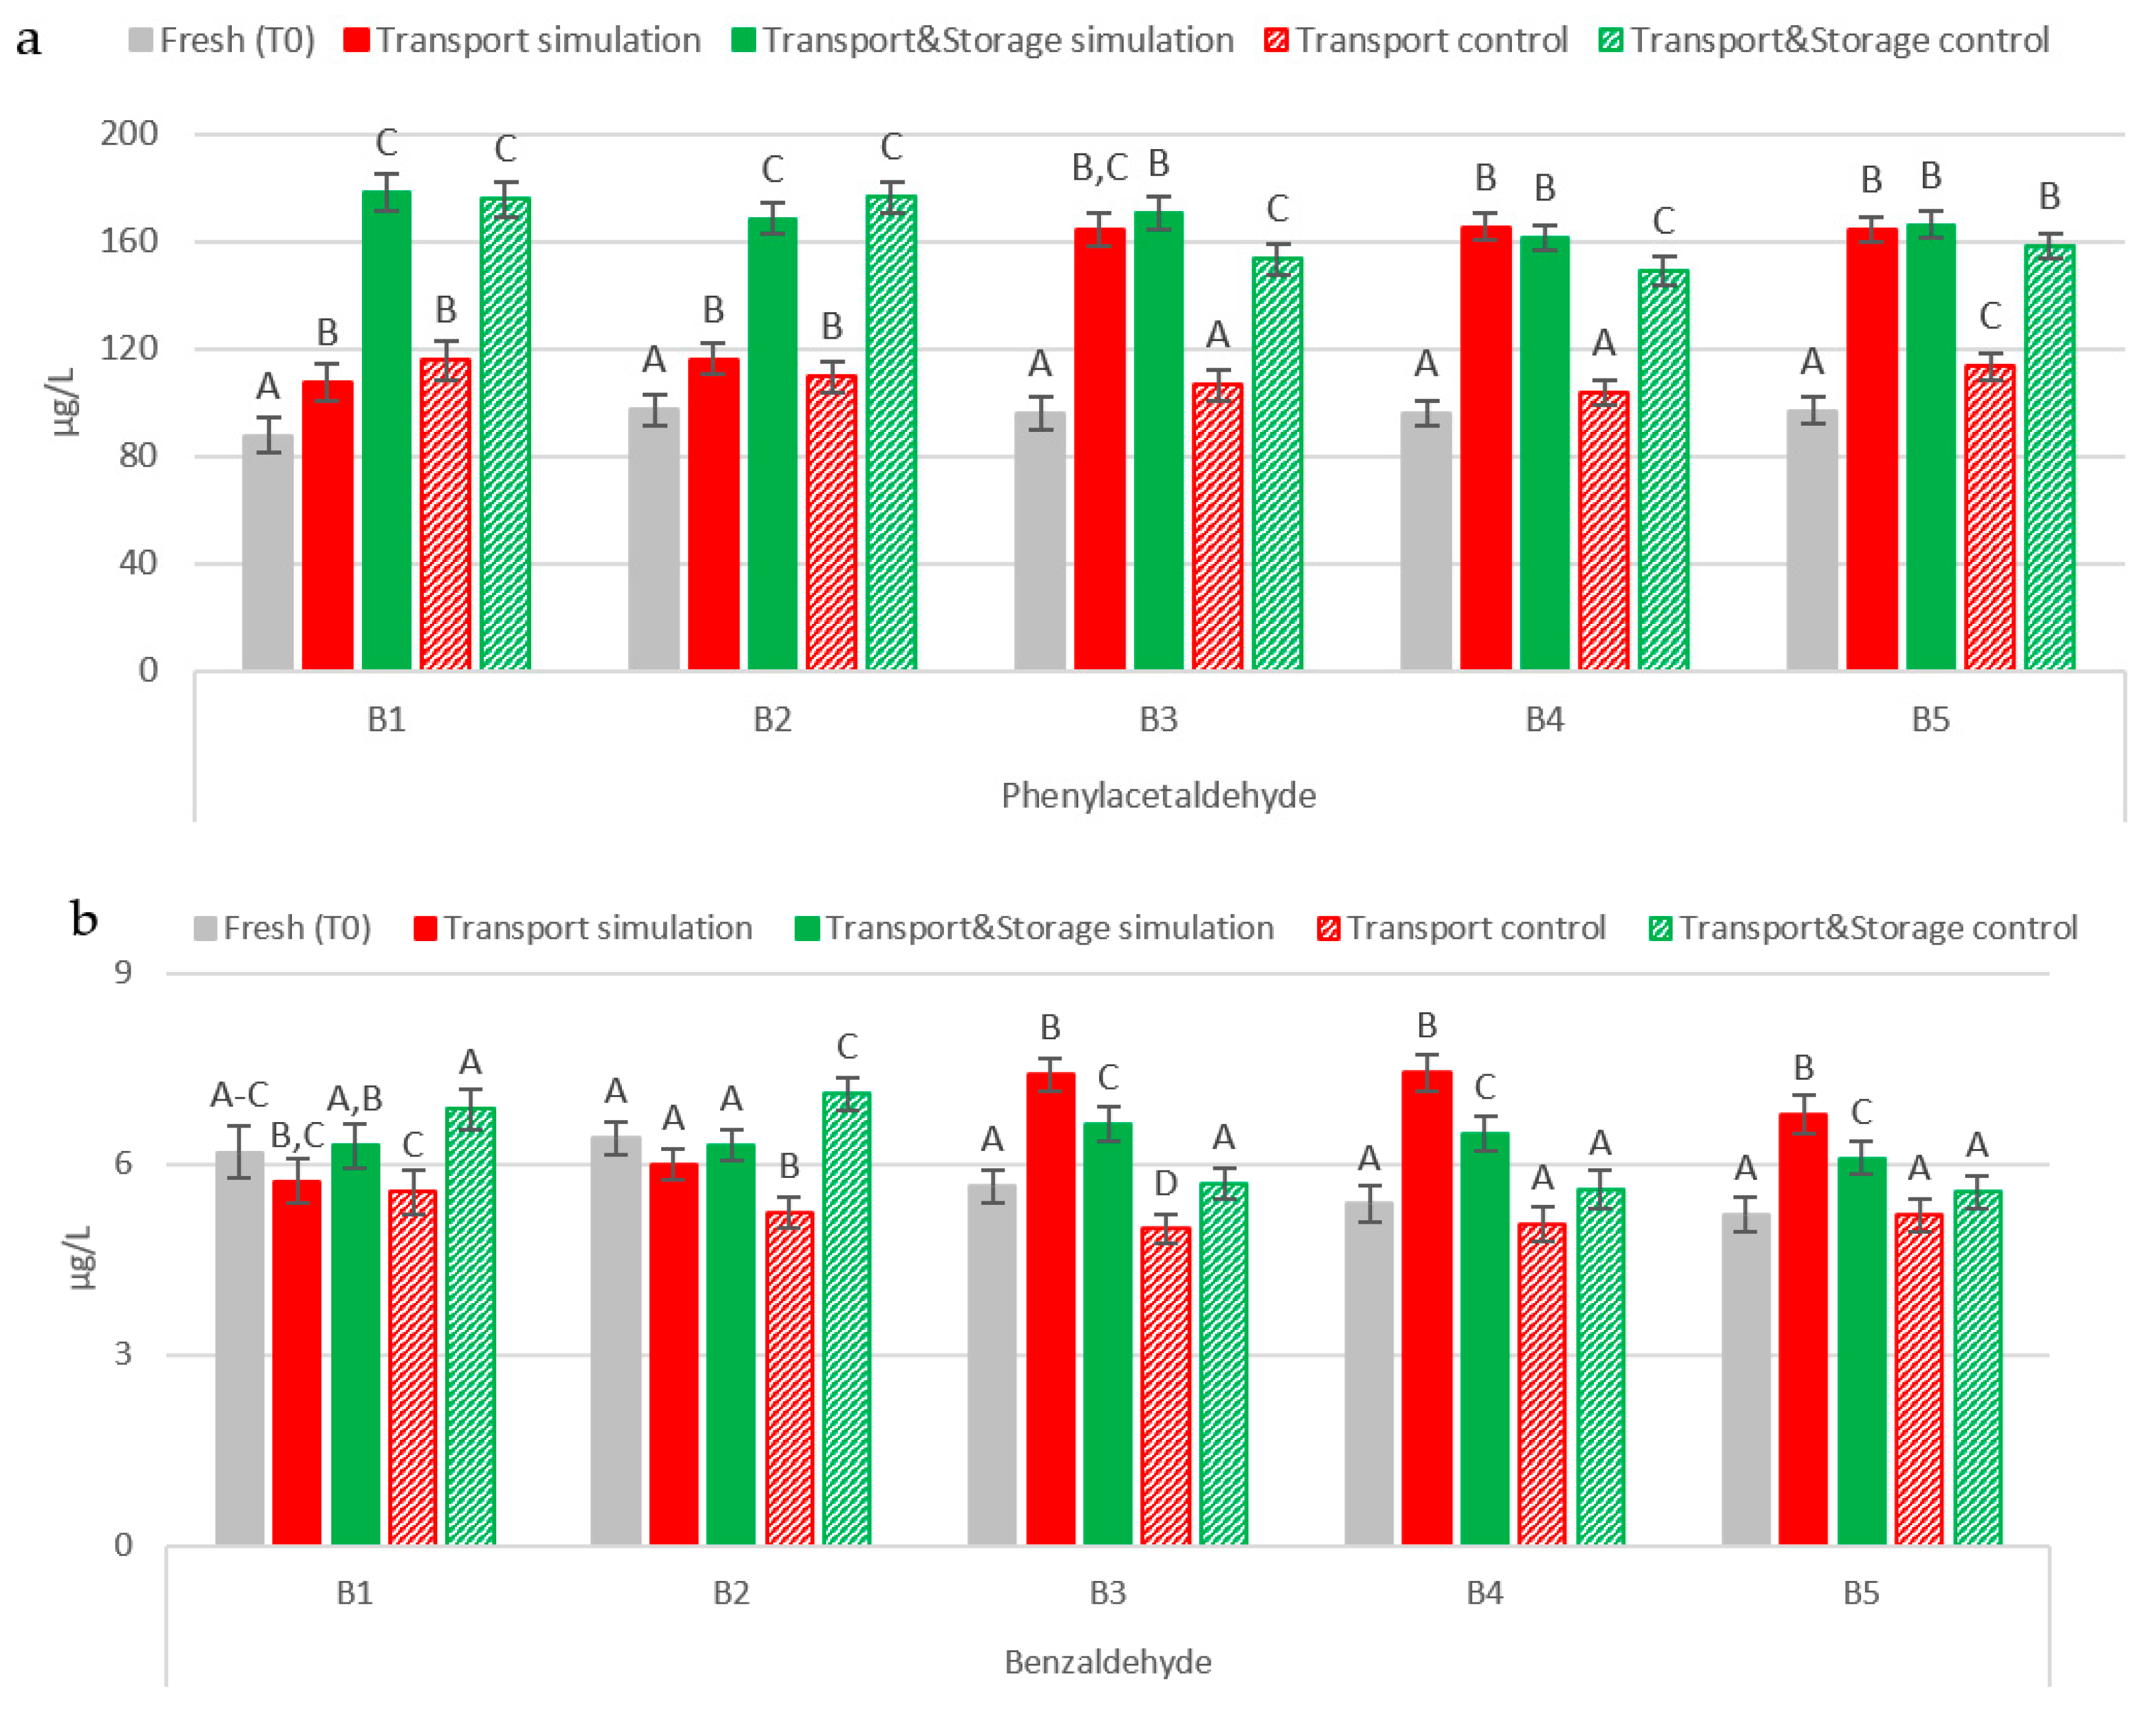
2.2.1. Strecker Aldehydes
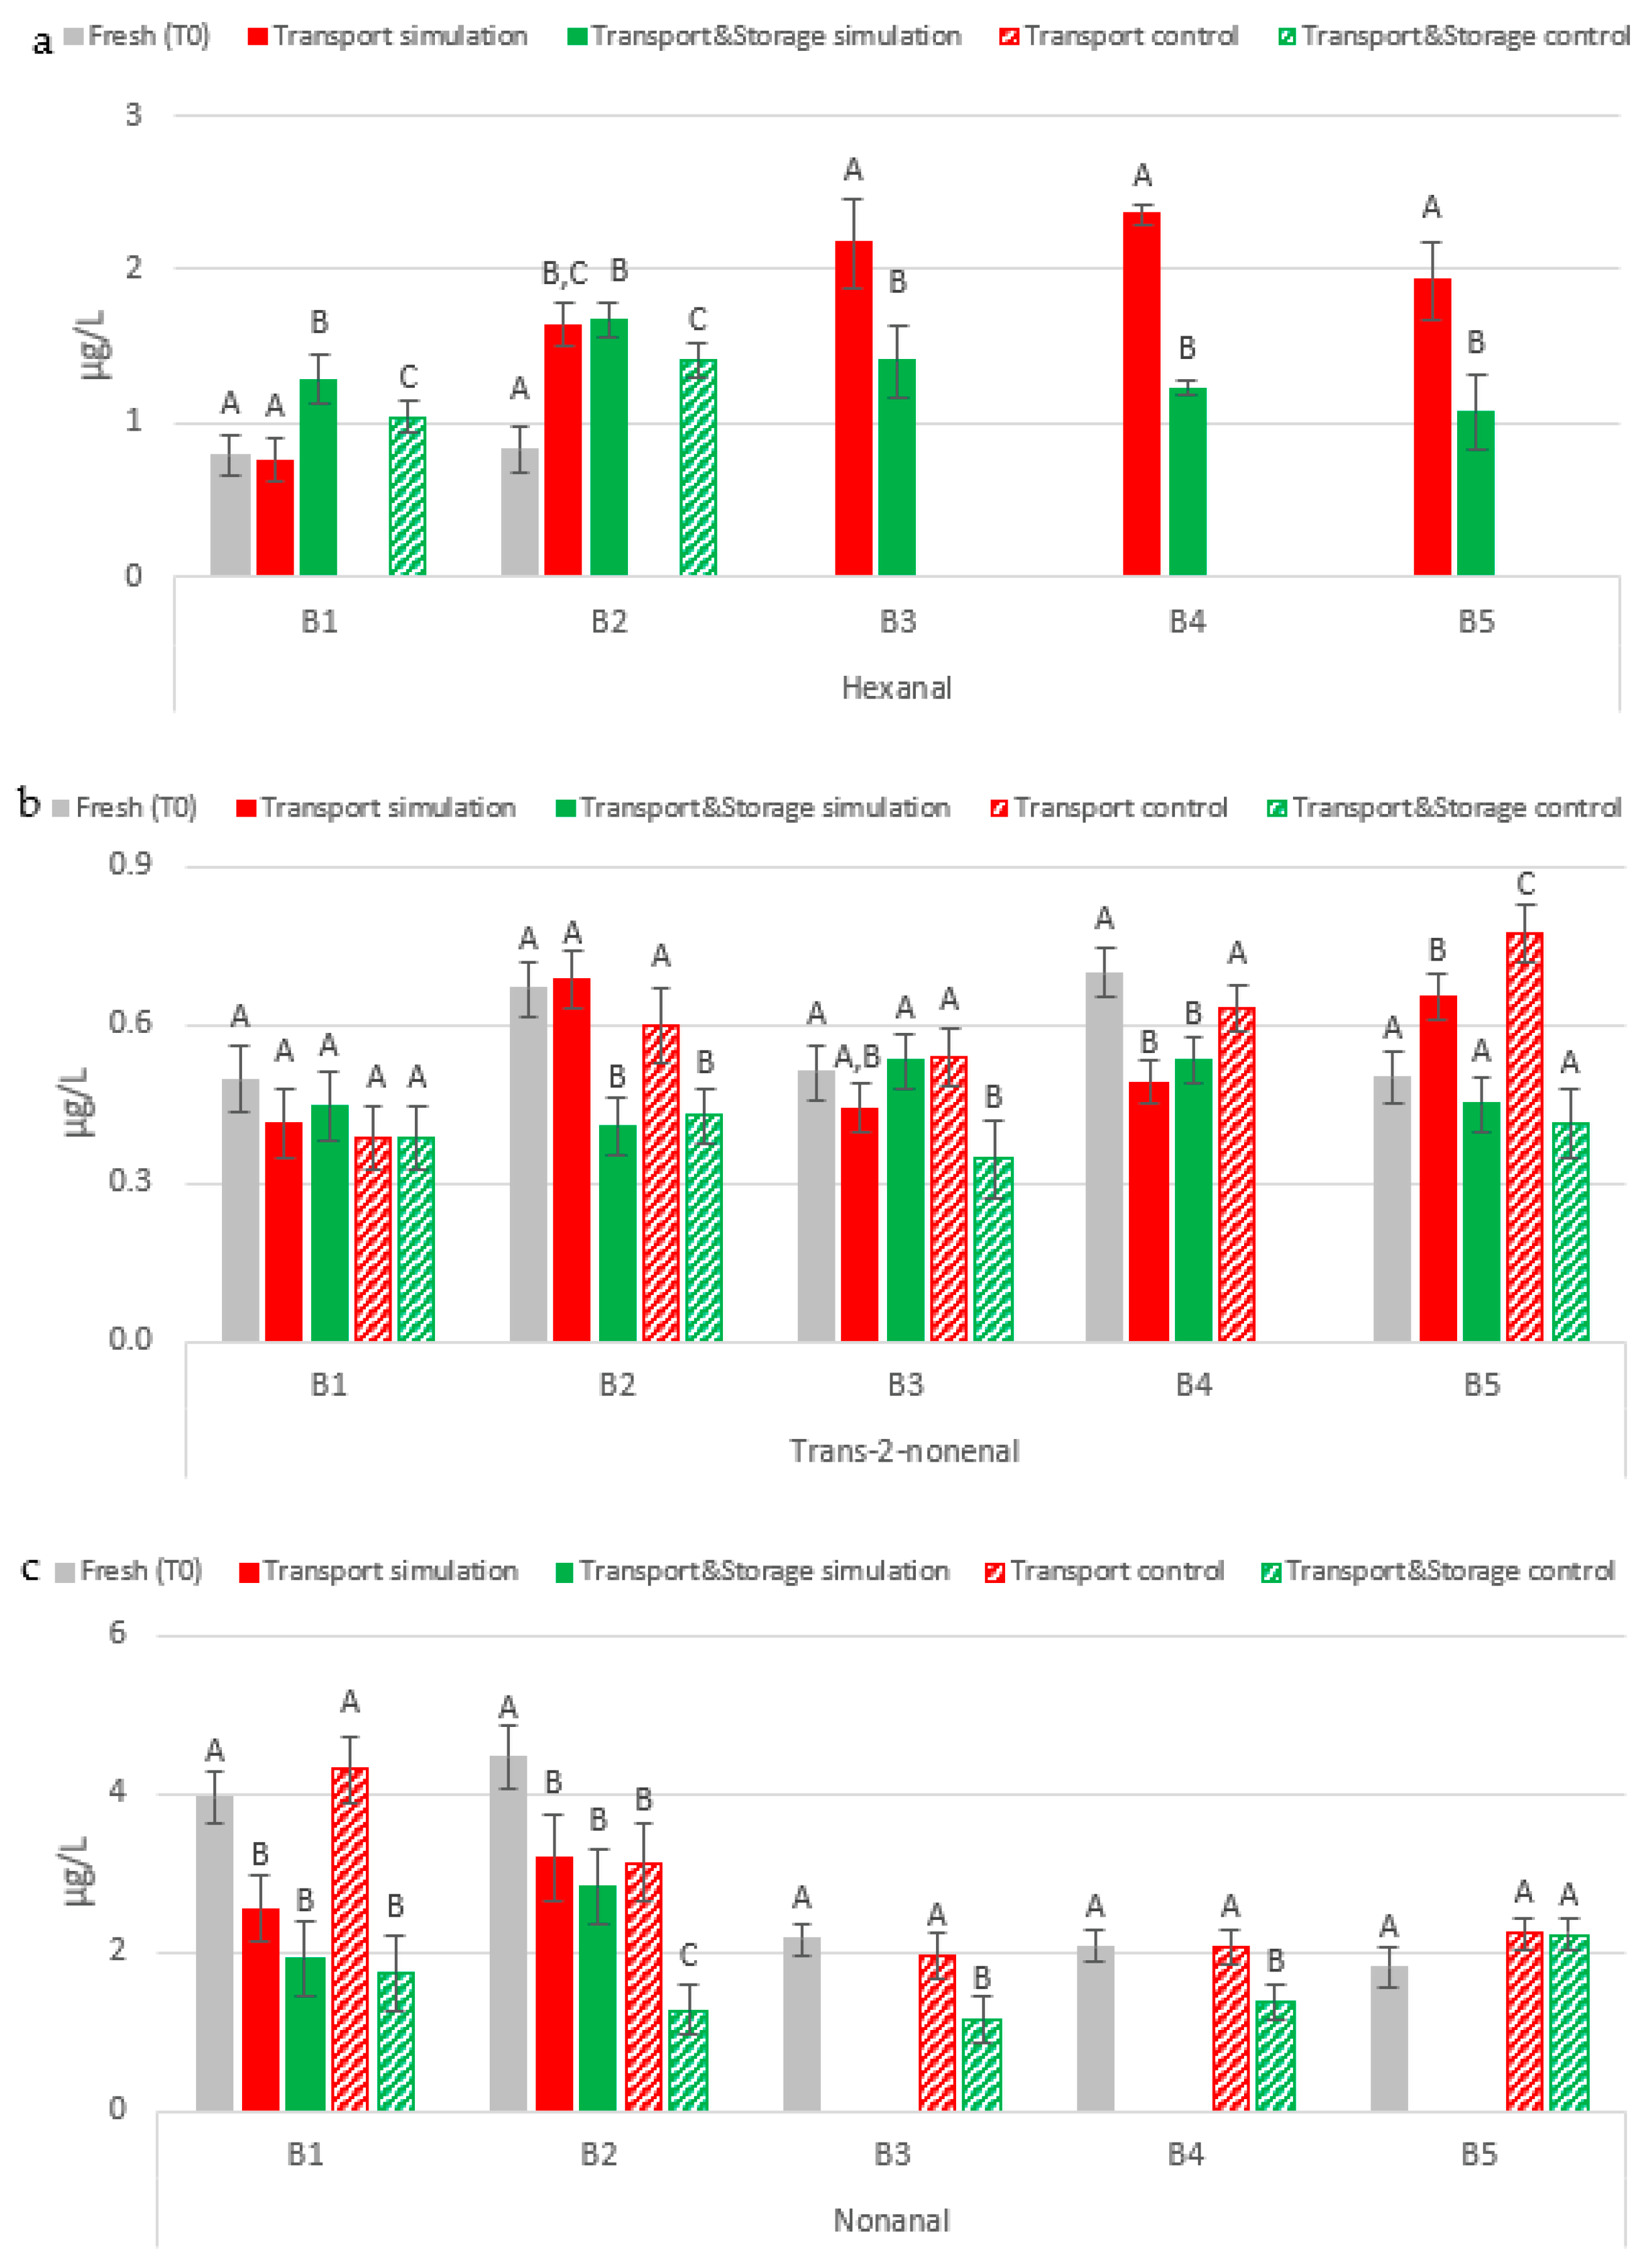
2.2.2. Lipid Oxidation Aldehydes
2.2.3. Furanic Aldehydes
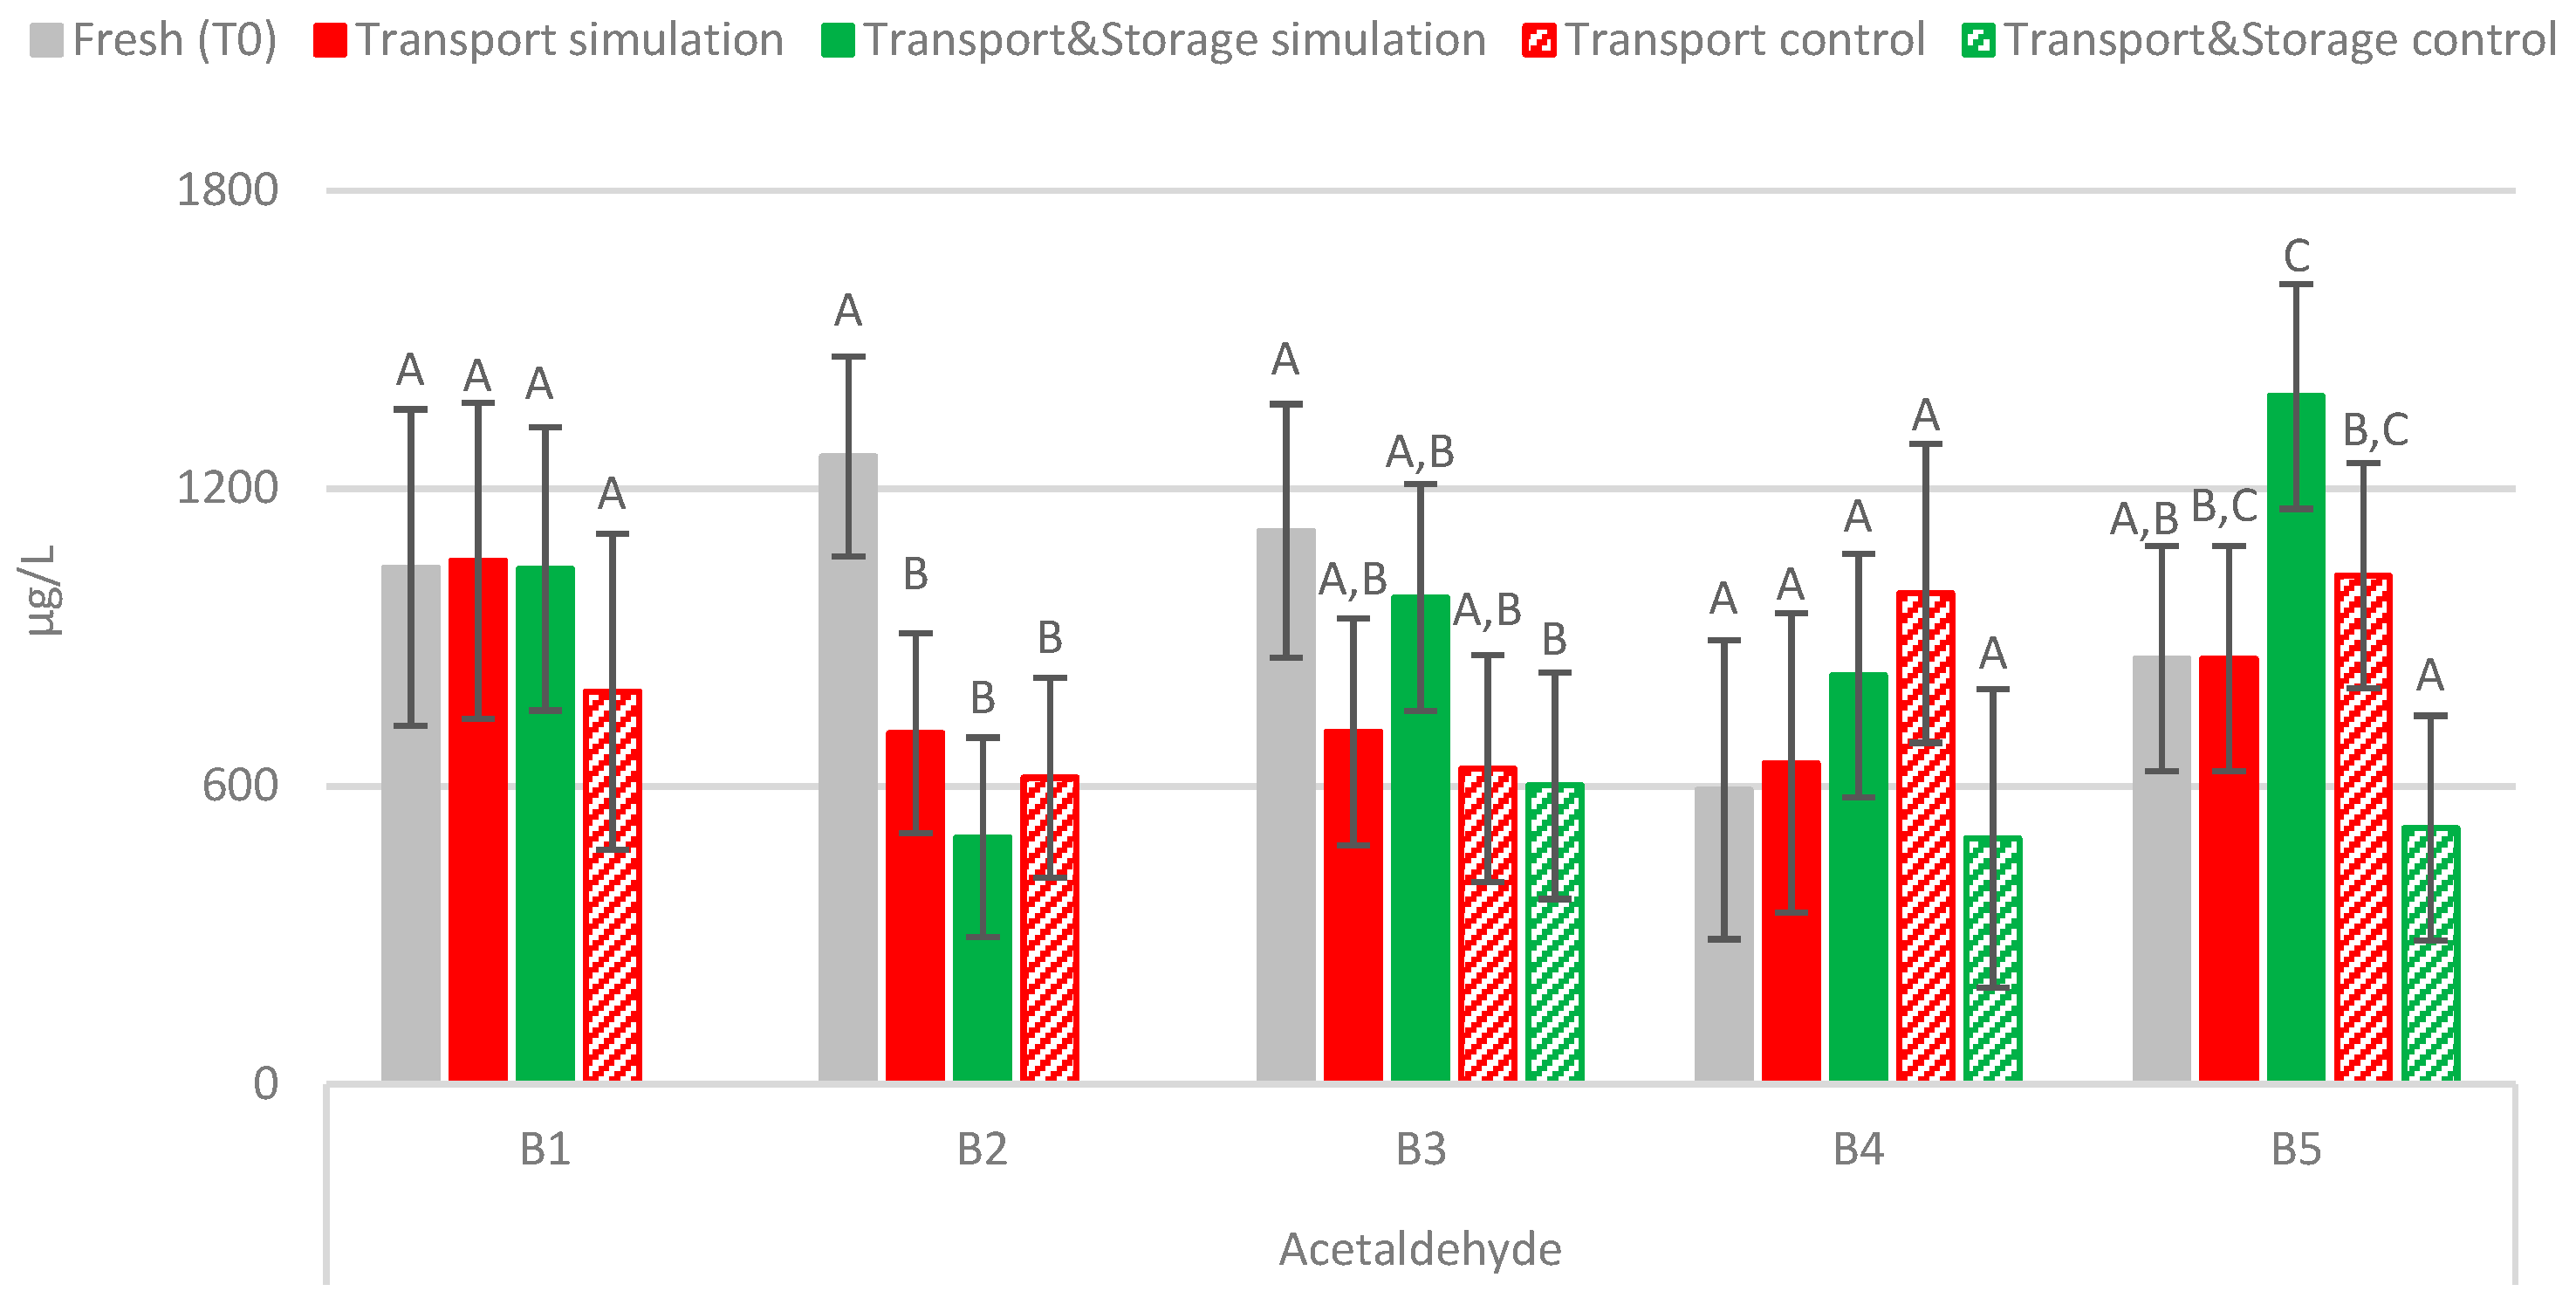
2.2.4. Acetaldehyde
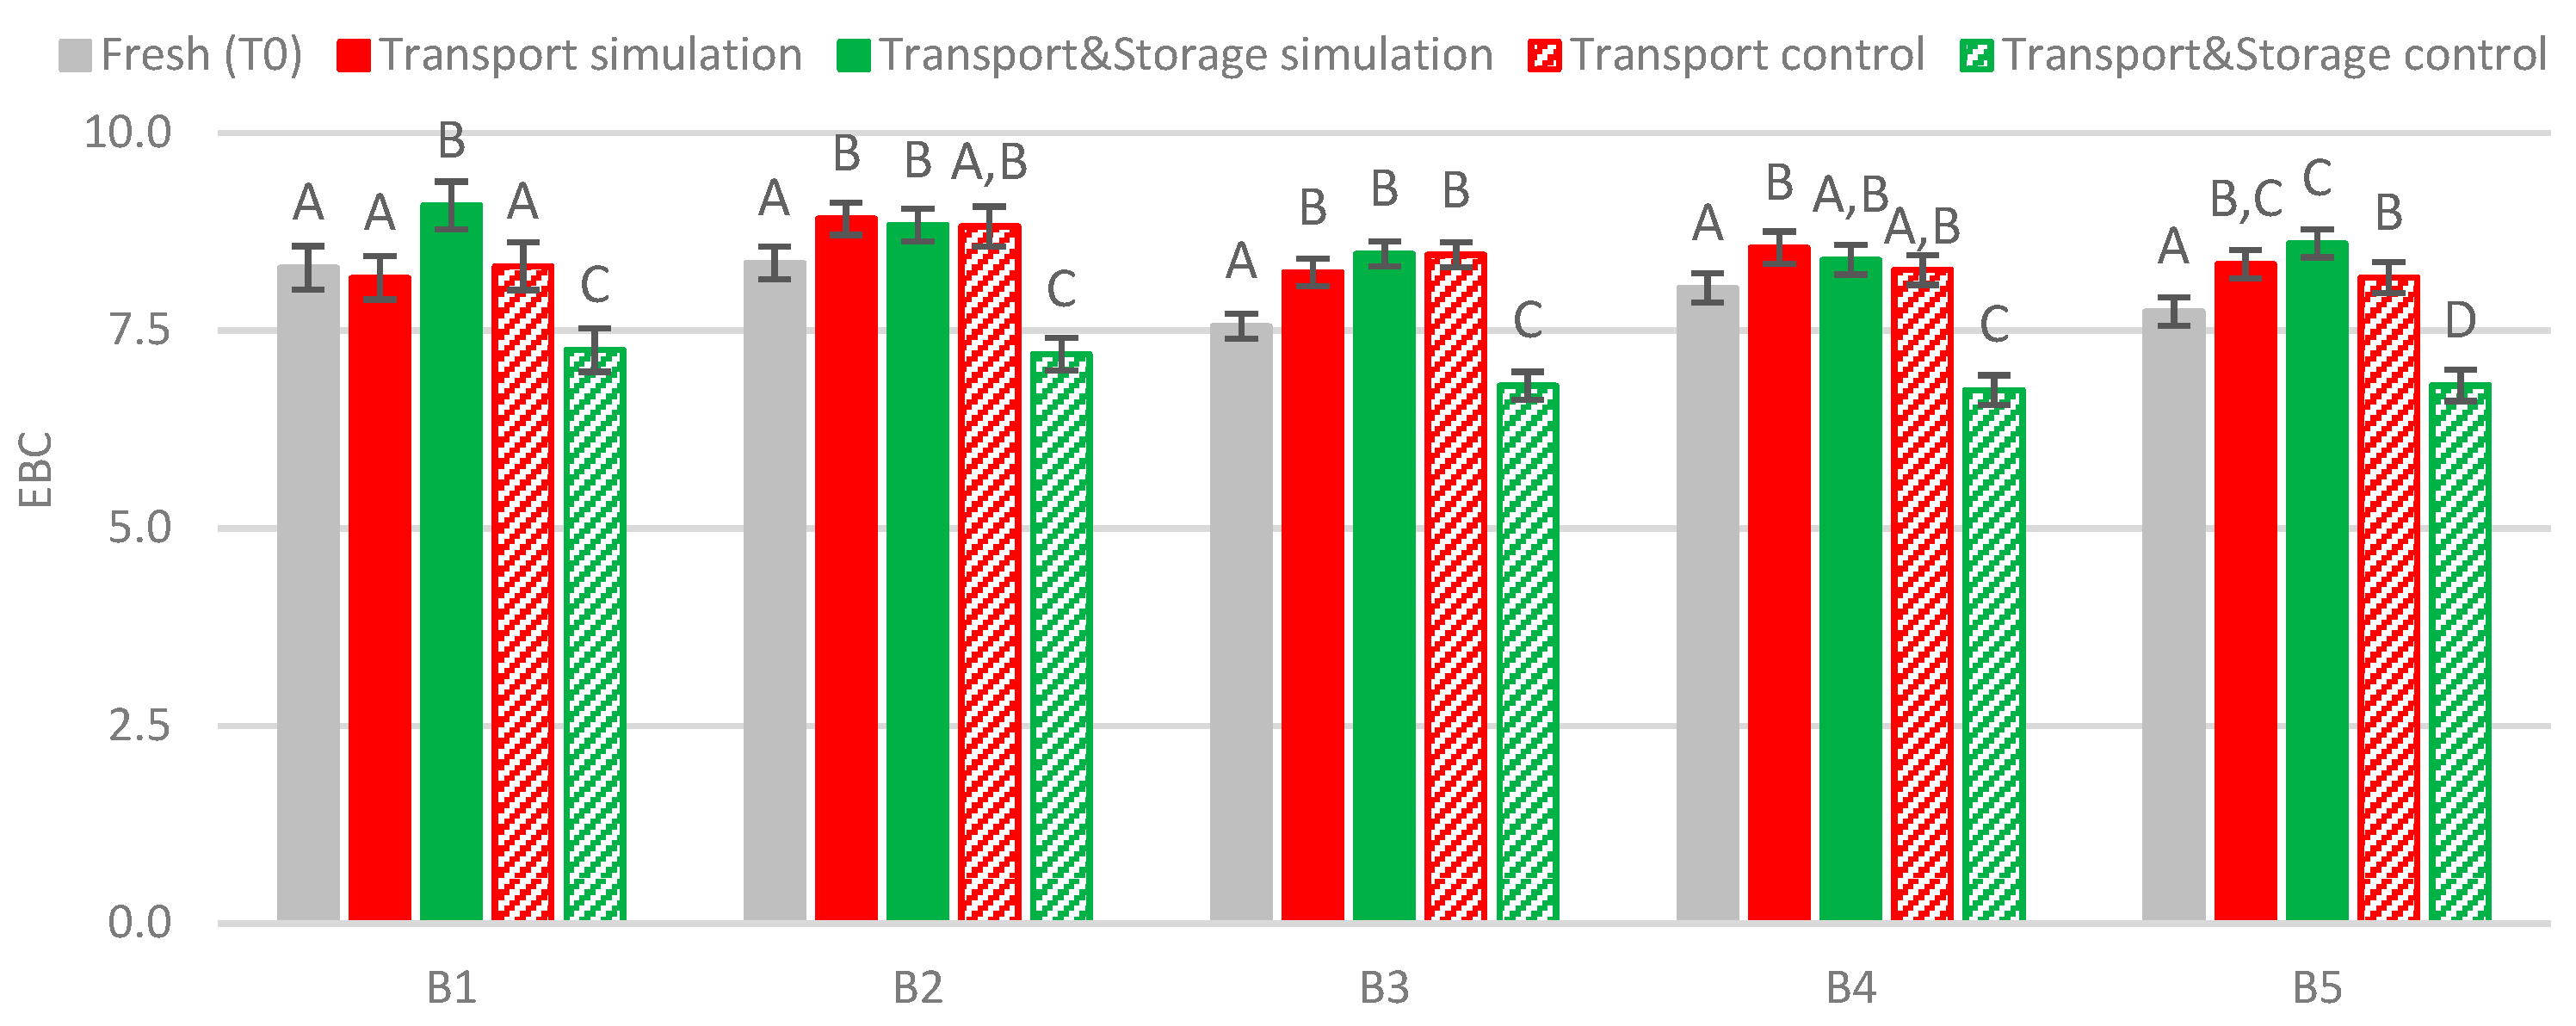
2.3. Beer Color
3. Materials and Methods
3.1. Chemicals
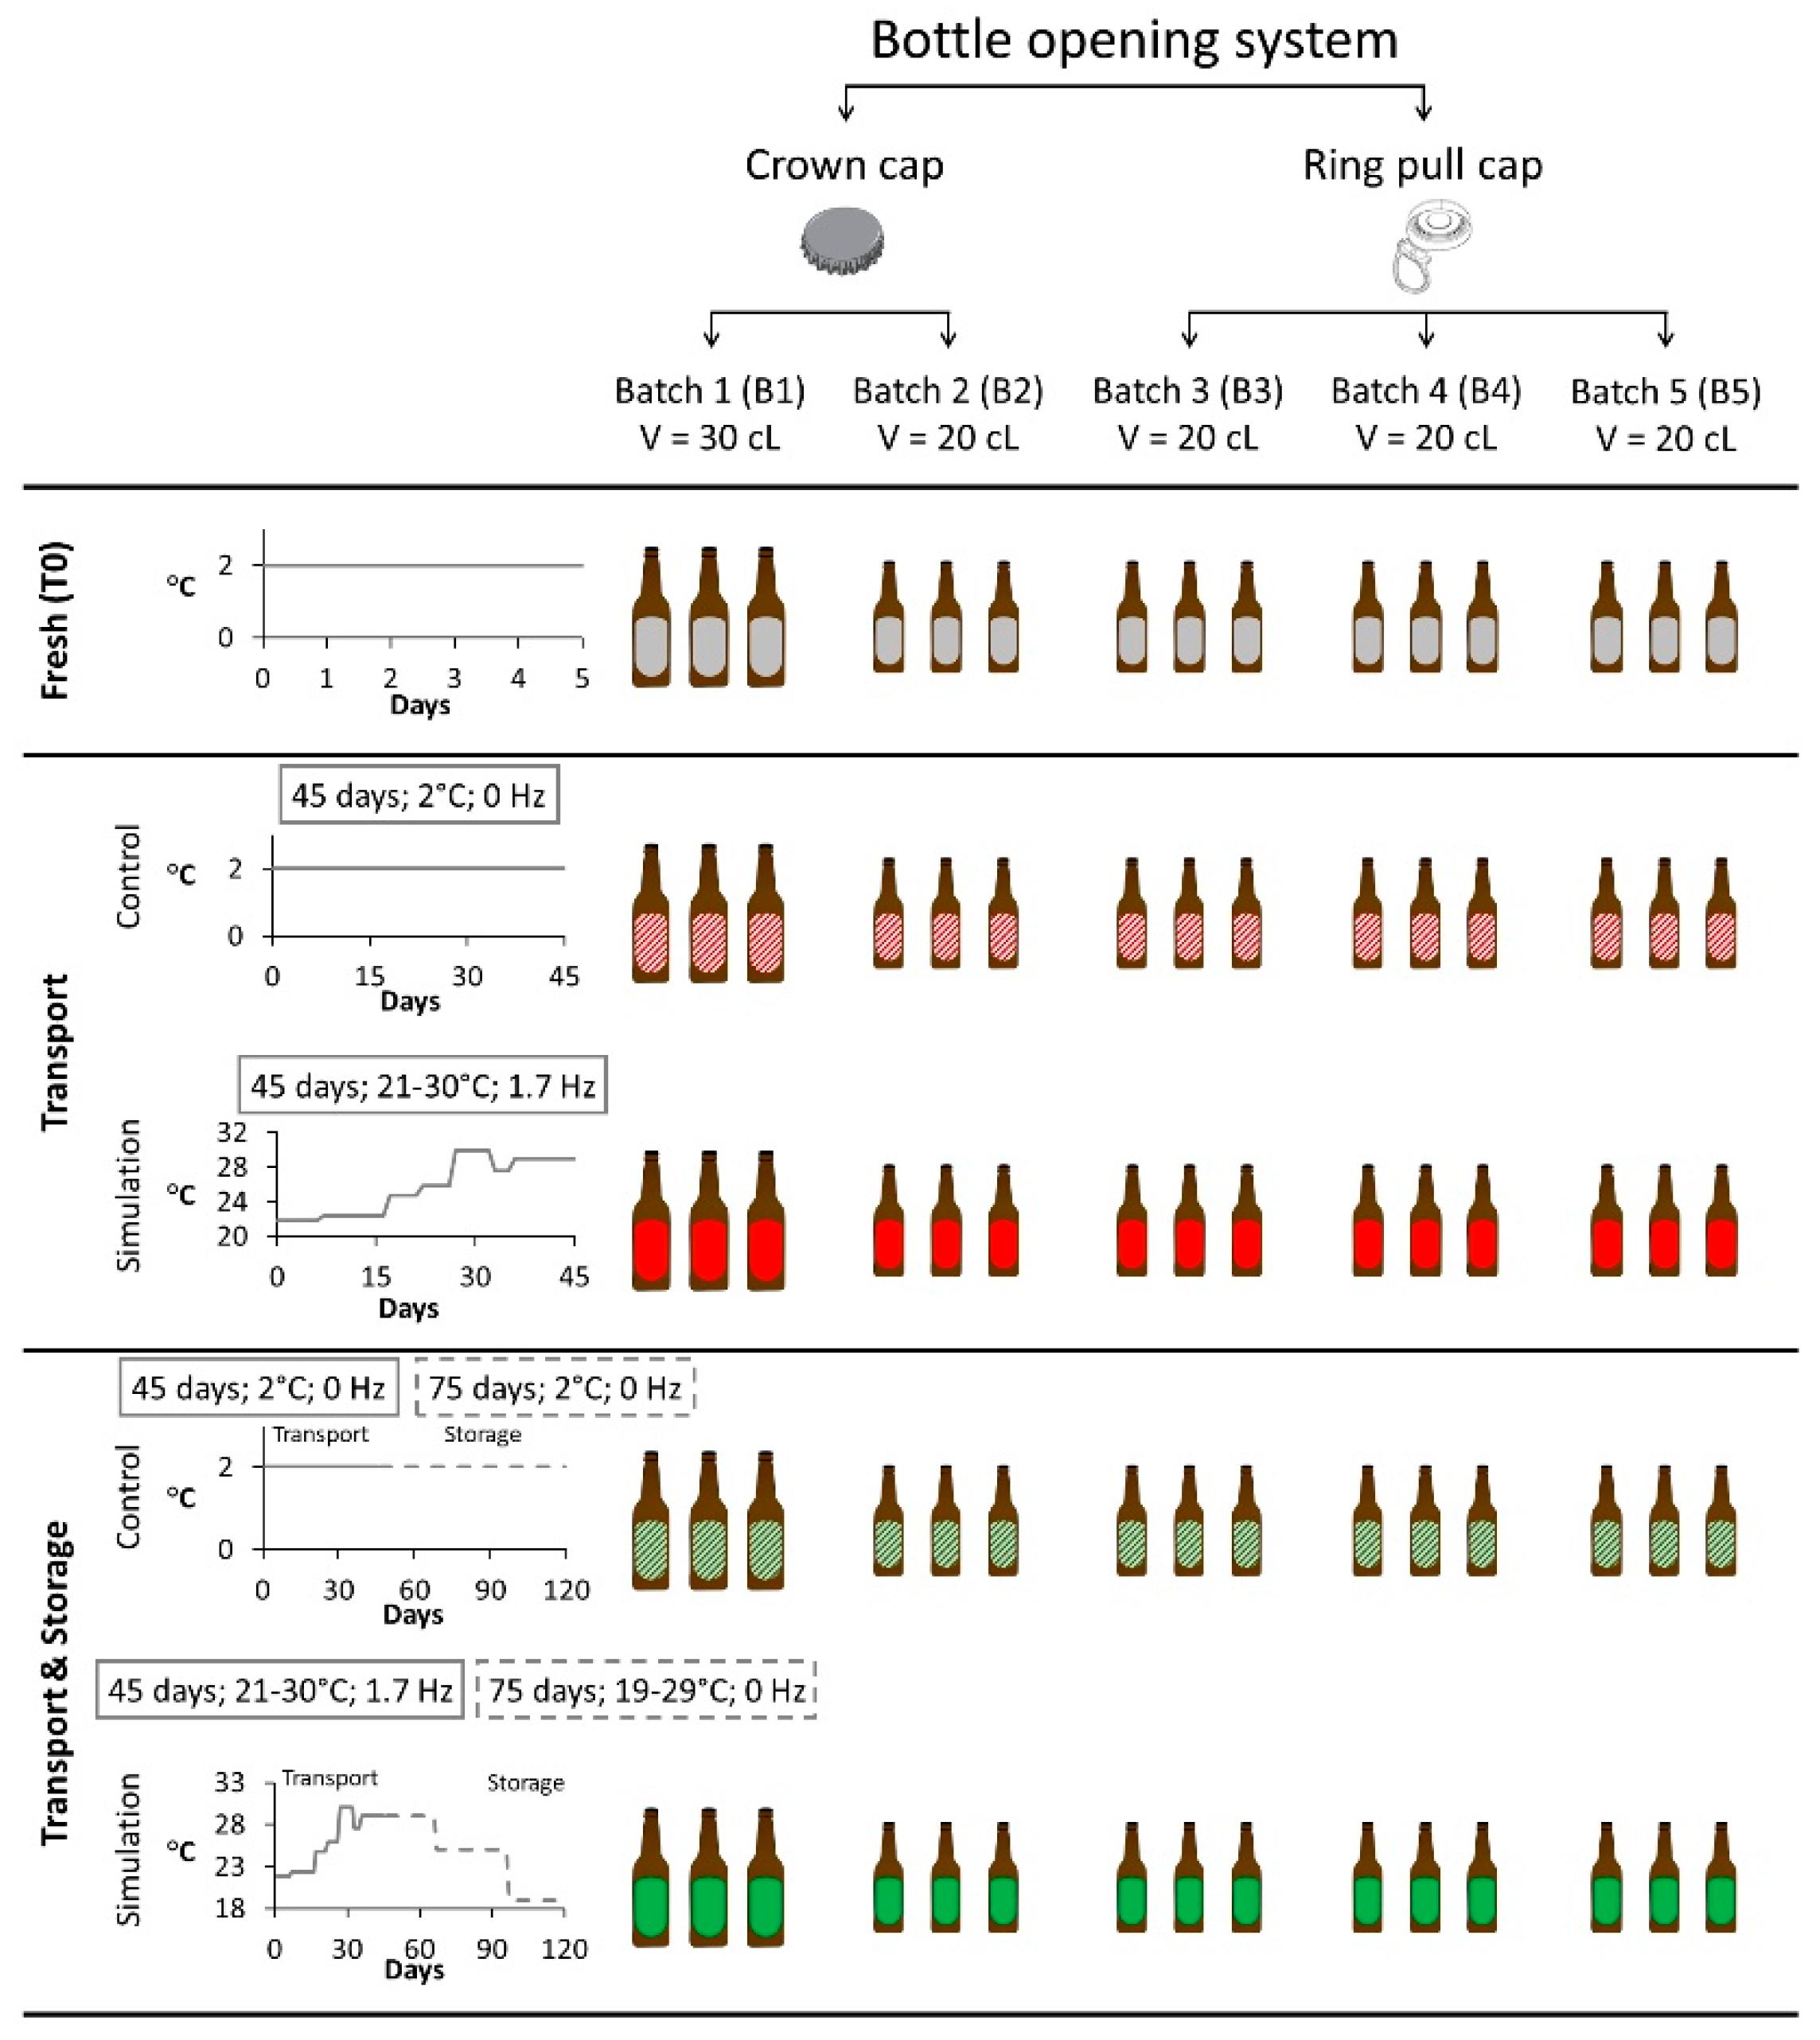
3.2. Beer Samples
3.3. Setup of Maritime Transport and Storage Simulation Experiment
3.4. Quantification of Aldehydes via HS-SPME-GC-MS
3.5. Quantification of Furanic Aldehydes by HPLC
3.6. Determination of Beer Color
3.7. Statistical Analysis
4. Conclusions
Supplementary Materials
Author Contributions
Funding
Institutional Review Board Statement
Informed Consent Statement
Data Availability Statement
Acknowledgments
Conflicts of Interest
References
- Humia, B.V.; Santos, K.S.; Barbosa, A.M.; Sawata, M.; Mendonça, M.d.C.; Padilha, F.F. Beer Molecules and Its Sensory and Biological Properties: A Review. Molecules 2019, 24, 1568. [Google Scholar] [CrossRef] [PubMed] [Green Version]
- The Brewers of Europe. Beer Statistics 2018. Available online: https://brewersofeurope.org/site/media-centre/?doc_id=969&class_id=31&detail=true (accessed on 28 January 2021).
- Li, H.P.; Zhao, M.M.; Cui, C.; Sun, W.Z.; Zhao, H.F. Antioxidant activity and typical ageing compounds: Their evolutions and relationships during the storage of lager beers. Int. J. Food Sci. Technol. 2016, 51, 2026–2033. [Google Scholar] [CrossRef]
- Vanderhaegen, B.; Neven, H.; Verachtert, H.; Derdelinckx, G. The chemistry of beer aging—A critical review. Food Chem. 2006, 95, 357–381. [Google Scholar] [CrossRef]
- Caballero, I.; Blanco, C.; Porras, M. Iso-α-acids, bitterness and loss of beer quality during storage. Trends Food Sci. Technol. 2012, 26, 21–30. [Google Scholar] [CrossRef]
- Mutz, Y.S.; Rosario, D.K.A.; Conte-Junior, C.A. Insights into chemical and sensorial aspects to understand and manage beer aging using chemometrics. Compr. Rev. Food Sci. Food Saf. 2020, 19, 3774–3801. [Google Scholar] [CrossRef]
- Baert, J.J.; De Clippeleer, J.; Hughes, P.S.; De Cooman, L.; Aerts, G. On the Origin of Free and Bound Staling Aldehydes in Beer. J. Agric. Food Chem. 2012, 60, 11449–11472. [Google Scholar] [CrossRef] [PubMed]
- Jaskula-Goiris, B.; De Causmaecker, B.; De Rouck, G.; De Cooman, L.; Aerts, G. Detailed multivariate modeling of beer staling in commercial pale lagers. Brew. Sci. 2011, 64, 119–139. [Google Scholar]
- Filipowska, W.; Jaskula-Goiris, B.; Ditrych, M.; Bustillo Trueba, P.; De Rouck, G.; Aerts, G.; Powell, C.; Cook, D.; De Cooman, L. On the contribution of malt quality and the malting process to the formation of beer staling aldehydes: A review. J. Inst. Brew. 2021, 127, 107–126. [Google Scholar] [CrossRef]
- Lehnhardt, F.; Gastl, M.; Becker, T. Forced into aging: Analytical prediction of the flavor-stability of lager beer. A review. Crit. Rev. Food Sci. Nutr. 2018, 59, 2642–2653. [Google Scholar] [CrossRef]
- Janssen, S.; Pankoke, I.; Klus, K.; Schmitt, K.; Stephan, U.; Wöllenstein, J. Two underestimated threats in food transportation: Mould and acceleration. Philos. Trans. R. Soc. A 2014, 372, 20130312. [Google Scholar] [CrossRef]
- Jaskula-Goiris, B.; De Causmaecker, B.; De Rouck, G.; Aerts, G.; Paternoster, A.; Braet, J.; De Cooman, L. Influence of transport and storage conditions on beer quality and flavour stability. J. Inst. Brew. 2019, 125, 60–68. [Google Scholar] [CrossRef]
- Paternoster, A.; Jaskula-Goiris, B.; De Causmaecker, B.; Vanlanduit, S.; Springael, J.; Braet, J.; De Rouck, G.; De Cooman, L. The interaction effect between vibrations and temperature simulating truck transport on the flavor stability of beer. J. Sci. Food Agric. 2019, 99, 2165–2174. [Google Scholar] [CrossRef] [PubMed]
- Paternoster, A.; Vanlanduit, S.; Springael, J.; Braet, J. Measurement and analysis of vibration and shock levels for truck transport in Belgium with respect to packaged beer during transit. Food Packag. Shelf Life 2018, 15, 134–143. [Google Scholar] [CrossRef]
- Bustillo Trueba, P.; Jaskula-Goiris, B.; Ditrych, M.; Filipowska, W.; De Brabanter, J.; De Rouck, G.; Aerts, G.; De Cooman, L.; De Clippeleer, J. Monitoring the evolution of free and cysteinylated aldehydes from malt to fresh and forced aged beer. Food Res. Int. 2021, 140, 110049. [Google Scholar] [CrossRef]
- Baert, J.J.; De Clippeleer, J.; Bustillo Trueba, P.; Jaskula-Goiris, B.; De Rouck, G.; Aerts, G.; De Cooman, L. Exploring Aldehyde Release in Beer by 4-Vinylpyridine and the Effect of Cysteine Addition on the Beer’s Pool of Bound Aldehydes. J. Am. Soc. Brew. Chem. 2018, 76, 257–271. [Google Scholar] [CrossRef]
- Nobis, A.; Kwasnicki, M.; Lehnhardt, F.; Hellwig, M.; Henle, T.; Becker, T.; Gastl, M. A Comprehensive Evaluation of Flavor Instability of Beer (Part 2): The Influence of De Novo Formation of Aging Aldehydes. Foods 2021, 10, 2668. [Google Scholar] [CrossRef]
- Lehnhardt, F.; Nobis, A.; Skornia, A.; Becker, T.; Gastl, M. A Comprehensive Evaluation of Flavor Instability of Beer (Part 1): Influence of Release of Bound State Aldehydes. Foods 2021, 10, 2432. [Google Scholar] [CrossRef] [PubMed]
- Saison, D.; Vanbeneden, N.; De Schutter, D.; Daenen, L.; Mertens, T.; Delvaux, F.; Delvaux, F. Characterisation of the flavour and the chemical composition of lager beer after ageing in varying conditions. Brew. Sci. 2010, 63, 41–53. [Google Scholar]
- Stewart, G.G. The Production of Secondary Metabolites with Flavour Potential during Brewing and Distilling Wort Fermentations. Fermentation 2017, 3, 63. [Google Scholar] [CrossRef] [Green Version]
- Malfliet, S.; Van Opstaele, F.; De Clippeleer, J.; Syryn, E.; Goiris, K.; De Coornan, L.; Aerts, G. Flavour instability of pale lager beers: Determination of analytical markers in relation to sensory ageing. J. Inst. Brew. 2008, 114, 180–192. [Google Scholar] [CrossRef]
- Gernat, D.C.; Brouwer, E.; Ottens, M. Aldehydes as Wort Off-Flavours in Alcohol-Free Beers—Origin and Control. Food Bioprocess Technol. 2020, 13, 195–216. [Google Scholar] [CrossRef] [Green Version]
- Techakriengkrai, I.; Paterson, A.; Taidi, B. Relationship of Sensory Staleness in Two Lagers to Headspace Concentrations of trans-2-Nonenal and Three Staling Aldehydes. J. Inst. Brew. 2006, 112, 36–40. [Google Scholar] [CrossRef]
- Saison, D.; De Schutter, D.P.; Uyttenhove, B.; Delvaux, F.; Delvaux, F.R. Contribution of staling compounds to the aged flavour of lager beer by studying their flavour thresholds. Food Chem. 2009, 114, 1206–1215. [Google Scholar] [CrossRef]
- Moreira, N.; Meireles, S.; Brandão, T.; de Pinho, P.G. Optimization of the HS-SPME–GC–IT/MS method using a central composite design for volatile carbonyl compounds determination in beers. Talanta 2013, 117, 523–531. [Google Scholar] [CrossRef] [PubMed]
- Vanderhaegen, B.; Neven, H.; Coghe, S.; Verstrepen, K.J.; Verachtert, H.; Derdelinckx, G. Evolution of Chemical and Sensory Properties during Aging of Top-Fermented Beer. J. Agric. Food Chem. 2003, 51, 6782–6790. [Google Scholar] [CrossRef] [PubMed]
- Noddekaer, T.V.; Andersen, M.L. Effects of Maillard and caramelization products on oxidative reactions in lager beer. J. Am. Soc. Brew. Chem. 2007, 65, 15–20. [Google Scholar] [CrossRef]
- Empresa de Cervejas da Madeira. Cerveja Coral. Available online: https://www.cervejacoral.com/portfolio_page/coral-branca/ (accessed on 10 June 2021).
- SeaTemperature. Available online: https://www.seatemperature.org/ (accessed on 10 May 2020).
- AccuWeather. Available online: https://www.accuweather.com/ (accessed on 10 May 2020).
- Vieira, A.C.; Pereira, A.C.; Marques, J.C.; Reis, M.S. Multi-target optimization of solid phase microextraction to analyse key flavour compounds in wort and beer. Food Chem. 2020, 317, 126466. [Google Scholar] [CrossRef]
- Pereira, A.C.; Carvalho, M.J.; Miranda, A.; Leça, J.M.; Pereira, V.; Albuquerque, F.; Marques, J.C.; Reis, M.S. Modelling the ageing process: A novel strategy to analyze the wine evolution towards the expected features. Chemom. Intell. Lab. Syst. 2016, 154, 176–184. [Google Scholar] [CrossRef]


| µg/L | B1 | B2 | B3 | B4 | B5 |
|---|---|---|---|---|---|
| 2-methylpropanal | 4.67 ± 0.74 | 9.49 ± 1.23 | 4.08 ± 0.84 | 5.42 ± 1.24 | 3.25 ± 0.98 |
| 2-methylbutanal | nd | nd | nd | nd | nd |
| 3-methylbutanal | 4.18 ± 1.09 | 5.60 ± 0.84 | 2.53 ± 0.60 | 3.86 ± 0.56 | 3.11 ± 1.61 |
| Benzaldehyde | 6.35 ± 0.75 | 6.41 ± 0.54 | 5.65 ± 0.47 | 5.37 ± 0.39 | 5.21 ± 0.23 |
| Phenylacetaldehyde | 87.64 ± 6.56 | 97.12 ± 7.16 | 95.92 ± 7.71 | 96.12 ± 6.57 | 96.96 ± 8.33 |
| Hexanal | 0.80 ± 0.24 | 0.84 ± 0.10 | nd | nd | nd |
| Heptanal | nd | nd | nd | nd | nd |
| Nonanal | 3.96 ± 0.50 | 4.47 ± 0.65 | 2.17 ± 0.25 | 2.09 ± 0.21 | 1.81 ± 0.50 |
| Trans-2-nonenal | 0.50 ± 0.10 | 0.67 ± 0.07 | 0.52 ± 0.10 | 0.74 ± 0.11 | 0.49 ± 0.09 |
| Acetaldehyde | 1040.70 ± 134.14 | 1265.00 ± 280.91 | 1114.60 ± 193.55 | 593.00 ± 292.50 | 858.00 ± 250.27 |
| 5-HMF (mg/L) | 1.22 ± 0.03 | 1.25 ± 0.03 | 1.51 ± 0.04 | 1.49 ± 0.02 | 1.40 ± 0.05 |
Publisher’s Note: MDPI stays neutral with regard to jurisdictional claims in published maps and institutional affiliations. |
© 2022 by the authors. Licensee MDPI, Basel, Switzerland. This article is an open access article distributed under the terms and conditions of the Creative Commons Attribution (CC BY) license (https://creativecommons.org/licenses/by/4.0/).
Share and Cite
Aguiar, D.; Pereira, A.C.; Marques, J.C. Assessment of Staling Aldehydes in Lager Beer under Maritime Transport and Storage Conditions. Molecules 2022, 27, 600. https://doi.org/10.3390/molecules27030600
Aguiar D, Pereira AC, Marques JC. Assessment of Staling Aldehydes in Lager Beer under Maritime Transport and Storage Conditions. Molecules. 2022; 27(3):600. https://doi.org/10.3390/molecules27030600
Chicago/Turabian StyleAguiar, Dayana, Ana C. Pereira, and José C. Marques. 2022. "Assessment of Staling Aldehydes in Lager Beer under Maritime Transport and Storage Conditions" Molecules 27, no. 3: 600. https://doi.org/10.3390/molecules27030600
APA StyleAguiar, D., Pereira, A. C., & Marques, J. C. (2022). Assessment of Staling Aldehydes in Lager Beer under Maritime Transport and Storage Conditions. Molecules, 27(3), 600. https://doi.org/10.3390/molecules27030600