Article

Real-Time Monitoring of the Atrazine Degradation by Liquid Chromatography and High-Resolution Mass Spectrometry: Effect of Fenton Process and Ultrasound Treatment

1
Université de Technologie de Compiègne, UPJV, CNRS, Enzyme and Cell Engineering, Centre de Recherche Royallieu, CEDEX CS 60319, 60203 Compiègne, France
2
Université de Technologie de Compiègne, ESCOM, TIMR (Integrated Transformations of Renewable Matter), Centre de Recherche Royallieu, CEDEX CS 60319, 60203 Compiègne, France
*
Author to whom correspondence should be addressed.
Molecules 2022, 27(24), 9021; https://doi.org/10.3390/molecules27249021
Submission received: 28 October 2022 / Revised: 14 December 2022 / Accepted: 15 December 2022 / Published: 17 December 2022
(This article belongs to the Section Analytical Chemistry)

Abstract

:
High resolution mass spectrometry (HRMS) was coupled with ultra-high-performance liquid chromatography (uHPLC) to monitor atrazine (ATZ) degradation process of Fenton/ultrasound (US) treatment in real time. Samples were automatically taken through a peristaltic pump, and then analysed by HPLC-HRMS. The injection in the mass spectrometer was performed every 4 min for 2 h. ATZ and its degradation metabolites were sampled and identified. Online Fenton experiments in different equivalents of Fenton reagents, online US experiments with/without Fe2+ and offline Fenton experiments were conducted. Higher equivalents of Fenton reagents promoted the degradation rate of ATZ and the generation of the late-products such as Ammeline (AM). Besides, adding Fe2+ accelerated ATZ degradation in US treatment. In offline Fenton, the degradation rate of ATZ was higher than that of online Fenton, suggesting the offline samples were still reacting in the vial. The online analysis precisely controls the effect of reagents over time through automatic sampling and rapid detection, which greatly improves the measurement accuracy. The experimental set up proposed here both prevents the degradation of potentially unstable metabolites and provides a good way to track each metabolite.

Graphical Abstract

1. Introduction

Although the quantity of pesticides in water was significantly reduced in France between 2008 and 2018 [1], certain molecules, such as atrazine, banned in Europe since 2003, persist in the environment. Atrazine (2-chloro-4-ethylamino-6-isopropylamino-1,3,5-triazine) is a triazine herbicide with a wide range of application, for grassy and broadleaf weed control in corn, sugarcane, sorghum and other crops [2,3,4,5]. However, atrazine is also considered as one of the most toxic herbicides [6], because it can act as an endocrine disruptor that can produce damage to the endocrine system, causing a series of pathological changes and reproductive abnormalities [7,8]. In addition, atrazine is also a potential carcinogen due to negative impact on human health such as tumors, breast, ovarian, and uterine cancers as well as leukemia and lymphoma [9,10].
The literature reports numerous attempts aimed at degrading this water pesticide. The reported treatments are microwave-assisted photo reactions [11], high voltage electrical discharges [12], ultrasound [13,14], advanced oxidation processes (AOPs) [15,16] and bioremediation [17]. However, these treatments produce new molecules which are sometimes even more toxic to humans and the environment [15,18]. In Fenton oxidation, hydrogen peroxide (H2O2) is activated by ferrous (Fe2+) ions to generate hydroxyl radicals (HO·). In ultrasound treatment, high energy leads to water splitting, generating hydroxyl radicals (HO·) and hydrogen radicals (). Hydroxyl radicals (HO·) dominate the degradation of atrazine in Fenton oxidation and in ultrasound treatment [13].
In order to evaluate the performance of these treatments on pesticides degradation in water, it is essential to use analytical techniques to follow the evolution of its metabolites during the treatments. Most of the studies use chromatographic techniques with UV (LC-UV) [12,15,19] detection with or without mass spectrometry coupling (LC-MS). Compared with low-resolution tandem mass spectrometry (LC-MS/MS) [20], high-resolution mass spectrometry (LC-HRMS) [21] has higher accuracy in terms of metabolite characterization and exact mass specificity. In most cases, the required sampling for the kinetic monitoring of the degradation is carried out by spot sampling prior to transfer or storage [14,15,22]. When monitoring the kinetics of Fenton reaction, the presence of reagents in the medium can lead to errors in the estimation of metabolite amounts due to potential evolution of the samples and incomplete cessation of the reaction. To ensure reliable observation of the kinetics of each metabolite, automatic sampling can be combined with the LC-MS system [23]. Fenton reactions or ultrasound (US) treatments were previously monitored online with detections by Fourier transform infrared spectroscopy (FTIR) [24], illumination-assisted droplet spray ionization mass spectrometry IA-DSI-MS [25] or fluorescence [26].
The aim of the present study is to demonstrate the feasibility of monitoring the kinetics of a Fenton reaction or US treatment by means of LC-HRMS. This coupling will thus make it possible to increase both the sampling frequency and to minimize the sample analysis time, allowing access to the most unstable metabolites [25].

2. Results and Discussion

2.1. Influence of Sample Storage after High Frequency Ultrasound (HFUS) Treatment

Figure 1 shows the effect of storage time on the concentration of residual ATZ. At 0-day, the initial ATZ solutions were treated by US experiments with and without Fe2+ respectively (US+Fe2+ and US) at room temperature. Samples were taken after 2 h for LC-HRMS analysis, and then transferred to different temperatures refrigerators (4 °C, −20 °C, −80 °C) for analysis after 7 and 30 days.
High frequency ultrasound (HFUS) used at 525 kHz generates high temperature and a high-pressure region of bubbles in which hydroxyl radicals (HO·) and hydrogen radicals () are produced by water splitting, and then the self-combination of radicals HO· gives hydrogen peroxides (Equations (1) and (2)) [27]. Fe2+ promotes the regeneration of radical (HO·) from hydrogen peroxide (Equation (3)) [28]. The combination of Fe2+ and HFUS acts in concert towards the production of hydroxyl radicals (HO·), which promotes the degradation of ATZ. As shown in Figure 1, at 0-day, the concentration of residual ATZ of US+Fe2+ treatment for 2 h was much lower than that of US treatment for 2 h.
H 2 O     [ + U S ]   H O · + H ·
H O ·   +   H O ·           H 2 O 2
F e 2 +   +     H 2 O 2           F e 3 +   +   H O ·     +     O H
In addition, with the increase of storage time, the concentration of residual ATZ decreased. Lower storage temperature prevented the reduction of residual ATZ to some extent, but still could not stop the further reactions during storage. This observation shows the interest of minimizing the interval time between treatment and its characterization in order to be able to monitor the least stable metabolites as well as possible.

2.2. Sonolysis and Fenton Reaction Reactor Coupled to LC-HRMS

To minimize degradation caused by the presence of ions or reactive molecules, automatic sampling was performed directly from the reactor containing the atrazine solution. Samples were then chromatographically separated. Conventional sampling followed by LC-MS or LC-MS/MS [13,29] analysis requires incompressible time of minutes or even days when the instruments are unavailable for analysis. Our experimental set up (see Section 3.5.6) makes it possible to take samples in real time and to analyze samples with a cycle of 4 min. A liquid circulation system was set up through flexible tubes, replaced regularly to limit adsorption and release phenomena, and a glass tip in suction was equipped for sampling. A specially designed peristaltic pump was used, so as to ensure flow rates on the order of 1 mL/min and limit the dead volume of the sampling loop. A high-pressure six-way valve ensured a 4 min cycle of sampling and injection into the HPLC system. This valve was switched to the analysis position, while an internal standard consisting of ATZ-D5 was injected via the HPLC syringe, and switched back to sampling mode 50 s after initial analysis time (T0), thus allowing a sampling cycle of 3.10 min before the next chromatographic separation.
Since the treatments last for several hours, it is important to add a constant quantity of internal standard to the sample, which normalizes the areas of metabolites’ peaks. Any degradation of the chromatographic separation was monitored for possible contamination of the ionization source by electrospray and mass drift of the analyzer, especially when Fe2+ ions are present in Fenton treatments as well as in US+Fe2+ treatments. Here, the more portable low-frequency ultrasound (LFUS) device at 50 kHz was used instead of the unportable high-frequency ultrasound (HFUS) device at 525 kHz.
Acquisition without prior selection of precursors is possible using the high-resolution mass spectrometer. This enables non-targeted analysis and helps to understand the reaction mechanism.

2.3. Related Compounds

The initial substrate ATZ, internal standard ATZ-D5, and other detected metabolites are shown in Table 1. The “metabolite level” corresponds to the potential level of transformations from ATZ to metabolite according to the degradation pathways (see Figure S2. Proposed atrazine degradation pathways scheme).

2.4. Degradation Rate of Atrazine

2.4.1. Effect of Fenton Reagents Equivalents

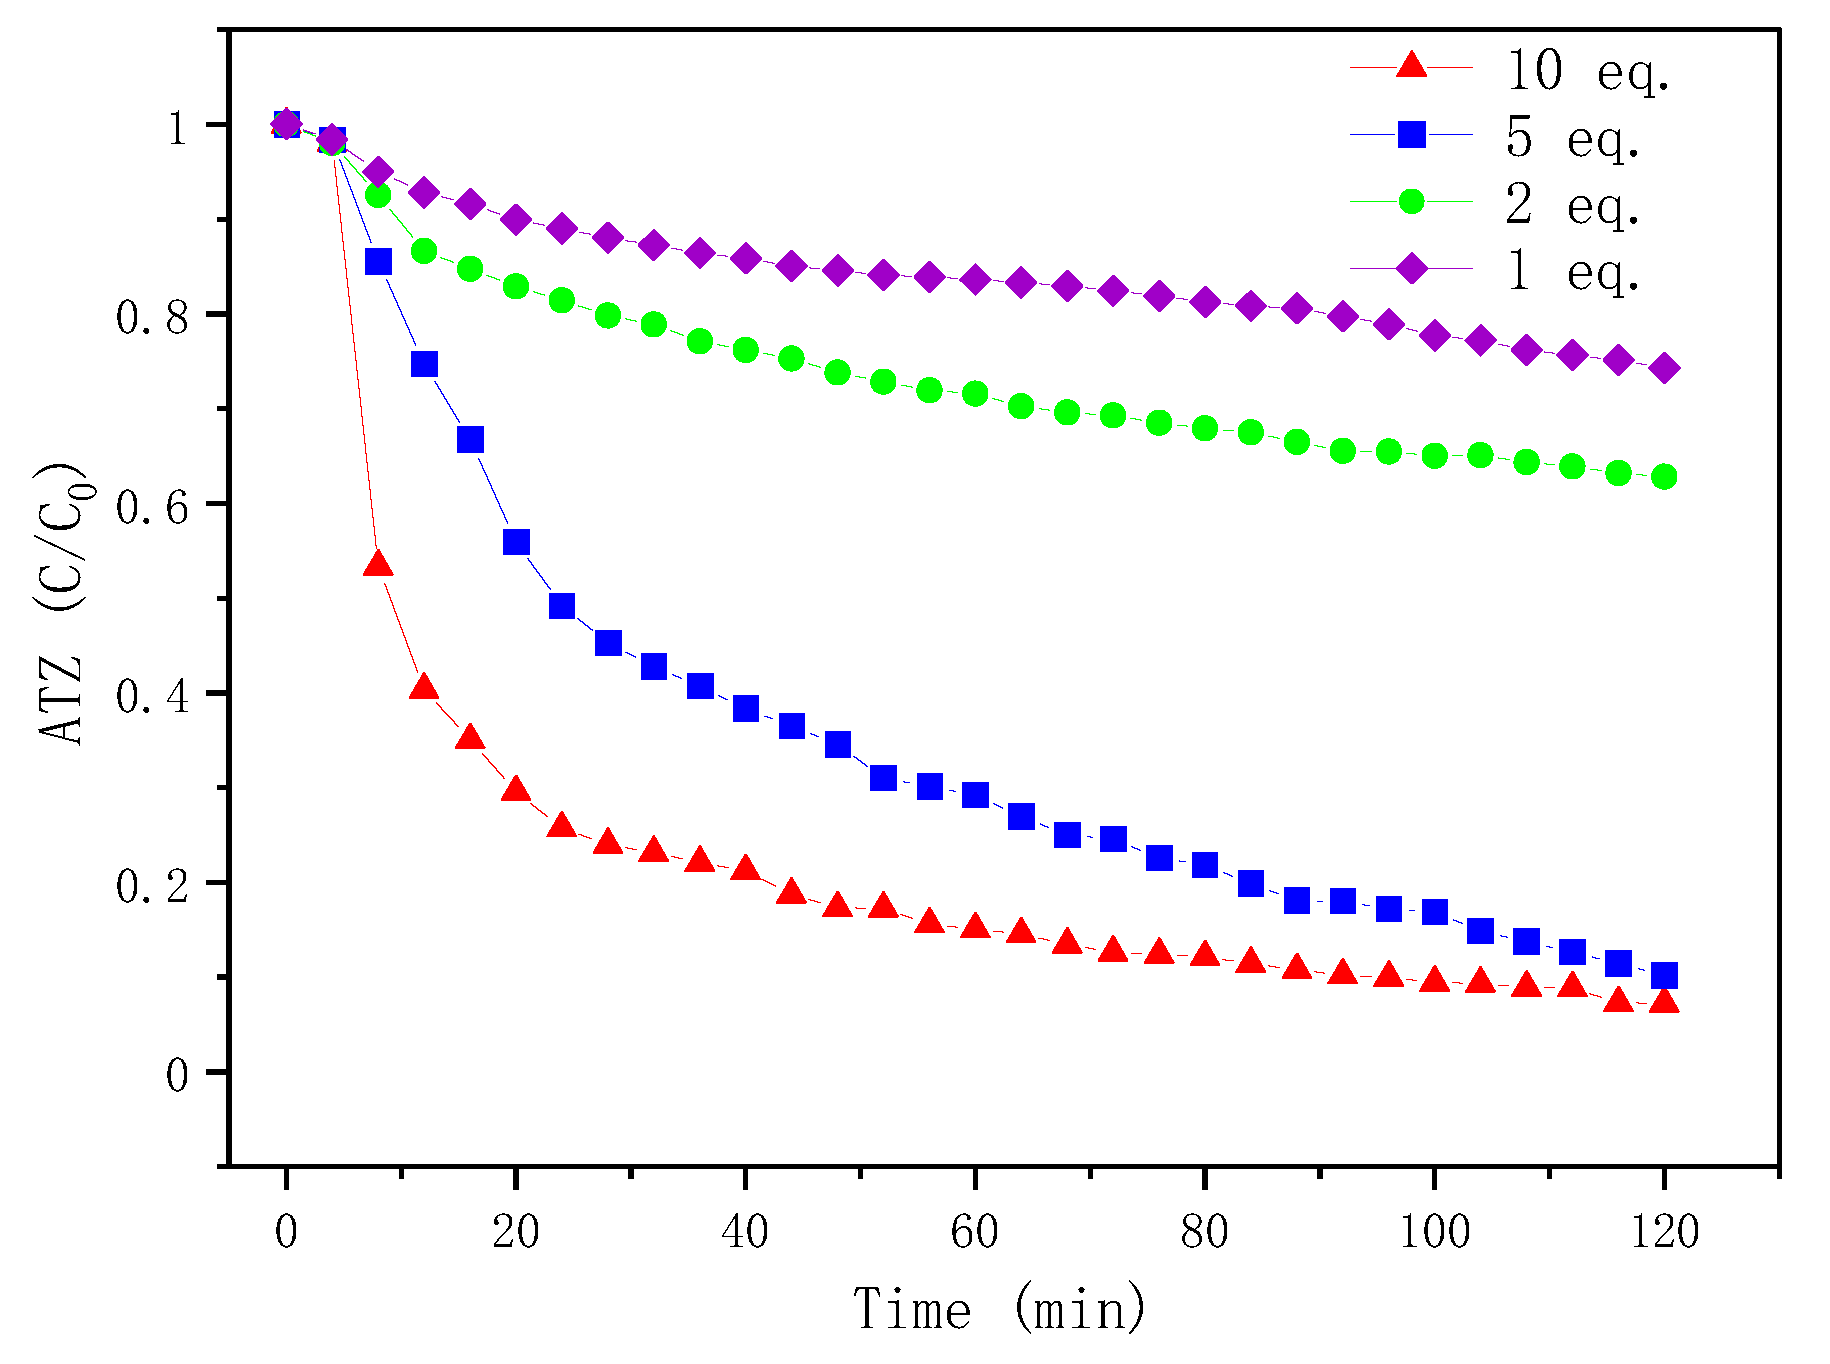
Since the Fenton reagents play an important role in Fenton oxidation, experiments in different Fenton reagent equivalents were conducted. Here, the equivalent of Fenton reagents is the ratio of [H2O2] or [Fe2+] to ATZ, where the molar concentrations of H2O2 or Fe2+ are kept the same.
As shown in Figure 2, under low equivalents of Fenton reagents at 1 eq. and 2 eq. (The abbreviation “eq.” means equivalent.), the degradation rates were very slow. Only 25.7% and 37.2% of ATZ were degraded after two hours. However, increasing the equivalent of Fenton reagents effectively promoted the degradation of ATZ. It was found that ATZ was rapidly degraded within 20 min under high equivalents of Fenton reagents at 5 eq. and 10 eq. Then, the degradation rates slowed down to 89.8% and 92.7%, respectively, in 2 h.
The promotion effect of Fenton reagents could result from the production of hydroxyl radicals (HO·). Hydrogen peroxide (H2O2) was activated by ferrous ion (Fe2+) to generate hydroxyl radicals (HO·). Radicals HO· were strong oxidants to degrade organic compounds RH (Equations (3) and (4)). In addition, Fe2+ can be regenerated by the reduction of Fe3+ with H2O2 according to Equation (5). The need to use a large amount of hydrogen peroxide argues for the exclusion of a radical chain mechanism. High equivalents of Fenton reagents were more favorable.
R H + H O ·     H 2 O + R ·
F e 3 + + H 2 O 2   F e 2 + + H O 2 · + H +

2.4.2. Effect of LFUS Treatment with/without Fe2+

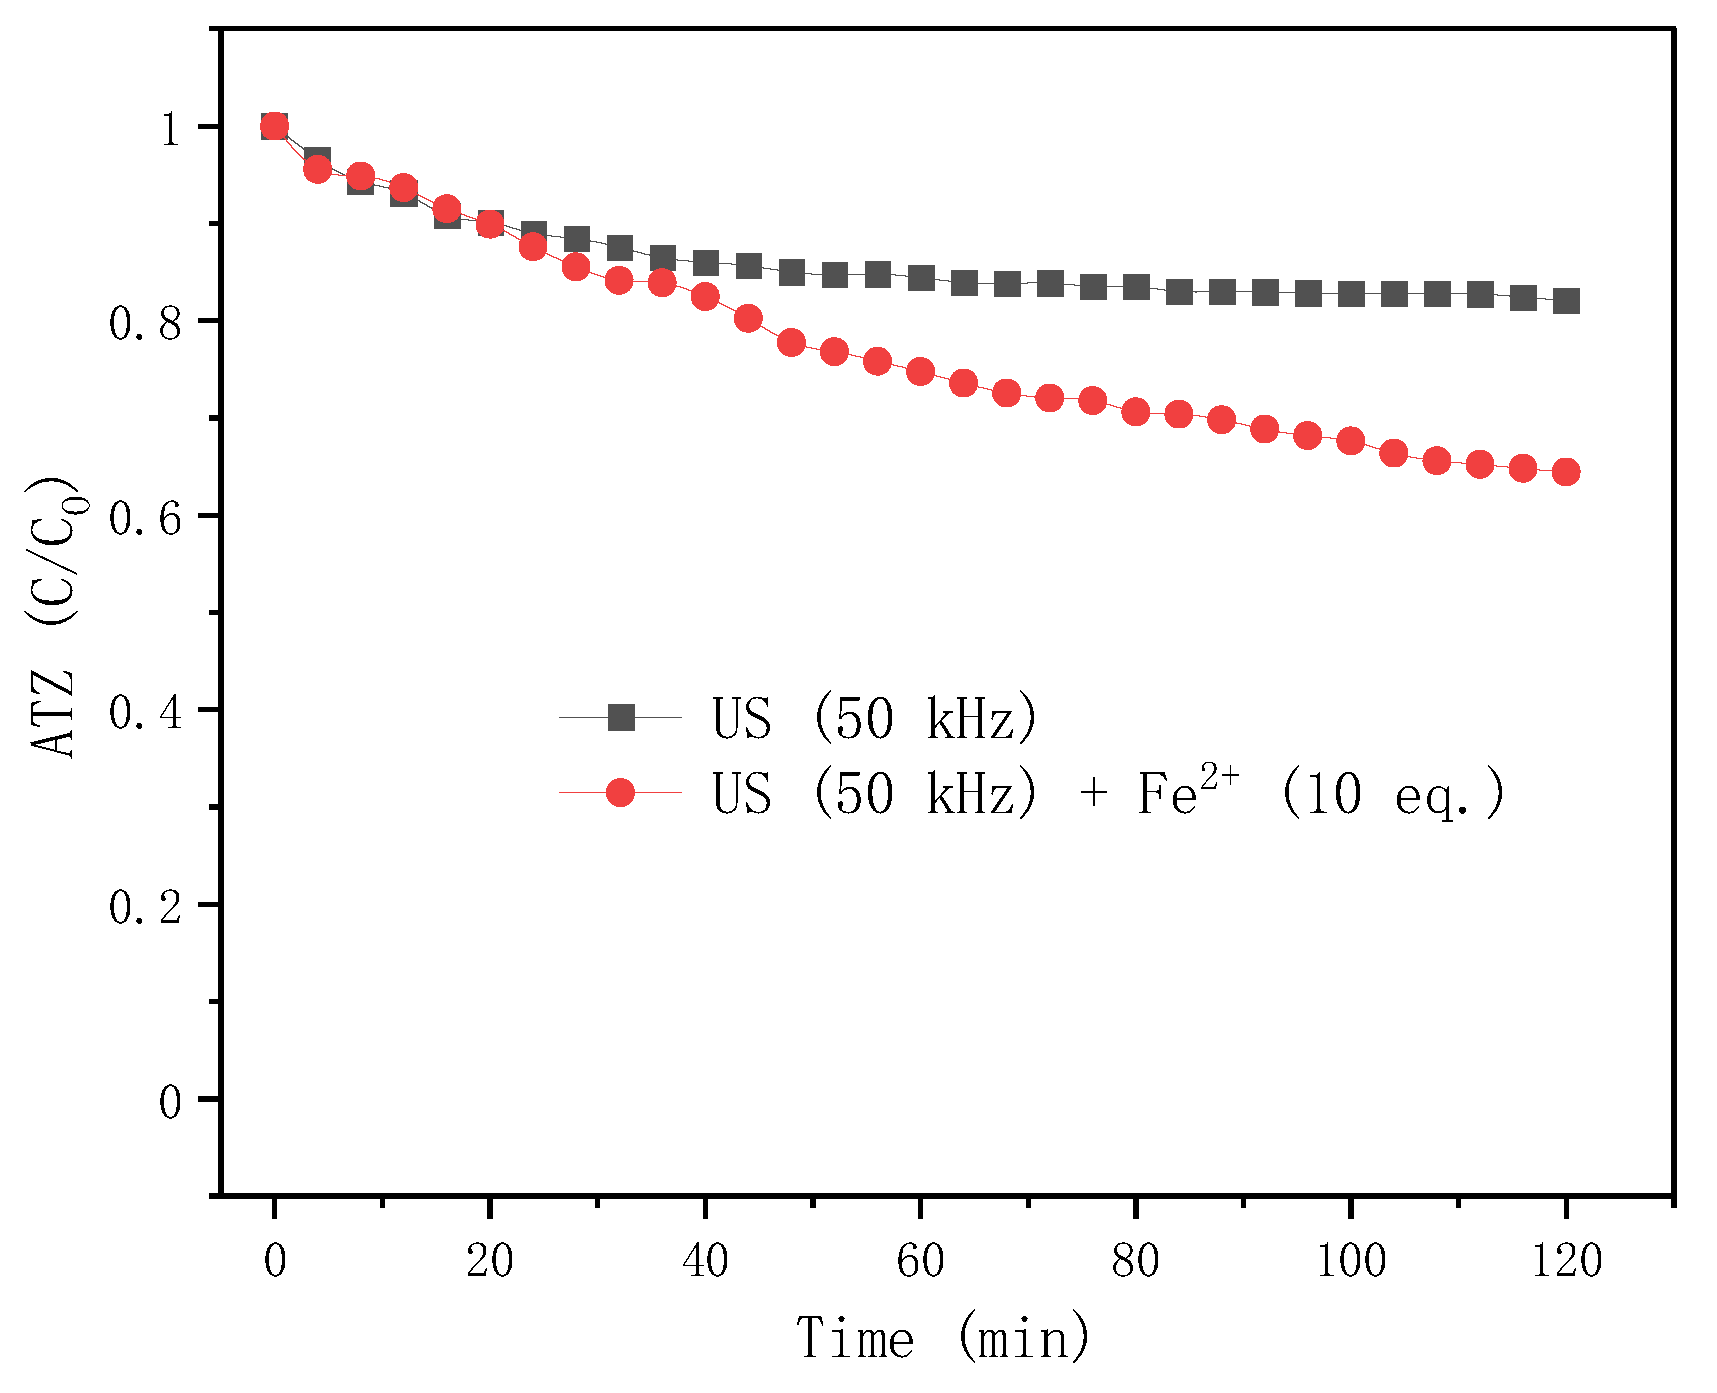
For online low-frequency ultrasound (LFUS) treatment at 50 kHz (70 W), adding or not adding Fe2+ showed an obvious difference in ATZ degradation. As shown in Figure 3, at the first 20 min, the presence or absence of Fe2+ had little effect on ATZ degradation, but after 30 min, the degradation rate of ATZ was significantly increased by the activation of Fe2+. A large number of transformations are in competition [30], according to the following admitted Equations (1)–(9). However, experimentally we can observe a beneficial effect on the generation of radicals both by ultrasound and the presence of ferrous ions.
F e 2 + + H O ·         F e 3 + + H O
F e 2 + + H O 2 ·         F e 3 + + H O 2
F e 3 + + H O 2 ·         F e 2 + + O 2 + H +
H 2 O 2     [ + U S ]       2 H O ·
Indeed, the mechanism of ultrasound is the implosion of the bubble with high energy, followed by the generation of hydroxyl radicals (HO·) and hydrogen radicals () from water and hydrogen peroxide dissociation (Equations (1) and (9)). At the same time, HO· could be consumed by the in-situ H2O2 formation occurring in the bulk solution due to the radicals’ recombination (Equation (2)), which is not conducive to ATZ degradation. Fe2+ promotes ATZ degradation, possibly because it reacts with H2O2 and re-releases HO· (Equation (3)). Other transformations and recombination involving the radicals are possible and are not exhaustively reported.

2.4.3. Atrazine Degradation of Offline Fenton Experiments

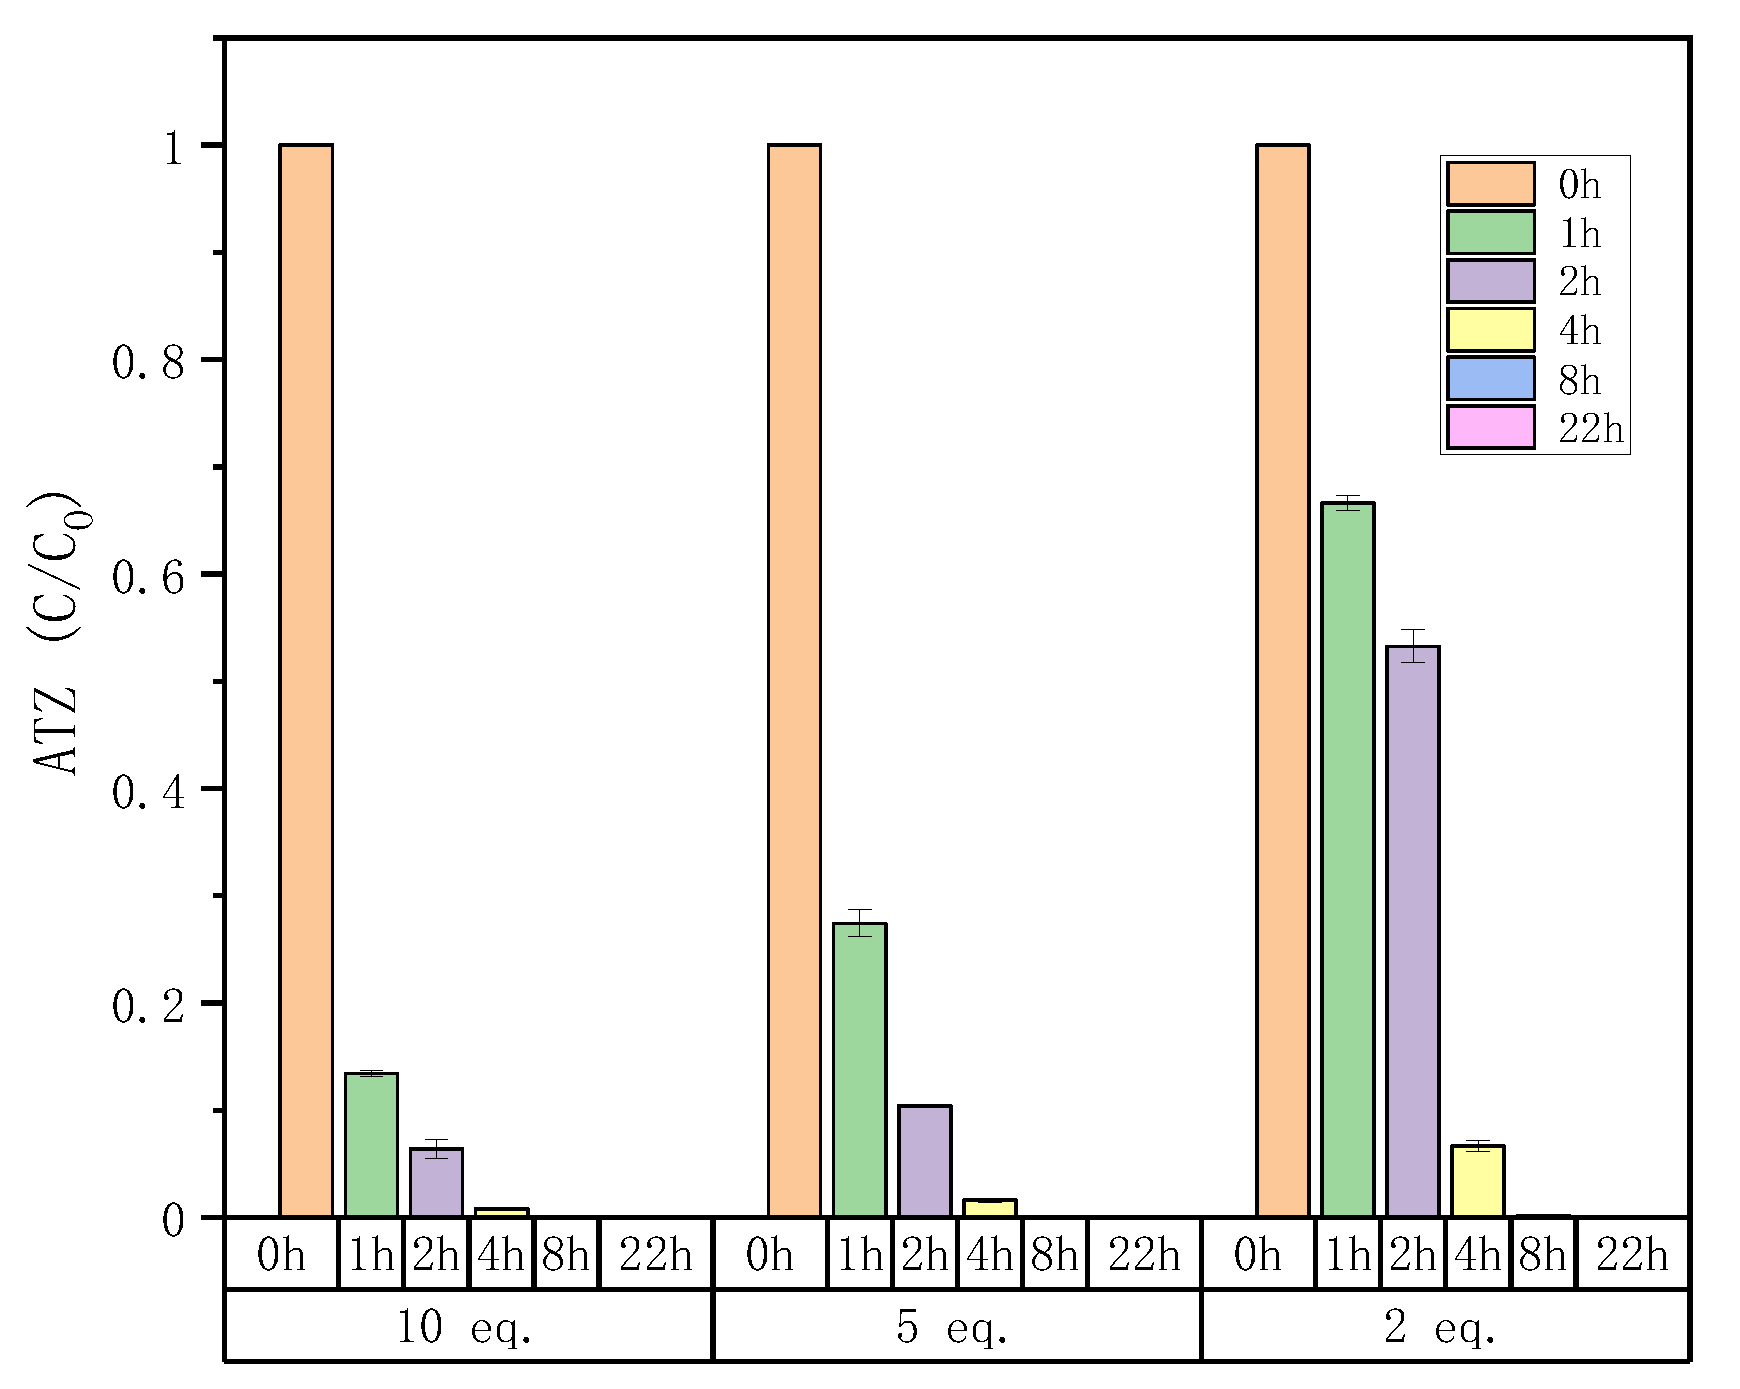
In order to study the effect of the Fenton oxidation reaction time on ATZ degradation, offline Fenton experiments were conducted. As shown in Figure 4, the reaction time had a great influence on the ATZ degradation. Regardless of the equivalents of Fenton reagents, the degradation rate of ATZ increased with time, and it was almost completely degraded after 8 h. In addition, comparing with Figure 2, at 2 h, for the same equivalent of Fenton reagents, the ATZ degradation rates of offline Fenton seem to be greater than that of online Fenton. For example, after 2 h, the ATZ degradation rates of online Fenton at 2 eq., 5 eq. and 10 eq. are 37%, 90% and 93%, respectively (Figure 2), while that of offline Fenton at 2 eq., 5 eq. and 10 eq. are 47%, 90% and 94% (Figure 4). This is probably because the solution in the vial was still reacting after sampling, as we were able to observe during the stability tests (Figure 1). So, in order to improve accuracy, online HPLC-HRMS analysis is necessary, which can monitor the reaction process in real time.

2.5. Kinetics of Metabolites

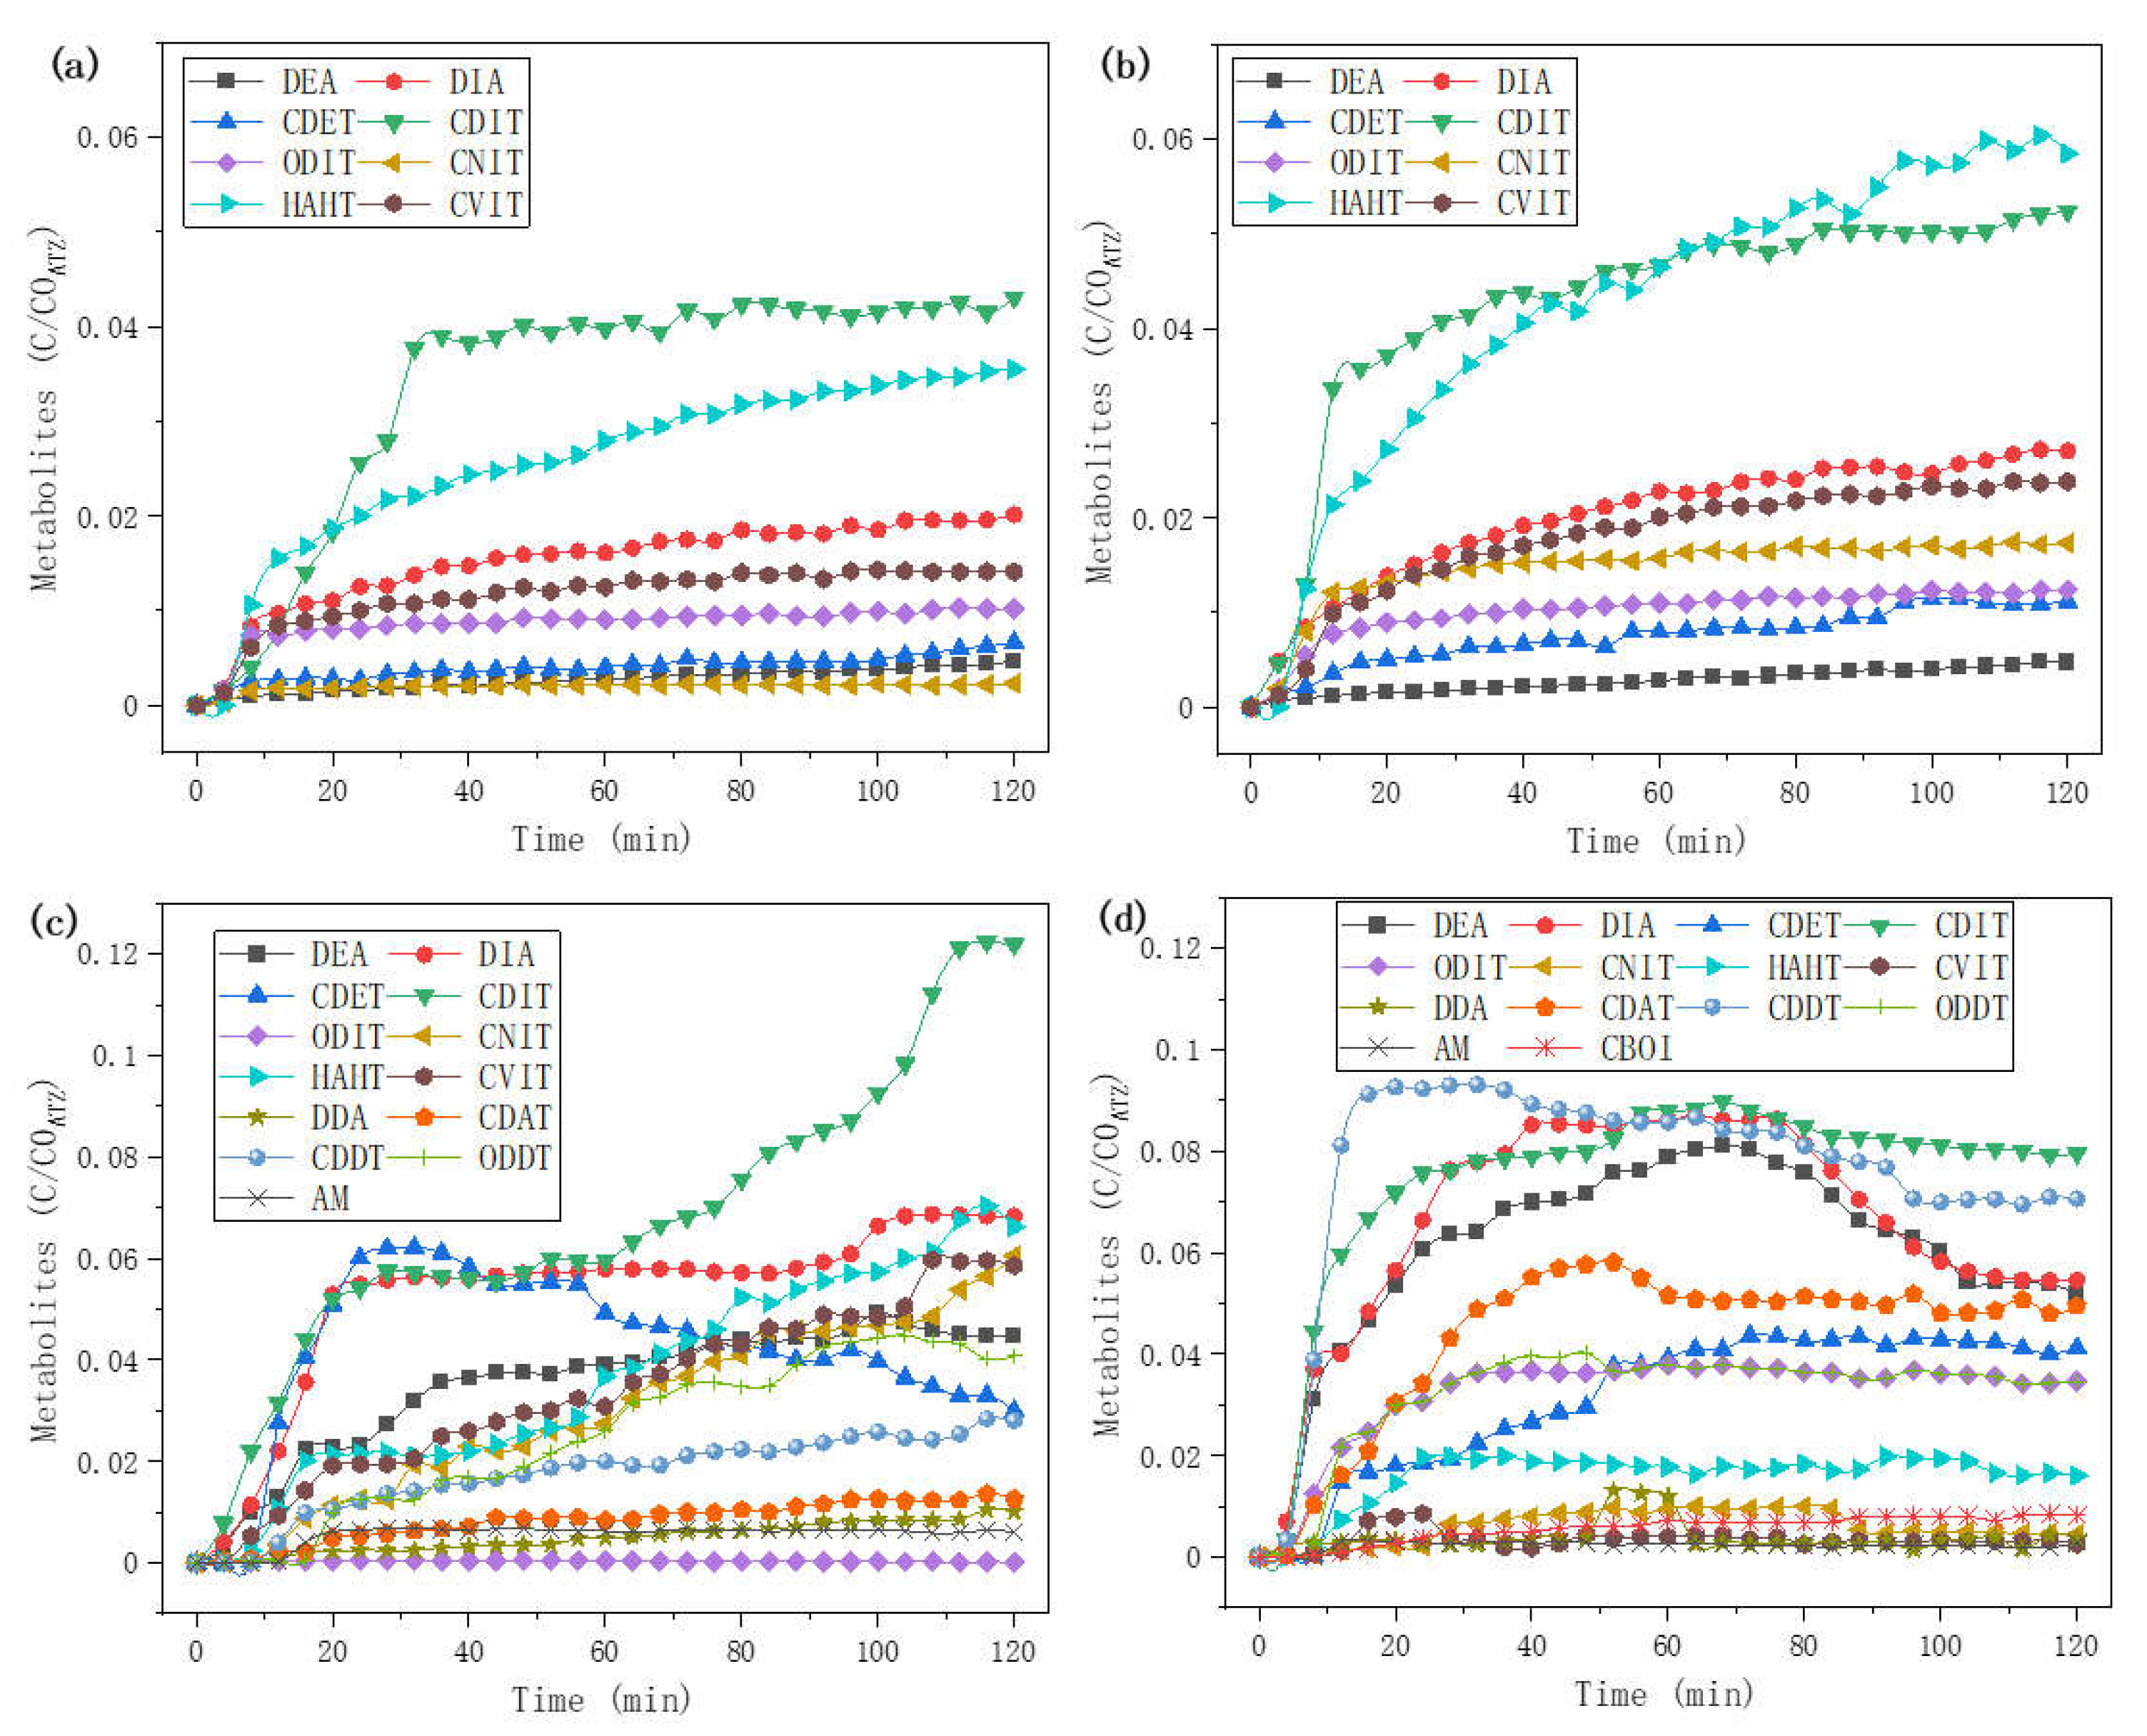
The equivalents of Fenton reagents affect the production of metabolites during the reaction. As shown in Figure 5, the kinetics of metabolites varies from the different equivalents of Fenton reagents. Generally, the kinetics of metabolites in high equivalents of the Fenton reagents system are more complicated, with more products, especially late degradation products such as AM [13]. With 1 and 2 eq. of oxidants, corresponding to the Fenton process (Figure 5a,b), 8 metabolites (DEA, DIA, CDET, CDIT, ODIT, CNIT, HAHT, and CVIT) were detected, but their changing trends were different. With 1 eq. Fenton reagents (Figure 5a), CDIT increased rapidly in the first 30 min until it reached about 4% and tended to balance; HAHT was more than CDIT in the first 20 min, but then its growth rate slowed down until the final 3.4%; other main products were DIA, CVIT and ODIT. With 2 eq. Fenton reagents (Figure 5b), CDIT reached balance earlier and was greater than 4%; HAHT increased faster and eventually surpassed CDIT; other main products were DIA, CVIT and CNIT.
With 5 eq. and 10 eq. Fenton reagents (Figure 5c,d), except the above 8 metabolites (DEA, DIA, CDET, CDIT, ODIT, CNIT, HAHT, and CVIT), another 5 metabolites (DDA, CDAT, CDDT, ODDT, and AM) were detected. In addition, a ring-broken compound CBOI was found in the 10 eq. Fenton process. In general, for a high equivalents Fenton process, the metabolites increased rapidly in the first 20 min due to the quick activation of H2O2 by Fe2+, and also more late degradation products were generated due to a higher concentration of hydroxyl radicals (HO·). With 5 eq. Fenton reagents (Figure 5c), CDIT, HAHT, DIA, CVIT, and CNIT were still the main products; CDET increased in the first 30 min and then decreased; other main products were DEA, ODDT, and CDDT, which increased slowly; smaller molecules DDA and AM appeared. In the 10 eq. Fenton process (Figure 5d), the main products CDDT, CDIT, DIA, and DEA were all firstly increased and then decreased; other main products CDAT, CDET, ODIT, ODDT, and HAHT were all increased until they reached balance; DDA had a small peak around 55 min, while AM was still a small amount as well as the ring-broken compound CBOI.
As shown in Figure 6, ferrous ion Fe2+ has an effect on the kinetics of metabolites during the US process. Six metabolites (DEA, DIA, CDIT, ODIT, and HA) were detected in US treatment without Fe2+ (Figure 6a), while 3 more metabolites (DEHA, CDET, and ODET) were detected in US treatment with Fe2+ (Figure 6b). When using ultrasound without Fe2+, the metabolites increased very slowly in the first 20 min. This is probably because the initial US cavitation had not produced enough hydroxyl radicals (HO·). The main product DIA increased to the maximum at 40 min and then decreased, while the second main product CDIT increased in the first 60 min and then reached balance. DEA increased slowly all the time; ODIT increased suddenly at 40 min and then approached DEA. When using ultrasound with Fe2+, DIA and DEA increased to the maximum at 30 min and 76 min, respectively, and then decreased. ODIT linearly increased. In comparison, adding Fe2+ promoted the generation of dealkylation products (DIA and DEA), and the dichlorination products (ODIT, ODET, HA and DEHA), but inhibited the generation of acylation products CDIT.
In Fenton oxidation, the substitution of chlorine by hydroxyl is favored by the increase of Fenton reagents’ amount (Table 2). However, the ratio of metabolites without chlorine to metabolites with chlorine is relatively stable over time in the case of the Fenton reaction, regardless of the amount of Fenton reagents once the threshold of 50 min has been reached. This result is consistent with the previous work [31] which proposed a practical model for predicting ATZ decay performance based on the Fenton reagents. In this model, Fenton’s process can be characterized as a process with two stages (i.e., a rapid stage I followed by a retarded stage II). In rapid stage I, the rapidly generated HO· radicals prioritized the allylic-oxidation and the dealkylation of ATZ, competing with the dechlorination of ATZ. In retarded stage II, HO· radicals were deficient, but some less reactive radicals (HOO· and O2·) presented. These less reactive radicals were not active enough to oxidize ATZ, but were still useful in oxidizing selective intermediates. Therefore, although dechlorinated products were slowly increasing, chlorinated products remained at a high level throughout the Fenton process due to the rapid initial production and consumption of HO· radicals.
As proposed in previous works [13,32], in the US system, ATZ molecules mainly congregate and decay at the gas bubble interfaces, and only a small proportion decayed in the bulk solution because HO· radicals concentrate and react at the surface of bubbles. Radicals HO· tend to degrade ATZ through allylic oxidation and dealkylation. So, at the bubble interfaces, ATZ is rapidly converted to chlorinated products. These chlorinated products and ATZ re-diffused to the bubble interface will be continuously degraded by newly generated HO· radicals, followed by the gradual increase of dechlorinated products. Furthermore, Fe2+ can release C radicals through the Fenton reaction with H2O2 generated from the self-combination of HO· radicals. Therefore, in the US+Fe2+ system, there are more HO· radicals than in the US-only system, which contributes to the increased ratio of dechlorinated products to chlorinated products (Table 2). This ratio increases obviously over time, in contrast to Fenton’s, because HO· radicals are continuously generated in the US system but rapidly generated and depleted in the Fenton system.
For Fenton oxidation, whatever the amount of iron, amidation is the most observed process followed by dealkylation after 50 min (Table 3), which is in agreement with the most recent work [29]. In the context of the use of ultrasound, a simple transformation of ATZ to HA is observed, as also observed by Shi when using a catalyst [33]. Fenton reactions mainly produce metabolites by amildation. Petrier [14] proposed a mechanism suited to the operating conditions. Ultrasonic reactions produce more abundant dealkylated compounds, to the detriment of amides, hydroxy and dehydrogenated.
Preferential oxidation paths are observed depending on the quantity of hydroxyl radicals produced and available. The greater this quantity of radicals, the deeper the oxidation, up to an opening of the aromatic ring. In the light of these first results, it would be interesting to follow some degradation products such as CNIT to identify their evolution either towards CDIT or towards imines that can serve as intermediaries for the creation of dealkylated metabolites.

3. Materials and Methods

3.1. Chemicals and Reagents

Solvents and formic acid were purchased from Biosolve Chimie with UPLC-MS grade (Dieuze, Moselle, France). Atrazine (ATZ), atrazine-D5 (ATZ-D5), deisopropylatrazine (DIA), deethylatrazine (DEA), deethyldeisopropylatrazine (DEDIA), hydroxyatrazine (HA) and ammeline (AM) were purchased from Sigma-Aldrich (St. Quentin Fallavier, France). Buffers were prepared with Milli-Q water, purified using a Milli-Q system (Millipore, Molsheim, France).

3.2. Internal Standard (IS) Preparation

Atrazine isotopically labelled with 5 deuterium (ATZ-D5) was used as an internal standard. To prepare a working IS solution, ATZ-D5 solution of 2 mg/L in acetonitrile was diluted to 15 ng/mL in distilled water.

3.3. Preparation of Calibration Standard and Quality Control (QC) Samples

Stock solutions of ATZ, DEA, DEDIA, AM, HA and DIA were prepared separately at 50 mg/L by dissolving accurately-weighed amounts of the compound in methanol. The working standard solutions of ATZ were prepared by serial dilution of the ATZ stock solutions with distilled water, to give final concentrations of 10, 5, 2, 1, 0.5 and 0.25 ng/mL. Calibration curve standard samples of ATZ were prepared by spiking 20 µL of IS solution with 180 µL of working standard solutions. QC samples were prepared in the same way.

3.4. Sample Preparation

An automatic sampling method was used for the online analysis. Online samples were taken every 4 min. The reaction solution (4 µL) was automatically injected into the HPLC, while the IS solution (2 µL) was added when switching the sampling valve by HPLC auto injector. For offline analysis, the reaction solution (50 µL) was manually mixed with the IS solution (20 µL). Then the 1 µL mixed solution was injected into the LC-HRMS (see Section 3.5.5).

3.5. Instrumentation and Analytical Conditions

3.5.1. Offline HFUS Experiment with/without Fe2+

Two initial solutions of ATZ (20 mg/L, 50 mL, 4.64 µmol) with/without 10 eq. Fe2+ (13 mg, 46.4 µmol FeSO4∙7H2O) were treated by ultrasound (525 kHz, 80 W) for 2 h. After these two experiments, 2 × 9 samples were taken (1 mL of final treatment solution was added to 1.5 mL of vial), 2 × 3 of which were used for 0-day analysis, and the rest were stored in different refrigerators (4 °C, −20 °C, and −80 °C). Absolute quantification was performed by LC-UV at 260 nm without addition of internal standard.

3.5.2. Online Fenton Experiment

The initial solution of ATZ (20 mg/L, 92.72 µmol/L) was prepared by dissolving ATZ (5 mg, 23.18 µmol, 215.68 g/mol) into 250 mL of distilled water. Different equivalents of Fenton reagents 10 eq., 5 eq., 2 eq. and 1 eq. were added, respectively, to four initial solutions of ATZ (15 mL, 1.392 µmol): FeSO4∙7H2O (10 eq., 3.9 mg, 13.92 µmol) and 30% H2O2 solution (10 eq., 1.422 mL, 13.92 µmol); FeSO4∙7H2O (5 eq., 1.95 mg, 6.96 µmol) and 30% H2O2 solution (5 eq., 0.711 mL, 6.96 µmol); FeSO4∙7H2O (2 eq., 1.56 mg, 2.784 µmol) and 30% H2O2 solution (2 eq., 0.284 mL, 2.784 µmol); FeSO4∙7H2O (1 eq., 0.39 mg, 1.392 µmol) and 30% H2O2 solution (1 eq., 0.142 mL, 1.392 µmol). Those four reactions were incubated for 2 h with a magnetic stirrer at 500 rpm. The time t = 0 min corresponds to the first LCMS sample tested. Fenton reagents were added at t = 4 min.

3.5.3. Online LFUS Experiment with/without Fe2+

The initial solution of ATZ (15 mL, 1.392 µmol) without Fe2+ was treated by ultrasound (50 kHz, 70 W) for 2 h. Then, in another controlled experiment with Fe2+, the initial solution of ATZ (15 mL, 1.392 µmol) was treated by ultrasound (50 kHz, 70 W) in the same way, but after 4 min FeSO4∙7H2O (10 eq., 3.9 mg, 13.92 µmol) was added. As the temperature rose during ultrasonic treatment, a water circulating cooling device was used on the outer wall of the reaction system.

3.5.4. Offline Fenton Experiment

Nine initial atrazine solutions (7.5 mL, 0.696 µmol) were divided into three groups, and then different equivalents of Fenton reagents 10 eq., 5 eq. and 2 eq. were added, respectively. The reactions were incubated on a magnetic stirrer at 500 rpm. Samples were taken at 0 h, 1 h, 2 h, 4 h, 8 h and 22 h. At time t = 0 min, Fenton reagents were not added. At time t = 4 min, Fenton reagents were added.

3.5.5. HPLC-HRMS

Atrazine and metabolites detection and semi quantitative evaluation were performed by LC-HRMS. The HPLC system (Infinity 1290, Agilent Technologies, France) with DAD, was connected to a Q-TOF micro hybrid quadrupole time of flight mass spectrometer (Agilent 6538, Agilent Technologies, France) with electrospray ionization (ESI). HPLC was carried out on a Thermo Hypersyl Gold C18 (USP L1) column (100 × 2.1 mm, 1.9 µm, 175 A), connected to an Agilent Infinity 1290 HPLC at 40 °C. The solvent system was A: 0.1% formic acid in H2O and B: Acetonitrile. The gradient program began with 5% B, held at % for 0.3 min and ramped to 30% B at 1.7 min and to 95% at 3.5 min, held at 95% for 0.5 min, until decreased to initial condition and held at 5 % for 0.5 min. The flow rate was set at 0.600 mL/min. All compounds’ responses were measured in ESI+ and were calibrated externally. The ESI Gas Temp was 350 °C, at electrospray voltage +3800 V. Drying Gaz was set at 10 L/min and Nebuliser was at 30 psi. Fragment voltage was set at 110 V. HRMS spectrum was registered at 5 Hz in the mass range of 50 to 1200 m/z with internal calibration.

3.5.6. HPLC-HRMS Online Setup

The system consists of a 20 mL glass reactor with a double wall for temperature control and an ultrasound probe (Figure 7a). Sampling is carried out by suction using a peristaltic pump (Welco WMP1-F1.6FB-WP), equipped with a brushless motor. This pump was used with a voltage of 13 V DC corresponding to a flow rate of 1 mL/min. A glass tip was inserted into a flexible tube with 1.6 mm internal diameter connected to a 6-way high pressure valve (Agilent 1316C module). A sampling loop consists of a capillary tube type thermo viper SST “Black” (0.18 mm ID × 150 mm). In the initial position, the mixture is recycled to the reactor. At the time of analysis, the content of the loop is sent to the automatic injector which simultaneously injects 1 µL of an ATZ-D5 (IS) solution before being separated and analysed on the LC-ESI-HRMS system. After 50 s, the valve switches back to its initial state in order to prepare the next sample. The sampling and analysis cycle have a 4 min duration.

3.6. Data Analysis

Software MassHunter (Version B.07.00, Agilent Technologies, Santa Clara, CA 95051, USA), was used for data processing. For Mass Profiler Pro workflow, an untargeted compound was generated by MFE algorithm.

3.7. Compound Identification

The main metabolites of atrazine were validated by the conjunction of exact mass, MS/MS fragmentations, and retention time from standards [34]. A complementary list of metabolites was established from the literature and sought from the exact mass of the mono-isotope ion, if necessary, verified by MS/MS and compared in relative retention time compared to data from the literature (Table S2. List of metabolites targets).

4. Conclusions

In this work, the atrazine degradation process of Fenton/US treatment was monitored in real-time by an online HPLC-HRMS analysis system. Compared with offline analysis, online analysis can avoid additional reactions after sampling, which greatly improved measurement accuracy. In addition, this online method is effective because of automatic sampling and it only takes 4 min analysis time. During analysis, ATZ, ATZ-D5, and seventeen metabolites were identified by accurate mass measurement, which provided abundant information on the atrazine degradation process. The results showed that high equivalents of Fenton reagents promoted the degradation rate of ATZ and the generation of late degradation products such as AM. In addition, adding Fe2+ accelerated ATZ degradation in US treatment. The kinetics of metabolites in different conditions was useful for mechanisms research. However, because of the complexity of the reaction process, there are still compounds that are difficult to detect, especially the small and trace molecules. Therefore, for follow-up work, set-up improvement and conditions optimization will be conducted, so as to expand the upper and lower detection limits and improve detection accuracy.

Supplementary Materials

The following supporting information can be downloaded at: https://www.mdpi.com/article/10.3390/molecules27249021/s1, Table S1: Metabolite identification of Fenton oxidation (2 eq. Fenton reagents) and ultrasound treatment (US 50 kHz + Fe2+) after 50 min; Table S2: List of metabolites targets; Figure S1: Extracted ion chromatogram (LC-ESI+) during the degradation of atrazine in automatic sampling during the experiment of 2 eq. Fenton reagents (m/z ± 20 ppm); Figure S2: Proposed atrazine degradation pathways scheme. The red and blue boxes, respectively, indicate the main products of Fenton oxidation (2 eq. Fenton reagents) and ultrasound treatment (US 50 kHz + Fe2+) after 50 min. References from Supplementary materials [35,36,37,38,39,40,41,42,43,44,45,46,47,48,49,50,51,52,53,54,55,56,57,58,59,60,61,62,63,64,65,66,67,68,69,70,71,72,73,74,75,76,77,78,79,80] are shown at the end of this article.

Author Contributions

Conceptualization, J.H. and F.M.; methodology, J.H. and F.M.; writing—original draft preparation, J.H. and F.M.; writing—review and editing, J.H., N.B., G.E., N.G. and F.M.; supervision, N.G. and F.M.; project administration, N.G. and F.M. All authors have read and agreed to the published version of the manuscript.

Funding

This research was funded by the Investments for the Future of the French Government under the reference ANR-001. The equipment used was founded by the Regional Council of Picardie and European Union CPER 2007-2020.

Institutional Review Board Statement

Not applicable.

Informed Consent Statement

Not applicable.

Data Availability Statement

Not applicable.

Acknowledgments

The first author would like to acknowledge financial support provided by the China Scholarship Council (CSC).

Conflicts of Interest

The authors declare no conflict of interest.

References

  1. Munz, N.; Leu, C.; Wittmer, I. Pesticides Dans Les Cours d’eau Suisses. Aqua Gas. 2013, 93, 78–87. [Google Scholar]
  2. Udiković-Kolić, N.; Scott, C.; Martin-Laurent, F. Evolution of Atrazine-Degrading Capabilities in the Environment. Appl. Microbiol. Biotechnol. 2012, 96, 1175–1189. [Google Scholar] [CrossRef] [PubMed]
  3. Fan, X.; Song, F. Bioremediation of Atrazine: Recent Advances and Promises. J. Soils Sediments 2014, 14, 1727–1737. [Google Scholar] [CrossRef]
  4. He, H.; Liu, Y.; You, S.; Liu, J.; Xiao, H.; Tu, Z. A Review on Recent Treatment Technology for Herbicide Atrazine in Contaminated Environment. Int. J. Environ. Res. Public Health 2019, 16, 5129. [Google Scholar] [CrossRef] [PubMed] [Green Version]
  5. Komang Ralebitso, T.; Senior, E.; Van Verseveld, H.W. Microbial Aspects of Atrazine Degradation in Natural Environments. Biodegradation 2002, 13, 11–19. [Google Scholar] [CrossRef] [PubMed]
  6. Hong, J.; Boussetta, N.; Enderlin, G.; Merlier, F.; Grimi, N. Degradation of Residual Herbicide Atrazine in Agri-Food and Washing Water. Foods 2022, 11, 2416. [Google Scholar] [CrossRef] [PubMed]
  7. Hayes, T.B.; Khoury, V.; Narayan, A.; Nazir, M.; Parka, A.; Brown, T.; Adame, L.; Chan, E.; Buchholz, D.; Stueve, T.; et al. Atrazine Induces Complete Feminization and Chemical Castration in Male African Clawed Frogs (Xenopus Laevis). Proc. Natl. Acad. Sci. USA 2010, 107, 4612–4617. [Google Scholar] [CrossRef] [Green Version]
  8. Wirbisky, S.E.; Freeman, J.L. Atrazine Exposure and Reproductive Dysfunction through the Hypothalamus-Pituitary-Gonadal (HPG) Axis. Toxics 2015, 3, 414–450. [Google Scholar] [CrossRef] [Green Version]
  9. Yang, N.; Liu, Y.; Zhu, J.; Wang, Z.; Li, J. Study on the Efficacy and Mechanism of Fe-TiO2 Visible Heterogeneous Fenton Catalytic Degradation of Atrazine. Chemosphere 2020, 252, 126333. [Google Scholar] [CrossRef]
  10. Sass, J.; MacLennan, P.A.; Delzell, E.; Sathiakumar, N.; Myers, S.L.; Cheng, H.; Grizzle, W.; Chen, V.W.; Wu, X.C. Cancer Incidence among Triazine Herbicide Manufacturing Workers [1] (Multiple Letters). J. Occup. Environ. Med. 2003, 45, 343–344. [Google Scholar] [CrossRef]
  11. Xiong, G.; Liang, J.; Zou, S.; Zhang, Z. Microwave-Assisted Extraction of Atrazine from Soil Followed by Rapid Detection Using Commercial ELISA Kit. Anal. Chim. Acta 1998, 371, 97–103. [Google Scholar] [CrossRef]
  12. Aggelopoulos, C.A.; Tataraki, D.; Rassias, G. Degradation of Atrazine in Soil by Dielectric Barrier Discharge Plasma—Potential Singlet Oxygen Mediation. Chem. Eng. J. 2018, 347, 682–694. [Google Scholar] [CrossRef]
  13. Xu, L.J.; Chu, W.; Graham, N. Atrazine Degradation Using Chemical-Free Process of USUV: Analysis of the Micro-Heterogeneous Environments and the Degradation Mechanisms. J. Hazard. Mater. 2014, 275, 166–174. [Google Scholar] [CrossRef] [PubMed]
  14. Petrier, C.; David, B.; Laguian, S. Ultrasonic Degradation at 20 KHz and 500 KHz of Atrazine and Pentachlorophenol in Aqueous Solution : Preliminary Results. Chemosphere 1996, 32, 1709–1718. [Google Scholar] [CrossRef]
  15. Acero, J.L.; Stemmler, K.; von Gunten, U. Degradation Kinetics of Atrazine and Its Degradation Products with Ozone and OH Radicals: A Predictive Tool for Drinking Water Treatment. Environ. Sci. Technol. 2000, 34, 591–597. [Google Scholar] [CrossRef]
  16. Ventura, A.; Jacquet, G.; Bermond, A.; Camel, V. Electrochemical Generation of the Fenton’s Reagent: Application to Atrazine Degradation. Water Res. 2002, 36, 3517–3522. [Google Scholar] [CrossRef]
  17. Zhang, Y.; Jiang, Z.; Cao, B.; Hu, M.; Wang, Z.; Dong, X. Metabolic Ability and Gene Characteristics of Arthrobacter Sp. Strain DNS10, the Sole Atrazine-Degrading Strain in a Consortium Isolated from Black Soil. Int. Biodeterior. Biodegrad. 2011, 65, 1140–1144. [Google Scholar] [CrossRef]
  18. Mortureux, M. Avis de l’Agence Nationale de Sécurité Sanitaire de l’ Alimentation, de l’ Environnement et Du Travail; Agence Nationale Sécurité Sanitaire Alimentaire Nationale (Anses): Cedex, France, 2012; Volume 33, ISBN 9782110958433. [Google Scholar]
  19. Chen, H.; Bramanti, E.; Longo, I.; Onor, M.; Ferrari, C. Oxidative Decomposition of Atrazine in Water in the Presence of Hydrogen Peroxide Using an Innovative Microwave Photochemical Reactor. J. Hazard. Mater. 2011, 186, 1808–1815. [Google Scholar] [CrossRef]
  20. Kuklenyik, Z.; Panuwet, P.; Jayatilaka, N.K.; Pirkle, J.L.; Calafat, A.M. Two-Dimensional High Performance Liquid Chromatography Separation and Tandem Mass Spectrometry Detection of Atrazine and Its Metabolic and Hydrolysis Products in Urine. J. Chromatogr. B Analyt. Technol. Biomed. Life Sci. 2012, 901, 1–8. [Google Scholar] [CrossRef] [Green Version]
  21. López-Ruiz, R.; Romero-González, R.; Martín-Torres, S.; Jimenez-Carvelo, A.M.; Cuadros-Rodríguez, L.; Frenich, A.G. Applying an Instrument-Agnostizing Methodology for the Standardization of Pesticide Quantitation Using Different Liquid Chromatography-Mass Spectrometry Platforms: A Case Study; Elsevier B.V.: Amsterdam, The Netherlands, 2021; ISBN 0000000308069. [Google Scholar]
  22. Liu, B.; Guo, W.; Wang, H.; Si, Q.; Zhao, Q.; Luo, H.; Ren, N. Activation of Peroxymonosulfate by Cobalt-Impregnated Biochar for Atrazine Degradation: The Pivotal Roles of Persistent Free Radicals and Ecotoxicity Assessment. J. Hazard. Mater. 2020, 398, 122768. [Google Scholar] [CrossRef]
  23. Merlier, F.; Jellali, R.; Leclerc, E. Online Monitoring of Hepatic Rat Metabolism by Coupling a Liver Biochip and a Mass Spectrometer. Analyst 2017, 142, 3747–3757. [Google Scholar] [CrossRef] [PubMed]
  24. Merayo, N.; Hermosilla, D.; Negro, C.; Blanco, Á. On-Line FTIR as a Novel Tool to Monitor Fenton Process Behavior. Chem. Eng. J. 2013, 232, 519–526. [Google Scholar] [CrossRef] [Green Version]
  25. Jiang, J.; Zhang, D.; Zhang, H.; Yu, K.; Li, N.; Zheng, G. Degradation Mechanism Study of Fluoroquinolones in UV/Fe2+/Peroxydisulfate by on-Line Mass Spectrometry. Chemosphere 2020, 239, 124737. [Google Scholar] [CrossRef]
  26. Fu, Y.; Li, W.; Li, H.; Huang, M. High-Precision and on-Line Measurement of Dissolved Organic Matter in Electro-Fenton Process Based on Dual Wavelength Analysis with Combination of Fluorescence Emission and Ultraviolet Absorption Spectroscopy. Anal. Chem. Acta 2021, 1181, 338904. [Google Scholar] [CrossRef] [PubMed]
  27. Wang, J.; Wang, Z.; Vieira, C.L.Z.; Wolfson, J.M.; Pingtian, G.; Huang, S. Review on the Treatment of Organic Pollutants in Water by Ultrasonic Technology. Ultrason. Sonochem. 2019, 55, 273–278. [Google Scholar] [CrossRef] [PubMed]
  28. Neyens, E.; Baeyens, J. A Review of Classic Fenton’s Peroxidation as an Advanced Oxidation Technique. J. Hazard. Mater. 2003, 98, 33–50. [Google Scholar] [CrossRef] [PubMed]
  29. Guo, Q.; Guan, C.; Luo, L.; Wang, Z.; Pan, H.; Jiang, J. New Insights into Atrazine Degradation by the Novel Manganese Dioxide/Bisulfite System: Product Formation and Mn Reuse. J. Clean. Prod. 2022, 368, 133106. [Google Scholar] [CrossRef]
  30. Bokare, A.D.; Choi, W. Review of Iron-Free Fenton-like Systems for Activating H2O2 in Advanced Oxidation Processes. J. Hazard. Mater. 2014, 275, 121–135. [Google Scholar] [CrossRef]
  31. Chan, K.H.; Chu, W. Model Applications and Mechanism Study on the Degradation of Atrazine by Fenton’s System. J. Hazard. Mater. 2005, 118, 227–237. [Google Scholar] [CrossRef]
  32. Pang, Y.L.; Abdullah, A.Z.; Bhatia, S. Review on Sonochemical Methods in the Presence of Catalysts and Chemical Additives for Treatment of Organic Pollutants in Wastewater. Desalination 2011, 277, 1–14. [Google Scholar] [CrossRef]
  33. Shi, H.; Wang, Y.; Tang, C.; Wang, W.; Liu, M.; Zhao, G. Mechanisim Investigation on the Enhanced and Selective Photoelectrochemical Oxidation of Atrazine on Molecular Imprinted Mesoporous TiO2. Appl. Catal. B 2019, 246, 50–60. [Google Scholar] [CrossRef]
  34. Schrimpe-Rutledge, A.C.; Codreanu, S.G.; Sherrod, S.D.; McLean, J.A. Untargeted Metabolomics Strategies—Challenges and Emerging Directions. J. Am. Soc. Mass Spectrom. 2016, 27, 1897–1905. [Google Scholar] [CrossRef] [PubMed] [Green Version]
  35. Balci, B.; Oturan, N.; Cherrier, R.; Oturan, M.A. Degradation of atrazine in aqueous medium by electrocatalytically generated hydroxyl radicals. A kinetic and mechanistic study. Water Res. 2009, 43, 1924–1934. [Google Scholar] [CrossRef] [PubMed]
  36. Basfar, A.A.; Mohamed, K.A.; Al-Abduly, A.J.; Al-Shahrani, A.A. Radiolytic degradation of atrazine aqueous solution containing humic substances. Ecotoxicol. Environ. Saf. 2009, 72, 948–953. [Google Scholar] [CrossRef] [PubMed]
  37. Bianchi, C.L.; Pirola, C.; Ragaini, V.; Selli, E. Mechanism and efficiency of atrazine degradation under combined oxidation processes. Appl. Catal. B. 2006, 64, 131–138. [Google Scholar] [CrossRef]
  38. Chen, S.; He, P.; Wang, X.; Xiao, F.; Zhou, P.; He, Q.; Jia, L.; Dong, F.; Zhang, H.; Jia, B.; et al. Co/Sm-modified Ti/PbO2 anode for atrazine degradation: Effective electrocatalytic performance and degradation mechanism. Chemosphere 2021, 268, 128799. [Google Scholar] [CrossRef]
  39. Deng, S.; Liu, L.; Cagnetta, G.; Huang, J.; Yu, G. Mechanochemically synthesized S-ZVIbm composites for the activation of persulfate in the pH-independent degradation of atrazine: Effects of sulfur dose and ball-milling conditions. Chem. Eng. J. 2021, 423, 129789. [Google Scholar] [CrossRef]
  40. Fernández-Domene, R.M.; Sánchez-Tovar, R.; Lucas-Granados, B.; Muñoz-Portero, M.J.; Garcia-Anton, J. Elimination of pesticide atrazine by photoelectrocatalysis using a photoanode based on WO3 nanosheets. Chem. Eng. J. 2018, 350, 1114–1124. [Google Scholar] [CrossRef]
  41. Granados-Oliveros, G.; Páez-Mozo, E.A.; Ortega, F.M.; Ferronato, C.; Chovelon, J.M. Degradation of atrazine using metalloporphyrins supported on TiO2 under visible light irradiation. Appl. Catal. B. 2009, 89, 448–454. [Google Scholar] [CrossRef]
  42. Hu, E.; Cheng, H. Catalytic effect of transition metals on microwave-induced degradation of atrazine in mineral micropores. Water Res. 2014, 57, 8–19. [Google Scholar] [CrossRef]
  43. Huang, Y.; Han, C.; Liu, Y.; Nadagouda, M.N.; Machala, L.; O’Shea, K.E.; Sharma, V.K.; Dionysiou, D.D. Degradation of atrazine by ZnxCu1−xFe2O4 nanomaterial-catalyzed sulfite under UV–vis light irradiation: Green strategy to generate SO4. Appl. Catal. B 2018, 221, 380–392. [Google Scholar] [CrossRef]
  44. Jiang, Q.; Zhang, Y.; Jiang, S.; Wang, Y.; Li, H.; Han, W.; Qu, J.; Wang, L.; Hu, Y. Graphene-like carbon sheet-supported nZVI for efficient atrazine oxidation degradation by persulfate activation. Chem. Eng. J. 2021, 403, 126309. [Google Scholar] [CrossRef]
  45. Khan, J.A.; Shah, N.S.; Khan, H.M. Decomposition of atrazine by ionizing radiation: Kinetics, degradation pathways and influence of radical scavengers. Sep. Purif. Technol. 2015, 156, 140–147. [Google Scholar] [CrossRef]
  46. Khan, J.A.; Shah, N.S.; Nawaz, S.; Ismail, M.; Rehman, F.; Khan, H.M. Role of eaq−, OH and H in radiolytic degradation of atrazine: A kinetic and mechanistic approach. J. Hazard. Mater. 2015, 288, 147–157. [Google Scholar] [CrossRef]
  47. Li, C.; Huang, Y.; Dong, X.; Sun, Z.; Duan, X.; Ren, B.; Zheng, S.; Dionysiou, D.D. Highly efficient activation of peroxymonosulfate by natural negatively charged kaolinite with abundant hydroxyl groups for the degradation of atrazine. Appl. Catal. B. 2019, 247, 10–23. [Google Scholar] [CrossRef]
  48. Li, G.; Guo, Y.; Jin, Y.; Tan, W.; Liu, F.; Yin, H. Intrinsic mechanisms of calcium sulfite activation by siderite for atrazine degradation. Chem. Eng. J. 2021, 426, 131917. [Google Scholar] [CrossRef]
  49. Lu, Y.C.; Feng, S.J.; Zhang, J.J.; Luo, F.; Zhang, S.; Yang, H. Genome-wide identification of DNA methylation provides insights into the association of gene expression in rice exposed to pesticide atrazine. Sci. Rep. 2016, 6, 1–15. [Google Scholar] [CrossRef] [Green Version]
  50. Mahlalela, L.C.; Casado, C.; Marugan, J.; Septien, S.; Ndlovu, T.; Dlamini, L.N. Photocatalytic degradation of atrazine in aqueous solution using hyperbranched polyethyleneimine templated morphologies of BiVO4 fused with Bi2O3. J. Environ. Chem. Eng. 2020, 8, 104215. [Google Scholar] [CrossRef]
  51. McBeath, S.T.; Graham, N.J. In-situ electrochemical generation of permanganate for the treatment of atrazine. Sep. Purif. Rev. 2021, 260, 118252. [Google Scholar] [CrossRef]
  52. Peng, J.; Lu, X.; Jiang, X.; Zhang, Y.; Chen, Q.; Lai, B.; Yao, G. Degradation of atrazine by persulfate activation with copper sulfide (CuS): Kinetics study, degradation pathways and mechanism. Chem. Eng. J. 2018, 354, 740–752. [Google Scholar] [CrossRef]
  53. Qu, M.; Li, N.; Li, H.; Yang, T.; Liu, W.; Yan, Y.; Feng, X.; Zhu, D. Phytoextraction and biodegradation of atrazine by Myriophyllum spicatum and evaluation of bacterial communities involved in atrazine degradation in lake sediment. Chemosphere 2018, 209, 439–448. [Google Scholar] [CrossRef] [PubMed]
  54. Saltmiras, D.A.; Lemley, A.T. Atrazine degradation by anodic Fenton treatment. Water Res. 2002, 36, 5113–5119. [Google Scholar] [CrossRef]
  55. Saylor, G.L.; Zhao, C.; Kupferle, M.J. Synergistic enhancement of oxidative degradation of atrazine using combined electrolysis and ozonation. J. Water Process. Eng. 2018, 21, 154–162. [Google Scholar] [CrossRef]
  56. Sun, X.; Qi, H.; Sun, Z. Bifunctional nickel foam composite cathode co-modified with CoFe@ NC and CNTs for electrocatalytic degradation of atrazine over wide pH range. Chemosphere 2022, 286, 131972. [Google Scholar] [CrossRef]
  57. Ta, N.; Hong, J.; Liu, T.; Sun, C. Degradation of atrazine by microwave-assisted electrodeless discharge mercury lamp in aqueous solution. J. Hazard. Mater. 2006, 138, 187–194. [Google Scholar] [CrossRef] [PubMed]
  58. Teng, X.; Li, J.; Wang, J.; Liu, J.; Ge, X.; Gu, T. Effective degradation of atrazine in wastewater by three-dimensional electrochemical system using fly ash-red mud particle electrode: Mechanism and pathway. Sep. Purif. Technol. 2021, 267, 118661. [Google Scholar] [CrossRef]
  59. Wang, G.; Cheng, C.; Zhu, J.; Wang, L.; Gao, S.; Xia, X. Enhanced degradation of atrazine by nanoscale LaFe1−xCuxO3−δ perovskite activated peroxymonosulfate: Performance and mechanism. Sci. Total Environ. 2019, 673, 565–575. [Google Scholar] [CrossRef]
  60. Wang, Q.; Zhang, A.; Li, P.; Héroux, P.; Zhang, H.; Yu, X.; Liu, Y. Degradation of aqueous atrazine using persulfate activated by electrochemical plasma coupling with microbubbles: Removal mechanisms and potential applications. J. Hazard. Mater. 2021, 403, 124087. [Google Scholar] [CrossRef]
  61. Wang, T.; Huang, T.; Jiang, H.; Ma, R. Electrochemical degradation of atrazine by BDD anode: Evidence from compound-specific stable isotope analysis and DFT simulations. Chemosphere 2021, 273, 129754. [Google Scholar] [CrossRef]
  62. Wang, W.K.; Chen, J.J.; Gao, M.; Huang, Y.X.; Zhang, X.; Yu, H.Q. Photocatalytic degradation of atrazine by boron-doped TiO2 with a tunable rutile/anatase ratio. Appl. Catal. B. 2016, 195, 69–76. [Google Scholar] [CrossRef]
  63. Wang, X.; Wang, Y.; Chen, N.; Shi, Y.; Zhang, L. Pyrite enables persulfate activation for efficient atrazine degradation. Chemosphere 2020, 244, 125568. [Google Scholar] [CrossRef] [PubMed]
  64. Wu, S.; He, H.; Li, X.; Yang, C.; Zeng, G.; Wu, B.; He, S.; Lu, L. Insights into atrazine degradation by persulfate activation using composite of nanoscale zero-valent iron and graphene: Performances and mechanisms. Chem. Eng. J. 2018, 341, 126–136. [Google Scholar] [CrossRef]
  65. Wu, S.; Li, H.; Li, X.; He, H.; Yang, C. Performances and mechanisms of efficient degradation of atrazine using peroxymonosulfate and ferrate as oxidants. Chem. Eng. J. 2018, 353, 533–541. [Google Scholar] [CrossRef]
  66. Xie, S.; Tang, C.; Shi, H.; Zhao, G. Highly efficient photoelectrochemical removal of atrazine and the mechanism investigation: Bias potential effect and reactive species. J. Hazard. Mater. 2021, 415, 125681. [Google Scholar] [CrossRef] [PubMed]
  67. Xu, G.; Yao, J.Z.; Tang, L.; Yang, X.Y.; Zheng, M.; Wang, H.; Wu, M.H. Electron beam induced degradation of atrazine in aqueous solution. Chem. Eng. J. 2015, 275, 374–380. [Google Scholar] [CrossRef]
  68. Xu, X.; Chen, W.; Zong, S.; Ren, X.; Liu, D. Atrazine degradation using Fe3O4-sepiolite catalyzed persulfate: Reactivity, mechanism and stability. J. Hazard. Mater. 2019, 377, 62–69. [Google Scholar] [CrossRef]
  69. Yang, J.; Li, J.; Dong, W.; Ma, J.; Cao, J.; Li, T.; Li, J.; Gu, J.; Liu, P. Study on enhanced degradation of atrazine by ozonation in the presence of hydroxylamine. J. Hazard. Mater. 2016, 316, 110–121. [Google Scholar] [CrossRef]
  70. Yang, Y.; Cao, H.; Peng, P.; Bo, H. Degradation and transformation of atrazine under catalyzed ozonation process with TiO2 as catalyst. J. Hazard. Mater. 2014, 279, 444–451. [Google Scholar] [CrossRef]
  71. Ye, G.; Luo, P.; Zhao, Y.; Qiu, G.; Hu, Y.; Preis, S.; Wei, C. Three-dimensional Co/Ni bimetallic organic frameworks for high-efficient catalytic ozonation of atrazine: Mechanism, effect parameters, and degradation pathways analysis. Chemosphere 2020, 253, 126767. [Google Scholar] [CrossRef]
  72. Yola, M.L.; Eren, T.; Atar, N. A novel efficient photocatalyst based on TiO2 nanoparticles involved boron enrichment waste for photocatalytic degradation of atrazine. Chem. Eng. J. 2014, 250, 288–294. [Google Scholar] [CrossRef]
  73. Yu, T.; Wang, L.; Ma, F.; Wang, Y.; Bai, S. A bio-functions integration microcosm: Self-immobilized biochar-pellets combined with two strains of bacteria to remove atrazine in water and mechanisms. J. Hazard. Mater. 2020, 384, 121326. [Google Scholar] [CrossRef] [PubMed]
  74. Yuan, X.; Yan, X.; Xu, H.; Li, D.; Sun, L.; Cao, G.; Xia, D. Enhanced ozonation degradation of atrazine in the presence of nano-ZnO: Performance, kinetics and effects. J. Environ. Sci. (China). 2017, 61, 3–13. [Google Scholar] [CrossRef] [PubMed]
  75. Zhang, J.J.; Lu, Y.C.; Yang, H. Chemical modification and degradation of atrazine in Medicago sativa through multiple pathways. J. Agric. Food Chem. 2014, 62, 9657–9668. [Google Scholar] [CrossRef] [PubMed]
  76. Zhang, R.; Wan, Y.; Peng, J.; Yao, G.; Zhang, Y.; Lai, B. Efficient degradation of atrazine by LaCoO3/Al2O3 catalyzed peroxymonosulfate: Performance, degradation intermediates and mechanism. Chem. Eng. J. 2019, 372, 796–808. [Google Scholar] [CrossRef]
  77. Zhang, Y.; Du, Y.; Liu, D.; Bian, W. The role of dissolved oxygen in the Ta (O) N-driven visible Fenton-like degradation of atrazine. J. Environ. Chem. Eng. 2014, 2, 1691–1698. [Google Scholar] [CrossRef]
  78. Zhang, Y.; Jiang, Q.; Jiang, S.; Li, H.; Zhang, R.; Qu, J.; Zhang, S.; Han, W. One-step synthesis of biochar supported nZVI composites for highly efficient activating persulfate to oxidatively degrade atrazine. Chem. Eng. J. 2021, 420, 129868. [Google Scholar] [CrossRef]
  79. Zhanqi, G.; Shaogui, Y.; Na, T.; Cheng, S. Microwave assisted rapid and complete degradation of atrazine using TiO2 nanotube photocatalyst suspensions. J. Hazard. Mater. 2007, 145, 424–430. [Google Scholar] [CrossRef]
  80. Zhu, S.; Dong, B.; Yu, Y.; Bu, L.; Deng, J.; Zhou, S. Heterogeneous catalysis of ozone using ordered mesoporous Fe3O4 for degradation of atrazine. Chem. Eng. J. 2017, 328, 527–535. [Google Scholar] [CrossRef]
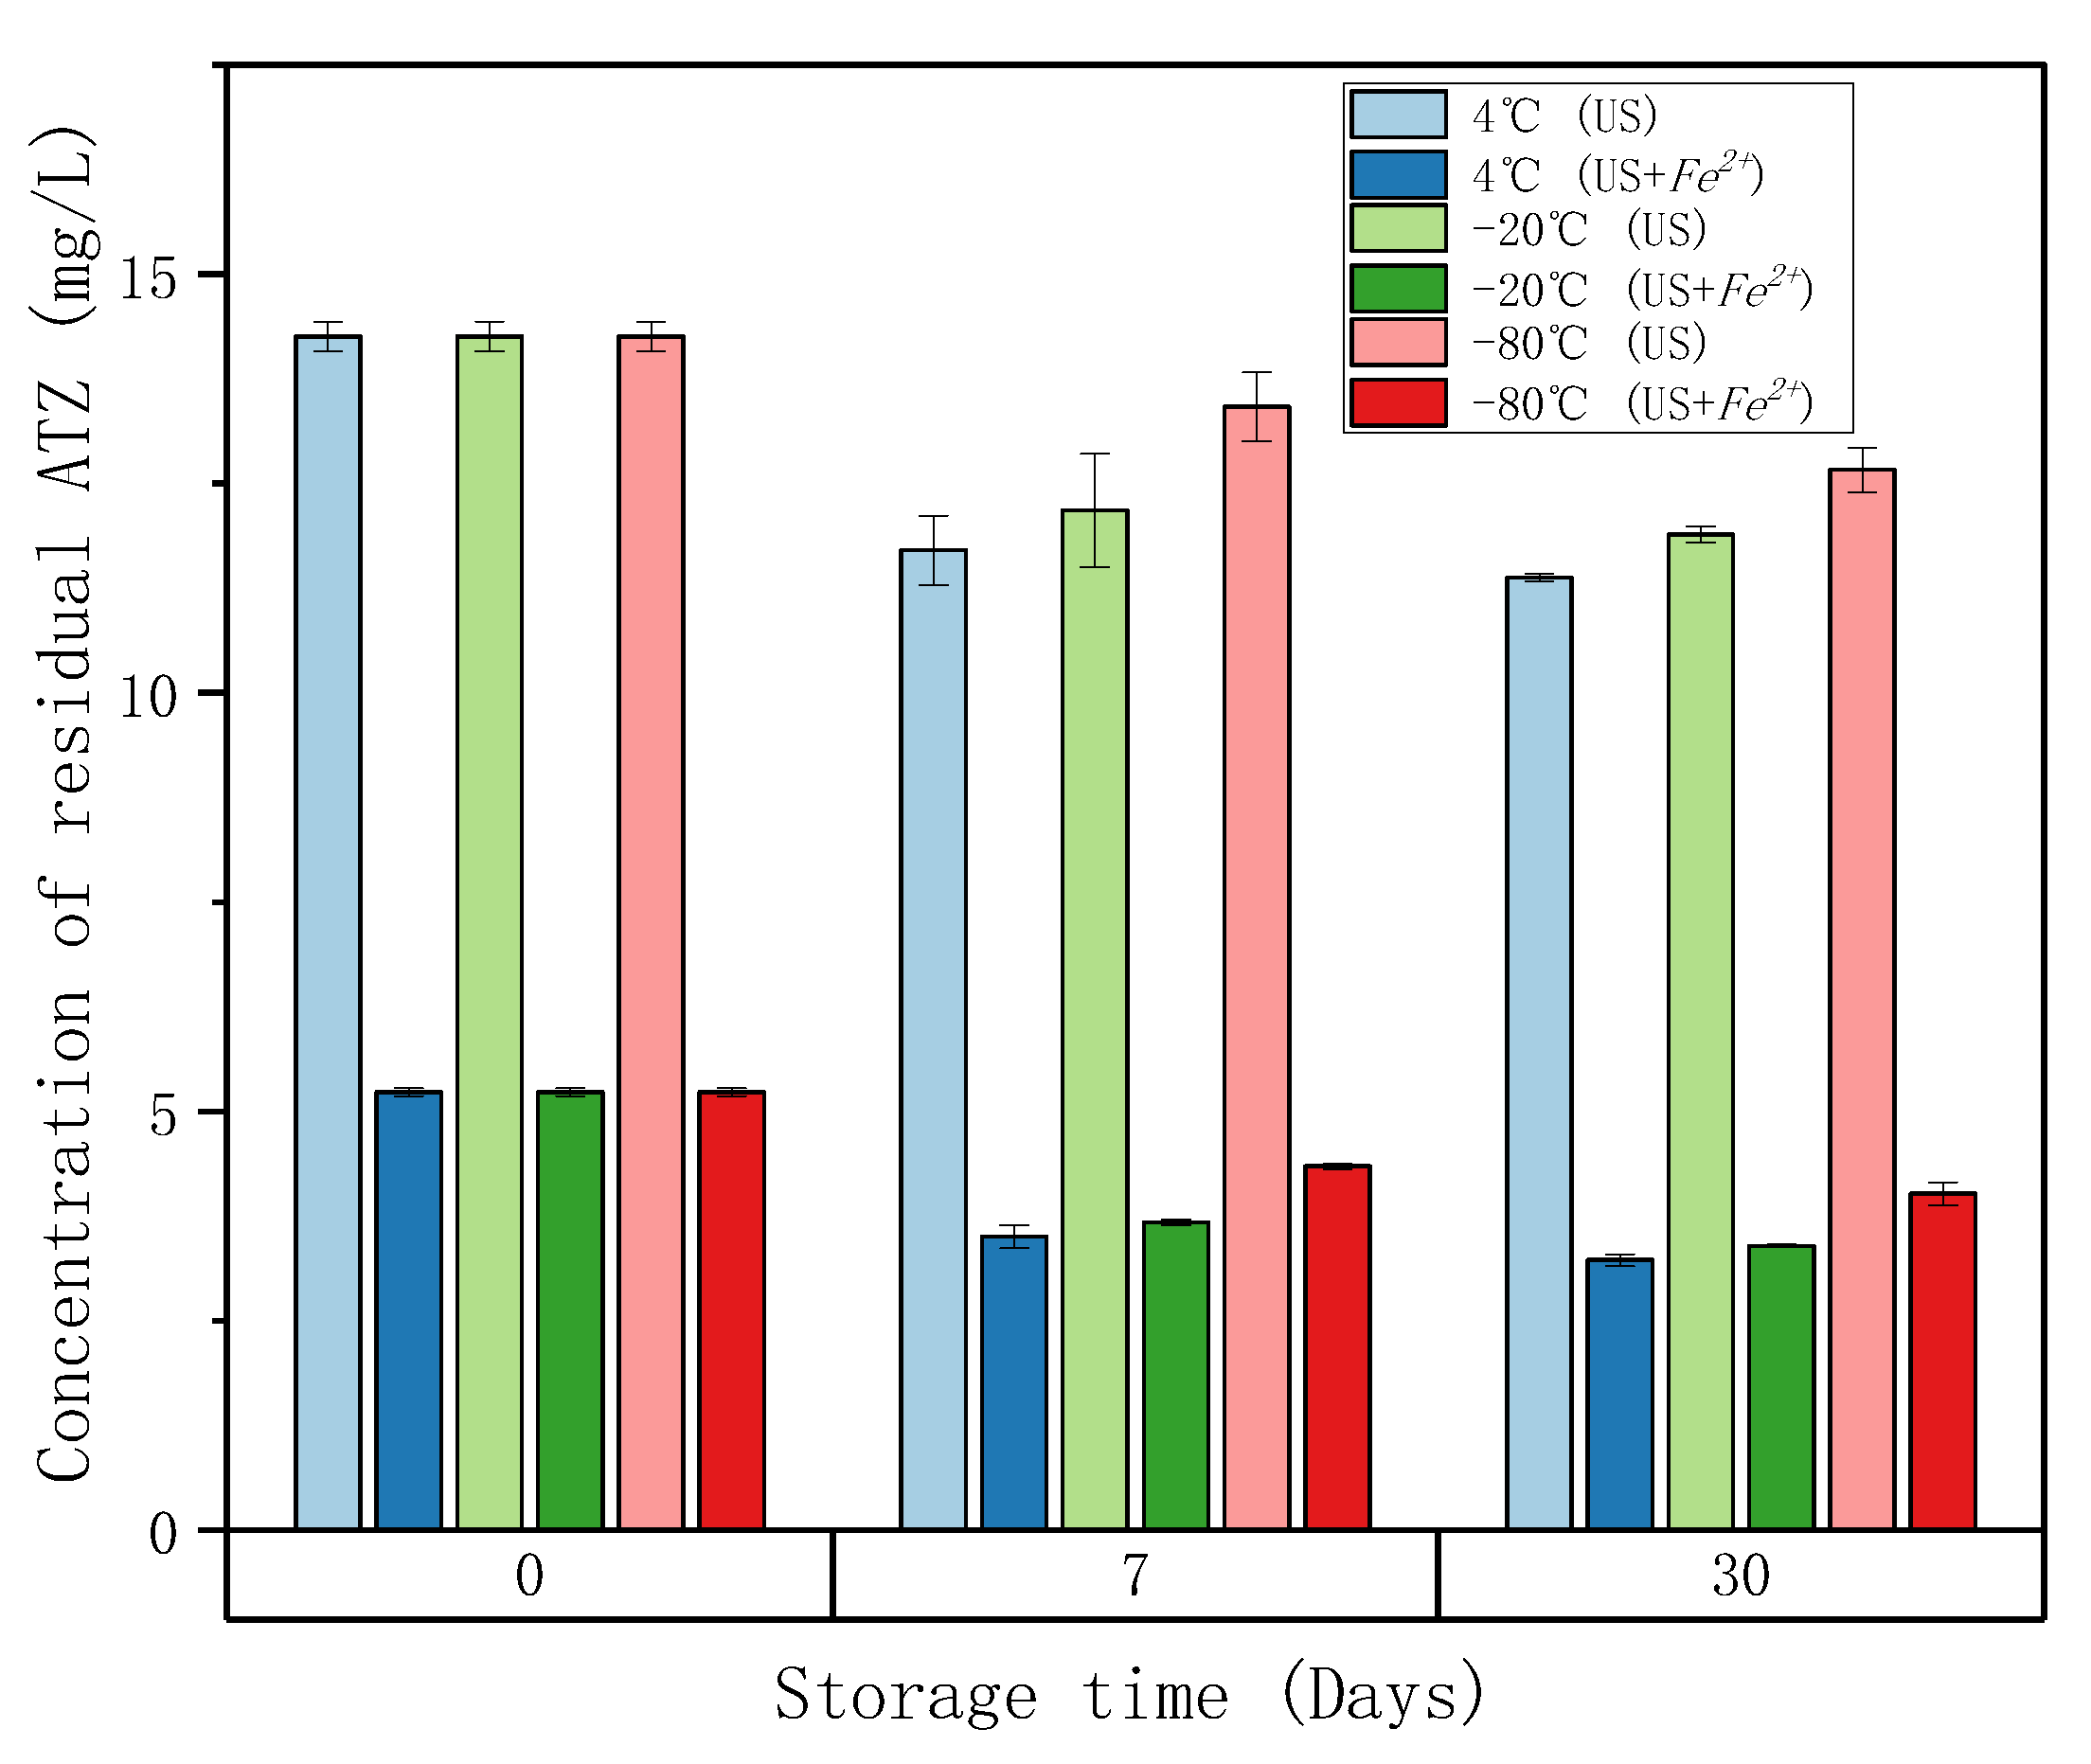
Figure 1. The effect of storage time on the concentration of residual ATZ. At 0-day, the initial ATZ solutions were treated by HFUS without or with Fe2+, US or US+Fe2+. Conditions: [ATZ]0 = 0.093 mmol/L; [FeSO4·7H2O]0 = 0.93 mmol/L for treatment US+Fe2+; volume = 50 mL; ultrasound frequency = 525 kHz; reaction time = 2 h (see Section 3.5.1). Samples were taken and then stored at different temperatures (4 °C, −20 °C, and −80 °C).
Molecules 27 09021 g001
Figure 2. Time profiles of ATZ degradation for different Fenton reagent equivalents. Conditions: [ATZ]0 = 0.093 mmol/L; [FeSO4·7H2O]0 = [H2O2]0 = 0.93 mmol/L, 0.465 mmol/L, 0.186 mmol/L and 0.093 mmol/L for 10 eq., 5 eq., 2 eq. and 1 eq. Fenton reagents; volume = 15 mL; reaction time = 2 h (see Section 3.5.2).
Molecules 27 09021 g002
Figure 3. Time profiles of ATZ degradation during LFUS treatment with or without Fe2+ (US or US+ Fe2+). Conditions: [ATZ]0 = 0.093 mmol/L; [FeSO4·7H2O]0 = 0.93 mmol/L for treatment US+ Fe2+; volume = 15 mL; ultrasound frequency = 50 kHz; reaction time = 2 h (see Section 3.5.3).
Molecules 27 09021 g003
Figure 4. Time profiles of ATZ degradation during offline Fenton treatment for different equivalents of Fenton reagents. Conditions: [ATZ]0 = 0.093 mmol/L; [FeSO4·7H2O]0 = 0.93 mmol/L, 0.465 mmol/L and 0.186 mmol/L for 10 eq., 5 eq. and 2 eq.; volume = 15 mL; ultrasound frequency = 50 kHz (see Section 3.5.4).
Molecules 27 09021 g004
Figure 5. Kinetics of metabolites in online Fenton process. (a) Fenton reagents 1 eq.; (b) Fenton reagents 2 eq.; (c) Fenton reagents 5 eq.; (d) Fenton reagents 10 eq. (see Section 3.5.2).
Molecules 27 09021 g005
Figure 6. Kinetics of metabolites in online LFUS 50 kHz process. (a) Without 10 eq. Fe2+; (b) With 10 eq. Fe2+ (see Section 3.5.3).
Molecules 27 09021 g006
Figure 7. (a) Scheme of online sampling setup where, P is the peristaltic pump, F is the 0.2 µm filter, A and B is HPLC eluant, L1 is the C18 column. (b) Photo of actual system.
Molecules 27 09021 g007
Table 1. Information of related compounds.
EntriesChemical StructureMolecular FormulaAbbreviationNamem/zRetention Time (min)Metabolite
Level
OnlineOffline
1Molecules 27 09021 i001C8H14ClN5ATZAtrazine216.10102.5582.1780
2Molecules 27 09021 i002C8H9D5ClN5ATZ-D5Atrazine-D5221.13242.5792.168\
3Molecules 27 09021 i003C6H10ClN5DEADeethylatrazine188.06981.9101.7511
4Molecules 27 09021 i004C5H8ClN5DIADeisopropylatrazine174.05411.6201.4631
5Molecules 27 09021 i005C3H4ClN5DDADidealkylatrazine146.02281.0230.9052
6Molecules 27 09021 i006C7H10ClN5OCDETSimazine amide216.06471.8201.6911
7Molecules 27 09021 i007C8H12ClN5OCDITAtrazine amide230.08042.0911.8751
8Molecules 27 09021 i008C5H6ClN5OCDATDeisopropylatrazine amide188.03341.2641.2572
9Molecules 27 09021 i009C7H8ClN5 O2CDDTN,N’-(6-Chloro-1,3,5-triazine-2,4-diyl)diacetamide230.04401.4511.4073
10Molecules 27 09021 i010C8H15N5OHAHydroxyatrazine198.13501.233 1
11Molecules 27 09021 i011C6H11N5ODEHADeethylhydroxyatrazine170.10370.810 2
12Molecules 27 09021 i012C3H5N5OAMAmmeline128.05670.4900.4753
13Molecules 27 09021 i013C7H11N5O2ODETN-[6-(Ethylamino)-4-oxo-1,4-dihydro-1,3,5-triazin-2-yl]acetamide198.09861.0821.0482
14Molecules 27 09021 i014C8H13N5O2ODITHydroxyatrazine amide212.11421.2131.0672
15Molecules 27 09021 i015C7H9N5O3ODDTN,N’-(6-hydroxy-1,3,5-triazine-2,4-diyl)diacetamide212.07781.1411.0133
16Molecules 27 09021 i016C8H14ClN5OCNIT1-({4-chloro-6-[(propan-2-yl)amino]-1,3,5-triazin-2-yl}amino)ethan-1-ol232.09601.8681.7321
17Molecules 27 09021 i017C8H14ClN5O2HAHT2-({4-chloro-6-[(1-hydroxyethyl)amino]-1,3,5-triazin-2-yl}amino)propan-2-ol248.09092.2121.9332
18Molecules 27 09021 i018C8H12ClN5CVIT6-chloro-N2-ethenyl-N4-(propan-2-yl)-1,3,5-triazine-2,4-diamine214.08542.070 2
19Molecules 27 09021 i019C3H5N3O4CBOI1-carboxybiuret148.03530.416 4
Table 2. Distribution of metabolites by ring substituent during treatments after 50 and 100 min, respectively *.
Treatment50 min100 min
ClOHRing OpeningC/C0(ATZ)ClOHRing OpeningC/C0(ATZ)
a Fenton_1 eq.92.56%7.44% 84.08%93.32%6.68% 77.75%
a Fenton_2 eq.94.20%5.80% 72.84%94.45%5.55% 65.00%
a Fenton_5 eq.91.23%8.77% 31.02%89.30%10.70% 16.90%
a Fenton_10 eq.85.70%13.19%1.10%17.27%83.37%14.92%1.71%9.46%
US_50 kHz89.86%10.14% 84.73%86.44%13.56% 82.81%
b   US _ 50   kHz + F e 2 + 81.01%18.99% 76.80%64.54%35.46% 67.62%
* The sum of the percentages containing chlorine, hydroxyl groups, and ring-opening products was 100%. a Keeping the same molar concentrations of FeSO4·7H2O and H2O2, different equivalents of Fenton reagents were used on the degradation of atrazine by Fenton oxidation. b 10 eq. FeSO4·7H2O was added to the degradation of atrazine by ultrasound at 50 kHz.
Table 3. Distributions of metabolites by type of transformation during treatments after 50 and 100 min, respectively *.
TreatmentAmidationDealkylationDehydrogenationHydroxylationSubstitution
(Conversion of ATZ to HA)
50 min
Fenton_1 eq.47.65%16.58%10.81%24.96%
Fenton_2 eq.38.33%14.15%11.37%36.15%
Fenton_5 eq.47.46%29.32%8.45%14.77%
Fenton_10 eq.61.77%32.39%0.70%5.14%
US_50 kHz41.94%57.51% 0.55%
US _ 50   kHz + F e 2 + 15.82%80.14% 4.04%
100 min
Fenton_1 eq.43.96%17.23%11.01%27.80%
Fenton_2 eq.37.40%14.21%11.56%36.83%
Fenton_5 eq.43.58%26.04%9.64%20.75%
Fenton_10 eq.67.20%26.82%0.71%5.27%
US_50 kHz47.09%52.04% 0.88%
US _ 50   kHz + F e 2 + 28.44%63.32% 8.25%
* The sum of the percentages of each transformation was 100%.
Publisher’s Note: MDPI stays neutral with regard to jurisdictional claims in published maps and institutional affiliations.