Abstract
The only therapy for coeliac disease patients is to completely avoid foods containing gluten, a protein complex common in several small-grain cereals. However, many alternative gluten-free foods available on the market present nutritional deficiencies. Therefore, the aim of this research was to evaluate the composition and the antioxidant properties of gluten-free pasta enriched with 10% or 15% of tomato waste or linseed meal, two food industry by-products. The traits analysed were protein, lipid, ash and fibre content, heat damage, tocols, carotenoids and phenolics composition (by HPLC), antioxidant capacity, and pasta fracturability. The enriched pastas contained more fibre and lipids than the control, while the protein and ash values were similar. The addition of tomato and linseed waste improved tocols concentration but had no effect on carotenoids content. The free soluble polyphenols increase was similar for both by-products and proportional to the enrichment percentage, while the bound insoluble polyphenols were higher in linseed-enriched pastas. The samples with linseed meal showed the greatest antioxidant capacity and, at 10% addition, the highest fracturability value. In conclusion, the addition of tomato and linseed by-products significantly increases the presence of bioactive compounds (particularly polyphenols), improving the nutritional value of gluten-free pasta.
Keywords:
carotenoids; fava bean; flavonoids; linseed meal; phenolic acids; rice; tocols; tomato pomace; waste 1. Introduction
Coeliac Disease (CD) is a chronic small intestinal immune-mediated enteropathy triggered by exposure to dietary gluten in genetically predisposed individuals [1]. A meta-analysis [2] recorded that the worldwide prevalence of celiac disease is 1.4% based on blood tests and 0.7% based on biopsy. Additionally, they observed that its prevalence ranged from 0.4% in South America to 0.5% in Africa and North America, to 0.6% in Asia, reaching to 0.8% in Europe and Oceania. A strict and life-long gluten-free (GF) diet is the only available therapeutic treatment for people with CD. Only foods made from naturally GF ingredients and that contain no more than 20 parts per million gluten (i.e., the lowest level that can be reliably detected by scientific analytical tools) can be defined as GF products [3,4,5]. Currently, a broad variety of GF products (e.g., bread, cakes, muffins, pasta/noodles) is available to coeliacs. However, many GF foods are poor in minerals and bioactive components, and consequently are nutritionally inferior to the wheat-based foods they replace. Therefore, more attention and research are needed to improve the nutritional aspects of these products [6].
Pasta is appreciated and consumed all over the world for its taste, ease of preparation, low cost, and long shelf life. Good-quality pasta is prepared exclusively from durum wheat, but other types (e.g., noodles, egg pasta, etc.) are made from bread wheat or allied species. However, all these pastas are not suitable for people with CD, pushing the industry to look for and manufacture products whose main ingredients are flour from gluten-free species (rice, corn, sorghum, amaranth, quinoa, buckwheat, fava bean, pea, chickpea, etc.), and/or starch from corn, rice, and potato, with the addition of protein, gums, and emulsifiers which may partially act as gluten substitutes [7,8]. Rice is very suitable for GF foods manufacturing because of its high starch content, neutral taste, white colour, high digestibility, and hypoallergenic properties [9], while legume flours, rich in high-quality proteins, fibres, starch, and minerals, represent a good alternative and/or addition [10].
These last years have seen a sharp increase in GF pasta demand, which is consumed not only by a growing number of coeliacs but is also actively sought-after by non-coeliac people who wish to exclude gluten-based products from their diet for perceived health reasons. GF pasta is usually prepared in two ways. The first approach focuses on the use of heat pre-treated GF flours, containing mostly gelatinized starch; then, the pre-treated flour can be shaped into pasta by the continuous extrusion press commonly used for durum wheat semolina pasta making. The second approach (extrusion cooking process) treats native flour with steam and extrudes it at a high temperature (>100 °C), promoting starch gelatinization directly inside the extruder–cooker. The conventional extrusion induces the creation of small crystalline regions, resulting in low water absorption, while the extrusion cooking process leads to strong interactions between amylopectin and/or amylose molecules, thus giving a product with low cooking loss and high firmness [7].
The industrial processing of fruits and vegetables generates large by-product waste in the form of peels, cores, pomace, unripe and/or damaged fruits and vegetables [11], whose disposal may be expensive and can have a negative environmental impact. Therefore, reducing food waste is a priority to move towards more sustainable food systems. Traditionally, fruit and vegetable by-products are reutilized as animal feed, processed into biogas, or composted to obtain biofertilizer [12]. A worthier approach, leading to both economic and social benefits, may be the transformation of waste into functional foods ingredients [13,14], because these by-products are often a rich source of nutrients and other functional compounds. For example, tomato peels and seeds are rich in fibres [15] and proteins [15,16]. Additionally, they contain antioxidant compounds like polyphenols [15,17], tocopherols [17], and carotenoids (e.g., β-carotene [15] and lycopene [15,18]), which exert positive health effects against oxidative stress due to reactive oxygen species (ROS) at the cellular and DNA levels, contributing to preventing the insurgence of age-related diseases and cancers [19,20,21]. Similarly, the linseed cake, a by-product of linseed oil extraction, has abundant protein water-soluble fibre and lignan concentrations [22] along with high phenolic acids content [23].
Some by-products have been successfully added to traditional products, improving their nutritional value but often altering their technological quality. For example, pasta enriched with 15% tomato peels has higher levels of carotenoids and dietary fibre than the control pasta, but possesses lower sensory scores for elasticity, odour, and firmness; nevertheless, the tomato peel hydrocolloids enhance adhesiveness and bulkiness, without compromising other physical and chemical properties [24]. Linseed meal was used as an additive in bread [25]. The addition of 15% linseed flour and linseed marc gave breads higher nutritional value, increasing protein content, fat, and mineral components by 11.06, 4.03 and 1.84 g/100 g, respectively, while maintaining acceptable sensory properties [26]. The addition of food industry by-products to gluten-free foods might be even more appealing [27], because of the above-mentioned nutritional shortcomings. For example, in gluten-free pasta the addition to rice flour of a potato peel water extract—Psyllium husks gel (50–50 ratio)—increased the mineral content, total phenolic content, and antioxidant activity without affecting the mechanical properties [28]. Similarly, gluten-free noodles prepared with resistant rice starch, defatted rice bran (5%), and xanthan gum (2.5%) exhibited good protein, fibre, and ash content coupled to low glycaemic index and high sensory acceptability [29].
The addition of vegetable wastes to improve the nutritional properties of gluten-free products is still in its infancy, and very few studies are available. Therefore, the aim of this research was to evaluate the composition and the antioxidant properties of gluten-free pasta enriched with different quantities of two food industry by-products: tomato waste and linseed meal.
2. Results and Discussion
2.1. Flours
2.1.1. Chemical Characteristics
Table 1 reports the protein, ash, lipid, and furosine content of the raw materials used in the production of gluten-free pasta; the LSD test results are also presented. Fava bean flour and linseed meal had a protein content about twice that of the tomato waste and about four times that of the rice flour, while the highest ash and lipids concentrations were in linseed meal, followed by TP, bean flour, and rice. The results confirmed that all these three groups of compounds are scarce in rice flour, and hence the nutritional value of rice is mainly due to carbohydrates. Furosine, a compound which develops from the acid hydrolysis of the first stable products of the Maillard reaction (the Amadori compounds), was found in small and decreasing quantities in TP, bean flour, and linseed meal (probably due to drying treatments) but was not detected in rice flour.

Table 1.
Content in protein, ash, lipid, and furosine (mean ± standard deviation) of rice flour, fava bean flour, tomato waste, and linseed meal.
The composition of the four raw materials was comparable to the data reported in the literature. In particular, rice flour values were consistent with the protein (7.63–9.62 g/100 g DM), ash (0.63–1.32 g/100 g DM), and lipid (0.68–1.64 g/100 g DM) contents described by Devraj et al. [30], Goufo et al. [31], and Culetu et al. [32]. Similarly, fava bean flour values were within the ranges (22.39–31.07, 2.95–4.46, and 0.99–2.20 g/100 g DM for protein, ash, and lipid, respectively) reported by De Angelis et al. [33] for 13 cultivars. On the other hand, the TP results were inferior to those (15.04–23.07, 3.08–7.01, and 5.04–20.05 g/100 g DM for protein, ash, and lipid, respectively) described by several authors [34,35,36]. However, the by-products from tomato processing have a very heterogeneous composition depending on the relative abundance of seeds and peels, which contain different levels of proteins (25.50 and 14.47 g/100 g DM) and lipids (17.15 vs. 1.77 g/100 g DM) [36]. Finally, the linseed extraction cake composition was comparable with the Kaur et al. [37] samples, which had 28.79, 6.12, and 18.69 g/100 g DM of protein, ash, and lipids, respectively, while Mannucci et al. [38] found higher protein (30.40 g/100 g DM) and lower lipids (9.81 g/100 g DM) content.
2.1.2. Lipophilic Antioxidants
Total carotenoids (mainly lycopene + β-carotene) were plentiful in TP, followed by fava bean flour (>90% lutein) and linseed meal (about 70% lutein), while rice flour was almost devoid (Table 2). The total carotenoid levels of TP were an average value between those reported in peels (15.3 mg/kg DM, expressed as lycopene) and seeds (2.6 mg/kg DM) [39], but were significantly lower than the lycopene contents (98.2–690.9 mg/kg DM) observed by some authors [40,41,42]. In linseed meal, carotenoids concentrations (5.17 mg/kg DM, mostly lutein) were about double those found in our sample [38], while in fava bean they were lower than ours (1.38–2.27 mg/kg dry legumes) [43]. In general, a comparison between different experiments may be difficult and sometimes misleading, because different varieties, environments, techniques, temperatures, and storage conditions strongly influence the outcome [44].
Table 2.
Content in carotenoids and tocols (mean ± standard deviation mg/kg DM) of rice flour, fava bean flour, tomato waste, and linseed meal.
The raw material with the highest tocols content, mostly β-tocotrienol (about 68%) and γ-tocopherol (about 31%), was linseed meal. A good concentration was also found in fava bean flour and in TP, where the two main components were γ-tocopherol (90% and 78%, respectively) and α-tocopherol (6% and 20%, respectively). Once again, rice flour showed the lowest values. In general, the results reported in the literature are inferior to ours. For example, linseed cake contained 25.63 mg/kg DM total tocols, including γ- (93%), α- (4%) and δ-tocopherol (3%) [38], while the fava bean flour contained 8.99–13.34 mg/kg DM total tocols, with a marked prevalence (85–87%) of the γ homologue [43,45]. However, in white rice significant quantities of tocopherols (0.21–10.90 mg/kg DM) and tocotrienols (3.85–24.49 mg/kg DM) were detected [46].
2.1.3. Hydrophilic Antioxidants
The free soluble polyphenol composition of linseed meal is unavailable due to interferences in the chromatogram, probably because its abundant lipids masked most of the peaks and prevented their identification. The fava bean and tomato by-product had the greatest content of total free polyphenols (Table 3). In fava beans they were mainly catechin (58%) and protocatechuic acid (27%), followed by syringic acid (6%), tyrosol (4%), and epicatechin (4%), while in tomato by-product they were tyrosol (44%), rutin (13%), naringenin (12%), and syringic acid (10%), as well as other compounds in lesser quantities, such as quercetin derivative (7%), epicatechin (5%), protocatechuic acid (4%), and other phenolic acids. No appreciable quantities of free soluble polyphenols were found in rice.
Table 3.
Composition (mean ± standard deviation; mg/kg DM) of soluble free and insoluble bound polyphenols in rice flour, fava bean flour, tomato waste, and linseed meal.
In the flours of ten Australian fava bean varieties, 279.7–402.5 mg/kg of free polyphenols were found [47]; some varieties also had a content of syringic acid (72.4–122.5 mg/kg) like ours, while protocatechuic acid was scarce (1.29–2.93 mg/kg) and catechin was more abundant (191.0–297.0 mg/kg). Similarly, a prevalence of catechin (455.6 mg/kg DM), followed by epicatechin (23.6 mg/kg DM) and syringic acid (14.3 mg/kg DM) was reported [48]. We did not detect anthocyanidins, found in small amounts (3.74–9.25 mg/kg) by Kan et al. [43]. The tomato waste analysed by Szabo et al. [42] was generally richer in free phenolic compounds (1018–4077 mg/kg DM), particularly rutin, naringenin chalcone, quercetin-triglucoside, and 3–4-dicaffeylquinic acid; a superior content (2861 mg/kg DM), with a prevalence of naringenin and naringenin chalcone, was reported by Abbasi-Parizad et al. [49]. However, lower concentrations (90 mg/kg defatted DM) are also reported [50]. Being a mixture of peels and seeds, tomato by-products composition varies according to their ratio, because the seeds are richer in phenolic acids and poorer in flavonoids [51]. These differences may be a consequence of the diverse drying conditions or treatments performed on the pomace. The linseed extraction cake studied by Kaur et al. [37] showed a content of 246 mg/kg DM free phenols (34% phenolic acids, 64% flavonoids, and about 1.6% resveratrol), while in rice flour they were almost negligible: 2.8 mg/kg DM [52].
The bound Insoluble polyphenols (Table 3) were maximum in the TP, particularly rich in the flavonoids naringenin (56%), quercetin (19%), and epicatechin (12%), but also in the phenolic acids cinnamic derivative (4%), ferulic (3%), and 4-hydroxybenzoic (2%). Perea-Domínguez et al. [50] found a very similar result for total bound phenolics (1043 mg/kg defatted DM), confirming the predominance of naringenin and quercetin (723 and 169 mg/kg DM); in addition, the authors observed a good concentration (404 mg/kg DM) of a fraction, the soluble conjugated phenolics, which we did not study. Linseed meal also contained a sizeable bound polyphenols content, with a strong contribution of protocatechuic acid (49% of total bound polyphenols) and ferulic acid (40%). A far superior value (5684 mg/kg DM) was reported [37]. Modest bound polyphenols quantities (57.7 mg/kg DM), mainly represented by ferulic acid (89%), were found in rice flour [48]. Finally, the bound polyphenols in fava bean were scarce, and largely inferior to the 73.92 mg/kg DM described in the literature [53].
2.1.4. Antioxidant Capacity
Analysing the antioxidant capacity of the hydro-soluble compounds, the fava bean flour, which had the highest total free polyphenols concentration, consistently had the greatest ABTS-MeOH value (107.69 mmol TE/kg), followed by linseed meal (60.73 mmol TE/kg) and TP (15.54 mmol TE/kg); modest or undetectable values were recorded for rice flour. When the FRAP method was used, the fava bean flour methanolic extract scored 18.14 mmol TE/kg, lower than that linseed meal (36.18 mmol TE/kg) and slightly higher than tomato pomace (15.54 mmol TE/kg). The ABTS values of the liposoluble compounds—extracted with hexane—were modest in all raw materials, indicating that this fraction was less relevant for antioxidant capacity.
2.2. Pasta
2.2.1. Chemical Characteristics
Figure 1 depicts the centesimal composition (fibre, protein, ash, lipid) and the furosine content of the five pasta types tested. By-products enrichment increased the fibre content of the samples, especially when the TP was employed; the highest value was reached with 15% TP. This is consistent with Padalino et al. [24], who enriched durum wheat pasta with the very same percentages of tomato pomace, finding, however, much higher levels of dietary fibre (16.80 and 19.75 g/100 g) due to the higher content in their flour. The protein content of the control and of the TP-enriched pastas was similar, probably because the protein concentration of the basic formulation was already high, while the linseed meal enrichment provided slightly higher values. On the contrary, dilution of protein in TP-enriched pastas was previously reported [24]. Our protein values in linseed-cake-enriched pastas (15.38–15.89 g/100 g DM) were consistent with those found by Zarzycki et al. [54] in semolina pastas enriched with 9–17% linseed oil cake (14.93–16.51 g/100 g DM).
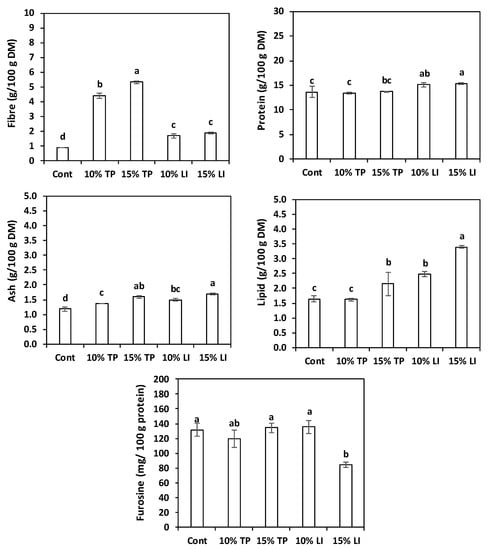
Figure 1.
Chemical characteristics and heat damage of dried pasta prepared with rice flour and fava bean flour (Cont) or enriched with different percentages of tomato pomace (TP) or linseed meal (LI). The error bars represent the standard deviation; different letters indicate significant difference (p < 0.05) between the samples.
Ash and lipid increased with augmenting enrichment levels. The substitution effect was particularly evident in the pasta with linseed meal, because of the residual lipid content. Zarzycki et al. [54], in the above-mentioned study, found similar values of ash (1.39–1.73 g/100 g), but lower fats (0.8–1.8 g/100g) because of the inferior lipid content of their cake (12.41 g/100 g).
On the other hand, furosine was always low; one investigation, involving more than 100 durum wheat pastas, reported a range of 226–506 mg/100 g of protein [55]. Moreover, the extremely small values found in pasta enriched with 15% linseed meal possibly hint to a possible role of lipids in thermal damage prevention.
2.2.2. Lipophilic Antioxidants
The total carotenoid content of the enriched pastas was higher than the control pasta only for the sample with 15% TP (Figure 2), while the linseed meal addition led to a decrease in carotenoids content, due to the dilution effect. On the other hand, in the pasta with linseed meal the tocols content increased, while in that with TP the rise was noticeable only after a 15% addition. These results were clearly linked to the characteristics of the raw materials (Table 2).
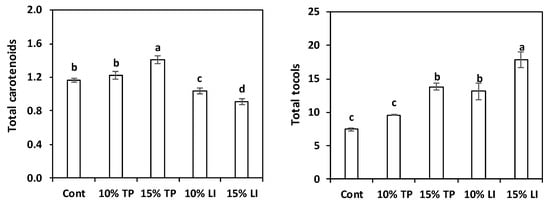
Figure 2.
Total carotenoids and total tocols content (mean ± standard deviation; mg/kg DM) of pasta prepared with rice flour and fava bean flour (Cont) or enriched with different percentages of tomato pomace (TP) or linseed meal (LI). The error bars represent the standard deviation; different letters indicate significant difference (p < 0.05) between the samples.
Supplementary Table S1 details the different carotenoids and tocols found in the pastas. As expected from the analysis of the raw materials, roughly 80% of the carotenoids in control and linseed meal enriched pastas was lutein. Notwithstanding the prevalence of lycopene + β-carotene in the tomato pomace, the pastas with this ingredient still had abundant lutein (about 50% of total carotenoids) because of the fava bean flour contribution; lycopene + β-carotene represented 39% and 43% of total carotenoids in the 10% and 15% enriched samples, respectively.
Padalino et al. [24] reported far superior levels of carotenoids: 51.6 and 133.6 mg/kg of β-carotene in 10% and 15% tomato-pomace-enriched pastas. However, about 40 mg/kg was reported for durum wheat control pasta, but this amount appears at least questionable cause it is one order of magnitude more than that reported by numerous authors for semolina [56,57,58,59,60], and pasta extrusion is further detrimental for carotenoids [59]. Kaur et al. [61] found 8.8 and 36.9 mg/kg carotenoids, primarily β-carotene, in 10% and 15% orange-pomace-enriched pastas, respectively. Likewise, 5.2 mg/kg DM, mainly lutein, are reported in 10% olive-pomace-enriched spaghetti [60].
The α- and β-tocopherols were found only in the TP enriched pastas: α-tocopherol, which exhibits the highest biological activity [62], was present in small amount (0.6–1.0 mg/kg DM), while 8.6 mg/kg DM were found in olive-pomace-enriched pasta [60]. The γ-tocopherol was prevalent in all pasta samples, ranging from 6.55 mg/kg DM (about 90% of total tocols) in the control to 10.27 mg/kg DM (about 80%) in pasta with 15% of TP. Conversely, the δ-tocopherol was present, in low concentrations, only in the TP-enriched samples and the β-tocotrienol was present (40%) in the linseed-meal-enriched pastas.
2.2.3. Hydrophilic Antioxidants
The total free polyphenol content of all the enriched pastas was significantly higher than that of the control pasta (Figure 3), in particular in the pasta with 15% of TP (123.42 mg/kg DM). The main polyphenols found in the enriched pastas (Supplementary Table S2) were catechin (36–49% of total free polyphenols), tyrosol (17–29%), and protocatechuic acid (16–19%). The total free phenolic acids were slightly lower than the value (34.02 mg/kg DM) reported by Oniszczuk et al. [63] in gluten free pasta made of rice and field bean (2/1; w/w) with a different phenolic profile; isoferulic acid was the main compound. Values of soluble phenolics like ours were found in egg pastas enriched with 7% pomace from grape or olive (91 and 96 mg/kg DM, respectively); their raw materials exhibited much higher concentration of phenols [64]. Similarly, 107.6 mg/kg DM of free phenolics were quantified in 10% olive-pomace-enriched pasta [60].
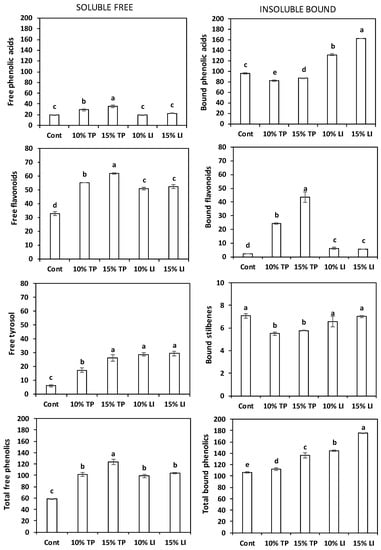
Figure 3.
Total phenolic acids, total flavonoids, tyrosol, and total phenols content of the soluble free (left) and insoluble bound (right) fractions (mean ± standard deviation) of pasta prepared with rice flour and fava bean flour (Cont) or enriched with different percentages of tomato pomace (TP) or linseed meal (LI). The error bars represent the standard deviation; different letters indicate significant difference (p < 0.05) between the samples.
The total bound polyphenol content in enriched pastas (Figure 3) was significantly higher than in the control, especially in the one enriched with linseed meal. The bound flavonoids were more abundant in the pastas with tomato pomace (22–32%), while in those with linseed meal the bound phenolic acids represented >90% of the bound phenolics, as well as in the control. The individual polyphenols contents (Supplementary Table S2) reflected the composition of the flours: ferulic acid, present in rice flour, was plentiful in the control (86%) and in all enriched pastas (49–72% of total bound polyphenols), in particular in those with linseed meal; naringenin (11–16%) and quercetin (9–13%) were relevant in the pastas with tomato pomace, and protocatechuic acid (16–22%) in those with linseed meal. The total phenolics amount corresponded to 231–271 and 259–305 mg/kg DM for tomato- and linseed-enriched pastas, respectively, in accordance with the average value (245.08 mg/kg DM) reported by Padalino et al. [60].
Overall, the mass balance before and after pasta making showed a degradation of free carotenoids, tocols and polyphenols and a variable behaviour of the bound polyphenols.
2.2.4. Antioxidant Capacity
The pasta samples with linseed meal always showed the greatest antioxidant capacity (Figure 4). The pastas enriched with TP gave contrasting results: their methanolic extracts appeared similar to the control with ABTS method but superior with FRAP. The hexane extracts, instead, contained ABTS values inferior (TP 10%) or similar (TP 15%) to the control. These results largely agree with the raw materials findings because the antioxidant capacity of linseed meal was much higher than that of TP.
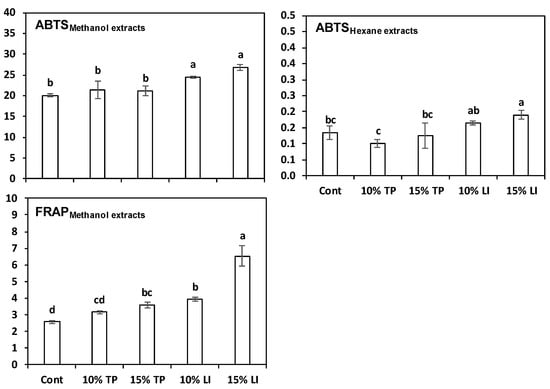
Figure 4.
Antioxidant capacity (mean ± standard deviation) of extracts in 80% methanol (MeOH) or hexane of pasta prepared with rice flour and fava bean flour (Cont) or enriched with different percentages of tomato pomace (TP) or linseed meal (LI). The error bars represent the standard deviation; different letters indicate significant difference (p < 0.05) between the samples.
2.2.5. Fracturability
Raw pasta fracturability is an interesting textural parameter, useful to predict pasta behaviour during transport and storage: in fact, a high degree of mechanical strength can reduce breakage during handling. Tomato pomace and linseed meal addition to gluten-free pasta samples determined some changes in this parameter (Figure 5). The highest fracturability value was registered for the samples with 10% linseed meal (77.1 ± 7.7 N), while the pasta with 15% tomato pomace presented the lowest score (65.7 ± 6.9 N), significantly inferior to the control (72.4 ± 11.2 N); linseed 15% and tomato pomace 10% pasta samples showed intermediate results. Enriching bread wheat pasta with 5, 10, and 20% of spirulina reduced fracturability values [65]; similarly, a marked matrix weakening with ≥20% lupin flour incorporation was detected [66].
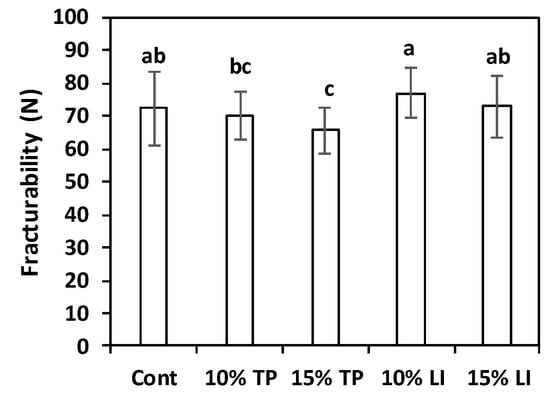
Figure 5.
Fracturability of pasta prepared with rice flour and fava bean flour (Cont) or enriched with different percentages of tomato pomace (TP) or linseed meal (LI). The error bars represent the standard deviation; different letters indicate significant difference (p < 0.05) between the samples.
3. Materials and Methods
3.1. Materials
The control gluten-free pastas were prepared from a basic formulation of 66.7% rice flour and 33.3% fava bean flour. The rice flour (size inferior to 200 µm) was obtained from Bio Aglut Company (Constantine, Algeria) and the fava bean flour (size inferior to 200 µm) was obtained by grinding seeds purchased from Al-Amir Company (Housh Essa, Egypt). The enriched pastas were prepared by replacing 10% or 15% of the basic formulation with tomato waste (TP) obtained by grinding (after drying at 45 °C for 10 h) tomato pomace acquired from Zimba Canning Company (Guelma, Algeria), or with linseed meal (LI), a by-product of mechanical oil extraction by hydraulic press, supplied by Health Embassy LTD (Cheltenham, UK).
3.2. Methods
3.2.1. Pasta Making
About 14 kg of the basic formulation and the water needed to reach 40% humidity were pre-treated with a PROGEL® extruder (Braibanti, Milan, Italy), using the following parameters: extrusion screw temperature 130 °C; pellets outlet temperature 85–90 °C; pellets extrusion pressure 10 bar; length of pellets 5 mm. The pasta (macaroni format) was prepared in a Mac30 pilot plant (Italpast, Parma, Italy) equipped with a pre-kneading tank, a vacuum kneading tank, an extrusion cylinder thermostated with water at 20 °C and a Teflon die. About 3.0 kg of basic formulation (control), or of mixtures enriched with TP or LI, and the water needed to reach 40% humidity were mixed for 12–15 min, then the mix was extruded under vacuum (−0.9 bar) at a pressure of 65–70 bar. A jacket with cold water maintained the temperature of the dough at 40 °C. The pasta samples were dried in an experimental cell (Braibanti, Milan, Italy) using a long drying cycle (17 h) at low temperature (max 60 °C) and relative humidity of 75%. All the dry pasta samples were stored at room temperature until analysis.
Just before the chemical analyses, the samples were ground at 18,000 rpm for 20 s with a Waring Heavy Duty Blender mill (Waring Commercial, Torrington, CT, USA) using a special blade for dusty materials, and then sieved through a n° 18 steel mesh to exclude particles greater than 1 mm. The ground samples were stored in sealed vacuum bags at −20 °C until analysis.
3.2.2. Chemical Composition of the Raw Materials and Pasta Samples
The humidity of the raw materials was determined gravimetrically according to AACC method 44–15.02 [67]. The protein content (g/100 g DM) of raw materials and pastas was assessed following the Kjeldahl approach as described in AOAC method 979.09 [68], using the conversion factor 6.25. Total lipid content of the tomato by-product and linseed meal was determined by the gravimetric method after Soxhlet extraction using petroleum ether as a solvent (Ba 3–38 method; AOCS) [69]; for rice and fava bean flours and pasta, the Soxhlet extraction was carried out after acid hydrolysis of the samples, following ICC method 136 [70]. The determination of the ash of raw materials and pastas was carried out according to AOAC method 923.03 [68] by incineration at 600 °C using a Tactical 308 muffle (Gallenkamp, Cambridge, UK). The crude fibre of the pastas was determined with the FT 122 Fibertec™ apparatus (Foss, Hillerød, Denmark) according to the Weende technique as reported in AOAC method 978.10 [68], based on the solubilization of the non-cellulosic compounds by treatment with a boiling solution of 0.255 N sulfuric acid and subsequently with a boiling solution of 0.313 N sodium hydroxide.
Furosine, an index of heat damage in several food products, was assessed in the pastas by HPLC as described by Hidalgo and Brandolini [71].
3.2.3. Tocols, Carotenoids, and Phenols Quantification
Tocopherols and carotenoids extracts from raw materials and pastas were obtained by saponification [72]. Briefly: 2 g samples were exactly weighted in a screw-capped tube and saponified under nitrogen for 45 min at 70 °C, with the addition of 5 mL ethanolic pyrogallol (60 g/L) as antioxidant, 2 mL ethanol (95%), 2 mL sodium chloride (10 g/L), and 2 mL potassium hydroxide (600 g/L). Afterwards, they were cooled in an ice bath and 15 mL sodium chloride (10 g/L) was added. The suspension was then extracted twice with 15 mL hexane:ethyl acetate (9:1 v/v). The organic layer was collected and evaporated under vacuum, followed by nitrogen drying; the residue was dissolved in 2 mL hexane:isopropyl alcohol (99:1 v/v) and filtered through a 0.22 mm PTFE membrane.
Tocols [73] and carotenoids [74] quantification was carried out by normal-phase HPLC. The operating conditions for tocol quantification were: Adamas® Silica column 250 × 4.6 mm, 5 μm, and guard cartridge 10 × 4.6 mm, 5 μm (Sepachrom SRL, Rho, Italy); mobile phase—hexane:ethyl acetate:acetic acid (97.3:1.8:0.9, v/v/v); flow rate—1.6 mL/min; pump L-2130 Elite LaChrom (Hitachi, Tokyo, Japan); fluorimetric detector—Jasco 821 FP Intelligent Spectrofluorometer (Tokyo, Japan) at excitation–emission wavelengths of 290 nm and 330 nm, respectively; and connected to a computer with the software Empower 2 (Waters Chromatography Division, Millipore, Milford, MA, USA) through the Waters e-SAT/IN module
The operating conditions for carotenoid detection were: Adamas® Silica column 250 × 4.6 mm, 5 μm, and guard cartridge 10 × 4.6 mm, 5 μm (Sepachrom SRL, Rho, Italy); column oven at 20 °C L-2300 Elite LaChrom (Hitachi, Tokyo, Japan); mobile phase—hexane:isopropyl alcohol (5%); flow rate—1.5 mL/min; pump L-2130 Elite LaChrom (Hitachi, Tokyo, Japan). Carotenoids were detected at 445 nm by Diode Array Detector L2450 Elite LaChrom (Hitachi, Tokyo, Japan) set in the range of 200–650 nm. The HPLC system was controlled by the software EZChrom Client/Server version 3.1.7. All the compounds were quantified by the external standard method. Chromatograms of each group of compound are shown in Supplementary Figure S1.
Soluble free and insoluble bound phenolics of raw materials and pastas, extracted as described by Nakov et al. [75] and by Yilmaz et al. [76], respectively, were analysed by reverse-phase HPLC [77] using an HPLC system with an Adamas® C18-AQ 5 μm 4.60 mm × 250 mm column and a C18 5 μm 4.60 mm × 10.0 mm precolumn (Sepachrom srl, Rho, Italy), thermostated at 30.0 °C; L-2130 pump, L-2300 column oven and L2450 Diode Array Detector Elite LaChrom (Hitachi, Tokyo, Japan). All the compounds were quantified by the external standard method. Chromatograms of free and bound phenolics are shown in Supplementary Figure S2.
3.2.4. Antioxidant Capacity
In pastas, the antioxidant capacity of the lipophilic compounds was determined by the ABTS method [78] after hexane extraction, while that of the hydrophilic compounds was assessed by the ABTS [78] and FRAP [17] methods after methanol:water (80:20 v:v) extraction. Exactly 0.200 ± 0.010 g of ground pasta were resuspended with 1 mL of 80% methanol solution or 1 mL hexane in an Eppendorf tube, vortexed, placed in an ultrasonic bath for 10 min, shaken for 20 min, and centrifuged at 12,000 rpm for 10 min. After recovering the supernatant, the extraction was repeated, and the two supernatants combined. The tests were performed on three independent samples and the results are expressed as mmol Trolox equivalent (TE)/kg.
All the chemical analyses were performed on three independent samples.
3.2.5. Pasta Fracturability
Dry pasta fracturability was assessed using a Texture Analyser (TA.XT PLUS, Stable Micro Systems, Surrey, UK) equipped with a 5 kg load cell and Software EXPONENT. Pasta sample was compressed at a test speed of 2 mm/s with a rectangular probe (30 mm × 50 mm) set at a width of 12 mm. Fracturability was measured as the maximum force needed to break the pasta. The average value of 15 replicates is reported.
3.2.6. Statistical Analysis
To evaluate the effect of the different flours and pasta formulations, the data were processed by one-way analysis of variance (ANOVA), considering the type of mixture as a factor. Before the ANOVAs, the data normal distribution was verified and, if necessary, logarithmic transformations were performed. When significant differences were found (p < 0.05), Fisher’s least significant difference (LSD) at 95% significance was computed. All analyses were performed using the statistical program STATGRAPHICS® Centurion (Statpoint Technologies, Inc., Warrenton, VA, USA). The means and standard deviations were calculated using the Excel program (Microsoft®, Redmond, WA, USA).
4. Conclusions
The enriched pastas were richer in fibre and lipids than the control, while protein and ash values were similar; the heat damage, assessed by furosine content, was always limited. The addition of tomato pomace or linseed meal improved the content of tocols but not the content of carotenoids. The free soluble polyphenols increase was similar for both by-products and proportional to the enrichment percentage, while the bound insoluble polyphenols were higher in the pastas with linseed meal. The antioxidant capacity of the free methanolic fraction was greater than that of the hexane extract. In conclusion, the addition of tomato and linseed by-products significantly increased the presence of bioactive compounds, particularly of polyphenols, in the enriched pastas. Future studies will be necessary to assess the stability and bioavailability of these health-improving molecules during cooking and digestion.
Supplementary Materials
The following supporting information can be downloaded at: https://www.mdpi.com/article/10.3390/molecules27248993/s1, Figure S1: HPLC chromatograms of carotenoids and tocols in the pasta sample enriched with 15% of tomato pomace. Figure S2: HPLC chromatograms at 280 nm of the free and bound phenolics in the pasta sample enriched with 15% of tomato pomace. Caffeic, sinapic, and resveratrol are read at 320 nm, while rutin and quercetin at 360 nm. Table S1: Composition of carotenoids and tocols (mean ± standard deviation; mg/kg DM) in pasta prepared with rice and fava bean flours (Control) or enriched with different percentages of tomato waste (TP) or linseed meal (LI). Table S2: Composition (mean ± standard deviation) of soluble-free and insoluble-bound polyphenols; mg/kg DM) in pasta prepared with rice and fava bean flours (Control) or enriched with different percentages of tomato waste (TP) or linseed meal (LI).
Author Contributions
Conceptualization, A.B. (Amel Betrouche) and A.H.; methodology, A.B. (Andrea Brandolini) and A.H.; software, A.H., D.C. and L.E.; validation, A.H. and L.E.; formal analysis, A.B. (Amel Betrouche), D.C., L.E. and G.P.; investigation, A.B. (Amel Betrouche) and A.H.; resources, A.B. (Amel Betrouche), A.B. (Andrea Brandolini) and A.H.; data curation, A.B. (Andrea Brandolini), A.H. and L.E.; writing—original draft preparation, A.B. (Amel Betrouche), A.B. (Andrea Brandolini), A.H., D.C. and L.E.; writing—review and editing, A.B. (Amel Betrouche), A.B. (Andrea Brandolini), A.H. and L.E.; visualization, G.P. and L.B.; supervision, A.H. All authors have read and agreed to the published version of the manuscript.
Funding
This research received no external funding. The travel grant for author Amel Betrouche was funded by the Ministère de l’Enseignement Supérieur et de la Recherche Scientifique; Algeria.
Institutional Review Board Statement
Not applicable.
Informed Consent Statement
Not applicable.
Data Availability Statement
Not applicable.
Acknowledgments
We thank A.B. Terno for the technical assistance in the preparation of the gluten-free pasta.
Conflicts of Interest
The authors declare no conflict of interest.
References
- Ludvigsson, J.F.; Inghammar, M.; Ekberg, M.; Egesten, A. A nationwide cohort study of the risk of chronic obstructive pulmonary disease in coeliac disease. J. Intern. Med. 2012, 271, 481–489. [Google Scholar] [CrossRef] [PubMed]
- Singh, P.; Arora, A.; Strand, T.A.; Leffler, D.A.; Catassi, C.; Green, P.H.; Kelly, C.P.; Ahuja, V.; Makharia, G.K. Global prevalence of celiac disease: Systematic review and meta-analysis. Clin. Gastroenterol. Hepatol. 2018, 16, 823–836. [Google Scholar] [CrossRef] [PubMed]
- Codex Alimentarius Commission. CXS 118-1979. Adopted in 1979. Amended in 1983 and 2015. Revised in 2008. Standard for Foods for Special Dietary Use for Persons Intolerant to Gluten. Available online: https://www.fao.org/fao-who-codexalimentarius/codex-texts/list-standards/en/ (accessed on 4 November 2022).
- European Commission. Commission Implementing Regulation (EU) No 828/2014 of 30 July 2014 on the requirements for the provision of information to consumers on the absence or reduced presence of gluten in food. OJEU 2014, L228, 5–8. Available online: http://data.europa.eu/eli/reg_impl/2014/828/oj (accessed on 4 November 2022).
- Food and Drug Administration. Food labeling; Gluten-free labeling of foods. Fed. Regist. 2013, 78, 47154. Available online: https://www.federalregister.gov/documents/2013/08/05/2013-18813/food-labeling-gluten-free-labeling-of-foods (accessed on 4 November 2022).
- Gao, Y.; Janes, M.E.; Chaiya, B.; Brennan, M.A.; Brennan, C.S.; Prinyawiwatkul, W. Gluten-free bakery and pasta products: Prevalence and quality improvement. Int. J. Food Sci. Technol. 2018, 53, 19–32. [Google Scholar] [CrossRef]
- Marti, A.; Pagani, M.A. What can play the role of gluten in gluten free pasta? Trends Food Sci. Technol. 2013, 31, 63–71. [Google Scholar] [CrossRef]
- Larrosa, V.; Lorenzo, G.; Zaritzky, N.; Califano, A. Optimization of rheological properties of gluten-free pasta dough using mixture design. J. Cereal Sci. 2013, 57, 520–526. [Google Scholar] [CrossRef]
- Udachan, I.S.; Sahoo, A.K. Effect of hydrocolloids in the development of gluten free brown rice pasta. Int. J. ChemTech Res. 2017, 10, 407–415. [Google Scholar]
- Laleg, K.; Cassan, D.; Barron, C.; Prabhasankar, P.; Micard, V. Structural, culinary, nutritional and anti-nutritional properties of high protein, gluten free, 100% legume pasta. PLoS ONE 2016, 11, e0160721. [Google Scholar] [CrossRef]
- Padayachee, A.; Day, L.; Howell, K.; Gidley, M.J. Complexity and health functionality of plant cell wall fibers from fruits and vegetables. Crit. Rev. Food Sci. Nutr. 2017, 57, 59–81. [Google Scholar] [CrossRef]
- Grigoraş, C.-G. Valorisation des Fruits et des Sous-Produits de L’industrie de Transformation des Fruits par Extraction des Composés Bioactifs. Ph.D. Thesis, Université d’Orléans, Orléans, France, 24 September 2012. Available online: https://tel.archives-ouvertes.fr/tel-00772304/ (accessed on 4 November 2022).
- Sharma, S.K.; Bansal, S.; Mangal, M.; Dixit, A.K.; Gupta, R.K.; Mangal, A.K. Utilization of food processing by-products as dietary, functional, and novel fiber: A review. Crit. Rev. Food Sci. Nutr. 2016, 56, 1647–1661. [Google Scholar] [CrossRef] [PubMed]
- Ben-Othman, S.; Joudu, I.; Bhat, R. Bioactives from agri-food wastes: Present insights and future challenges. Molecules 2020, 25, 510. [Google Scholar] [CrossRef] [PubMed]
- Nour, V.; Panaite, T.D.; Ropota, M.; Turcu, R.; Trandafir, I.; Corbu, A.R. Nutritional and bioactive compounds in dried tomato processing waste. CyTA-J. Food 2018, 16, 222–229. [Google Scholar] [CrossRef]
- Elbadrawy, E.; Sello, A. Evaluation of nutritional value and antioxidant activity of tomato peel extracts. Arab. J. Chem. 2016, 9, S1010–S1018. [Google Scholar] [CrossRef]
- Nakov, G.; Brandolini, A.; Estivi, L.; Bertuglia, K.; Ivanova, N.; Jukić, M.; Komlenić, D.K.; Lukinac, J.; Hidalgo, A. Effect of tomato pomace addition on chemical, technological, nutritional, and sensorial properties of cream crackers. Antioxidants 2022, 11, 2087. [Google Scholar] [CrossRef]
- Nobre, B.P.; Palavra, A.F.; Pessoa, F.L.; Mendes, R.L. Supercritical CO2 extraction of trans-lycopene from Portuguese tomato industrial waste. Food Chem. 2009, 116, 680–685. [Google Scholar] [CrossRef]
- Chen, K.; Lu, P.; Beeraka, N.M.; Sukocheva, O.A.; Madhunapantula, S.V.; Liu, J.; Sinelnikov, M.Y.; Nikolenko, V.N.; Bulygin, K.V.; Mikhaleva, L.M.; et al. Mitochondrial mutations and mitoepigenetics: Focus on regulation of oxidative stress-induced responses in breast cancers. Semin. Cancer Biol. 2022, 83, 556–569. [Google Scholar] [CrossRef]
- Liu, Y.; Chen, C.; Wang, X.; Sun, Y.; Zhang, J.; Chen, J.; Shi, Y. An epigenetic role of mitochondria in cancer. Cells 2022, 11, 2518. [Google Scholar] [CrossRef]
- Liu, Z.; Ren, Z.; Zhang, J.; Chuang, C.C.; Kandaswamy, E.; Zhou, T.; Zuo, L. Role of ROS and nutritional antioxidants in human diseases. Front. Physiol. 2018, 9, 477. [Google Scholar] [CrossRef]
- Mueller, K.; Eisner, P.; Yoshie-Stark, Y.; Nakada, R.; Kirchhoff, E. Functional properties and chemical composition of fractionated brown and yellow linseed meal (Linum usitatissimum L.). J. Food Eng. 2010, 98, 453–460. [Google Scholar] [CrossRef]
- Kyselka, J.; Rabiej, D.; Dragoun, M.; Kreps, F.; Burčová, Z.; Němečková, I.; Smolová, J.; Bjelková, M.; Szydłowska-Czerniak, A.; Schmidt, Š.; et al. Antioxidant and antimicrobial activity of linseed lignans and phenolic acids. Eur. Food Res. Technol. 2017, 243, 1633–1644. [Google Scholar] [CrossRef]
- Padalino, L.; Conte, A.; Lecce, L.; Likyova, D.; Sicari, V.; Pellicanò, T.M.; Poiana, M.; Del Nobile, M.A. Functional pasta with tomato by-product as a source of antioxidant compounds and dietary fibre. Czech J. Food Sci. 2017, 35, 48–56. [Google Scholar] [CrossRef]
- Kaur, K.; Chhikara, N.; Sharma, P.; Garg, M.K.; Panghal, A. Coconut meal: Nutraceutical importance and food industry application. Foods Raw Mater. 2019, 7, 419–427. [Google Scholar] [CrossRef]
- Wirkijowska, A.; Zarzycki, P.; Sobota, A.; Nawrocka, A.; Blicharz-Kania, A.; Andrejko, D. The possibility of using by-products from the flaxseed industry for functional bread production. LWT 2020, 118, 108860. [Google Scholar] [CrossRef]
- Difonzo, G.; de Gennaro, G.; Pasqualone, A.; Caponio, F. Potential use of plant-based by-products and waste to improve the quality of gluten-free foods. J. Sci. Food Agric. 2022, 102, 2199–2211. [Google Scholar] [CrossRef] [PubMed]
- Fradinho, P.; Oliveira, A.; Domínguez, H.; Torres, M.D.; Sousa, I.; Raymundo, A. Improving the nutritional performance of gluten-free pasta with potato peel autohydrolysis extract. Innov. Food Sci. Emerg. Technol. 2020, 63, 102374. [Google Scholar] [CrossRef]
- Raungrusmee, S.; Shrestha, S.; Sadiq, M.B.; Anal, A.K. Influence of resistant starch, xanthan gum, inulin and defatted rice bran on the physicochemical, functional and sensory properties of low glycemic gluten-free noodles. LWT-Food Sci. Technol. 2020, 126, 109279. [Google Scholar] [CrossRef]
- Devraj, L.; Panoth, A.; Kashampur, K.; Kumar, A.; Natarajan, V. Study on physicochemical, phytochemical, and antioxidant properties of selected traditional and white rice varieties. J. Food Process Eng. 2020, 43, e13330. [Google Scholar] [CrossRef]
- Goufo, P.; Ferreira, L.M.M.; Carranca, C.; Rosa, E.A.S.; Trindade, H. Effect of elevated carbon dioxide concentration on rice quality: Proximate composition, dietary fibers, and free sugars. Cereal Chem. 2014, 91, 293–299. [Google Scholar] [CrossRef]
- Culetu, A.; Susman, I.E.; Duta, D.E.; Belc, N. Nutritional and functional properties of gluten-free flours. Appl. Sci. 2021, 11, 6283. [Google Scholar] [CrossRef]
- De Angelis, D.; Pasqualone, A.; Costantini, M.; Ricciardi, L.; Lotti, C.; Pavan, S.; Summo, C. Data on the proximate composition, bioactive compounds, physicochemical and functional properties of a collection of faba beans (Vicia faba L.) and lentils (Lens culinaris Medik.). Data Br. 2021, 34, 106660. [Google Scholar] [CrossRef] [PubMed]
- Del Valle, M.; Cámara, M.; Torija, M. Chemical characterization of tomato pomace. J. Sci. Food Agric. 2006, 86, 1232–1236. [Google Scholar] [CrossRef]
- Belović, M.; Torbica, A.; Lijaković, I.P.; Tomić, J.; Lončarević, I.; Petrović, J. Tomato pomace powder as a raw material for ketchup production. Food Biosci. 2018, 26, 193–199. [Google Scholar] [CrossRef]
- Azabou, S.; Louati, I.; Taheur, F.B.; Nasri, M.; Mechichi, T. Towards sustainable management of tomato pomace through the recovery of valuable compounds and sequential production of low-cost biosorbent. Environ. Sci. Pollut. Res. 2020, 27, 39402–39412. [Google Scholar] [CrossRef] [PubMed]
- Kaur, M.; Singh, B.; Kaur, A.; Singh, N. Proximate, mineral, amino acid composition, phenolic profile, antioxidant and functional properties of oilseed cakes. Int. J. Food Sci. Technol. 2021, 56, 6732–6741. [Google Scholar] [CrossRef]
- Mannucci, A.; Castagna, A.; Santin, M.; Serra, A.; Mele, M.; Ranieri, A. Quality of flaxseed oil cake under different storage conditions. LWT 2019, 104, 84–90. [Google Scholar] [CrossRef]
- Toor, R.K.; Savage, G.P. Antioxidant activity in different fractions of tomatoes. Food Res. Int. 2005, 38, 487–494. [Google Scholar] [CrossRef]
- Shao, D.; Atungulu, G.G.; Pan, Z.; Yue, T.; Zhang, A.; Chen, X. Separation methods and chemical and nutritional characteristics of tomato pomace. ASABE 2013, 56, 261–268. [Google Scholar] [CrossRef]
- Silva, Y.P.A.; Borba, B.C.; Pereira, V.A.; Reis, M.G.; Caliari, M.; Brooks, M.S.; Ferreira, T.A.P.C. Characterization of tomato processing by-product for use as a potential functional food ingredient: Nutritional composition, antioxidant activity and bioactive compounds. Int. J. Food Sci. Nutr. 2019, 70, 150–160. [Google Scholar] [CrossRef]
- Szabo, K.; Dulf, F.V.; Diaconeasa, Z.; Vodnar, D.C. Antimicrobial and antioxidant properties of tomato processing byproducts and their correlation with the biochemical composition. Food Sci. Technol. 2019, 116, 108558. [Google Scholar] [CrossRef]
- Kan, L.; Nie, S.; Hu, J.; Wang, S.; Bai, Z.; Wang, J.; Zhou, Y.; Jiang, J.; Zeng, Q.; Song, K. Comparative study on the chemical composition, anthocyanins, tocopherols and carotenoids of selected legumes. Food Chem. 2018, 260, 317–326. [Google Scholar] [CrossRef] [PubMed]
- Rodríguez, G.; Aguirre, E.; Córdova-Chang, A.; Muñoz, J.; Baquerizo, M.; Brandolini, A.; Villanueva, E.; Hidalgo, A. Modification of the nutritional quality and oxidative stability of lupin (Lupinus mutabilis Sweet) and sacha inchi (Plukenetia volubilis L.) oil blends. Molecules 2022, 27, 7315. [Google Scholar] [CrossRef] [PubMed]
- Kalogeropoulos, N.; Chiou, A.; Ioannou, M.; Karathanos, V.T.; Hassapidou, M.; Andrikopoulos, N.K. Nutritional evaluation and bioactive microconstituents (phytosterols, tocopherols, polyphenols, triterpenic acids) in cooked dry legumes usually consumed in the Mediterranean countries. Food Chem. 2010, 121, 682–690. [Google Scholar] [CrossRef]
- Goufo, P.; Trindade, H. Rice antioxidants: Phenolic acids, flavonoids, anthocyanins, proanthocyanidins, tocopherols, tocotrienols, γ-oryzanol, and phytic acid. Food Sci. Nutr. 2014, 2, 75–104. [Google Scholar] [CrossRef]
- Johnson, J.B.; Skylas, D.J.; Mani, J.S.; Xiang, J.; Walsh, K.B.; Naiker, M. Phenolic profiles of ten Australian faba bean varieties. Molecules 2021, 26, 4642. [Google Scholar] [CrossRef]
- Giusti, F.; Caprioli, G.; Ricciutelli, M.; Vittori, S.; Sagratini, G. Determination of fourteen polyphenols in pulses by high performance liquid chromatography-diode array detection (HPLC-DAD) and correlation study with antioxidant activity and colour. Food Chem. 2017, 221, 689–697. [Google Scholar] [CrossRef]
- Abbasi-Parizad, P.; De Nisi, P.; Scaglia, B.; Scafaroni, A.; Pilu, S.; Adani, F. Recovery of phenolic compounds from agro-industrial by-products: Evaluating antiradical activities and immunomodulatory properties. Food Bioprod. Process. 2021, 127, 338–348. [Google Scholar] [CrossRef]
- Perea-Domínguez, X.P.; Hernández-Gastelum, L.Z.; Olivas-Olguin, H.R.; Espinosa-Alonso, L.G.; Valdez-Morales, M.; Medina-Godoy, S. Phenolic composition of tomato varieties and an industrial tomato by-product: Free, conjugated and bound phenolics and antioxidant activity. J. Food Sci. Technol. 2018, 55, 3453–3461. [Google Scholar] [CrossRef]
- Valdez-Morales, M.; Espinosa-Alonso, L.G.; Espinoza-Torres, L.C.; Delgado-Vargas, F.; Medina-Godoy, S. Phenolic content and antioxidant and antimutagenic activities in tomato peel, seeds, and byproducts. J. Agric. Food Chem. 2014, 62, 5281–5289. [Google Scholar] [CrossRef]
- Tian, S.; Nakamura, K.; Kayahara, H. Analysis of phenolic compounds in white rice, brown rice, and germinated brown rice. J. Agric. Food Chem. 2004, 52, 4808–4813. [Google Scholar] [CrossRef]
- Zhu, L.; Li, W.; Deng, Z.; Li, H.; Zhang, B. The composition and antioxidant activity of bound phenolics in three legumes, and their metabolism and bioaccessibility of gastrointestinal tract. Foods 2020, 9, 1816. [Google Scholar] [CrossRef] [PubMed]
- Zarzycki, P.; Sykut-Domańska, E.; Sobota, A.; Teterycz, D.; Krawęcka, A.; Blicharz-Kania, A.; Andrejko, D.; Zdybel, B. Flaxseed enriched pasta—Chemical composition and cooking quality. Foods 2020, 9, 404. [Google Scholar] [CrossRef] [PubMed]
- Giannetti, V.; Boccacci Mariani, M.; Mannino, P. Furosine as a pasta quality marker: Evaluation by an innovative and fast chromatographic approach. J. Food Sci. 2013, 78, C994–C999. [Google Scholar] [CrossRef] [PubMed]
- Ćetković, G.; Šeregelj, V.; Brandolini, A.; Čanadanović-Brunet, J.; Tumbas Šaponjac, V.; Vulić, J.; Šovljanski, O.; Četojević-Simin, D.; Škrobot, D.; Mandić, A.; et al. Composition, texture, sensorial quality, and biological activity after in vitro digestion of durum wheat pasta enriched with carrot waste extract encapsulates. Int. J. Food Sci. Nutr. 2022, 73, 638–649. [Google Scholar] [CrossRef]
- Fratianni, A.; Giuzio, L.; Di Criscio, T.; Zina, F.; Panfili, G. Response of carotenoids and tocols of durum wheat in relation to water stress and sulfur fertilization. J. Agric. Food Chem. 2013, 61, 2583–2590. [Google Scholar] [CrossRef]
- Van Hung, P.; Hatcher, D.W. Ultra-performance liquid chromatography (UPLC) quantification of carotenoids in durum wheat: Influence of genotype and environment in relation to the colour of yellow alkaline noodles (YAN). Food Chem. 2011, 125, 1510–1516. [Google Scholar] [CrossRef]
- Hidalgo, A.; Brandolini, A.; Pompei, C. Carotenoids evolution during pasta, bread and water biscuit preparation from wheat flours. Food Chem. 2010, 121, 746–751. [Google Scholar] [CrossRef]
- Padalino, L.; D’Antuono, I.; Durante, M.; Conte, A.; Cardinali, A.; Linsalata, V.; Mita, G.; Logrieco, A.F.; Del Nobile, M.A. Use of olive oil industrial by-product for pasta enrichment. Antioxidants 2018, 7, 59. [Google Scholar] [CrossRef]
- Kaur, M.; Dhaliwal, M.; Kaur, H.; Singh, M.; Punia Bangar, S.; Kumar, M.; Pandiselvam, R. Preparation of antioxidant-rich tricolor pasta using microwave processed orange pomace and cucumber peel powder: A study on nutraceutical, textural, color, and sensory attributes. J. Texture Stud. 2021, 53, 834–843. [Google Scholar] [CrossRef]
- FAO/WHO. Vitamin and Mineral Requirements in Human Nutrition, 2nd ed.; WHO: Bangkok, Thailand, 2004; pp. 94–107. Available online: https://www.who.int/publications/i/item/9241546123 (accessed on 4 November 2022).
- Oniszczuk, A.; Widelska, G.; Wójtowicz, A.; Oniszczuk, T.; Wojtunik-Kulesza, K.; Dib, A.; Matwijczuk, A. Content of phenolic compounds and antioxidant activity of new gluten-free pasta with the addition of chestnut flour. Molecules 2019, 24, 2623. [Google Scholar] [CrossRef]
- Balli, D.; Cecchi, L.; Innocenti, M.; Bellumori, M.; Mulinacci, N. Food by-products valorisation: Grape pomace and olive pomace (pâté) as sources of phenolic compounds and fiber for enrichment of tagliatelle pasta. Food Chem. 2021, 355, 129642. [Google Scholar] [CrossRef] [PubMed]
- Rodríguez De Marco, E.; Steffolani, M.E.; Martínez, C.S.; León, A.E. Effects of spirulina biomass on the technological and nutritional quality of bread wheat pasta. LWT 2014, 58, 102–108. [Google Scholar] [CrossRef]
- Jayasena, V.; Nasar-Abbas, S.M. Development and quality evaluation of high-protein and high-dietary-fiber pasta using lupin flour. J. Texture Stud. 2012, 43, 153–163. [Google Scholar] [CrossRef]
- AACC International. Method 44-15.02. In Approved Methods of Analysis, 11th ed.; Cereals & Grains Association: St. Paul, MN, USA, 1999. [Google Scholar]
- AOAC International. Methods n. 923.03, 978.10 and 979.09. In Official Methods of Analysis of AOAC International (OMA); Association of Official Analytical Chemists: Washington, DC, USA, 2000; Available online: http://www.eoma.aoac.org/ (accessed on 4 November 2022).
- AOCS. Method: Ba 3-38. In Official Methods and Recommended Practices of the AOCS, 6th ed.; The American Oil Chemists’ Society: Urbana, IL, USA, 2012. [Google Scholar]
- ICC Standard Methods, 2nd Supplement. Method: 136; International Association for Cereal Science and Technology: Vienna, Austria, 1995.
- Hidalgo, A.; Brandolini, A. Evaluation of heat damage, sugars, amylases and colour in breads from einkorn, durum and bread wheat flour. J. Cereal Sci. 2011, 54, 90–97. [Google Scholar] [CrossRef]
- Hidalgo, A.; Brandolini, A. Tocopherols stability during bread, water biscuit and pasta processing from wheat flours. J. Cereal Sci. 2010, 52, 254–259. [Google Scholar] [CrossRef]
- Rodríguez, G.; Squeo, G.; Estivi, L.; Quezada Berru, S.; Buleje, D.; Caponio, F.; Brandolini, A.; Hidalgo, A. Changes in stability, tocopherols, fatty acids and antioxidant capacity of sacha inchi (Plukenetia volubilis) oil during French fries deep-frying. Food Chem. 2021, 340, 127942. [Google Scholar] [CrossRef]
- Brandolini, A.; Hidalgo, A.; Gabriele, S.; Heun, M. Chemical composition of wild and feral diploid wheats and their bearing on domesticated wheats. J. Cereal Sci. 2015, 63, 122–127. [Google Scholar] [CrossRef]
- Nakov, G.; Brandolini, A.; Hidalgo, A.; Ivanova, N.; Stamatovska, V.; Dimov, I. Effect of grape pomace powder addition on chemical, nutritional and technological properties of cakes. LWT 2020, 134, 109950. [Google Scholar] [CrossRef]
- Yilmaz, V.A.; Brandolini, A.; Hidalgo, A. Phenolic acids and antioxidant activity of wild, feral and domesticated diploid wheats. J. Cereal Sci. 2015, 64, 168–175. [Google Scholar] [CrossRef]
- Brandolini, A.; Glorio-Paulet, P.; Estivi, L.; Locatelli, N.; Cordova-Ramos, J.S.; Hidalgo, A. Tocopherols, carotenoids and phenolics changes during Andean lupin (Lupinus mutabilis Sweet) seeds processing. J. Food Compos. Anal. 2022, 106, 104335. [Google Scholar] [CrossRef]
- Re, R.; Pellegrini, N.; Proteggente, A.; Pannala, A.; Yang, M.; Rice-Evans, C. Antioxidant activity applying an improved ABTS radical cation decolorization assay. Free Radic. Biol. Med. 1999, 26, 1231–1237. [Google Scholar] [CrossRef] [PubMed]
Publisher’s Note: MDPI stays neutral with regard to jurisdictional claims in published maps and institutional affiliations. |
© 2022 by the authors. Licensee MDPI, Basel, Switzerland. This article is an open access article distributed under the terms and conditions of the Creative Commons Attribution (CC BY) license (https://creativecommons.org/licenses/by/4.0/).