Article

Chemical Profiling and Quantification of Potential Bioactive Components in Gandouling Pill by Ultra-High Performance Liquid Chromatography Coupled with Diode Array Detector/Quadruple-Qrbitrap Mass Spectrometry

1
Graduate School of Anhui University of Chinese Medicine, Hefei 230038, China
2
The First Affifiliated Hospital of Anhui University of Chinese Medicine, Hefei 230022, China
3
School of Pharmaceutical Sciences, Peking University, Beijing 100191, China
4
Xin’an Medical Education Ministry Key Laboratory, Hefei 230038, China
*
Authors to whom correspondence should be addressed.
Molecules 2022, 27(23), 8247; https://doi.org/10.3390/molecules27238247
Submission received: 22 October 2022 / Revised: 19 November 2022 / Accepted: 21 November 2022 / Published: 26 November 2022

Abstract

:
Gandouling (GDL) Pill is a novel Traditional Chinese medicinal drug to treat Wilson’s disease in clinics. It is composed of six separate herbal medicines, including Rhei Radix ET Rhizoma, Coptidis Rhizoma, Salviae Miltiorrhizae Radix ET Rhizoma, Spatholobi Caulis, Curcumae Rhizoma, and Curcumae Longae Rhizoma. In this study, a strategy was proposed to investigate the chemical constituents and to quantify the potential bioactive components in GDL Pill. Firstly, the mass fragmentation behaviors of representative compounds were investigated, and, in total, 69 compounds were characterized in GDL Pill using full scan/dd-MS2 scan mode by ultra-high-performance liquid chromatography (UPLC)/Q-Orbitrap mass spectrometry (MS). These compounds included 18 alkaloids, 18 ketones, 16 phenolic compounds, 11 organic acids, and 6 tanshinones. Seventeen of the compounds were unambiguously identified by comparison with reference standards. Secondly, the absorption components of GDL Pill in rat plasma were investigated by using target-Selected Ion Monitoring (t-SIM) scan mode built in Q-Orbitrap MS. A total of 18 components were detected, which were considered as potential bioactive components of GDL Pill. Thirdly, 10 major absorption components were simultaneously determined in six batches of samples by UPLC/diode array detector (DAD). The method was fully validated with respect to linearity, precision, repeatability, stability, and recovery. Alkaloids from Coptidis Rhizoma, such as coptisine (8), berberine (18), palmatine (19), were the most abundant bioactive compounds for GDL Pill that possess the potential be used as quality markers. The proposed strategy is practical and efficient for revealing the material basis of GDL Pill, and also provides a simple and accurate method for quality control.

1. Introduction

Traditional Chinese medicines (TCMs) are always used in the form of formulae in clinical practice [1]. They are demonstrated to be “complex matrix” in structure with a large array of compounds [2,3,4,5]. Fully understanding the chemicals, especially the potentially bioactive ones, is vital for the safety and efficacy evaluation of TCM formulae. In the past decades, various analytical technologies were developed for TCM formulae, such as liquid chromatography/diode array detector (LC/DAD) and liquid chromatography/mass spectrometry (LC/MS) [6]. Among them, LC/MS is a cost-effective tool to characterize a large number of compounds from TCM formulae. In our previous report, a total of 259 compounds were rapidly detected and characterized in the Xiaoer–Feire–Kechuan formula [3]. Multi-components determination also plays a key role for quality control of TCM formulae. LC/DAD is a conventional technology, due to its strong applicability and easy operation. For example, by using LC/DAD method, a total of 19 compounds in the Xiaoer–Feire–Kechuan formula were simultaneously determined [5]. However, two major drawbacks emerged in the current quality evaluation for TCM formulae, as follow: (1) The chemical basis was not fully clarified; (2) Insufficient quality markers could not reflect the entirety of a formula. Obviously, it is imperative to develop more effective and comprehensive analytical methods to address the problems.
Wilson’s disease was first defined in 1912 as being caused by a copper metabolism disorder, which could also present with hepatic and neurological deficits, including dystonia and parkinsonism [7]. Gandouling (GDL) Pill is a novel TCM formula to treat Wilson’s disease by potentially improving liver function and cellular immune function, and combating cognitive and memory impairment and depression in patients [8,9,10]. It is composed of six separate component herbs, including Da-Huang (DH, Rhei Radix ET Rhizoma), Huang-Lian (HL, Coptidis Rhizoma), Dan-Shen (DS, Salviae Miltiorrhizae Radix ET Rhizoma), Ji-Xue-Teng (JXT, Spatholobi Caulis), E-Zhu (EZ, Curcumae Rhizoma), and Jiang-Huang (JH, Curcumae Longae Rhizoma). Hundreds of chemicals have been isolated from the single component herbs, mainly alkaloids, phenolic compounds, saponins, and organic acids, which show a wide range of acidity/alkalinity and polarity [11,12,13,14,15]. Although GDL Pill has been used in clinics to treat Wilson’s disease for a long time, the components in GDL Pill. let alone its potential bioactive components. have not been fully investigated till now. For example, only four compounds (berberine, coptisine, epiberberine, and palmatine) from HL were qualitatively and quantitatively analyzed using a LC/DAD method [16].
In this study, an integrated strategy was proposed to elucidate the chemical components in GDL Pill for the first time. Firstly, the chemical components of GDL Pill were investigated by using Full Scan/dd-MS2 scan mode built-in Q-Orbitrap MS. In total 69 compounds were characterized by verifying their MS and MS/MS spectra. Secondly, 18 absorption components of GDL Pill in rat plasma were detected using target-Selected Ion Monitoring (t-SIM) scan mode. Finally, 10 major absorption components were simultaneously determined in six batches of samples by LC/DAD. This study provides a simple and accurate method for quality control of GDL Pill.

2. Results

2.1. Optimization of the Extraction Method

According to the components of separate herbal medicines in GDL Pill, both hydrophilic compounds (e.g., alkaloids and flavonoid glycosides) and hydrophobic compounds (e.g., phenolic aglycones) may be involved. The extraction method was optimized to effectively extract both types of compounds. Different solvents (water, 50% methanol, 75% methanol, and methanol) were compared to fully extract the components in GDL Pill, and 75% methanol provided the best extraction efficiency for different types of compounds (Figure S1, Table S1). For example, the alkaloids 18/19 and phenolic aglycones 58/64 exhibited higher recovery in 75% methanol. Therefore, 75% methanol was chosen to extract the chemicals in GDL Pill.

2.2. Optimization of the Separation Method

Due to the rich alkaloids in HL, peak tailing is easily observed, which seriously influences the separation degree. Different types of stationary phases, including Acquity charged surface hybrid (CSH) C18 (2.1 × 100 mm, 1.7 μm, Waters, MA, USA), Acquity HSS T3 C18 (2.1 × 100 mm, 1.8 μm, Waters, MA, USA), Acquity Cortecs C18 (2.1 × 100 mm, 1.6 μm, Waters, MA, USA), SB-C18 column (2.1 mm × 150 mm, 1.8 µm, Agilent, MA, USA), were optimized using the real sample. As shown in Figure S2, the Acquity CSH C18 column provided favorable resolution for alkaloids (8–11, 18, 19), as well as for other compounds (41, 53, 58, 64). When comparing the peak shape using different types of mobile phases, it was illustrated that acidic additive was essential for baseline separation of alkaloids (Figure S3), and 0.1% formic acid in water was used for the following study.

2.3. Chemical Profiling of GDL Pill

A high-resolution mass spectrometer was used to detect and identify the compounds in GDL Pill. In total 69 compounds were tentatively characterized, including 18 alkaloids, 16 phenolic compounds, 11 organic acids, 6 tanshinones, and 18 ketones (Table 1, Figure 1) [11,12,13,14,15,17,18,19]. Among them, 17 compounds were fully identified by comparing with reference standards. Moreover, by comparing with the MS spectra of separate herbs, the sources of characterized compounds were also identified (Figures S4 and S5).

2.3.1. Characterization of Alkaloids

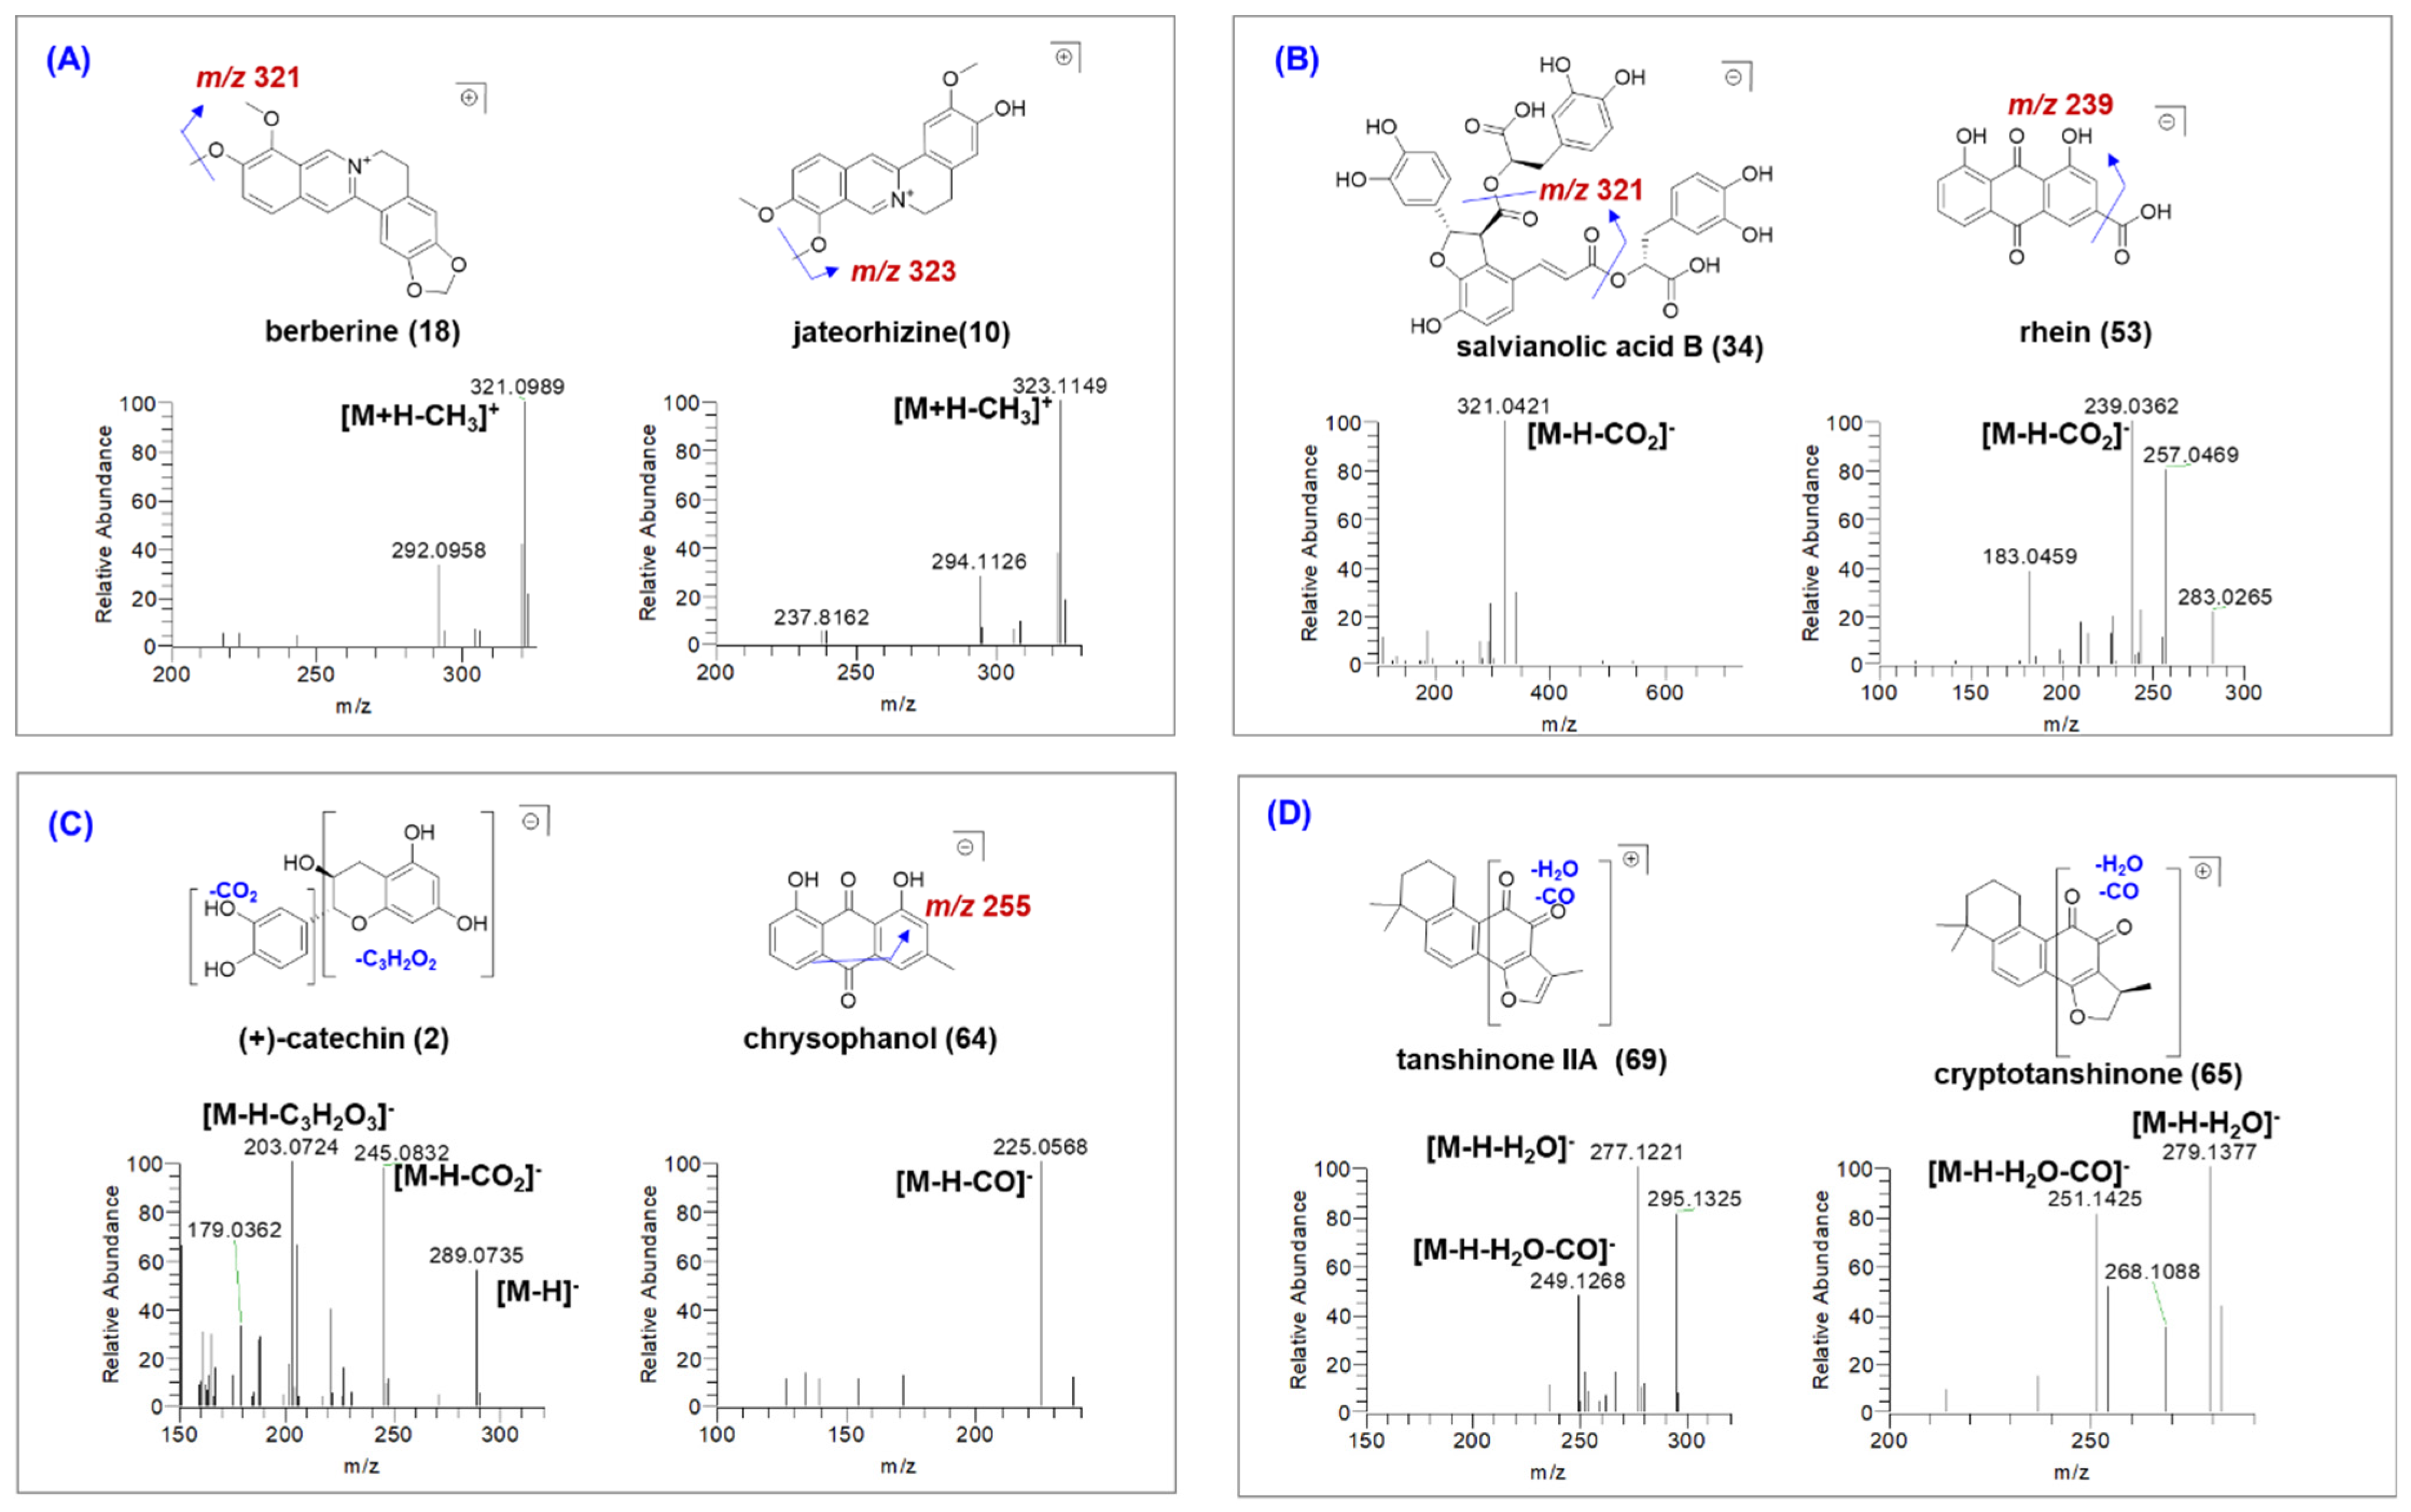
Alkaloids in GDL Pill are mainly from HL, which are easily ionized in positive ion mode. In this study, in total, 18 alkaloids were characterized in GDL Pill by comparing with standards or verifying their MS and MS/MS spectra. The alkaloids from HL usually contain methoxyl groups, and, thus, yield neutral loss (NL) of 15.0238 Da, corresponding to a methyl radical (CH3) in tandem mass spectrometry. For example, compounds 9 and 18 exhibited the [M + H]+ ions at m/z 336.12, and the corresponding molecular formula was C20H18O4N. In their MS/MS spectra, both of them yielded the product ion at m/z 321.09 [M+H-CH3]+ and m/z 292.10 [M+H-C2H4O]+. By comparing with reference standards, compounds 9 and 18 were respectively identified as epiberberine and berberine, by verifying their retention times, MS and MS/MS spectra (Figure 2A and Figure S6). Similarly, compounds 10 and 11 exhibited the [M + H]+ ions at m/z 323.09, and the corresponding molecular formula was C20H20O4N. In their MS/MS spectra, both of them also yielded the product ion at m/z 323.09 [M+H-CH3]+ and m/z 294.10 [M+H-C2H4O]+. By comparing with reference standards, compounds 10 and 11 were unambiguously identified as jateorhizine (Figure 2A) and columbamine (Figure S6), respectively. Compound 6 showed [M + H]+ ions at m/z 324.1235 (C19H18O4N). In the MS/MS spectrum, product ion at [M+H-CH3]+ was also observed (Figure S6). By comparing with literature, it was tentatively identified as demethyleneberberine [14].

2.3.2. Characterization of Organic Acids

In total, 11 organic acids were characterized in GDL Pill, which were mainly from DS, HL, and DH. Due to the presence of carboxyl groups, organic acids are easily ionized in negative ion mode. For example, compound 34 exhibited the [M − H] ion at m/z 717.1466, and the corresponding molecular formula was C36H29O16. In the MS/MS spectra, compound 34 yielded the product ions at m/z 339.0526 [M−H-C18H18O9] and m/z 321.0421 [M−H-C18H20O10]. By comparing with a reference standard, compound 34 was identified as salvianolic acid B by verifying the retention times, MS and MS/MS spectra (Figure 2B). Similarly, compound 53 exhibited the [M − H] ion at m/z 283.0626, and the corresponding molecular formula was C15H7O6. In the MS/MS spectra, it yielded the product ion at m/z 239.0362 [M−H-CO2], which demonstrated the presence of the carboxyl group. By comparing with a reference standard, compound 53 was unambiguously identified as rhein (Figure 2B). Compound 35 showed [M − H] ion at m/z 491.1012 (C26H19O10). In the MS/MS spectrum, product ions at m/z 311.0581 [M−H-C9H8O4] and m/z 293.0581 [M−H-C9H10O5] were observed (Figure S7). By comparing with literature, it was tentatively identified as salvianolic acid C. Compounds 7, 12, and 13 showed similar [M − H] ions at m/z 367.11 (C17H19O9). They were respectively characterized as 5-O-feruloylquinic acid, 3-O-feruloylquinic acid, and 4-O-feruloylquinic acid, according to their relative elution times when using a C18 reverse phase column (Figure S7) [12].

2.3.3. Characterization of Phenolic Compounds

In total 16 phenolic compounds were characterized in GDL Pill, which were mainly from DH, JH, and JXT. Compounds 2 and 5 exhibited the [M − H] ions at m/z 289.07, and the corresponding molecular formula was C15H13O6. In their MS/MS spectra, both of them yielded the product ions at m/z 245.08 [M−H-CO2] and m/z 203.07 [M−H-C3H2O3]. By comparing with reference standards, compounds 2 and 5 were, respectively, identified as (+)-catechin (Figure 2C) and epicatechin (Figure S8), by verifying the retention times, MS and MS/MS spectra. Similarly, compound 64 exhibited the [M − H] ion at m/z 253.0502, and the corresponding molecular formula was C15H9O5. In the MS/MS spectra, it yielded the product ion at m/z 225.0568 [M−H-CO]. By comparing with reference standard, compound 64 was unambiguously identified as chrysophanol (Figure 2C). Compound 23 showed [M − H] ion at m/z 445.0800 (C21H17O11), which was 162 Da higher than rhein. In the MS/MS spectrum, product ions at m/z 283.0266 [M−H-Glc] were observed due to the breakage of the glucoside bond. By comparing with literature, this was tentatively identified as rhein-8-O-glucoside (Figure S8) [12]. Compound 38 showed the [M − H] ion at m/z 517.1014 (C24H21O13). In the MS/MS spectrum, product ion at m/z 269.0469 [M−H-Glc-malonyl] was observed. By comparing with literature, it was tentatively identified as malonyl-emodin-glucoside (Figure S8) [12].

2.3.4. Characterization of Other Compounds

In total 6 tanshinones were characterized in GDL Pill. Due to the lack of hydroxyl group, tanshinones are not easily ionized in negative ion mode. Compound 69 exhibited the [M + H]+ ion at m/z 295.1332, and the corresponding molecular formula was C15H9O5. In the MS/MS spectra, it yielded the product ions at m/z 277.1221 [M−H-H2O] and m/z 249.1268 [M−H-H2O-CO]. By comparing with literature, compound 69 was tentatively identified as tanshinone IIA (Figure 2D) [17]. Similarly, compound 65 was characterized as cryptotanshinone (Figure 2D) [18]. In addition, 18 ketones were also characterized in GDL Pill, and their structures were also tentatively characterized using a similar method (Table 1).

2.4. Absorption Components of GDL Pill in Rat Plasma

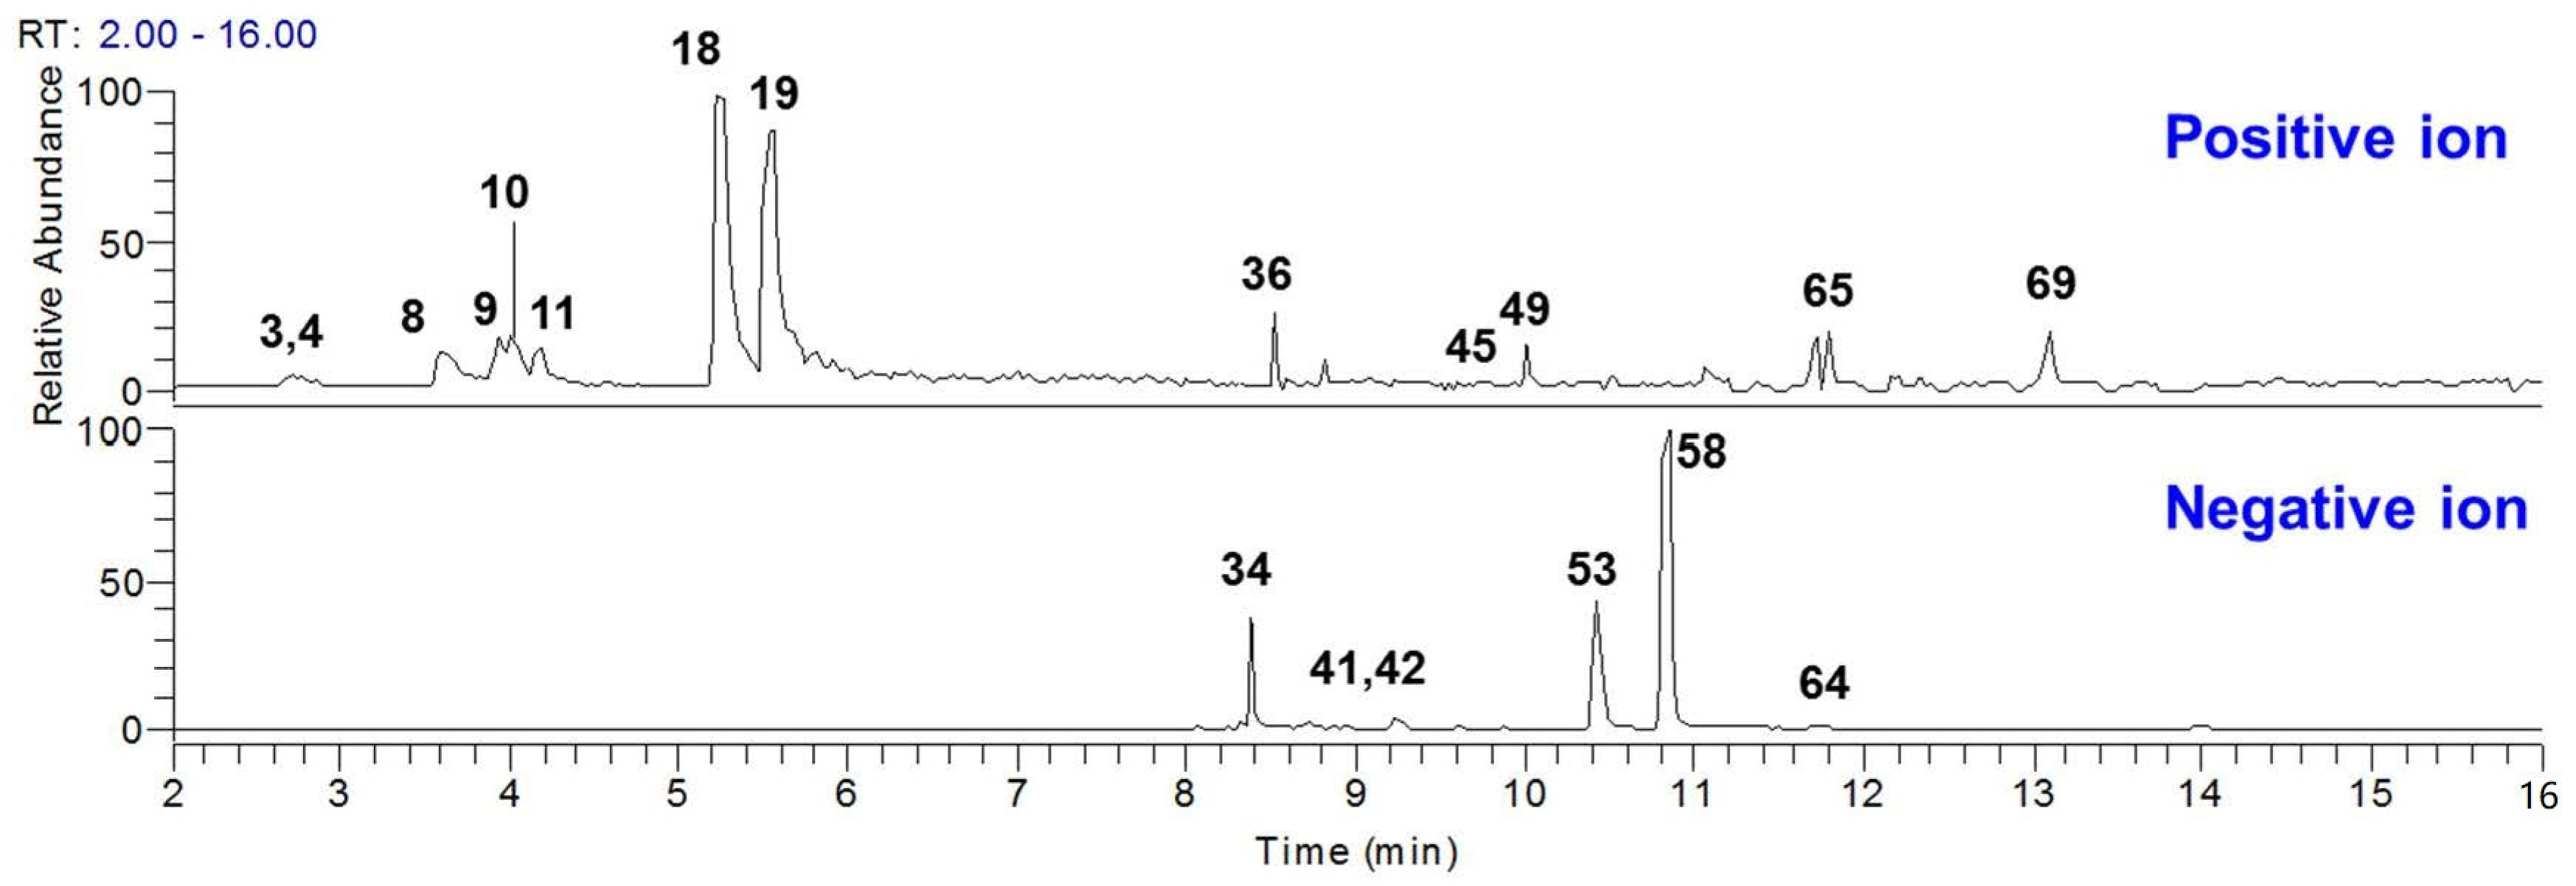
Generally, the components that are absorbed in plasma after oral administration are always considered to be the bioactive ones for traditional Chinese medicines. Based on the chemical components that were characterized in GDL Pill, the plasma-absorption components were determined by a highly sensitive and selective targeted-selected reaction monitoring (t-SIM) scan mode when the GDL Pill was orally administered to rats. In total, 19 compounds were detected in rat plasma (Table 1, Figure 3). The extracted ion chromatograms of the 19 compounds are shown in Figure 4. These compounds included 9 alkaloids, 6 phenolic compounds, 2 organic acids, 2 tanshinones, and 1 ketone (Table 1). These compounds could be potential bioactive components of GDL Pill that could be used for quality control.

2.5. Quantitation of the Plasma-Absorption Components in GDL Pill

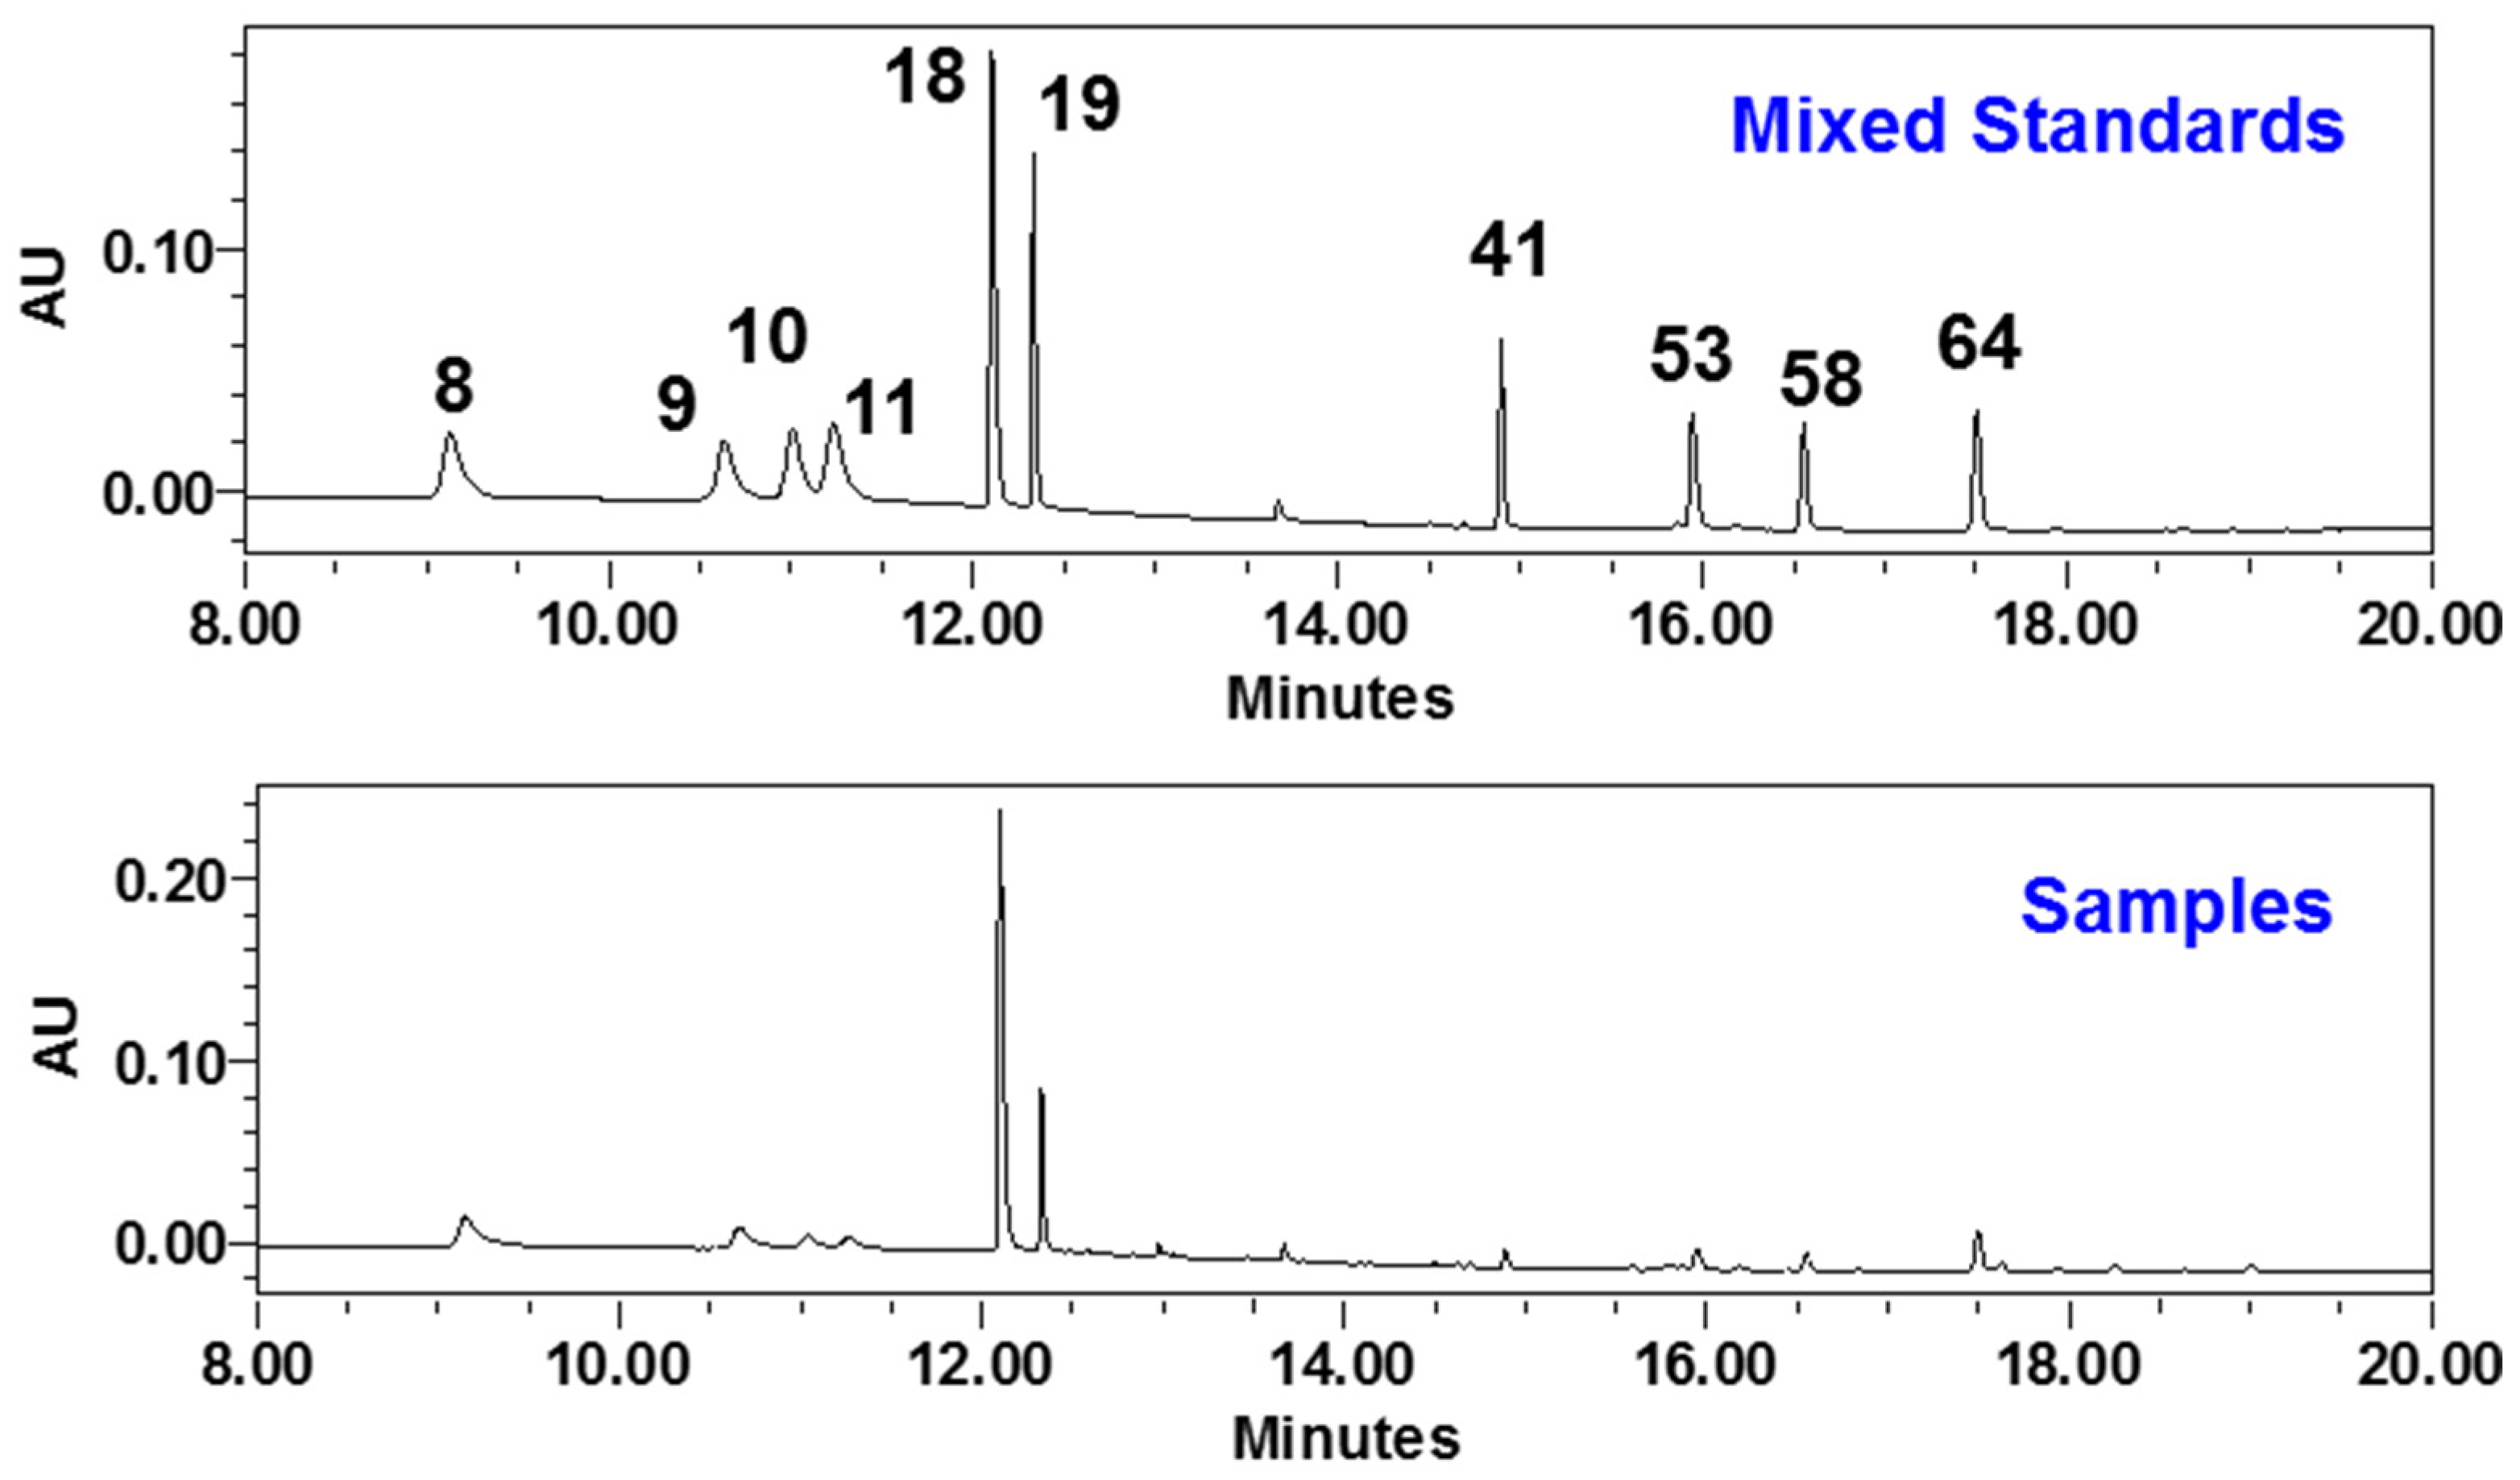
According to the investigation of drug metabolism of GDL Pill in rats, a total of 10 major compounds (coptisine-8, palmatine-19, berberine-18, epiberberine-9, jateorhizine-11, columbamine-10, chrysophanol-64, aloe-emodin-41, rhein-53, and emodin-58) were selected as quality markers for GDL Pill (Figure 4). Among them, six alkaloids (811, 18, 19, and 64) were from HL, and six phenolic aglycones (41, 53, 58, and 64) were from DH.

2.5.1. Method Validation

The calibration curves of 10 analytes were constructed by plotting the analyte peak area (y) against the concentration (x). All the 10 analytes showed good linearity (r2 = 0.9973 − 1.0) (Table 2). The stability was evaluated by analyzing the same sample solution at 0, 2, 4, 8, 12, and 24 h at room temperature (25 ± 2 °C). The RSD values for stability analysis ranged from 0.45% to 4.41%. The precision of the method was evaluated by analyzing the same reference solution six times continuously (intra-day) in the following three days (inter-day). The RSD values for intra-day and inter-day precisions ranged from 0.12% to 1.62% and 0.43% to 1.96%, respectively, indicating acceptable precision of the method. The repeatability was evaluated by injecting six independently prepared sample solutions. The reproducibility test showed a good consistency of the sample preparation process with RSD values ranging from 0.42%–4.26%. The accuracy was measured by spiking the reference standards at 100% level (equivalent to the concentrations in the sample solution) into sample solutions (n = 6). Recovery of the analytes varied from 96.4% to 106.2%, indicating acceptable accuracy of this method.

2.5.2. Sample Analysis

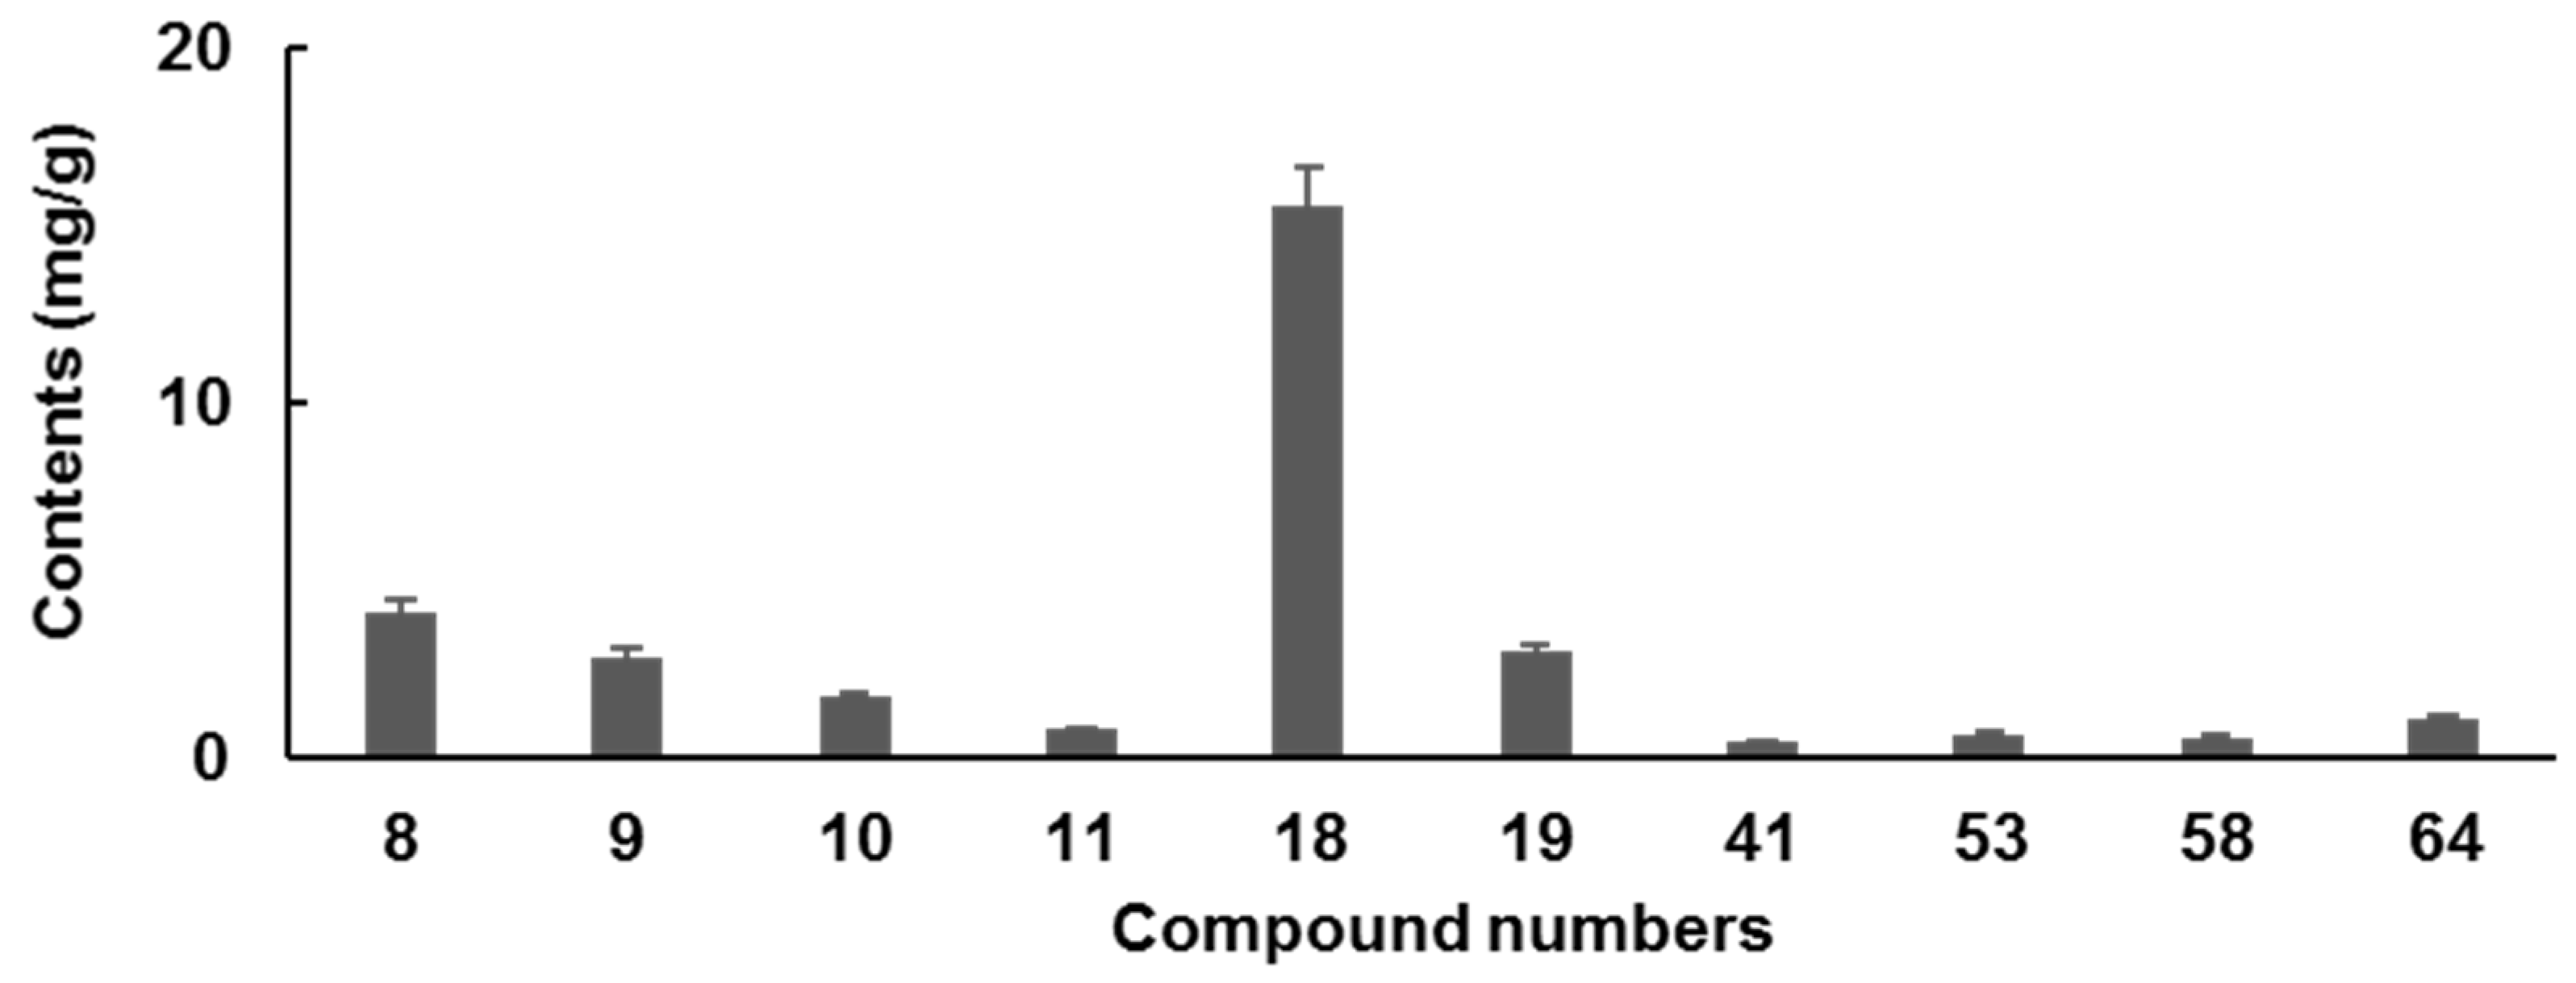
Contents of 10 potential bioactive compounds in 6 batches of GDL Pill were determined (Figure 5). The total contents of these 10 compounds varied from 29.54 to 31.10 mg/g, suggesting good quality consistency. Alkaloids were the major components in GDL Pill with contents at 28.19 ± 1.41 mg/g. Among these, six alkaloids, berberine (18) and coptisine (8) were the predominant constituents. Their contents among the 6 batches of samples were also similar, i.e., 15.54 ± 0.78 mg/g for 18 and 4.16 ± 0.21 mg/g for 8. For 4 phenolic aglycones, chrysophanol (64) was the most abundant one, the contents of which varied from 1.11 to 1.22 mg/g. The total content of the other 3 phenolic aglycones (41, 53, 58) was 2.91 ± 0.15 mg/g.

3. Materials and Methods

3.1. Chemicals and Reagents

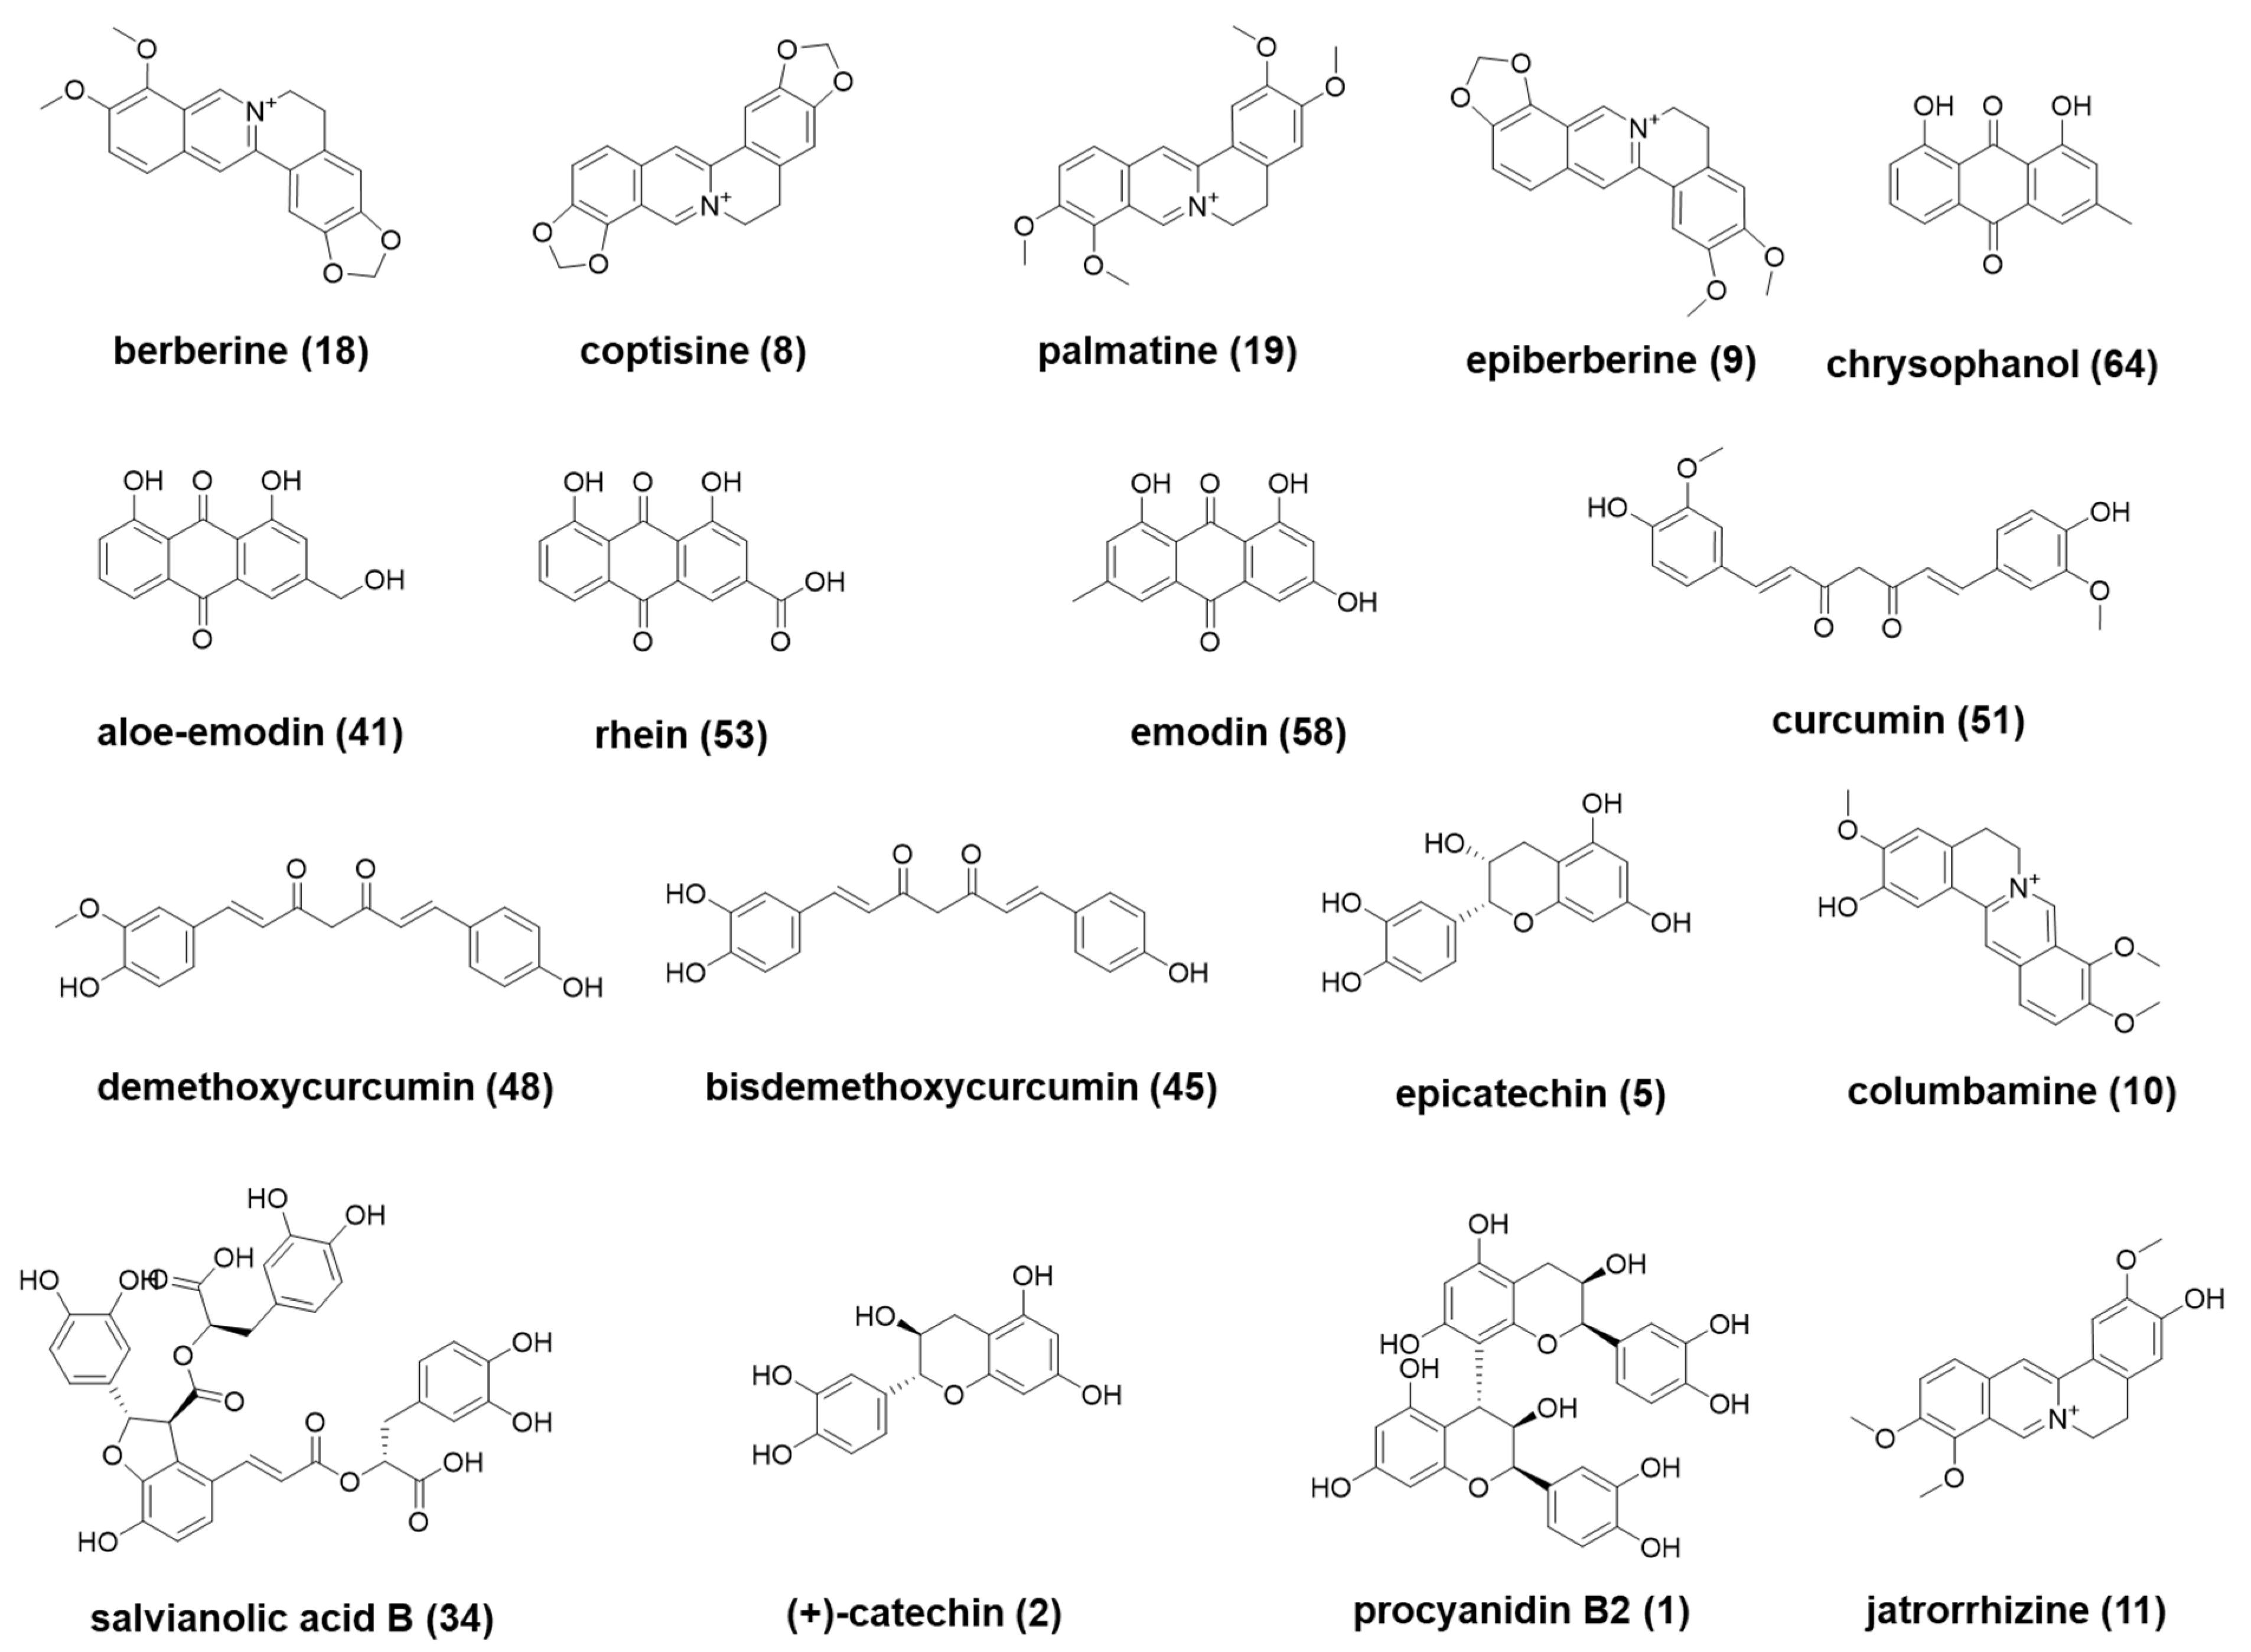
The reference standards of berberine (18), coptisine (8), palmatine (19), jatrorrhizine (11), chrysophanol (64), curcumin (51), demethoxycurcumin (48), and bisdemethoxycurcumin (45) were purchased from Chengdu DeSiTe Biological Technology Co., Ltd. (Chengdu, China). Columbamine (10), salvianolic acid B (34), epiberberine (9), aloe-emodin (41), rhein (53), emodin (58), (+)-catechin (2), procyanidin B2 (1), and epicatechin (5) were purchased from Chengdu MUST Biological Technology Co., Ltd. (Chengdu, China). Their structures are shown in Figure 6. Their purities were > 98% by HPLC analysis. HPLC grade methanol, acetonitrile, and formic acid were obtained from Fisher Scientific (Branchburg, NJ, USA). De-ionized water was prepared by Milli-Q purification system (Millipore, MA, USA).
Separate herbs, including Dahuang (DH, Rhei Radix ET Rhizoma), Huanglian (HL, Coptidis Rhizoma), Danshen (DS, Salviae Miltiorrhizae Radix ET Rhizoma), Jixueteng (JXT, Spatholobi Caulis), Ezhu (EZ, Curcumae Rhizoma), and Jianghuang (JH, Curcumae Longae Rhizoma), and GDL Pill (batch 1–6) were kindly donated by Anhui University of Chinese Medicine. Voucher specimens were deposited at the Anhui University of Chinese Medicine (Anhui, China).

3.2. Sample Solution Preparation

3.2.1. Preparation of Reference Standard Solutions

For qualitative analysis, an appropriate amount of the 17 reference standards was dissolved in 75% methanol (v/v) to prepare a mixed standard solution (10.0 μg/mL for each compound). For quantitative analysis, a mixed stock solution was prepared by dissolving appropriate amounts of each reference standard in 75% methanol (v/v) at 1.0 mg/mL. The mixed standard solution was obtained by adding 200 μL of berberine (18), 100 μL of coptisine (8), palmatine (19), epiberberine (9), jateorhizine (11), columbamine (10), and 50 μL of chrysophanol (64), aloe-emodin (41), rhein (53), emodin (58) stock solutions to a 1 mL volumetric flask. The mixed standard solution was then serially diluted (dilution factor = 2, 4, 8, 16, 32, and 64) using 75% methanol (v/v).

3.2.2. Preparation of Sample Solutions

For qualitative analysis, 200 mg of GDL Pill extracted in 20 mL of 75% methanol (v/v) for 30 min in an ultrasonic water bath (40 kHz, 500 W). Accurately, 300 mg of the HL, DH, DS, JXT, EZ, and JH powders were, respectively, extracted with 30 mL of 50% methanol (v/v) for 30 min in an ultrasonic water bath (40 kHz, 500 W). For quantitative analysis, 50 mg of GDL Pill extracted in 20 mL of 75% methanol (v/v) for 30 min in an ultrasonic water bath (40 kHz, 500 W).

3.3. Animal Experiments

Eight male SD rats weighing 220 ± 20 g were obtained from Beijing Weitong Lihua Experimental Animals Company (Beijing, China). The rats were housed in a controlled room at standard temperature (24 ± 2°C) and humidity (70 ± 5%), and kept on a 12 h light/12 h dark regime. After a week acclimation, rats were randomly divided into two groups: Drug Group (n = 4) for test plasma; Control Group (n = 4) for blank plasma. They were fasted for 12 h with free access to water prior to the experiment. The animal protocols were approved by the institutional Animal Care and Use Committee at Anhui University of Chinese Medicine.
GDL Pill was suspended in 0.5% carboxymethylcellulose sodium (CMC-Na) solution. Rats in Drug Group were given a dose of 77.15 mg/kg body weight orally (equivalent to clinical dosage). 0.5% CMC-Na aqueous solution (2 mL) was administrated to rats in Control Group. Blood samples (0.5 mL) were taken from the suborbital venous plexus of rats at 0.5, 1, 2 and 4 h post-administration. All homogeneous biological samples from the same group were merged into a collective sample.

3.4. Liquid Chromatography

For qualitative analysis, a Vanquish UHPLC system (Thermo Fisher Scientific Inc., Waltham, MA, USA) was used. Samples were separated on an Acquity CSH column (2.1 × 100 mm,1.7 μm, Waters, MA, USA). The mobile phase A was water containing 0.1% formic acid and B was acetonitrile. The gradient elution program was set as follows: 0–4 min, 10%–25% B; 4–8 min, 25%–35% B; 8–16 min, 35%–45% B; 16–20 min, 45%–75% B; 20–22 min, 75%–95% B; 22–24 min, 95%B. The flow rate was 300 μL/min and the column temperature was set at 40 °C. The injection volume was 2 μL. For quantitative analysis, the stationary and mobile phases were the same as for qualitative analysis. The gradient elution program was set as follows: 0 min, 5% B; 10 min, 12% B; 14 min, 50% B; 21 min, 80% B. The flow rate was 400 L/min and the column temperature was set at 50 °C. The UV wavelength was 270 nm. The injection volume was 2 μL.

3.5. Mass Spectrometry

Mass spectrometry analysis was performed on a Q-Exactive Plus hybrid quadrupole Orbitrap mass spectrometer (Thermo Scientific, San Jose, CA, USA) equipped with a heated electrospray ionization source (HESI). It was operated in both negative and positive ion modes. The other parameters were set as follows: spray voltage, ±3.5 kV; sheath gas flow rate, 35 arb; auxiliary gas, 10 arb; capillary temperature, 350 °C; auxiliary temperature, 400 °C; S-lens RF level, 60 V. Full Scan/dd-MS2 was used to acquire the qualitative data. The resolution for MS and MS/MS was set as 70,000 and 17,500, respectively. The scan range was set as m/z 100–1500, and the normalized collision energies (NCE) were 35%. The five most abundant ions in each full scan were selected as precursor ions to obtain their MS/MS spectra. Data were processed using XcaliburTM 4.1 software (Thermo Fisher). For t-SIM scan mode, the accurate [M − H] or [M + H]+ of detected compounds in GDL Pill was added in the Inclusion List to increase the detection sensitivity.

4. Conclusions

In this study, an integrated strategy was proposed to reveal the chemical components for GDL Pill. Firstly, 69 compounds were characterized using Full Scan/dd-MS2 scan mode built-in Q-Orbitrap MS, and 17 of them were unambiguously determined by comparison with reference standards. Secondly, 18 plasma-absorbed components were detected using t-SIM scan mode, which were considered to be potential bioactive components for GDL Pill. Finally, the contents of 10 major absorption components were simultaneously determined in six batches of samples by the UPLC/DAD method. Alkaloids from Coptidis Rhizoma, including coptisine (8), berberine (18), and palmatine (19), were the most abundant bioactive compounds for GDL Pill that could be used as quality markers. The established method is practical and efficient for the quality control of GDL Pill.

Supplementary Materials

The following supporting information can be downloaded at: https://www.mdpi.com/article/10.3390/molecules27238247/s1, Figure S1: Extraction efficiency of compounds in GDL Pills using different solvents; Figure S2: Separation efficiency of compounds in GDL Pills using different stationary phases; Figure S3: Separation efficiency of compounds in GDL Pills using different mobile phases; Figure S4: The LC/MS chromatograms of GDL Pill and separate herbs in the positive ion mode; Figure S5: The LC/MS chromatograms of GDL Pill and separate herbs in the negative ion mode; Figure S6: The MS/MS spectra of representative alkaloids identified in GDL Pill; Figure S7: The MS/MS spectra of representative organic acids identified in GDL Pill; Figure S8: The MS/MS spectra of representative phenolics identified in GDL Pill; Table S1 Comparison of peak areas of 6 major compounds in GDL Pill by using different kinds of extraction solvent.

Author Contributions

Conceptualization and writing-review and editing, Z.S. and W.Y.; methodology and writing-original draft preparation, Y.Y. (Yue Yang) and Z.S.; software, W.H. and Y.Y. (Yulong Yang); data curation, S.Z. and H.W.; methodology, M.W. and T.D. All authors have read and agreed to the published version of the manuscript.

Funding

This research was funded by the National Natural Science Foundation of China [No. 81973825], National Natural Science Foundation of China [Regional Innovation and Development Joint Fund No. U22A20366], Collaborative Innovation Project of Anhui Colleges and Universities [No. GXXT-2020-025] and The APC was funded by the National Natural Science Foundation of China [No. 81973825].

Institutional Review Board Statement

The animal study protocol was approved by Anhui University of Chinese Medicine Laboratory Animal Ethics Commission permission (AHUCM-mouse-2020027).

Informed Consent Statement

Not applicable.

Data Availability Statement

No data available.

Conflicts of Interest

The authors declare no conflict of interest.

Sample Availability

Samples of the compounds are not available from authors.

References

  1. Chinese Pharmacopoeia Commission. Pharmacopoeia of the People’s Republic of China, 2015th ed.; Chinese Medical Science and Technology Press: Beijing, China, 2015; pp. 538–539. [Google Scholar]
  2. Qiao, X.; Li, R.; Miao, W.; Liu, J.; Chen, H.; Guo, D.; Ye, M. A targeted strategy to analyze untargeted mass spectral data: Rapid chemical profiling of Scutellaria baicalensis using ultra-high performance liquid chromatography coupled with hybrid quadrupole orbitrap mass spectrometry and key ion filtering. J. Chromatogr. A 2016, 1441, 83–95. [Google Scholar] [CrossRef] [PubMed]
  3. Shang, Z.; Xu, L.; Xiao, Y.; Du, W.; An, R.; Ye, M.; Qiao, X. A global profiling strategy using comprehensive two-dimensional liquid chromatography coupled with dual-mass spectrometry platforms: Chemical analysis of a multi-herb Chinese medicine formula as a case study. J. Chromatogr. A 2021, 1642, 462021. [Google Scholar] [CrossRef] [PubMed]
  4. Liang, J.; Wu, W.Y.; Sun, G.X.; Wang, D.D.; Hou, J.J.; Yang, W.Z.; Jiang, B.H.; Liu, X.; Guo, D.A. A dynamic multiple reaction monitoring method for the multiple components quantification of complex traditional Chinese medicine preparations: Niuhuang Shangqing pill as an example. J. Chromatogr. A 2013, 1294, 58–69. [Google Scholar] [CrossRef]
  5. Shang, Z.; Xu, L.; Kuang, Y.; Lin, Y.; Liu, S.; Sun, L.; Bo, T.; Ye, M.; Qiao, X. Simultaneous determination of 35 constituents and elucidation of effective constituents in a multi-herb Chinese medicine formula Xiaoer-Feire-Kechuan. J. Pharm. Anal. 2021, 11, 717–725. [Google Scholar] [CrossRef] [PubMed]
  6. Wang, Y.; Zhang, B.; Zhang, J.; Tian, X.; Sun, D.; Li, Q.; Wang, R. Qualitative and quantitative analysis of Yifei Tongluo granules to identify main bioactive components using LC–DAD/MS and pharmacokinetic studies. J. Pharm. Biomed. Anal. 2019, 163, 130–136. [Google Scholar] [CrossRef] [PubMed]
  7. Bandmann, O.; Weiss, K.; Kaler, S. Wilson’s disease and other neurological copper disorders. Lancet Neurol. 2015, 14, 103–113. [Google Scholar] [CrossRef] [PubMed] [Green Version]
  8. Zhang, Y.; Li, L.; Hao, C. Literature study on Gandouling tablet, a special preparation of Xin’an for the treatment of hepatolenticular degeneration. Chin. J. Exp. Tradit. Med. Formul. 2022, Unpublished work.
  9. Xu, L.; Cai, Y.; Jiang, H.; Wang, Y.; Han, H.; Hou, Z.; Ma, S.; Xu, M. Treatment of Wilson’s Disease with Intermingled Phlegm and Blood Stasis Syndrome by Gandouling Tablet. Chin. J. Exp. Tradit. Med. Form. 2017, 23, 173–177. [Google Scholar]
  10. Wang, Y.; Bao, Y.; Sun, M.; Yang, W.; Han, H.; Fang, X.; Zhang, J.; Xu, Z. Study of Gandouling interves wilson disease cognitive dysfunction in rats and the nerve cells apotosis of hippocampus. Chin. J. Clin. Pharmacol. 2015, 31, 2333–2336. [Google Scholar]
  11. Mei, Y.; Wei, L.; Tan, M.; Wang, C.; Zou, L.; Chen, J.; Cai, Z.; Yin, S.; Zhang, F.; Shan, C.; et al. Qualitative and quantitative analysis of the major constituents in Spatholobi Caulis by UFLC-Triple TOF-MS/MS and UFLC-QTRAP-MS/MS. J. Pharm. Biomed. Anal. 2020, 194, 113803. [Google Scholar] [CrossRef] [PubMed]
  12. Yao, M.; Li, J.; He, M.; Ouyang, H.; Ruan, L.; Huang, X.; Rao, Y.; Yang, S.; Zhou, X.; Bai, J. Investigation and identification of the multiple components of Rheum officinale Baill. Using ultra-high performance liquid chromatography coupled with quadrupole-time-of-flight tandem mass spectrometry and data mining strategy. J. Sep. Sci. 2021, 44, 681–690. [Google Scholar] [CrossRef] [PubMed]
  13. Qiao, X.; Wang, Q.; Song, W.; Qian, Y.; Xiao, Y.; An, R.; Guo, D.-A.; Ye, M. A chemical profiling solution for Chinese medicine formulae using comprehensive and loop-based multiple heart-cutting two-dimensional liquid chromatography coupled with quadrupole time-of-flight mass spectrometry. J. Chromatogr. A 2016, 1438, 198–204. [Google Scholar] [CrossRef] [PubMed]
  14. Tian, P.-P.; Zhang, X.-X.; Wang, H.-P.; Li, P.-L.; Liu, Y.-X.; Li, S.-J. Rapid Analysis of Components in Coptis chinensis Franch by Ultra-Performance Liquid Chromatography with Quadrupole Time-of-Flight Mass Spectrometry. Pharmacogn. Mag. 2017, 13, 175–179. [Google Scholar] [CrossRef] [PubMed]
  15. Hao, M.; Ji, D.; Li, L.; Su, L.; Zhang, J.; Wang, Q.; Gu, W.; Jiang, C.; Lu, T.; Mao, C. Metabolic Profiling Analysis of Three Processed Rhizomes of Curcuma wenyujin Y.H. Chen et C. Ling by Ultra-performance Liquid Chromatography/Time-of-Flight Mass Spectrometry. Pharmacogn. Mag. 2019, 15, 164–171. [Google Scholar]
  16. Chen, L.; Wang, S.; Qin, X.; Meng, M. Qualitative and Quantitative Analysis of Active Components of Copditis Rhizoma in Gandouling Pills by HPLC. Chin. J. Infor. TCM 2018, 25, 87–89. [Google Scholar]
  17. Sun, W.; Tong, L.; Miao, J.; Huang, J.; Li, D.; Li, Y.; Xiao, H.; Sun, H.; Bi, K. Separation and analysis of phenolic acids from Salvia miltiorrhiza and its related preparations by off-line two-dimensional hydrophilic interaction chromatography × reversed-phase liquid chromatography coupled with ion trap time-of-flight mass spectrometry. J. Chromatogr. A 2016, 1431, 79–88. [Google Scholar] [CrossRef] [PubMed]
  18. Jaiswal, Y.; Liang, Z.; Ho, A.; Chen, H.; Zhao, Z. Tissue-Specific Metabolite Profiling of Turmeric by Using Laser Microdissection, Ultra-High Performance Liquid Chromatography-Quadrupole Time of Fight-Mass Spectrometry and Liquid Chromatography-Tandem Mass Spectrometry. Eur. J. Mass Spectrom. 2014, 20, 383–393. [Google Scholar] [CrossRef] [PubMed]
  19. Xie, W.; Zhang, H.; Zeng, J.; Chen, H.; Zhao, Z.; Liang, Z. Tissues-based chemical profiling and semi-quantitative analysis of bioactive components in the root of Salvia miltiorrhiza Bunge by using laser microdissection system combined with UPLC-q-TOF-MS. Chem. Cent. J. 2016, 10, 42. [Google Scholar] [CrossRef] [PubMed]
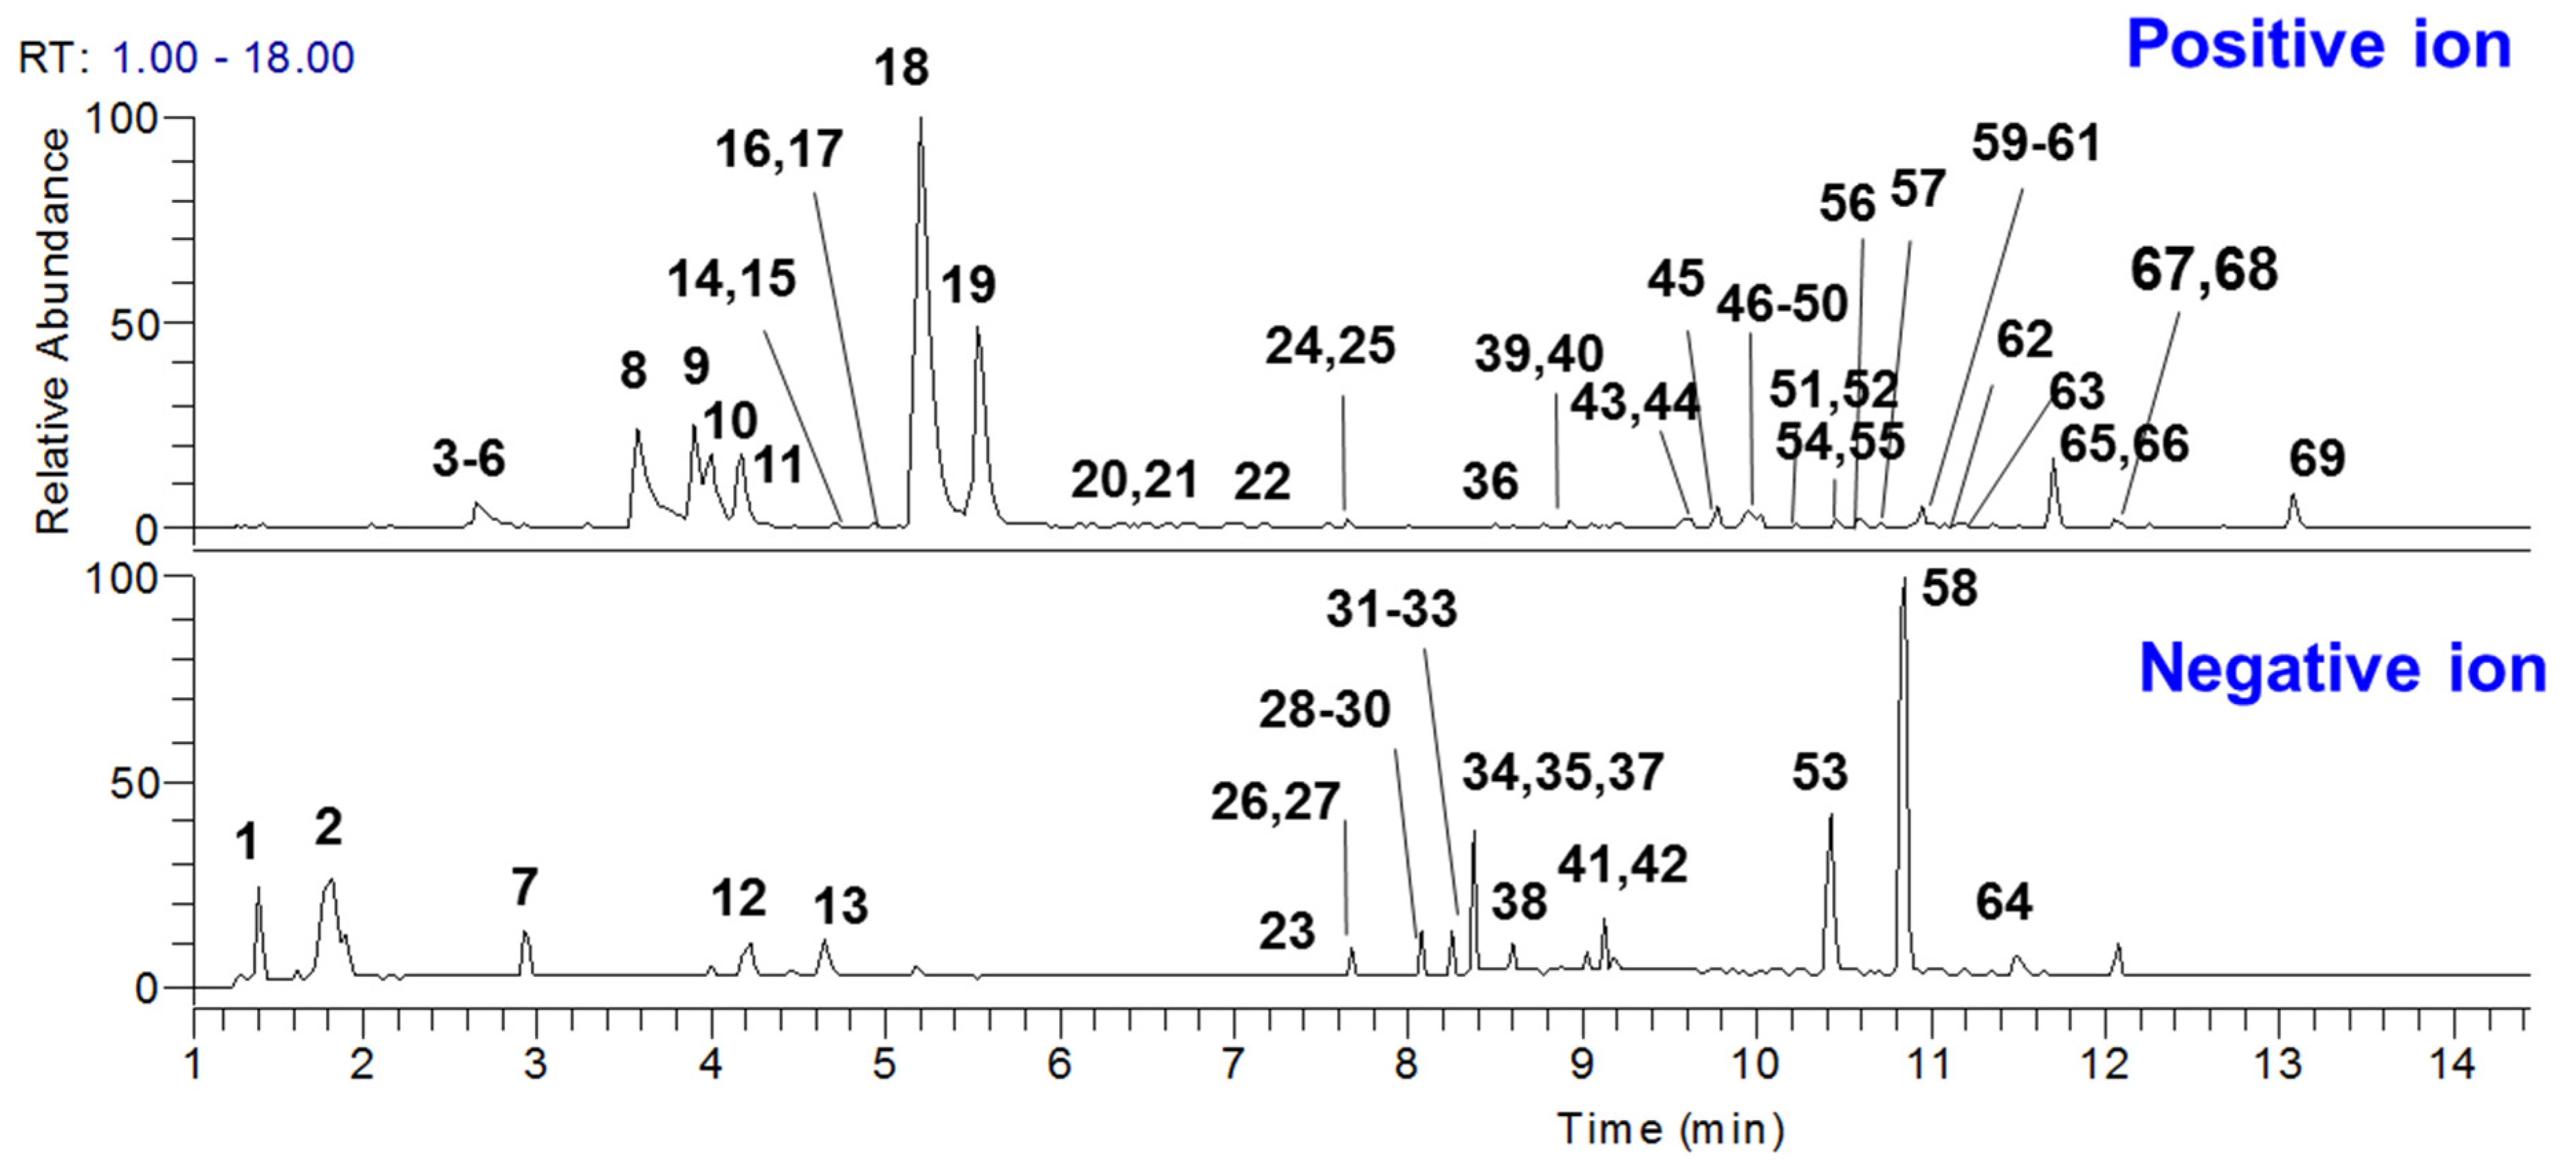
Figure 1. The LC/MS chromatograms of GDL Pill.
Molecules 27 08247 g001
Figure 2. The MS/MS spectra of representative compounds identified in GDL Pill. (A) for alkaloids, (B) for organic acids, (C) for phenolic compounds, and (D) for tanshinones.
Molecules 27 08247 g002
Figure 3. The t-SIM chromatograms of rat plasms after oral administration of GDL Pill.
Molecules 27 08247 g003
Figure 4. The LC/UV chromatograms of GDL Pill and mixed standards (270 nm).
Molecules 27 08247 g004
Figure 5. The contents of 10 potential bioactive components in GDL Pill (n = 6).
Molecules 27 08247 g005
Figure 6. Structures of 17 reference compounds used in this study.
Molecules 27 08247 g006
Table 1. Characterization of chemical constituents in GDL Pill by HRMS/MS data.
PeaktRFormulaMeasured [M − H]/[M + H]+ (m/z)Error (ppm)Ion ModeMS/MS FragmentsSourceIdentificationTypePlasma
1 *1.53C30H25O12577.13892.4407.0789, 289.0739, 125.0251JXTprocyanidin B2 [11]phenolic
2 *1.88C15H13O6289.07351.3245.0831, 203.0724, 109.0300DH(+)-catechin [12]phenolic
32.62C19H18NO4324.12350.7+309.0989HLdemethyleneberberine [13]alkaloid+
42.65C19H16NO4322.10771.3+307.0838, 294.1135, 279.0910HLthalifendine or groenlandicine [13]alkaloid+
5 *2.68C15H13O6289.07362.3245.0830, 203.0725, 109.0300JXTepicatechin [11]phenolic
62.76C19H18NO4324.12310.3+309.0989HLdemethyleneberberine/isomer [13]alkaloid
72.90C17H19O9367.10533.2193.0515, 134.0380HL5-O-feruloylquinic acid [14]organic acid
8 *3.56C19H14NO4320.09211.4+292.0968, 236.8748HLcoptisine [13]alkaloid+
9 *3.89C20H18NO4336.12330.9+320.0908, 308.1270, 292.0979HLepiberberine [13]alkaloid+
10 *4.00C20H20NO4338.13870.7+323.1150, 308.0917, 294.1116HLcolumbamine [13]alkaloid+
11 *4.16C20H20NO4338.13890.9+323.1145, 308.0905, 294.1126HLjatrorrhizine [13]alkaloid+
124.17C17H19O9367.10524.2193.0514, 173.0463HL3-O-feruloylquinic acid [14]organic acid
134.63C17H19O9367.10544.3191.0571, 173.0463HL4-O-feruloylquinic acid [14]organic acid
144.66C36H38NO12676.23981.4+430.4002, 334.1067HLcoptichine-quinic acid conjungate-CO + 2H [13]alkaloid
154.69C20H16NO4334.10781.3+306.1124HLworenine [13]alkaloid
164.91C21H20NO4350.13901.8+334.1051HLworenine + CH2 + 2H [13]alkaloid
175.07C36H38NO12676.23981.4+430.4001, 334.1066HLcoptichine-quinic [13] acid conjungate-CO + 2H # [13]alkaloid
18 *5.18C20H18NO4336.12341.0+321.0989, 292.0956HLberberine [13]alkaloid+
19 *5.51C21H22NO4352.15460.8+337.1306, 322.1067, 308.1273HLpalmatine [13]alkaloid+
206.34C21H20NO4350.13921.5+335.1153, 306.1127HLworenine + CH2 + 2H [13]alkaloid
216.59C30H26NO8528.1666−0.8+334.1072, 319.0836HLdemethylcoptichine/isomer [13]alkaloid
227.17C15H21O2233.15401.8+175.1120EZfuranogermenone [15]ketone
237.48C21H17O11445.08001.8283.0266, 239.0362DHrhein-8-glucoside [12]phenolic
247.64C30H26NO8528.1663−1.5+334.1071, 319.0834HLdemethylcoptichine/isomer [13]alkaloid
257.64C31H28NO9558.17630.9+334.1069, 319.0836HLcoptichine + O [13]alkaloid
267.68C22H21O11461.11181.5313.0581, 169.0150, 147.0458DHrumejaposide D [12]phenolic
277.68C38H17O4537.1077−3.2339.0527, 295.0626, 185.0252DSlithospermic acid [17]organic acid
288.08C22H19O12475.08831.8269.0469DHendocrocin-glucoside [12]phenolic
298.10C38H17O4537.1071−3.6295.0622, 185.0254, 109.0299DSlithospermic acid/isomer [6]organic acid
308.10C26H21O10493.11674.3295.0625, 185.0252, 109.0300DSsalvianolic acid A [17]organic acid
318.24C14H23O15431.1007−2.3268.0391DHaloe-emodin-1-glucoside/isomer [12]phenolic
328.27C26H21O10493.11693.4295.0625, 185.0252, 109.0300DSsalvianolic acid A/isomer [17]organic acid
338.28C14H23O15431.1008−2.4269.0470DHaloe-emodin-1-glucoside/isomer [12]phenolic
34 *8.38C36H29O16717.15044.3339.0526, 321.0421, 295.0629, 109.0301DSsalvianolic acid B [17]organic acid+
358.46C26H19O10491.1012−3.7311.0581, 293.0473, 135.0459DSsalvianolic acid C [17]organic acid
368.51C20H16NO7382.09281.8+318.0754, 190.0499HLdehydro-chilenine [13]alkaloid+
378.51C22H19O11459.09593.2266.0597, 253.0519DH2-carboxyl chrysophanol-glc I [12]phenolic
388.84C24H21O13517.10142.6269.0470DHmalonyl-emodin-glucoside [12]phenolic
398.92C15H19O3247.13300.8+139.0391, 123.0443EZzederone/isomer [15]ketone
408.92C15H23O2235.16972.2+189.1637, 177.1275EZcurcumenone/isomer [15]ketone
41 *9.24C15H9O5269.04704.3240.0440DHaloe-emodin [12]phenolic
429.27C18H13O8357.06362.3225.0569, 181.0670, 121.0301DSsalvianic acid C [17]organic acid+
439.78C15H23O217.15880.6+161.0957EZfuranodiene/isomer [15]ketone
449.78C15H23O2235.16951.2+177.1272, 161.0959EZcurcumenone/isomer [15]ketone
45 *9.88C19H17O6309.11230.8+225.0910, 147.0441JHbisdemethoxycurcumin [18]phenolic+
469.95C15H23O217.15891.3+161.0964EZfuranodiene/isomer [15]ketone
479.95C15H23O2235.16951.2+189.1639, 161.0963EZCurcumenol [15]ketone
48 *10.00C20H19O6339.12321.7+255.1016, 177.0547, 147.0441JHdemethoxycurcumin [18]phenolic
4910.03C15H19O3247.13300.8+139.0390, 123.0444EZzederone [15]ketone+
5010.03C15H17O2229.12251.2+201.1274, 123.0443EZcurzeone/isomer [15]ketone
51 *10.11C21H21O6369.13381.6+285.1125, 253.0859, 177.0547JHcurcumin [18]phenolic
5210.22C15H25O2237.18521.4+219.1746, 135.1169EZNeocurdione [15]ketone
53 *10.41C15H7O6283.02623.5257.0469, 239.0362DHrhein [12]organic acid+
5410.45C15H25O2237.18521.4+219.1741, 135.1169EZcurdione [15]ketone
5510.45C15H23O219.17461.3+135.1170EZgermacrone/isomer [15]ketone
5610.58C18H15O3279.10201.8+261.0909, 233.0961, 205.1009DSdihydrotanshinone I [19] tanshinone
5710.70C15H17O2229.12261.3+201.1274EZcurzeone/isomer [15]ketone
58 *10.83C15H9O5269.04694.2241.0518, 225.0569DHemodin [12]phenolic+
5910.89C18H17O3281.11740.9+263.1065, 235.1116DSdanshenxinkun B [19]tanshinone
6010.95C15H17O213.12750.9+198.1042, 185.1320EZPyrocurzerenone [15]ketone
6110.95C15H19O2231.13821.4+213.1267, 173.0959, 83.0862EZcurzerenone/isomer [15]ketone
6211.17C15H19O2231.13821.4+213.1279, 83.0860EZcurzerenone/isomer [15]ketone
6311.31C15H19O2231.13831.7+213.1273, 203.1432EZcurzerenone/isomer [15]ketone
64 *11.71C15H9O4253.05193.2225.0568DHchrysophanol [12]phenolic+
6511.75C19H21O3297.14881.0+279.1377, 251.1425DScryptotanshinone [19]tanshinone+
6611.75C18H13O3277.08600.3+249.0904DStanshinone I [19]tanshinone
6712.37C15H23O219.17471.5+135.1167EZgermacrone/isomer [15]ketone
6812.43C19H17O3293.11740.8+275.1057, 247.1114DS1,2 -didehydrotanshinone IIA [19]tanshinone
6913.08C19H19O3295.13321.4+277.1221, 249.1268DStanshinone IIA [19]tanshinone+
JXT: Ji-Xue-Teng, Spatholobi Caulis; DH: Da-Huang, Rhei Radix ET Rhizoma; HL: Huang-Lian, Coptidis Rhizoma; DS: Dan-Shen, Salviae Miltiorrhizae Radix ET Rhizoma; EZ: E-Zhu, Curcumae Rhizoma; JH: Jiang-Huang, Curcumae Longae Rhizoma; * confirmed by reference standard.
Table 2. Method validation results for quantitative analysis of 10 compounds in GDL Pill.
AnalytesRegression Equationsr2Linear Range (μg/mL)PreciousRepeatability (n = 6)Stability (n = 6)Recovery (n = 6)
Intra-Day (n = 6)Inter-Day (n = 3)Spiked (μg)Found (μg)Recovery (%)RSD (%)
coptisine (8)y = 184,80x − 1005.90.99991.56–25.00.12 0.52 1.77 0.60 2.43 2.50 97.06 1.24
epiberberine (9)y = 16,328x − 2759.60.99921.56–25.00.45 0.59 4.26 4.41 2.45 2.50 97.82 1.26
columbamine (10)y = 17,745x + 14400.99951.56–25.00.42 0.43 2.48 4.05 2.41 2.50 96.37 1.34
jateorhizine (11)y = 25,348x + 37,9110.99731.56–25.01.03 1.96 3.57 2.01 2.59 2.50 103.43 1.69
berberine (18)y = 18,120x − 1359.40.99953.13–50.00.29 0.79 3.22 2.24 4.74 5.00 94.84 2.24
palmatine (19)y = 20,530x + 39,8661.00001.56–25.01.62 1.33 3.34 2.33 2.66 2.50 106.21 1.70
aloe-emodin (41)y = 10,137x + 1241.40.99960.78–12.50.22 0.81 3.13 3.90 1.24 1.25 98.96 1.14
rhein (53)y = 14,615x + 3046.50.99930.78–12.50.32 1.63 1.07 1.22 1.21 1.25 96.58 0.99
emodin (58)y = 17,564x + 889.70.99990.78–12.50.34 0.61 0.99 1.45 1.23 1.25 98.04 1.81
chrysophanol (64)y = 11,515x + 1484.20.99970.78–12.50.74 0.600.42 0.45 1.23 1.25 98.62 4.81
Publisher’s Note: MDPI stays neutral with regard to jurisdictional claims in published maps and institutional affiliations.