
Structures Controlled by Entropy: The Flexibility of Strychnine as Example

Abstract
1. Introduction
2. Methods
2.1. MDOC Simulations
2.2. ab Initio Calculations
3. Results
3.1. NMR Data
3.2. MDOC Simulated NMR Data
3.3. Conformational Analysis
4. Conclusions
Supplementary Materials
Author Contributions
Funding
Institutional Review Board Statement
Informed Consent Statement
Data Availability Statement
Acknowledgments
Conflicts of Interest
References
- Karplus, M.; Kuriyan, J. Molecular dynamics and protein function. Proc. Natl. Acad. Sci. USA 2005, 102, 6685. [Google Scholar] [CrossRef]
- Mobley, D.L.; Dill, K.A. Binding of Small-Molecule Ligands to Proteins: ‘‘What You See’’ Is Not Always ‘‘What You Get’’. Structure 2009, 17, 489–498. [Google Scholar] [CrossRef] [PubMed]
- De Simone, A.; Richter, B.; Salvatella, X.; Vendruscolo, M. Toward an accurate determination of free energy landscapes in solution states of proteins. J. Am. Chem. Soc. 2009, 131, 3810–3811. [Google Scholar] [CrossRef] [PubMed][Green Version]
- De Simone, A.; Montalvao, R.W.; Dobson, C.M.; Vendruscolo, M. Characterization of the Interdomain Motions in Hen Lysozyme Using Residual Dipolar Couplings as Replica-Averaged Structural Restraints in Molecular Dynamics Simulations. Biochemistry 2013, 52, 6480–6486. [Google Scholar] [CrossRef]
- Sternberg, U.; Witter, R.; Ulrich, A.S. All-atom molecular dynamics simulations using orientational constraints from anisotropic NMR samples. J. Biomol. NMR 2007, 38, 23–39. [Google Scholar] [CrossRef] [PubMed]
- Luy, B.; Kobzar, K.; Knör, S.; Furrer, J.; Heckmann, D.; Kessler, H. Orientational Properties of Stretched Polystyrene Gels in Organic Solvents and the Suppression of Their Residual 1H NMR Signals. J. Am. Chem. Soc. 2005, 127, 6459–6465. [Google Scholar] [CrossRef] [PubMed]
- Snider, J.D.; Troche-Pesqueira, E.; Woodruff, S.R.; Gayathri, C.; Tsarevskyb, N.V.; Gil, R.R. New strategy for RDC-assisted diastereotopic proton assignment using a combination of J-scaled BIRD HSQC and J-scaled BIRD HMQC/HSQC. Magn. Reson. Chem. 2012, 50, S86–S91. [Google Scholar] [CrossRef]
- Glover, S.S.B.; Gould, R.O.; Walkinshaw, M.D. Structures of Strychnine (I), C21H22N2O2, and a Solvate of Brucine (II), C23H26N2O4.C2H6O.2H2O. Acta Cryst. 1985, C41, 990–994. [Google Scholar] [CrossRef]
- Navarro-Vázquez, A. MSpin-RDC. A program for the use of residual dipolar couplings for structure elucidation of small molecules. Magn. Reason. Chem. 2012, 50, S73–S79. [Google Scholar] [CrossRef]
- Zweckstetter, M.; Bax, A. Prediction of Sterically Induced Alignment in a Dilute Liquid Crystalline Phase: Aid to Protein Structure Determination by NMR. J. Am. Chem. Soc. 2000, 122, 3791–3792. [Google Scholar] [CrossRef]
- Butts, C.P.; Jones, C.R.; Harvey, J.N. High precision NOEs as a probe for low level conformers—A second conformation of strychnine. Chem. Commun. 2011, 47, 1193–1195. [Google Scholar] [CrossRef] [PubMed]
- Schmidt, M.; Reinscheid, F.; Sun, H.; Abromeit, H.; Scriba, G.K.E.; Sönnichsen, F.D.; John, M.; Reinscheid, U.M. Hidden flexibility of strychnine. Eur. J. Org. Chem. 2014, 6, 1147–1150. [Google Scholar] [CrossRef]
- Kolmer, A.; Edwards, L.J.; Kuprov, I.; Thiele, C.M. Conformational analysis of small organic molecules using NOE and RDC data: A discussion of strychnine and a-methylene-c-butyrolactone. J. Magn. Reson. 2015, 261, 101–109. [Google Scholar] [CrossRef] [PubMed]
- Butts, C.P.; Jones, C.R.; Towers, E.C.; Flynn, J.L.; Appleby, L.; Barron, N.J. Interproton distance determinations by NOE—Surprising accuracy and precision in a rigid organic molecule. Org. Biomol. Chem. 2011, 9, 177. [Google Scholar] [CrossRef] [PubMed]
- Khodov, I.A.; Kiselev, M.G.; Efimov, S.V.; Klochkov, V.V. Comment on ‘Conformational analysis of small organic molecules using NOE and RDC data: A discussion of strychnine and a-methylene-c-butyrolactone’. J. Magn. Reson. 2016, 266, 67–68. [Google Scholar] [CrossRef]
- Tomba, G.; Camilloni, C.; Vendruscolo, M. Determination of the conformational states of strychnine in solution using NMR residual dipolar couplings in a tensor-free approach. Methods 2018, 148, 4–8. [Google Scholar] [CrossRef]
- Kobchikova, P.; Efimov, S.; Khodov, I.; Klochkov, V. Features of spatial structures of cyclosporins D, E and G revealed by NMR and MD simulations. J. Mol. Liq. 2021, 336, 116244. [Google Scholar] [CrossRef]
- Efimov, S.V.; Dubinin, M.V.; Kobchikova, P.P.; Zgadzay, Y.O.; Khodov, L.A.; Belosludtsev, K.N.; Klochkov, V.V. Comparison of cyclosporin variants BeE based on their structural properties and activity in mitochondrial membranes. Biochem. Biophys. Res. Commun. 2020, 526, 1054–1060. [Google Scholar] [CrossRef] [PubMed]
- Khodov, I.; Dyshin, A.; Efimov, S.; Ivlev, D.; Kiselev, M. High-pressure NMR spectroscopy in studies of the conformational composition of small molecules of ibuprofen in supercritical carbon dioxide. J. Mol. Liq. 2020, 309, 113113. [Google Scholar] [CrossRef]
- Grasnick, D.; Sternberg, U.; Strandberg, E.; Wadhwani, P.; Ulrich, A.S. Irregular structure of the HIV fusion peptide in membranes demonstrated by solid-state NMR and MD simulations. Eur. Biophys. J. 2011, 40, 529–543. [Google Scholar] [CrossRef]
- Sternberg, U.; Witter, R. Molecular dynamics simulations on PGLa using NMR orientational constraints. J. Biomol. NMR 2015, 63, 265–274. [Google Scholar] [CrossRef]
- Tzvetkova, P.; Sternberg, U.; Gloge, T.; Navarro-Vázquez, A.; Luy, B. Configuration Determination by Residual Dipolar Couplings: Accessing the Full Conformational Space by Molecular Dynamics with Tensorial Constraints. Chem. Sci. 2019, 10, 8774–8791. [Google Scholar] [CrossRef] [PubMed]
- Di Pietro, M.E.; Sternberg, U.; Luy, B. Molecular Dynamics with Orientational Tensorial Constraints: A New Approach to Probe the Torsional Angle Distributions of Small Rotationally Flexible Molecules. J. Phys. Chem. B 2019, 123, 8480–8491. [Google Scholar] [CrossRef] [PubMed]
- Farès, C.; Lingnau, J.B.; Wirtz, C.; Sternberg, U. Conformational Investigations in Flexible Molecules using Orientational NMR Constraints in Combination with 3J-Couplings and NOE Distances. Molecules 2019, 24, 4417. [Google Scholar] [CrossRef] [PubMed]
- Sternberg, U.; Klipfel, M.; Grage, S.L.; Witter, R.; Ulrich, A.S. Calculation of Fluorine Chemical Shift Tensors for the Interpretation of Oriented 19F-NMR Spectra of Gramicidin A in Membranes. Phys. Chem. Chem. Phys. 2009, 11, 7048–7060. [Google Scholar] [CrossRef]
- Möllhoff, U.; Sternberg, U. Molecular mechanics with fluctuating atomic charges—A new force field with a semi-empirical charge calculation. J. Mol. Model. 2001, 7, 90–102. [Google Scholar] [CrossRef]
- Sternberg, U.; Koch, F.T.; Brauer, M.; Kunert, M.; Anders, E. Molecular mechanics for zinc complexes with fluctuating atomic charges. J. Mol. Model. 2001, 7, 54–64. [Google Scholar] [CrossRef]
- Sternberg, U.; Koch, F.-T.; Möllhoff, M. New Approach to the Semiempirical Calculation of Atomic Charges for Polypeptides and Large Molecular-Systems. J. Comput. Chem. 1994, 15, 524–531. [Google Scholar] [CrossRef]
- Witter, R.; Mollhoff, M.; Koch, F.T.; Sternberg, U. Fast Atomic Charge Calculation for Implementation into a Polarizable Force Field and Application to an Ion Channel Protein. J. Chem.-Ny 2015, 2015, 908204. [Google Scholar] [CrossRef]
- Sternberg, U.; Tzvetkova, P.; Muhle-Goll, C. The Simulation of NMR Data of Flexible Molecules-Sagittamide A as Example for MD Simulations with Orientational Constraints. Phys. Chem. Chem. Phys. 2020, 22, 17375. [Google Scholar] [CrossRef]
- Haase, F.; Ahlrichs, R. Semi-direct MP2 Gradient Evaluation on Workstation Computers: The MPGRAD Program. J. Comp. Chem. 1993, 14, 907. [Google Scholar] [CrossRef]
- Schäfer, A.; Huber, C.; Ahlrichs, R. Fully Optimized Contracted Gaussian Basis Sets of Triple Zeta Valence Quality for Atoms Li to Kr. J. Chem. Phys. 1994, 100, 5829. [Google Scholar] [CrossRef]
- Weigend, F.; Häser, M.; Patzelt, H.; Ahlrichs, R. RI-MP2: Optimized Auxiliary Basis Sets and Demonstration of Efficiency. Chem. Phys. Lett. 1998, 294, 143. [Google Scholar] [CrossRef]
- Weigend, F.; Häser, M. RI-MP2: First derivatives and global consistency. Theor. Chem. Acc. 1997, 97, 331. [Google Scholar] [CrossRef]
- Ahlrichs, R.; Bär, M.; Häser, M.; Horn, H.; Kölmel, C. Electronic Structure Calculations on Workstation Computers: The Program System TURBOMOLE. Chem. Phys. Lett. 1989, 162, 165. [Google Scholar] [CrossRef]
- Thiele, C.M. Simultaneous Assignment of All Diastereotopic Protons in Strychnine Using RDCs: PELG as Alignment Medium for Organic Molecules. J. Org. Chem. 2004, 69, 7403. [Google Scholar] [CrossRef]
- Kessler, H.; Seip, S. NMR of peptides. In Two-Dimensional NMR Spectroscopy: Applications for Chemists and Biochemists; Croasmun, W.R., Carlson, R.M.K., Eds.; VCH Publishers: New York, NY, USA, 1994; pp. 619–654. [Google Scholar]
- Khodov, I.A.; Nikiforov, M.Y.; Alper, G.A.; Blokhin, D.S.; Efimov, S.V.; Klochkov, V.V.; Georgi, N. Spatial structure of felodipine dissolved in DMSO by 1D NOE and 2D NOESY NMR spectroscopy. J. Mol. Struct. 2013, 1035, 358–362. [Google Scholar] [CrossRef]
- Khodov, I.A.; Efimov, S.V.; Klochkov, V.V.; Batista de Carvalho, L.A.E.; Kiselev, M.G. The importance of suppressing spin diffusion effects in the accurate determination of the spatial structure of a flexible molecule by nuclear Overhauser effect spectroscopy. J. Mol. Struct. 2016, 1106, 373–381. [Google Scholar] [CrossRef]
- Efimov, S.V.; Khodov, I.A.; Ratkova, E.L.; Kiselev, M.G.; Berger, S.; Klochkov, V.V. Detailed NOESY/T-ROESY analysis as an effective method for eliminating spin diffusion from 2D NOE spectra of small flexible molecules. J. Mol. Struct. 2016, 1104, 61–69. [Google Scholar] [CrossRef]
- Bifulco, G.; Riccio, R.; Martin, G.E.; Buevich, A.V.; Williamson, R.T. Quantum chemical calculations of 1JCC coupling constants for the stereochemical determination of organic compounds. Org. Lett. 2013, 15, 654–657. [Google Scholar] [CrossRef]


| Atom A | Atom B | Predicted 3JHH Couplings/Hz | Experimental 3JHH Couplings */Hz | Assignment |
|---|---|---|---|---|
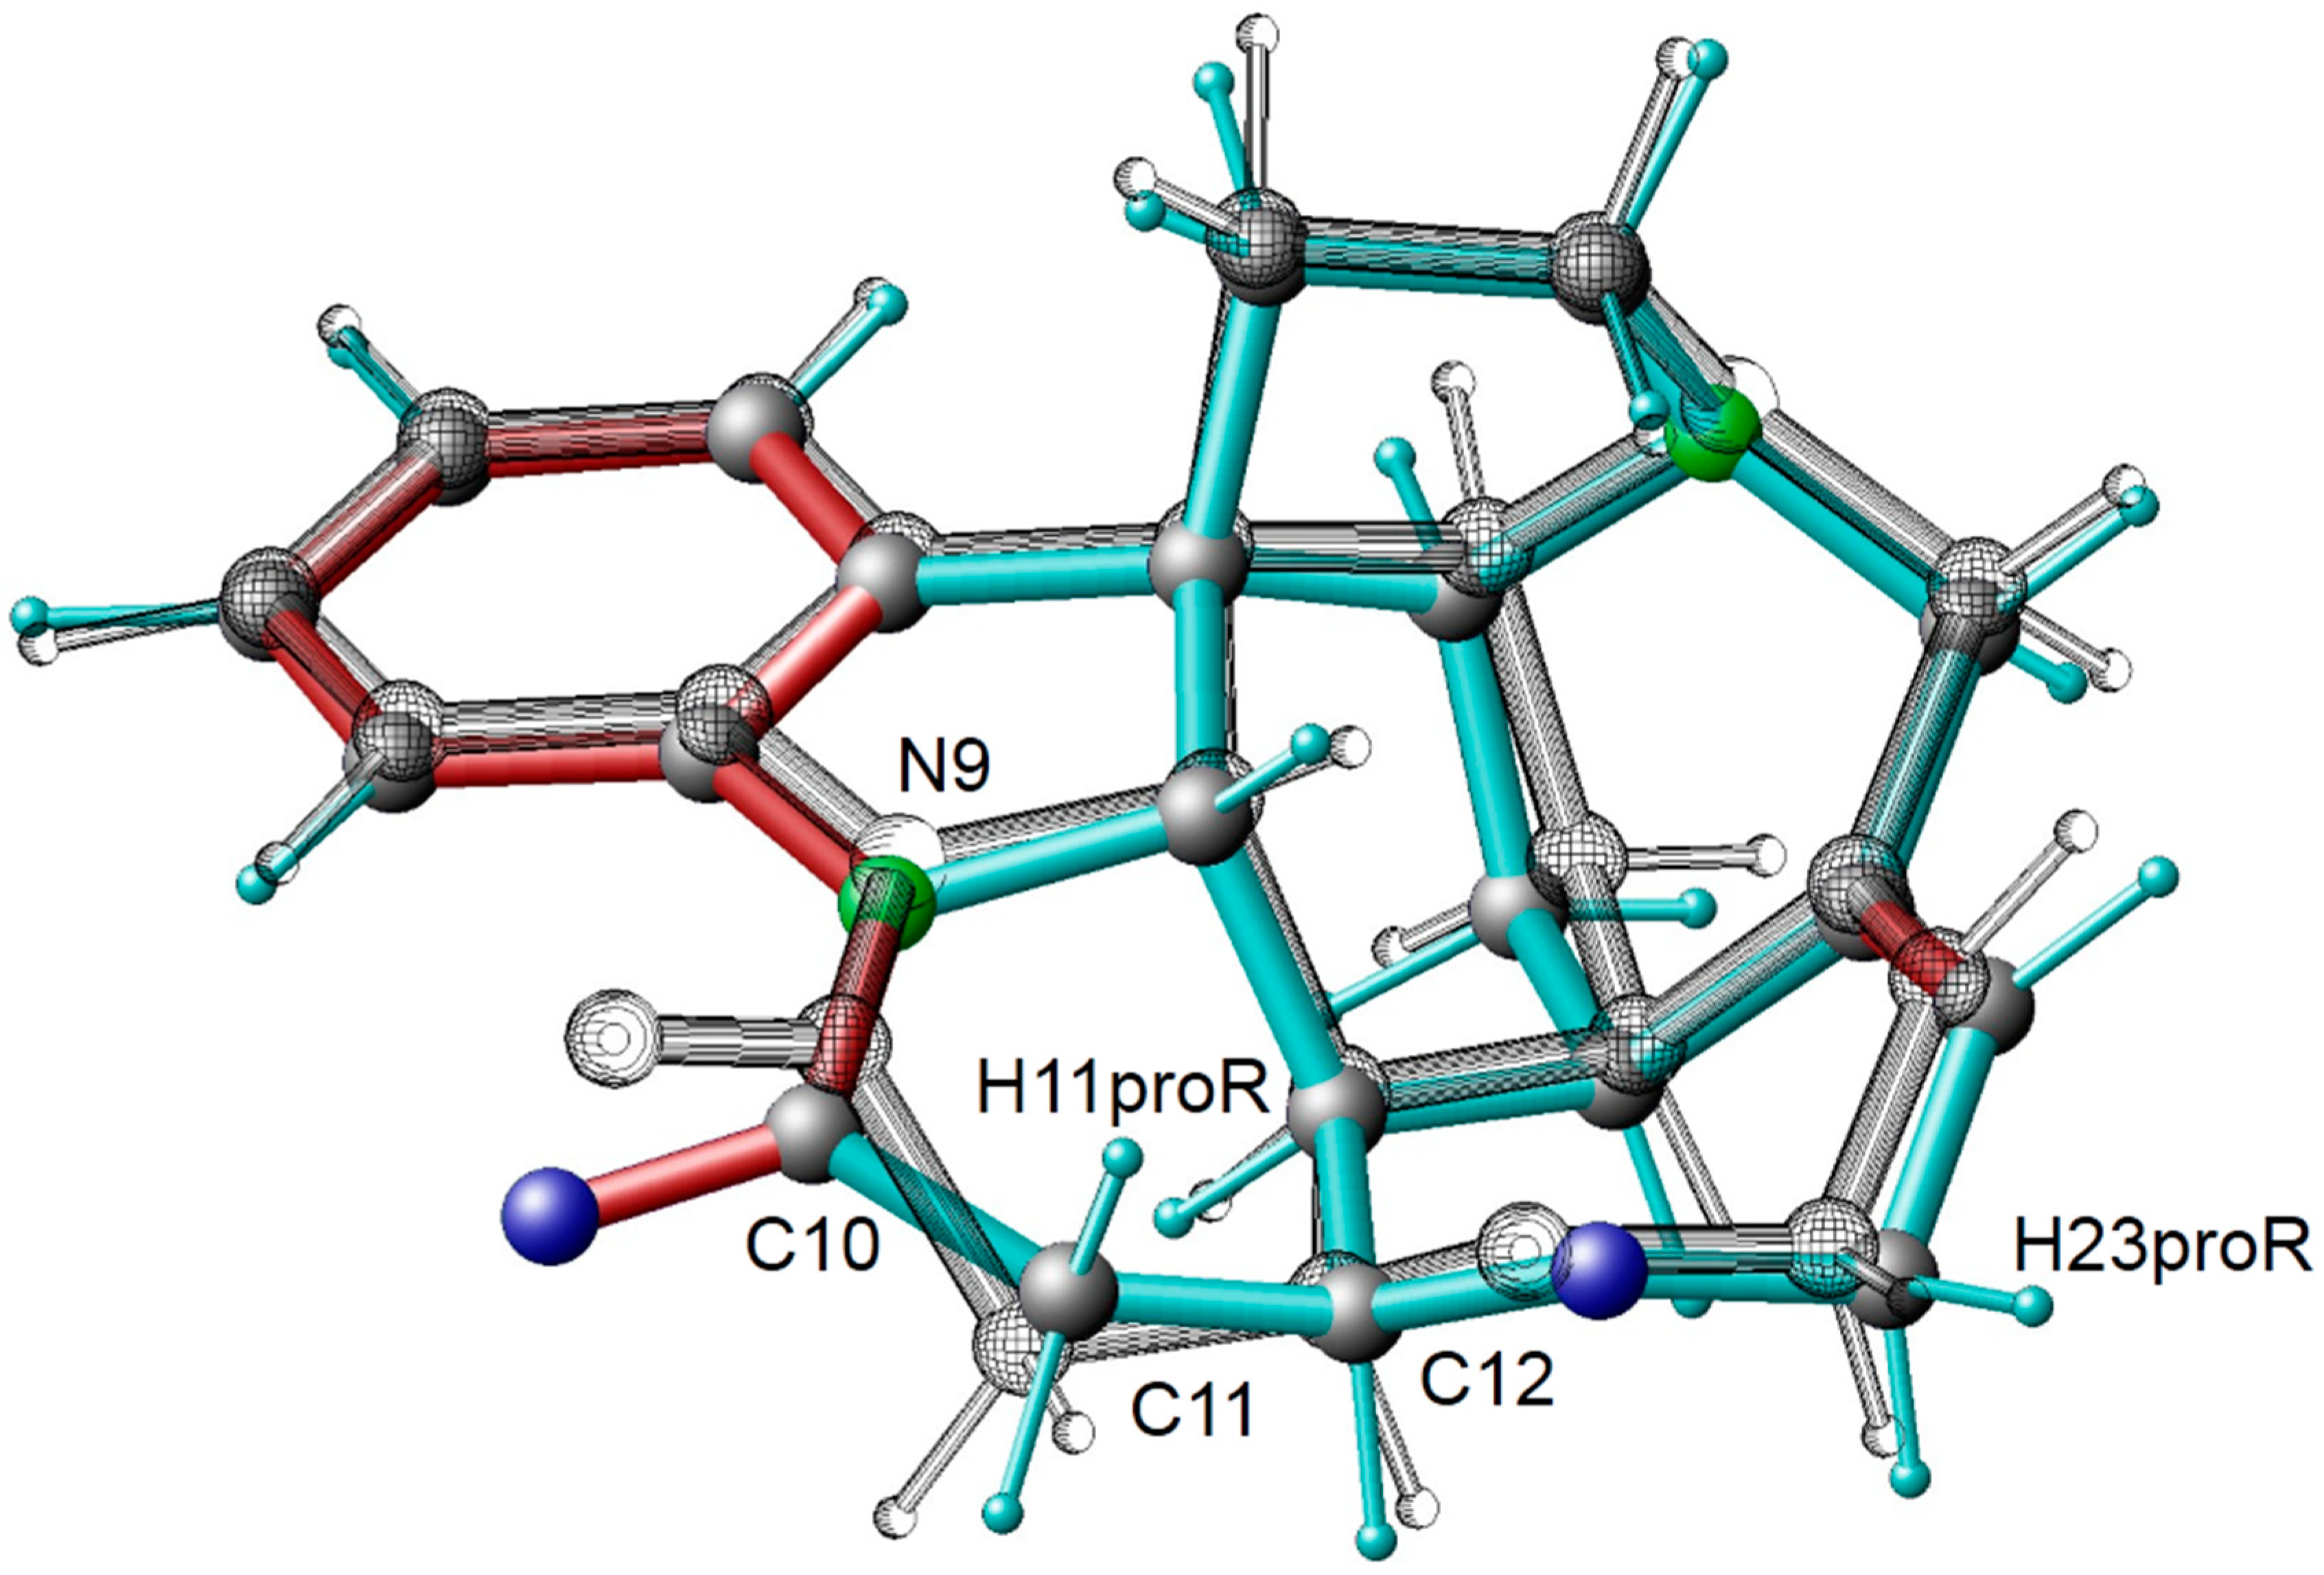
| H18b (pro R) | H17b (pro R) | 4.975 | 10.70 | Assigned to H17a (pro S) |
| H18b (pro R) | H17a (pro S) | 12.148 | 7.20 | Assigned to H17b (pro R) |
| H12 | H11 (pro S) | 7.902 | 3.34 | Assigned to H11b (pro R) |
| H12 | H11b (pro R) | 4.407 | 8.47 | Assigned to H11a (pro S) |
| RDC | NOE Distance | 3JHH | |
|---|---|---|---|
| Number of Constraints n | 22 | 33 | 13 |
| Number of Outliers | 2 | 4 | 0 |
| Min (1/χi)2 | 0.41 | 0.43 | 1.59 |
| Quality (n/χ2) | 2.58 | 2.61 | 5.56 |
| Probability/% | Notation | Ring Structures | Comment |
|---|---|---|---|
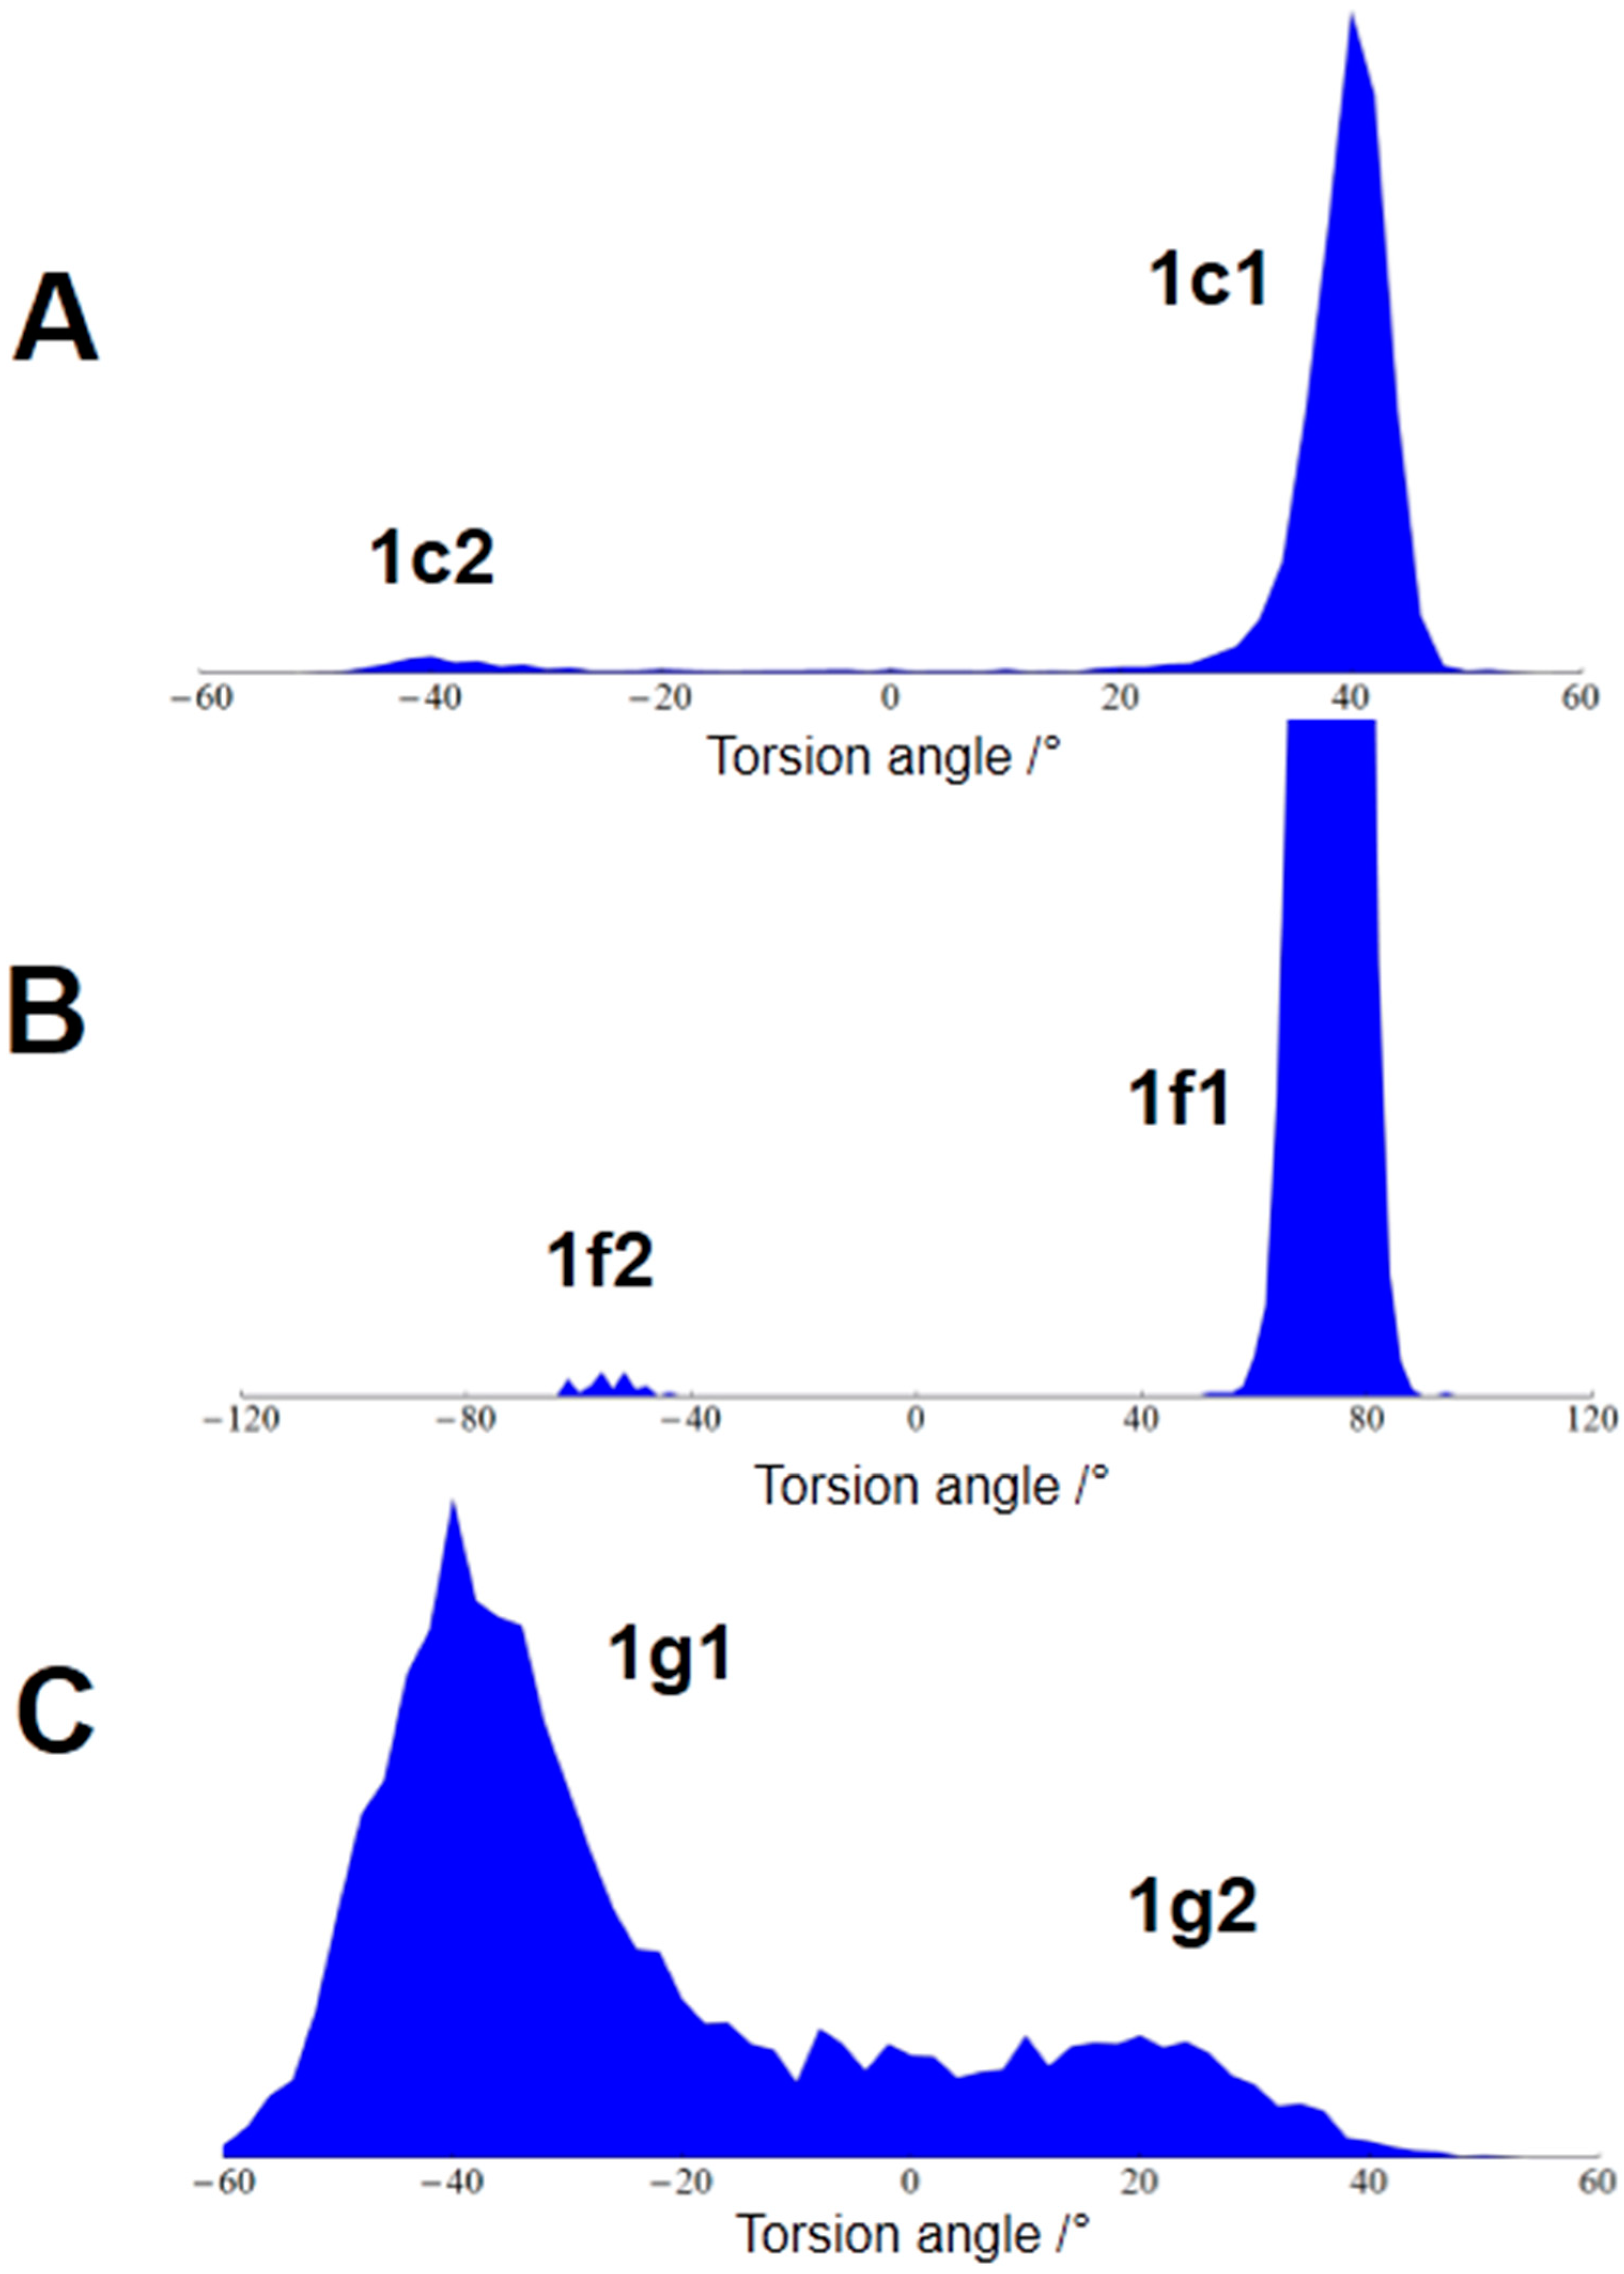
| 76.45 | {+g, +g, -g} | {1c1, 1f1, 1g1} | Start structure |
| 18.49 | {+g, +g, +g} | {1c1, 1f1, 1g2} | G ring flip |
| 3.61 | {-g, +g, -g} | {1c2, 1f1, 1g1} | C ring flip |
| 1.06 | {-g, +g, +g} | {1c2, 1f1, 1g2} | C and G ring flip |
| 0.36 | {+g, -g, -g} | {1c1, 1f2, 1g1} | F ring flip |
| 0.02 | {-g, -g, -g} | {1c2, 1f2, 1g1} | C and F ring flip |
| Model | Torsion Angle C Ring C7-C17-C18-N17 | Torsion Angle F Ring C12-O24-C23-C22 | Torsion Angle G Ring N9-C10-C11-C12 | Conformer |
|---|---|---|---|---|
| MDOC (76%) | 40 | 75 | −40 | {+g, +g, −g} |
| MDOC (18%) | −40 | −50 | 0-50 | {−g, −g, +g} |
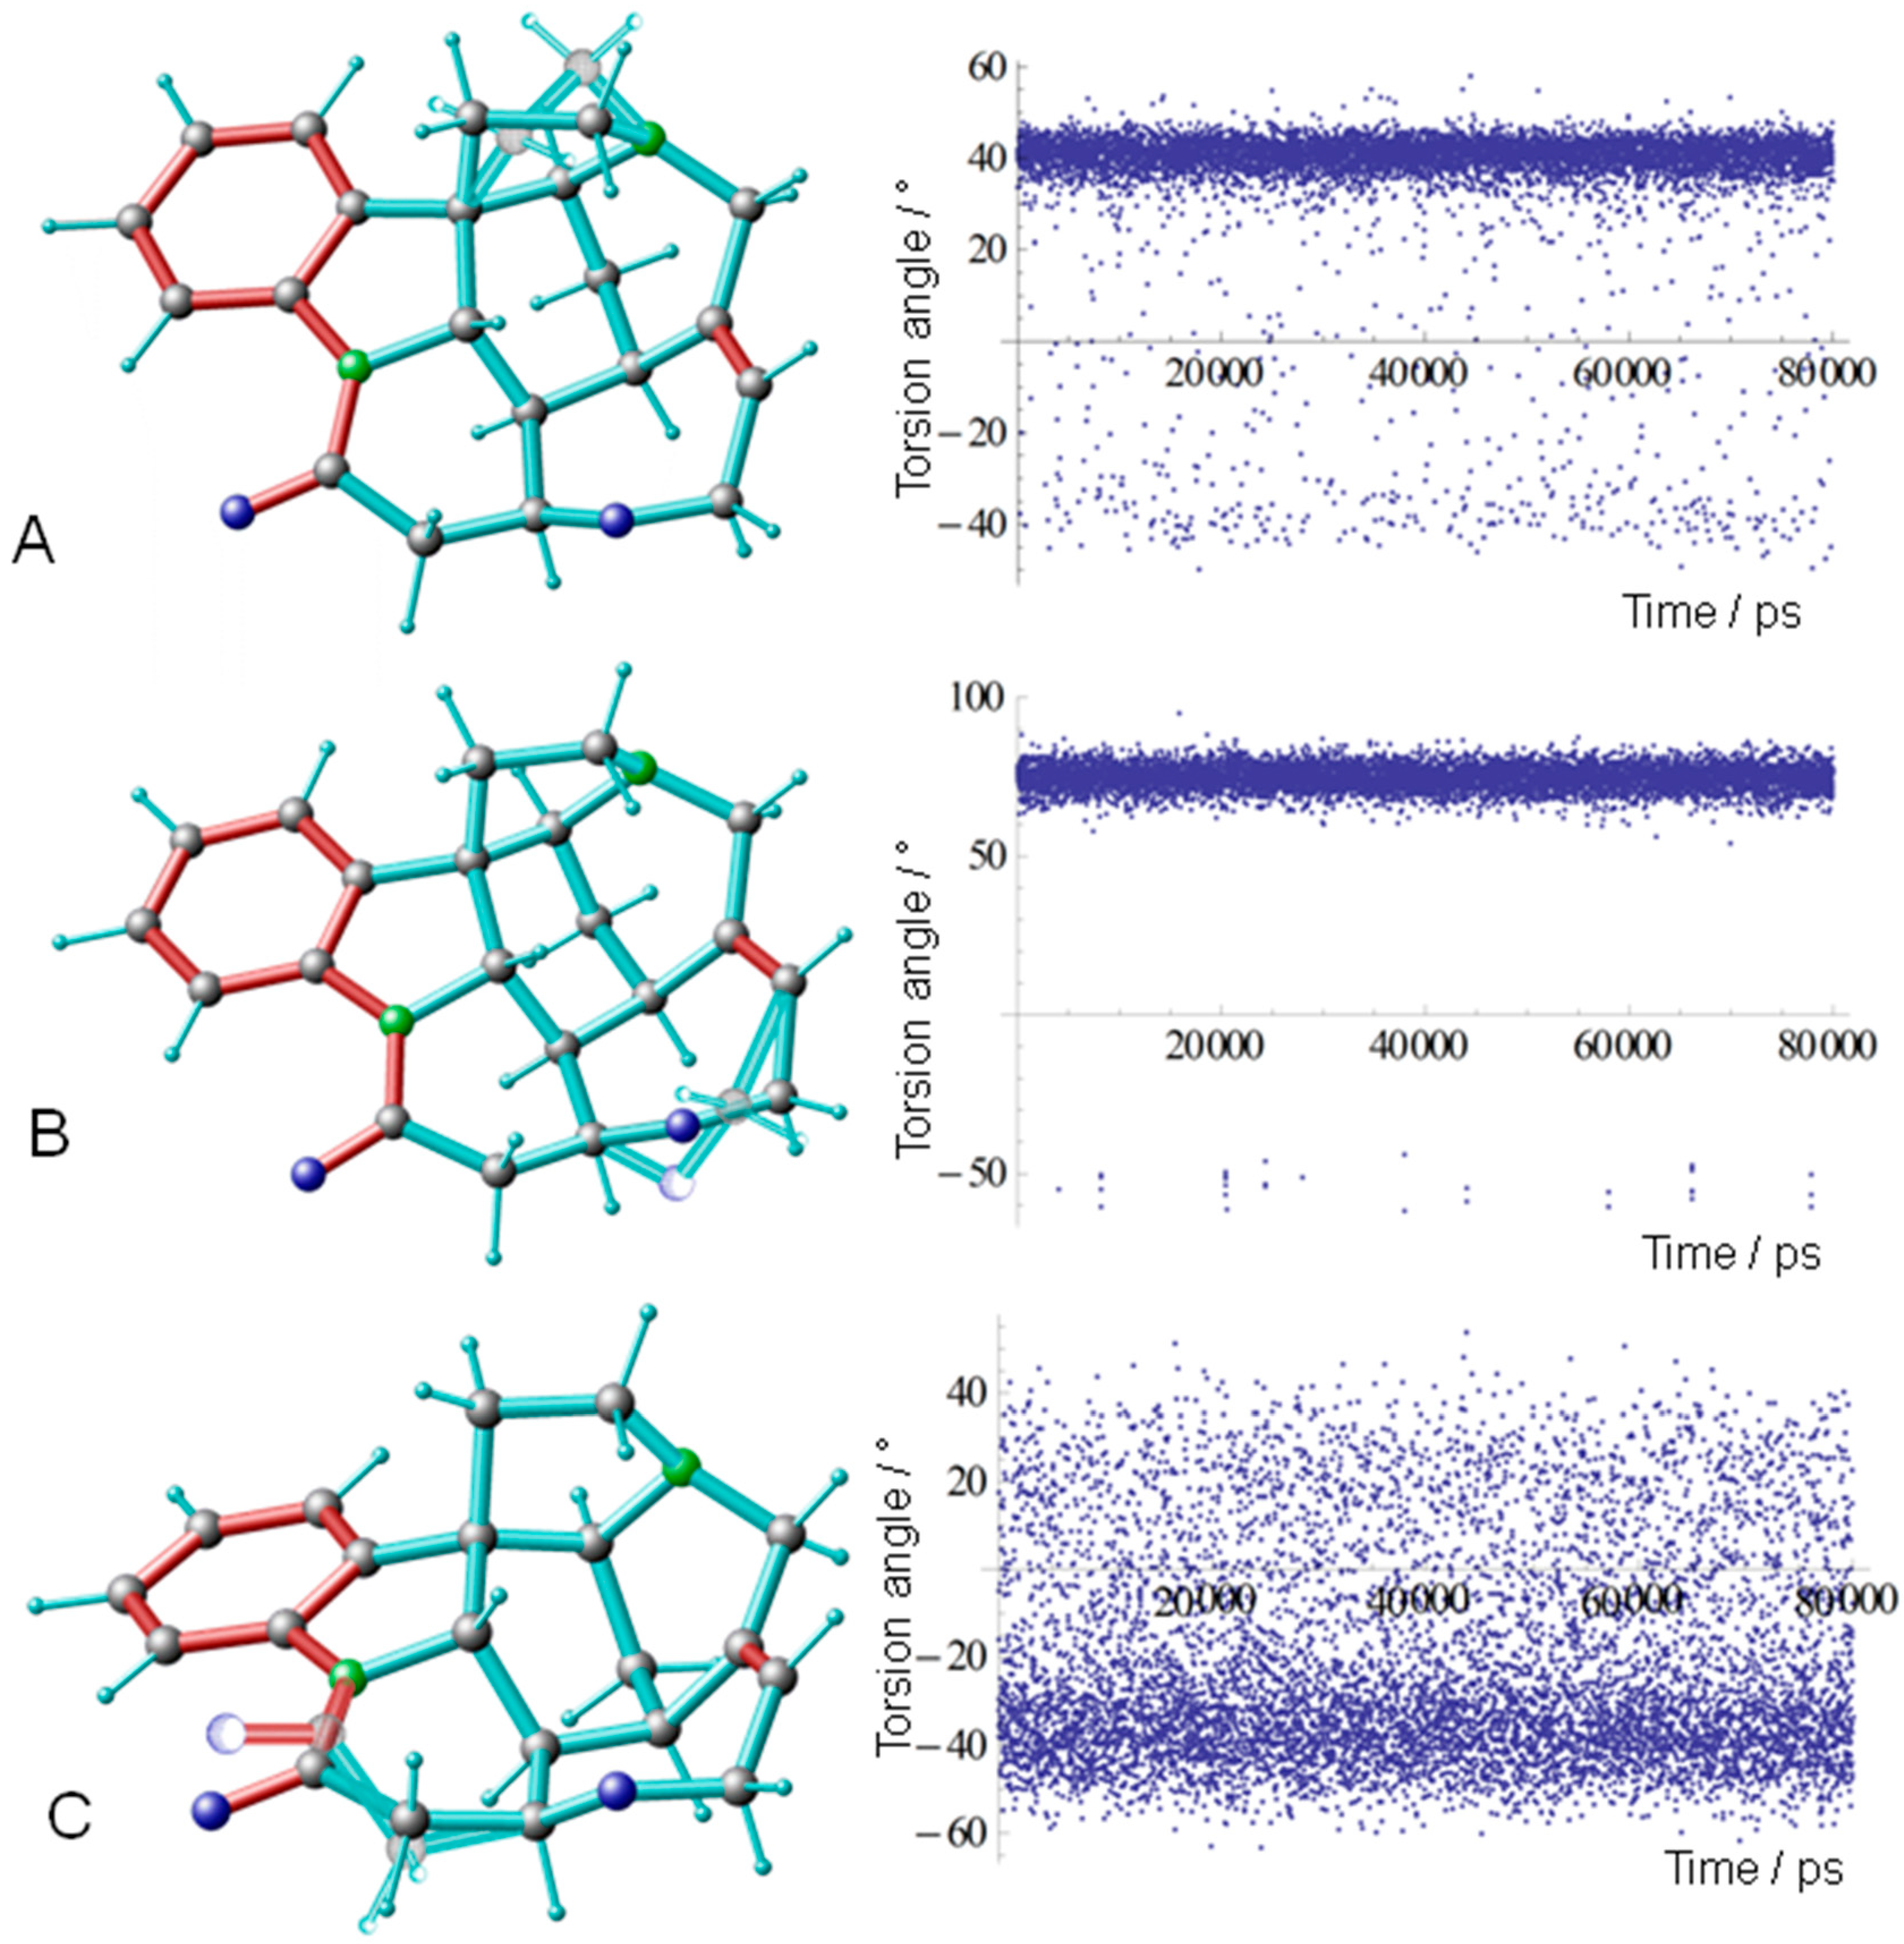
| MD conf. A 1 | 31.22 | 81.71 | −42.27 | {+g, +g, −g} |
| MD conf. B 1 | −24.33 | 74.62 | 5.28 | {−g, +g, +g} |
| MD conf. C 1 | 32.17 | −69.83 | −34.93 | {+g, −g, −g} |
| DFT conf. 1 2 | 35.93 | 87.20 | −39.16 | {+g, +g, −g} |
| DFT conf. 2 2 | 33.06 | −70.28 | −54.59 | {+g, −g, −g} |
| X-ray 3 | 38.20 | 88.20 | −41.74 | {+g, +g, −g} |
Publisher’s Note: MDPI stays neutral with regard to jurisdictional claims in published maps and institutional affiliations. |
© 2022 by the authors. Licensee MDPI, Basel, Switzerland. This article is an open access article distributed under the terms and conditions of the Creative Commons Attribution (CC BY) license (https://creativecommons.org/licenses/by/4.0/).
Share and Cite
Sternberg, U.; Witter, R. Structures Controlled by Entropy: The Flexibility of Strychnine as Example. Molecules 2022, 27, 7987. https://doi.org/10.3390/molecules27227987
Sternberg U, Witter R. Structures Controlled by Entropy: The Flexibility of Strychnine as Example. Molecules. 2022; 27(22):7987. https://doi.org/10.3390/molecules27227987
Chicago/Turabian StyleSternberg, Ulrich, and Raiker Witter. 2022. "Structures Controlled by Entropy: The Flexibility of Strychnine as Example" Molecules 27, no. 22: 7987. https://doi.org/10.3390/molecules27227987
APA StyleSternberg, U., & Witter, R. (2022). Structures Controlled by Entropy: The Flexibility of Strychnine as Example. Molecules, 27(22), 7987. https://doi.org/10.3390/molecules27227987