1. Introduction
Biogas is mostly produced by anaerobic digestion or different types of wastes and its use for domestic purposes, such as heating, e.g., cooking and lighting, was widely known in Asian and African countries [
1]. Thanks to its high methane content (generally 50% to 70%), biogas can substitute natural gas in many applications such as heat and electricity generation for households and industries, biofuel for vehicles, and injection into the gas grid, so production of biogas has augmented in Europe and other countries and is now identified as priority objective by the European Industrial Biomass Initiative (EIBI), the European Energy Research Alliance (EERA), and the Strategic Energy Plan (SET) plan.
Concerns about climate change and the depletion of the available oil and gas reserves prompted a broad discussion on the use of biogas as a clean renewable energy resource, so biogas is more and more playing a key role in many applications being a renewable substitute for natural gas. Countries such as Germany, Sweden, and the UK are pushing strongly with solid support from the industry and national subsidies. Spain is still in its beginnings, with only one industrial biogas production plant located in Valdemingómez, Madrid, but interest and expectations are increasing, based on the initiatives of the Spanish Ministry for Ecologic Transition and Demographic Challenge (MITECO) for publishing a Biogas Roadmap for 2030 and also the interest of waste treatment companies, which see biogas as a profitable outcome from the wastes in addition to reducing waste disposal costs. Moreover, according to a recent study performed by Ecofys [
2], it is possible to scale up renewable gas production between now and 2050 to more than 120 billion cubic meters annually, including both renewable hydrogen and biomethane. This increasing availability of biogas could facilitate multiple applications, such as its use in existing gas infrastructure for the heating of buildings, to produce dispatchable electricity as a complement to wind and solar, and to fuel heavy transport, which could save in all about EUR 140 billion annually by 2050 compared to a future energy system without any gas [
3].
In addition to CH
4 and CO
2, which are the main components of biogas, a large variety of adverse compounds in trace form (sulfur-containing compounds, silicon, halogens, NH
3, siloxanes, mercaptans, etc.), are hampering its wider application [
4]. One of the main contaminants, sulfur, is often present in biogas in the form of H
2S in amounts ranging from a hundred ppm to more than 5%, which makes it necessary to remove it before use [
5].
The use of biogas cleaning technologies are intrinsic to the use of biogas, even in more permissive combustion engines and the most widely used methods include adsorption, absorption, and membrane-based gas separation processes. Among these purification methods, the adsorption process tends to be the most efficient due to its simplicity of design, ease of operation, and insensitivity to toxic substances. However, when defining the cleaning strategy, two main issues have to be taken into account: biogas composition (especially contaminants) and the final use of the biogas. The selection of cleaning strategies will be also determined by the thermal balance of the process, and this is especially important in some applications of biogas.
Different types of sorbents (raw materials and wastes) have been studied as sorbents for biogas cleaning [
6,
7,
8,
9,
10,
11]. One of the most investigated materials is biochar and the targeted contaminant is H
2S. Recent studies [
12] reported that H
2S adsorption capacities of biochar (0.18–1.38 mg/g) are much lower than commercial sorbents, while the performance of ashes is still too poor (0.05–0.38 mg/g). Zeolites (5A and 13X) are also other intensively considered candidates for biogas cleaning and for those cases, hydrophobic zeolites are considered more adequate. In a recent study, zeolite recovered from tuff waste obtained removal efficiencies of up to 40 mg/kg [
13]. Investigation of specific properties and nature of the materials appear as a significant challenge to optimize their performance for the tailored contaminants. They have also demonstrated their efficiency in desulfurisation at moderate temperatures (300–500 °C) of Zn–Mn spinels obtained by the synthesis of black mass from mechanical recycling of alkaline batteries [
14].
Hydrogen sulfide reacts with iron hydroxide or oxide to form iron sulfide (FeS). When the material is saturated, it can either be regenerated or changed. Sorbents based on Fe or Fe-based oxides are relatively cheap; some types are environmentally friendly and their capacity for simultaneous adsorption of more than one impurity has also been reported in the literature. For example, the use of iron oxide-based sorbents for simultaneous capture of H
2S and Hg was demonstrated for simulated syngas at temperature ranges of 60–140 °C. For these types of materials, H
2S removal efficiencies as high as 99% and an adsorption capacity of 21%wt has been reported [
15], but the chemisorption mechanism observed for H
2S removal could explain the low efficiency of the regeneration process.
With the aid of activated carbon, a series of mesoporous ZnO/SiO
2 adsorbents are fabricated by the sol–gel method [
16]. The usefulness of this adsorbent is attributed to activated carbon which has two roles: anchor and confine ZnO to obtain highly dispersed small nanoparticles and to produce more oxygen vacancies in ZnO to facilitate lattice diffusion.
An adsorbent material consisting of a specific composition of Cu, Mg, and Al oxides is used in the removal of this toxin H
2S [
17] and, whereas copper oxide (CuO) is the active adsorbent and is transformed into CuS, aluminum and magnesium oxides contribute to adsorbent activity and stability.
A tuned composite structure of Cu, Zn, Fe, and Al elements is also used in adsorbent investigations to reduce H
2S emissions [
18]. The combination of the above elements in a composite crystallinity structure resembling hydrotalcite or aurichalcite type-materials showed excellent H
2S uptake.
Iron(III) oxide and titanium(IV) oxide have been used in the removal of hydrogen sulfide from biogas [
19]. In the investigation, both oxides are used separately or in different combinations. The effectiveness in the removal of H
2S by these oxides is demonstrated.
CeO
2/Fe
2O
3,CeO
2/Mn
2O
3, and CeO
2/Mn
2O
3/Fe
2O
3 nanocomposites are other examples of adsorbents for the removal of H
2S from a gas flow [
20]. From the above composites, the adsorbent containing the mixture of cerium, manganese, and iron oxides presented the maximum adsorption capacity.
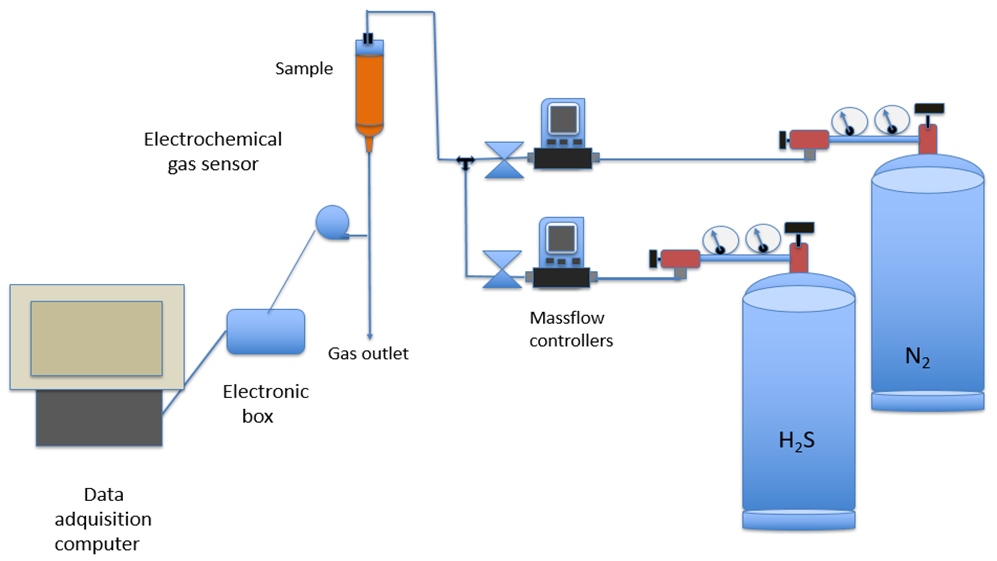
In this paper, the adsorption under dynamic conditions of mimic H2S (provided from a mixture of H2S and N2) by a micronized goethite mineral is investigated. Different experimental variables are studied: adsorbent dosage, gas mixture flow, and H2S concentration being the experimental data fit to various models. Moreover, the adsorption efficiencies of the fixed bed, under the above experimental conditions, are also given.
2. Results and Discussion
Figure 1 showed the variation in the [H
2S]
exit/[H
2S]
inlet relationship versus time using different adsorbent dosages. It can be seen that the increase in the adsorbent packed into the column had an influence on the breakthrough curves, both in terms of shifting the curve to the right and also in the shape of the corresponding curve.
In
Table 1, the estimated H
2S loading values, at the breakthrough point, were given, and under the present experimental conditions no variation in the H
2S loading onto the adsorbent was found at the various adsorbent dosages. In the first instance, the adsorption of H
2S on this adsorbent can could be related to the moving boundary or shrinking core model, thus, the mass transfer across the adsorbent shell particle dominated and the H
2S adsorption rate decreased as the thick of the shell increased. If the driving force was especially small, the resistance encountered by the shell to the mass transfer increased to the point that the yield of a full breakthrough curve was not possible, being this probably the situation encountered when an adsorbent dosage of 4 g was used.
Figure 2 presented the breakthrough curves measured at various inlet H
2S dosages ranging from 150 to 600 mg, a temperature of 20 °C, and a gas flow of 420 cm
3/min. It was shown that the slope of the curves became fairly similar, and the period time between reaching the breakthrough point and the time at which the column was fully loaded increased due to an increase in the inlet H
2S dosage. Thus, the mass transfer zone in the column became longer at greater inlet H
2S dosages. At the breakthrough point, the H
2S loading onto the adsorbent at the various adsorbate inlet concentrations was given in
Table 2.
It was shown that there was not a direct relationship between these two variables: (i) inlet H2S dosage and (ii) H2S concentration at the breakthrough point. This lack of relationship between points (i) and (ii) can be attributable to two causes: the very similar slopes resulting from the four inlet H2S dosages and the increase in the time elapsed between the breakthrough point and the bed saturation point, with an increase in the inlet H2S dosage to the column.
At an inlet H
2S dosage of 400 mg and adsorbate dosage of 4 g (bed volume of 3.8 cm
3), the effect of the gas stream flow rate on the H
2S loading onto the adsorbent was investigated.
Figure 3 showed the results. It was clear that it took a longer time for the adsorbent bed to reach the breakthrough point at a lower gas flow. Moreover, the shape of the loading curve became less steep with the decrease of the gas flow.
Table 3 shows the data about H
2S uptake onto the adsorbent at these three flows.
In theory, steeper breakthrough curves may be an indication of greater H
2S loading onto the adsorbent; however, these results are against what is said above. As it was mentioned in the literature [
21], the breakthrough curves reflected what occurred in the mass transfer zone of the column. If the adsorption process was of an irreversible nature, as it was being the present study about the reaction of H
2S onto a Fe
2O
3-based adsorbent, before reaching the breakthrough point there was always a zone of pristine adsorbent which resulted in a mass transfer zone always reacting with the inlet gas flow. Thus, the gas stream exiting the column did not contain any H
2S; the reaction rate was represented by the overall rate corresponding to the mass transfer zone. As the column was being loaded with H
2S, the mass transfer zone shifted to the column bottom; the adsorbent was fully loaded with H
2S, and H
2S began to exit the bed. Considering that the overall reaction rate was infinite, a thin layer of adsorbent was used to be the mass transfer zone, and the exiting H
2S dosage reached the inlet value almost instantly. In the above conditions, the breakthrough curve adopted a near vertical form in the [H
2S]exit/[H
2S]inlet versus time profile.
The above behavior was less frequent, since the reaction rate occurring in the mass transfer zone tended to be finite As a consequence, the shape of the curve becomes less steep as the overall reaction rate in the mass transfer zone becomes slower. The results shown in
Figure 3 indicated that a greater flow rate was accompanied by a greater reaction rate; this may be indicative that the process was in a mass transfer control regime.
As it was mentioned above, an increase in the thickness of the particle shell resulted in a decrease in the adsorbate adsorption rate, and under this circumstance, the breakthrough curve was steeper at shorter times, decreasing the slope when the elapsed time increased.
Figure 4 showed the XRD pattern of the material before and after H
2S adsorption. The presence of FeS can be observed in the resulting material after H
2S uptake onto the adsorbent, which was evidence of the chemical reaction between goethite and H
2S during the adsorption process. However, the presence of goethite in this final material was also evidence that the complete saturation process had not yet ended; this situation can be attributable to the diffusional resistances encountered during the adsorption process halted the complete reaction between goethite and H
2S, because they hindered the further access of H
2S to the interior of the adsorbent particle.
In a similar manner to other unit operations, adsorption is a process where success is affected by a series of operational parameters, i.e., adsorption capacity and mass transfer rate. In dynamic form, and at first instance, prediction of column performance can be performed using a macroscopic version to describe the behavior of an adsorbent packed in a column [
22]. The equation describing the macroscopic model can be written as:
where [S]
t is the solute concentration in the exit solution at time t, [S]
inlet is the inlet solute concentration, K is the rate constant of the process, [S]
eq the equilibrium solid-phase concentration of the adsorbed solute, m the mass of adsorbent, f the flow rate, and t the elapsed time. Accordingly, in the above expression the left-hand term is a linear function of time, being the whole equation the same as the simplified logistic function that expressed the biological growth and distribution, thus:
The two parameters K (rate constant) and t
50 (elapsed time at which 50% of the solute is adsorbed onto the adsorbent) in the above equation can be estimated from the slope and intercept, respectively, of a plot of the left-hand term in Equation (2) versus time. Such parameters for the various experimental conditions used in the present investigation are listed in
Table 4. Using these estimated values, the breakthrough curves for these experimental conditions may be predicted for H
2S adsorption on the iron oxide-based adsorbent.
Figure 1,
Figure 2 and
Figure 3 compared the predicted and experimental data for different adsorbent doses, H
2S doses, and flow rates, respectively. It can be observed that the model compared reasonably well with the experimental data. Thus, Equation (2) can be used for the representation of the column adsorption process under the present experimental conditions.
The exception to the above fitting is the data resulting from the highest adsorbent dosage (4 g) and lowest flow rate (210 cm
3/min). In this case, the experimental data best fit an exponential equation in the form:
where X and Y are model parameters and t is equal to zero at the breakthrough point. The fit of the above model to the experimental data is represented in
Figure 5, indicating the relative goodness of the model to these non-S-shaped experimental data. The corresponding values of X and Y are 1 and 0.4, respectively.
Since the model represented in Equation (2) has a tendency to deviate from the experimental data at the extreme points of the S-shape curves, a further refinement in the modeling of the experimental data using the Bohart–Adams model of fixed bed adsorption [
23] was conducted.
The model consists of two coupled first-order linear particle differential equations,
subject to initial and boundary conditions:
c =
c0 at
z = 0, and
a =
a0 at
t = 0.
In the above equation, a (−) is the adsorption capacity of the bed (the mass of H2S that can be adsorbed per unit mass of solid), c (the mass unit) is the solute concentration in the gas flow, k (the volume/mass and time units) is the adsorption rate constant, (the mass/volume units) is the bed bulk density (the mass of the solid per unit volume of column units), u (the length/time units) is the gas flow velocity, z (the length unit) is the axial coordinate along the column, and t (the time unit) represented the elapsed time.
The first condition gives the solute concentration in the inlet gas, and the second condition gives the adsorption capacity of the clean bed, i.e., before solute adsorption.
The solution of these equations is:
To compare this solution with the experimental breakthrough curve, Equations (5) and (6) must be evaluated by
z =
H, where
H is the bed height. In terms of the gas flow rate,
q (the mass/time units), and the bed mass,
ms (the mass units). The theoretical breakthrough curve becomes:
K and
a0 values were determined (
Table 5) by the least square fitting of the experimental data to Equation (7). The fit for the various operating conditions is shown in
Figure 6. It can be seen that the resolution of this model adequately represented the uptake of H
2S onto this goethite-based adsorbent.
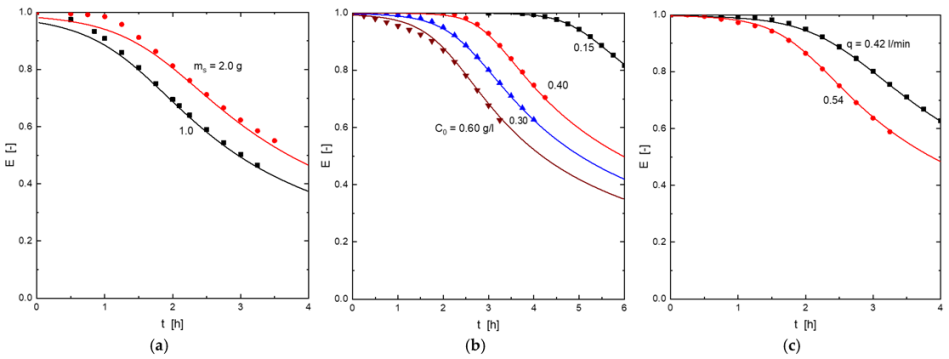
Furthermore, the bed adsorption efficiency can be calculated using:
- (i)
in an instantaneous time as:
- (ii)
or in an average form over a time t as:
Inserting Equation (5) in Equation (10) resulted in:
Figure 7 represented the different experimental (symbols) and calculated (from Equation (10)) efficiency values for the different operational conditions used in the present work. An excellent fit between the values was found.


