Article

LC-HRMS/MS-Based Metabolomics Approaches Applied to the Detection of Antifungal Compounds and a Metabolic Dynamic Assessment of Orchidaceae

by
Gesiane S. Lima
,
Nerilson M. Lima
,
Jussara V. Roque
,
Deborah V. A. de Aguiar
,
João V. A. Oliveira
,
Gabriel F. dos Santos
,
Andrea R. Chaves
* and
Boniek G. Vaz
*
Institute of Chemistry, Federal University of Goias, Goiania 74690-900, GO, Brazil
*
Authors to whom correspondence should be addressed.
Molecules 2022, 27(22), 7937; https://doi.org/10.3390/molecules27227937
Submission received: 24 October 2022 / Revised: 12 November 2022 / Accepted: 13 November 2022 / Published: 16 November 2022

Abstract

:
The liquid chromatography–mass spectrometry (LC-MS)-based metabolomics approach is a powerful technology for discovering novel biologically active molecules. In this study, we investigated the metabolic profiling of Orchidaceae species using LC-HRMS/MS data combined with chemometric methods and dereplication tools to discover antifungal compounds. We analyze twenty ethanolic plant extracts from Vanda and Cattleya (Orchidaceae) genera. Molecular networking and chemometric methods were used to discriminate ions that differentiate healthy and fungal-infected plant samples. Fifty-three metabolites were rapidly annotated through spectral library matching and in silico fragmentation tools. The metabolomic profiling showed a large production of polyphenols, including flavonoids, phenolic acids, chromones, stilbenoids, and tannins, which varied in relative abundance across species. Considering the presence and abundance of metabolites in both groups of samples, we can infer that these constituents are associated with biochemical responses to microbial attacks. In addition, we evaluated the metabolic dynamic through the synthesis of stilbenoids in fungal-infected plants. The tricin derivative flavonoid- and the loliolide terpenoidfound only in healthy plant samples, are promising antifungal metabolites. LC-HRMS/MS, combined with state-of-the-art tools, proved to be a rapid and reliable technique for fingerprinting medicinal plants and discovering new hits and leads.

Graphical Abstract

1. Introduction

Orchidaceae is one of the largest and most diverse families in the plant kingdom, with more than 28,000 species and 763 genera [1,2]. Orchidaceae species, popularly known as orchids, are sold commercially for presenting beautiful and diverse flowers and the economically important spice known as vanilla [3]. Many species have been studied for their chemical composition and pharmacological activities, including anticancer, anti-inflammatory, antioxidant, neuroprotective, antivirus, and antimicrobial [3]. Several orchid species are known to produce stilbenoids, phytoalexins responsible for protection against predation and antimicrobial activities [4,5,6]. Orchinol and hircinol are two stilbenoid compounds isolated from the Orchis and Loroglossum genera, respectively, which were reported with antifungal activity and play a role in the defense of orchid tubes [7].
Considering the antifungal activity of the secondary metabolites present in orchids and the low rate of new drug discovery, there is an urgent need to develop fast and efficient methodologies for screening new antimicrobial agents. Since the classic process of screening bioactive natural products is a time-consuming and labor-intensive step, analytical techniques applied to separating and characterizing phytocompounds stand out for their high ability to dereplicate complex samples and detect constituents even at low concentrations that can be useful in planning new drugs [8,9].
Mass spectrometry (MS)-based analytical platforms are established as the technique of choice in metabolomic investigations due to their high selectivity, sensitivity, speed, and versatility in detecting a wide range of analytes with different physicochemical properties. In addition, the development of increasingly sensitive instruments allows the detection of trace-level molecules and provides analysis with sub-ppm mass accuracy that allows describing the molecular formula with high precision based on the mass defect [10,11]. In this way, the high resolving power offered by this new equipment provides essential information for reliable annotation and accurate quantification of metabolites [12]. Ultrahigh-resolution mass spectrometry hyphenated to ultra-resolution chromatographic techniques represents one of the most widely employed high-throughput screening technologies in metabolomic approaches and yields greater metabolic coverage in natural product research [11,13,14,15].
Liquid chromatography coupled with mass spectrometry (LC-MS) could offer advantages in the metabolomic analysis, such as its better resolution of the complex sample allowing a good evaluation of molecular diversity content. In addition, it provides more detailed information on the metabolic composition of the samples by some chromatographic parameters such as retention time and peak shape of the analytes, allows comparison with standards improving the confidence level in structural annotations, distinguishing isobaric and isomeric metabolites that are not resolved through the fragmentation pattern and accurate molecular mass [16,17,18,19].
Numerous applications of LC-HRMS/MS, combined with state-of-the-art tools for structural annotations (such as Classical Molecular Networking [20], Dereplicator+ [21], Network Annotation Propagation [22], and Moldiscovery [23]), are reported in the literature, and many findings obtained from their applications have boosted analytical research throughout and metabolites coverage. This approach has been widely employed to annotate flavonoids and selaginellins of the roots and shoots from Selaginella convolute [24]; phenolic compounds of the leaves and seeds from Erythrina velutina [25]; several metabolites, including four phenanthrene with the antinociceptive activity of the roots from Laelia anceps and Cyrtopodium macrobulbon [26]; several flavonoids and alkaloids of the bulbs and flowers from Fritillaria thunbergii [27]; various compounds of the leaves, stems and roots from Peperomia pellucida, including compounds annotated for the first time for the genus [28]; and unique cassaine-type diterpenoids of the leaves from Erythrophleum suaveolens and E. ivorense, which were employed to distinguish morphologically-close species [29].
Thus, the present study aimed to explore the presence and abundance of secondary metabolites in healthy and fungal-infected plants from the Orchidaceae family to select potential antimicrobial candidates and a metabolic dynamic assessment. The metabolite production of ten species of Orchidaceae belonging to the genera Vanda and Cattleya was evaluated using tandem mass spectral libraries, in silico fragmentation tools, and chemometric methods from MS data obtained by Orbitrap LC-MS.

2. Results

In this work, we used ultrahigh-resolution mass spectrometry coupled with liquid chromatography to investigate the metabolic dynamic of healthy and fungal-infected plants of the same botanical family to identify substances with antifungal properties. Metabolome-based antifungal screening approach was evaluated in twelve species of the Orchidaceae family by evaluating the spectral similarity of samples and applying chemometric methods. Initially, the ions were discriminated using data mining and organization tools from the GNPS—Global Natural Products Social Molecular Networking (https://ccms-ucsd.github.io/GNPSDocumentation/ (accessed on 16 August 2022) platform, and the structural annotation of the metabolites was based on accurate mass (m/z), MS/MS fragmentation pattern, chromatographic retention time, and chemotaxonomy data from Orchidaceae family. We used metadata and data mining tools according to the GNPS platform documentation, and the structural information and metabolic coverage data were inspected in detail. All library hits classified as gold (thoroughly characterized as structures), silver (compound crude extract), and bronze (partial annotation) [20] were evaluated, and chemophenetics data from the Orchidaceae family confirmed the metabolic annotation.
The structural annotation of the metabolites was confirmed through the analysis of candidates and their analogs suggested by the natural products databases, reference mass spectral libraries, and spectral similarity networks resulting in level 2 identification according to the Metabolomic Standard Initiative-MSI [30].
Lyophilized extracts from two groups of samples (healthy and fungal-infected plants) of species of the genus Vanda (five samples) and Cattleya (five samples) were submitted to the evaluation of the presence of metabolites through metabolite annotations were based on searching the experimental spectra against the GNPS spectral library using the tools Classical Molecular Networking—MN [20], Dereplicator+ [21], Network Annotation Propagation—NAP [22], Moldiscovery [23], MS2LDA [31], MolNetEnhancer [32], and analysis of chromatographic data such as retention time and UV spectra unit of absorbance. The ion abundance assessment was performed using the Feature-Based Molecular Networking—FBMN [33] tool obtained from MS/MS data in positive ionization mode (ESI(+)). Annotations with high spectral similarity were prioritized, resulting in the structural annotation of 50 compounds.

2.1. Comprehensive Structural Annotation of Orchidaceae Species Using Molecular Networking

To obtain hits with higher structural similarity and the biosynthetic origin within molecular families from molecular networking, the threshold for the cosine score similarity was set to 0.7.
LC-HRMS/MS-based untargeted metabolomics approaches showed a considerable variation in compounds mainly belonging to the class of secondary metabolites of the flavonoids, stilbenoids, phenolic acids, chromones, tannins, terpenoids, and steroids. Dereplication methodologies have been extensively applied in plant metabolomics and provided the structural annotation of fifty-three metabolites belonging to different classes of natural products in aglycone and heteroside form. However, most putatively annotated polyphenols were classified as heterosides, mainly glycosylated flavonoids. Among the fifty-three compounds annotated, 35 metabolites were annotated as flavonoids (22 flavones, 7 flavonols, 1 flavanone, and 5 isoflavones) and 10 stilbenoids. Regarding the phenols class, 10 compounds were annotated, being 50% cinnamic acids derivatives. Among the 20 terpenoids detected, were annotated 9 diterpenoids, 2 monoterpenoids, 7 sesquiterpenoids, and 2 triterpenoids. The library matches showed alkaloids (8) classified as tryptophan alkaloids (1), anthranilic acid alkaloids (3), nicotinic acid alkaloids (3), and histidine alkaloids (1). Other oxygenated aromatic metabolites belonging to the coumarins (5), anthraquinones (1), xanthones (1), and chromones (1) classes were found in low abundance (Figure 1). Furthermore, a wide array of primary metabolites was detected in all samples, such as carbohydrates, amino acids, and lipids.
The library matches using the classical molecular network (MN) from Cattleya and Vanda genera assessment in both physiological conditions (healthy and fungal-infected) yielded a total of 1.220 hits with 315 unique library compounds. We found 60 hits with a high confidence level, a high number of hits with gold classification, represented by spectral similarity greater than 90% (cosine score > 0.9), mz error (ppm) less than 5, and a high amount of shared peaks in the MS/MS spectrum. The analysis of the candidates suggested by the spectral library after inspection of the profile of MS/MS fragmentation patterns, evaluation of high-resolution calculation of empirical formula, and chromatographic analysis data, yielded the compounds described in Table 1. All the annotated metabolites have been previously described in the Orchidaceae family [34,35].
From the MS/MS fragmentation pattern analysis, it was observed that the O-glycosylated phenolic compounds were more abundant than the C-glycosylated compounds. O-glycosylated flavonoids exhibited a neutral loss of a sugar moiety, which corresponds to a loss of 162 Da for hexosides, 146 Da for deoxyhexosides and 132 Da for pentosides. The O-glycosylated flavonoids Rutin (C27H30O16), Saponarin (C27H30O15), Isovitexin 2″-O-arabinoside (C26H28O14), Isoschaftoside (C26H28O14), Tricin 5-glucoside (C23H24O12), Isorhamnetin 3-galactoside (C22H22O12), Hyperoside (C21H20O12), and Isovitexin (C21H20O10) were identified by the consecutive losses of sugar moieties, and the flavonoids aglycone Acacetin, 4′-Methoxy-6-methylflavone, and Liquiritigenin were identified by fragments originating from retro Diels–Alder reactions, and data from chromatographic analysis such as UV spectra and retention times. In addition, it was possible to perform structure-based propagation and guided detection of phenolic compounds not annotated by the spectral library. The stilbenoids Rhapontin, Erianin, 3-O-Methylgigantol, Gigantol, Dendrosinene B, Tristin, 3′-O-Methylbatatasin III, 3-[2-(3-hydroxyphenyl)ethyl]-5-methoxyphenol, and Thunalbene, metabolites found in both Vanda and Cattleya genera, were putatively annotated through accurate mass precursor and characteristic product ions such as consecutive losses of C2H2O and methoxyl groups.
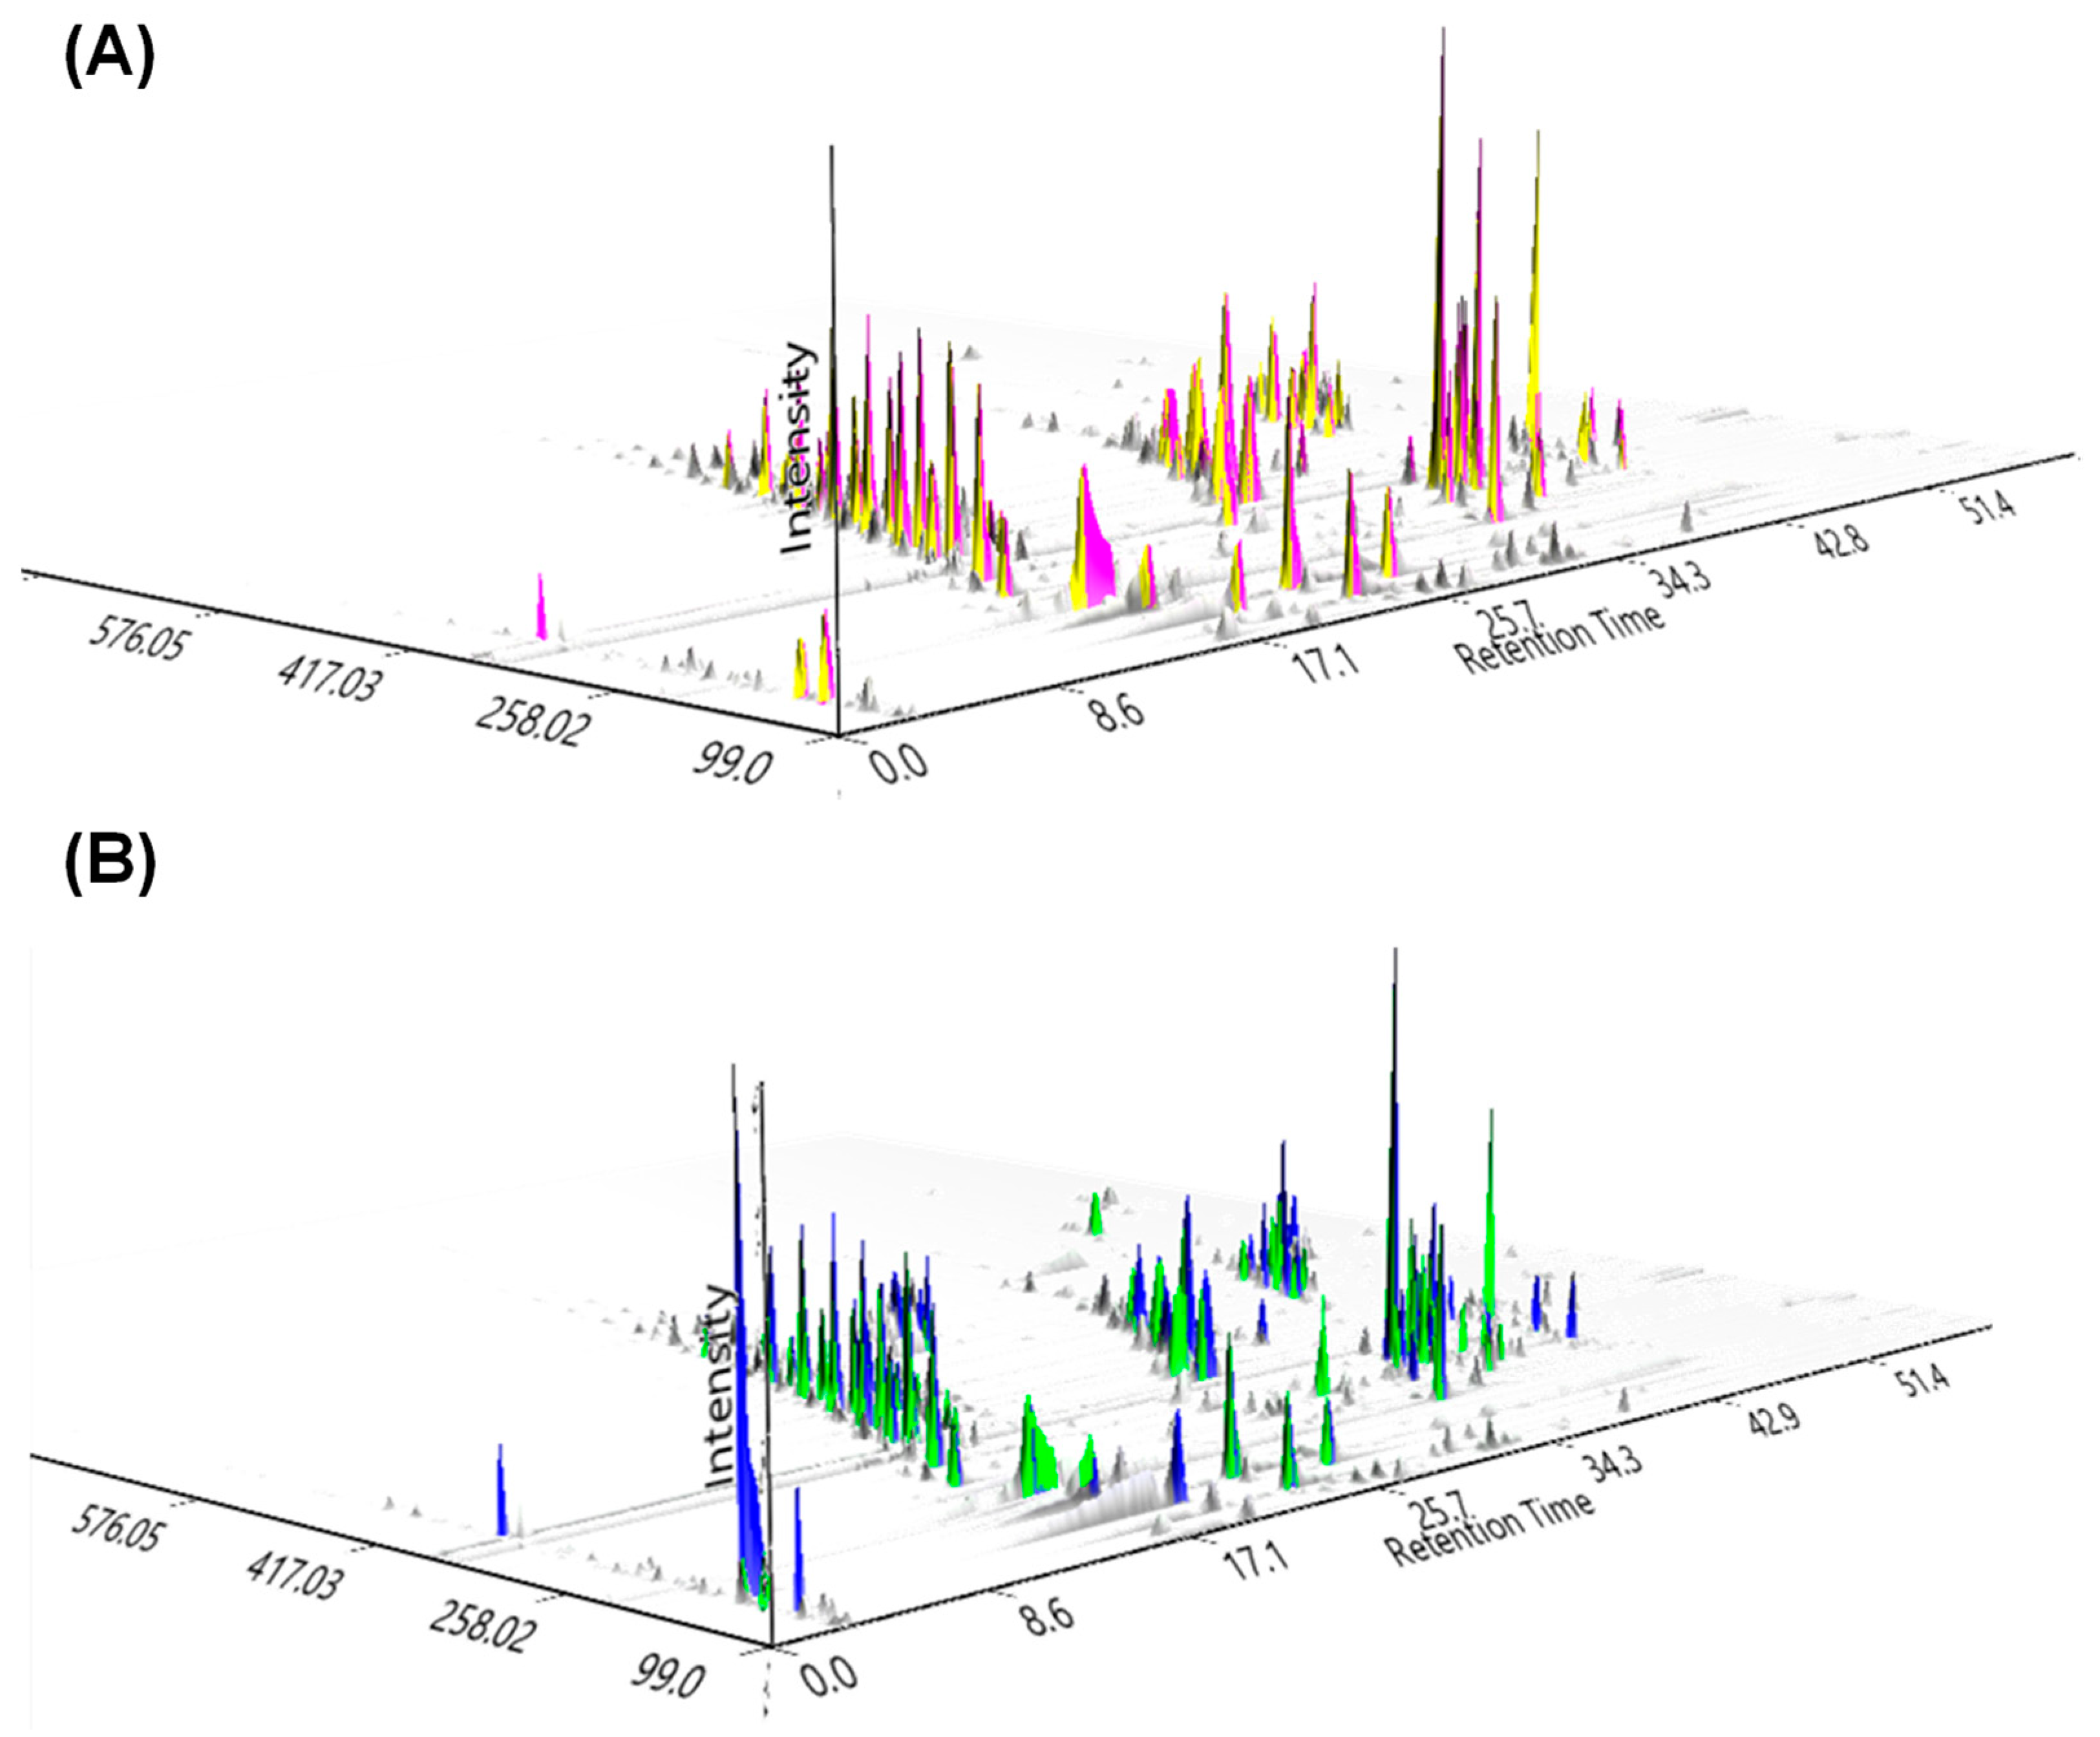
To narrow the focus to identify metabolites with antifungal potential using the strategy of investigating the metabolome of healthy plants compared with the metabolome of fungal-infected plants from the Cattleya and Vanda genera, we eliminate metabolites common to all species. The two set plants shared about 75% of their metabolome. Healthy plant species exhibited a richness of secondary metabolites (approximately 60% of hits) compared to fungal-infected plants (approximately 40% of hits), evidencing the role of these metabolites in defense against microbial attack. The attack of pathogens on plants generates a biochemical response. Therefore, the production of these chemical constituents in infected plants belonging to the same genus or species may be suppressed by environmental factors [36,37,38]. In addition, the quantitative alterations of these metabolites may also be a consequence of environmental stimuli, explaining the low abundance of some compounds in plants of the same species affected by microbiological attacks. Moreover, other factors, such as nutrient and water availability in the soil, can influence metabolic pathways and considerably affect the synthesis of secondary metabolites with antimicrobial action [39,40]. The chromatographic profile and molecular networking show subtle differences between the sample groups for both species analyzed under the same chromatographic and spectrometric conditions (Figure 2).
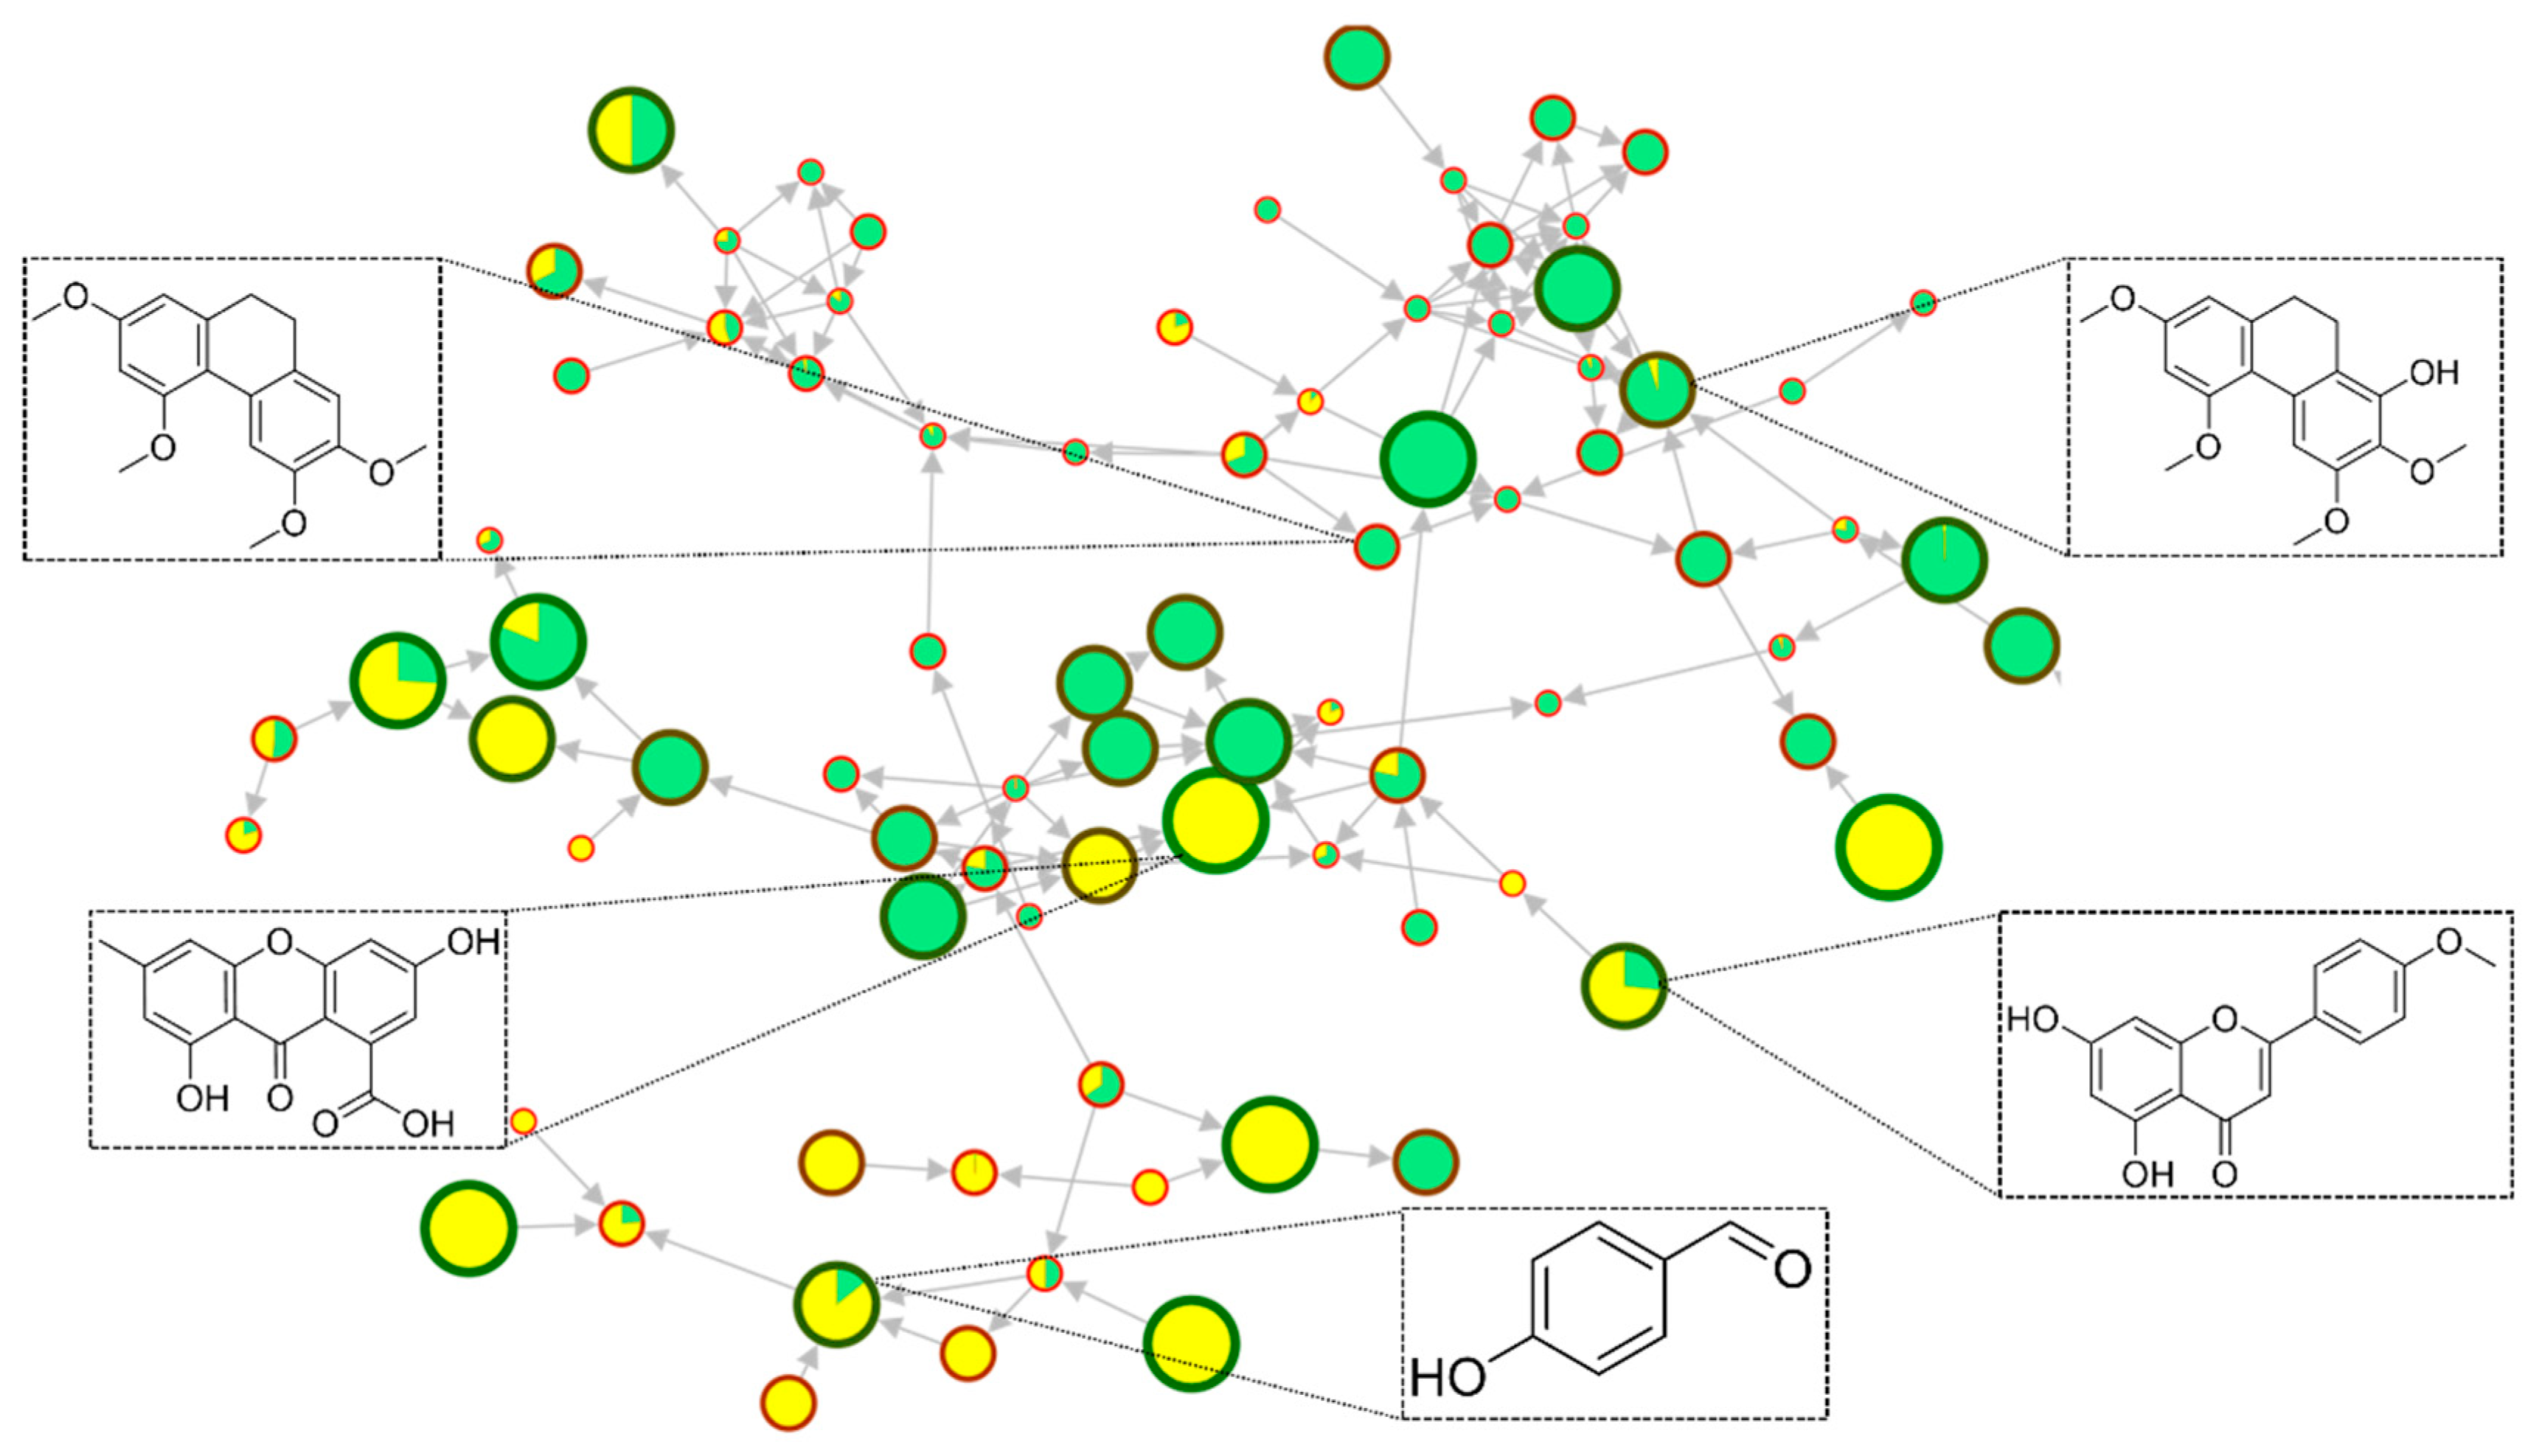
The metabolites cinnamic alcohol (phenylpropanoid), tricin 5-glucoside (flavonoid), loliolide (terpenoid), and allobetulinol (terpenoid) were detected only in samples of healthy plants. In contrast, the metabolites 3-(4-hydroxy-3-methoxyphenyl)propyl 3-(4-hydroxyphenyl)propanoate (phenol), salidroside (phenol), isovitexin (flavonoid), rutin (flavonoid), homoorientin (flavonoid), hyperoside (flavonoid), 2,3,5,7-tetramethoxy-9,10-dihydrophenanthrene (stilbenoid/phenanthrenoid), 4′-methoxy-6-methylflavone (flavonoid), isoshaftoside (flavonoid), sinapyl alcohol (phenylpropanoid), liquiritigenin (flavonoid), gigantol (stilbenoid), 3-O-Methylgigantol (stilbenoid), 4-methylcinnamic acid (phenylpropanoid), and isorhamnetin 3-galactoside (flavonoid) were detected only in samples of fungal-infected plants. Although the sample sets share a wide metabolic diversity, the metabolites were found at different levels of abundance since the activation of the plant defense mechanism can result in the greater activation of a biosynthesis pathway and suppress the synthesis of other metabolites. The flavonoids afrormosin, acacetin, and stilbenoids were primarily found in fungal-infected plants, while nitrogen compounds were found predominantly in samples from healthy plants. Since the infection by microorganisms induces biochemical alterations in the host organism in an attempt to defend itself from the aggressive agent [41,42,43,44], a wide diversity of metabolites was found in fungal-infected plants (Figure 3). The tricin derivative flavonoid, and the loliolide terpenoid, found only in healthy plant samples, are reported in the literature with promising antifungal activity [9,45,46].
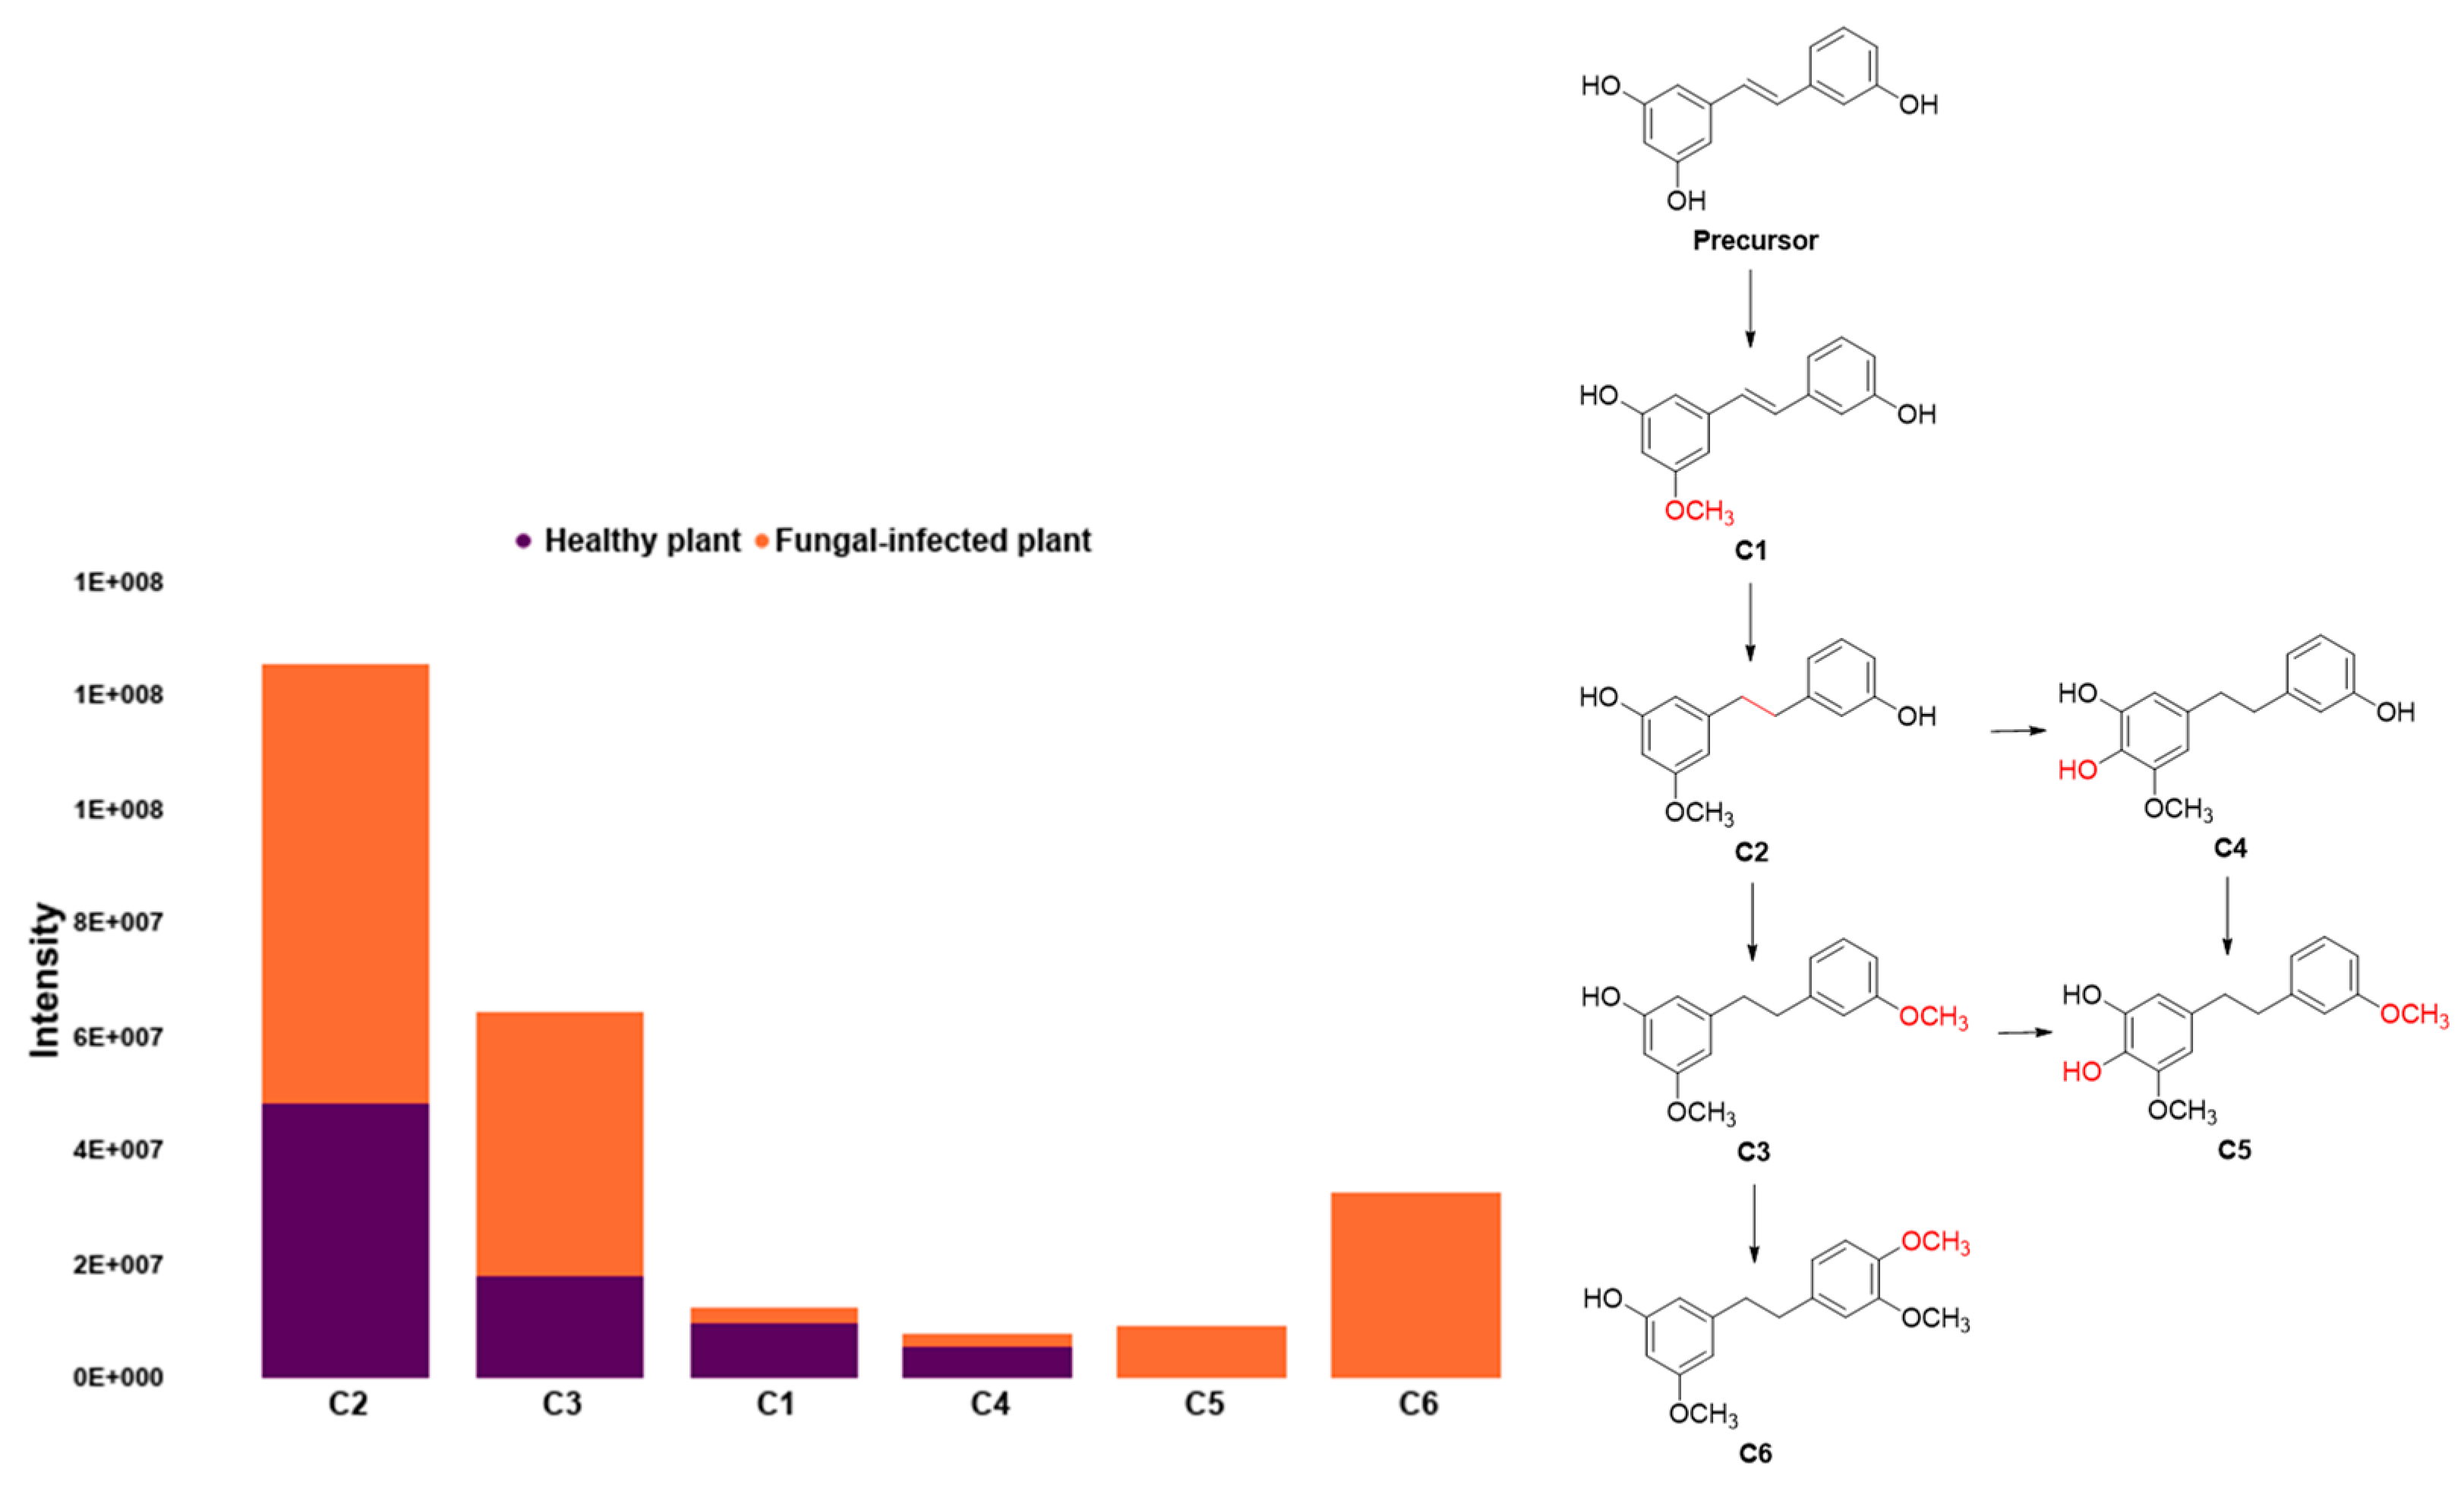
The metabolic dynamics of Orchidaceae species were also evaluated through the synthesis of stilbenoids by fungal-infected plants and healthy plants, whose evaluation showed that the compounds, thunalbene (C1) and dendrosinene B (C4), were found in high concentration in healthy plants compared to fungal-infected plants. In contrast, the stilbenoids, batatasin III (C2) and 3′-O-Methylbatatasin III (C3), were found in low concentration in healthy plants compared to fungal-infected plants, while 3-Methoxy-5-[2-(3-methoxyphenyl)ethyl]-1,2-benzenediol (C5) and 3-O-Methylgigantol (C6) were detected only in fungal-infected plants (Figure 4). Stilbenoids are a group of plant phytoalexin polyphenols produced by plants as a defense mechanism against microbial infection [47,48].

2.2. Structural Annotation Strategy Using In Silico Fragmentation Tools to the Fingerprinting of Healthy and Fungal-Infected Plants from Orchidaceae

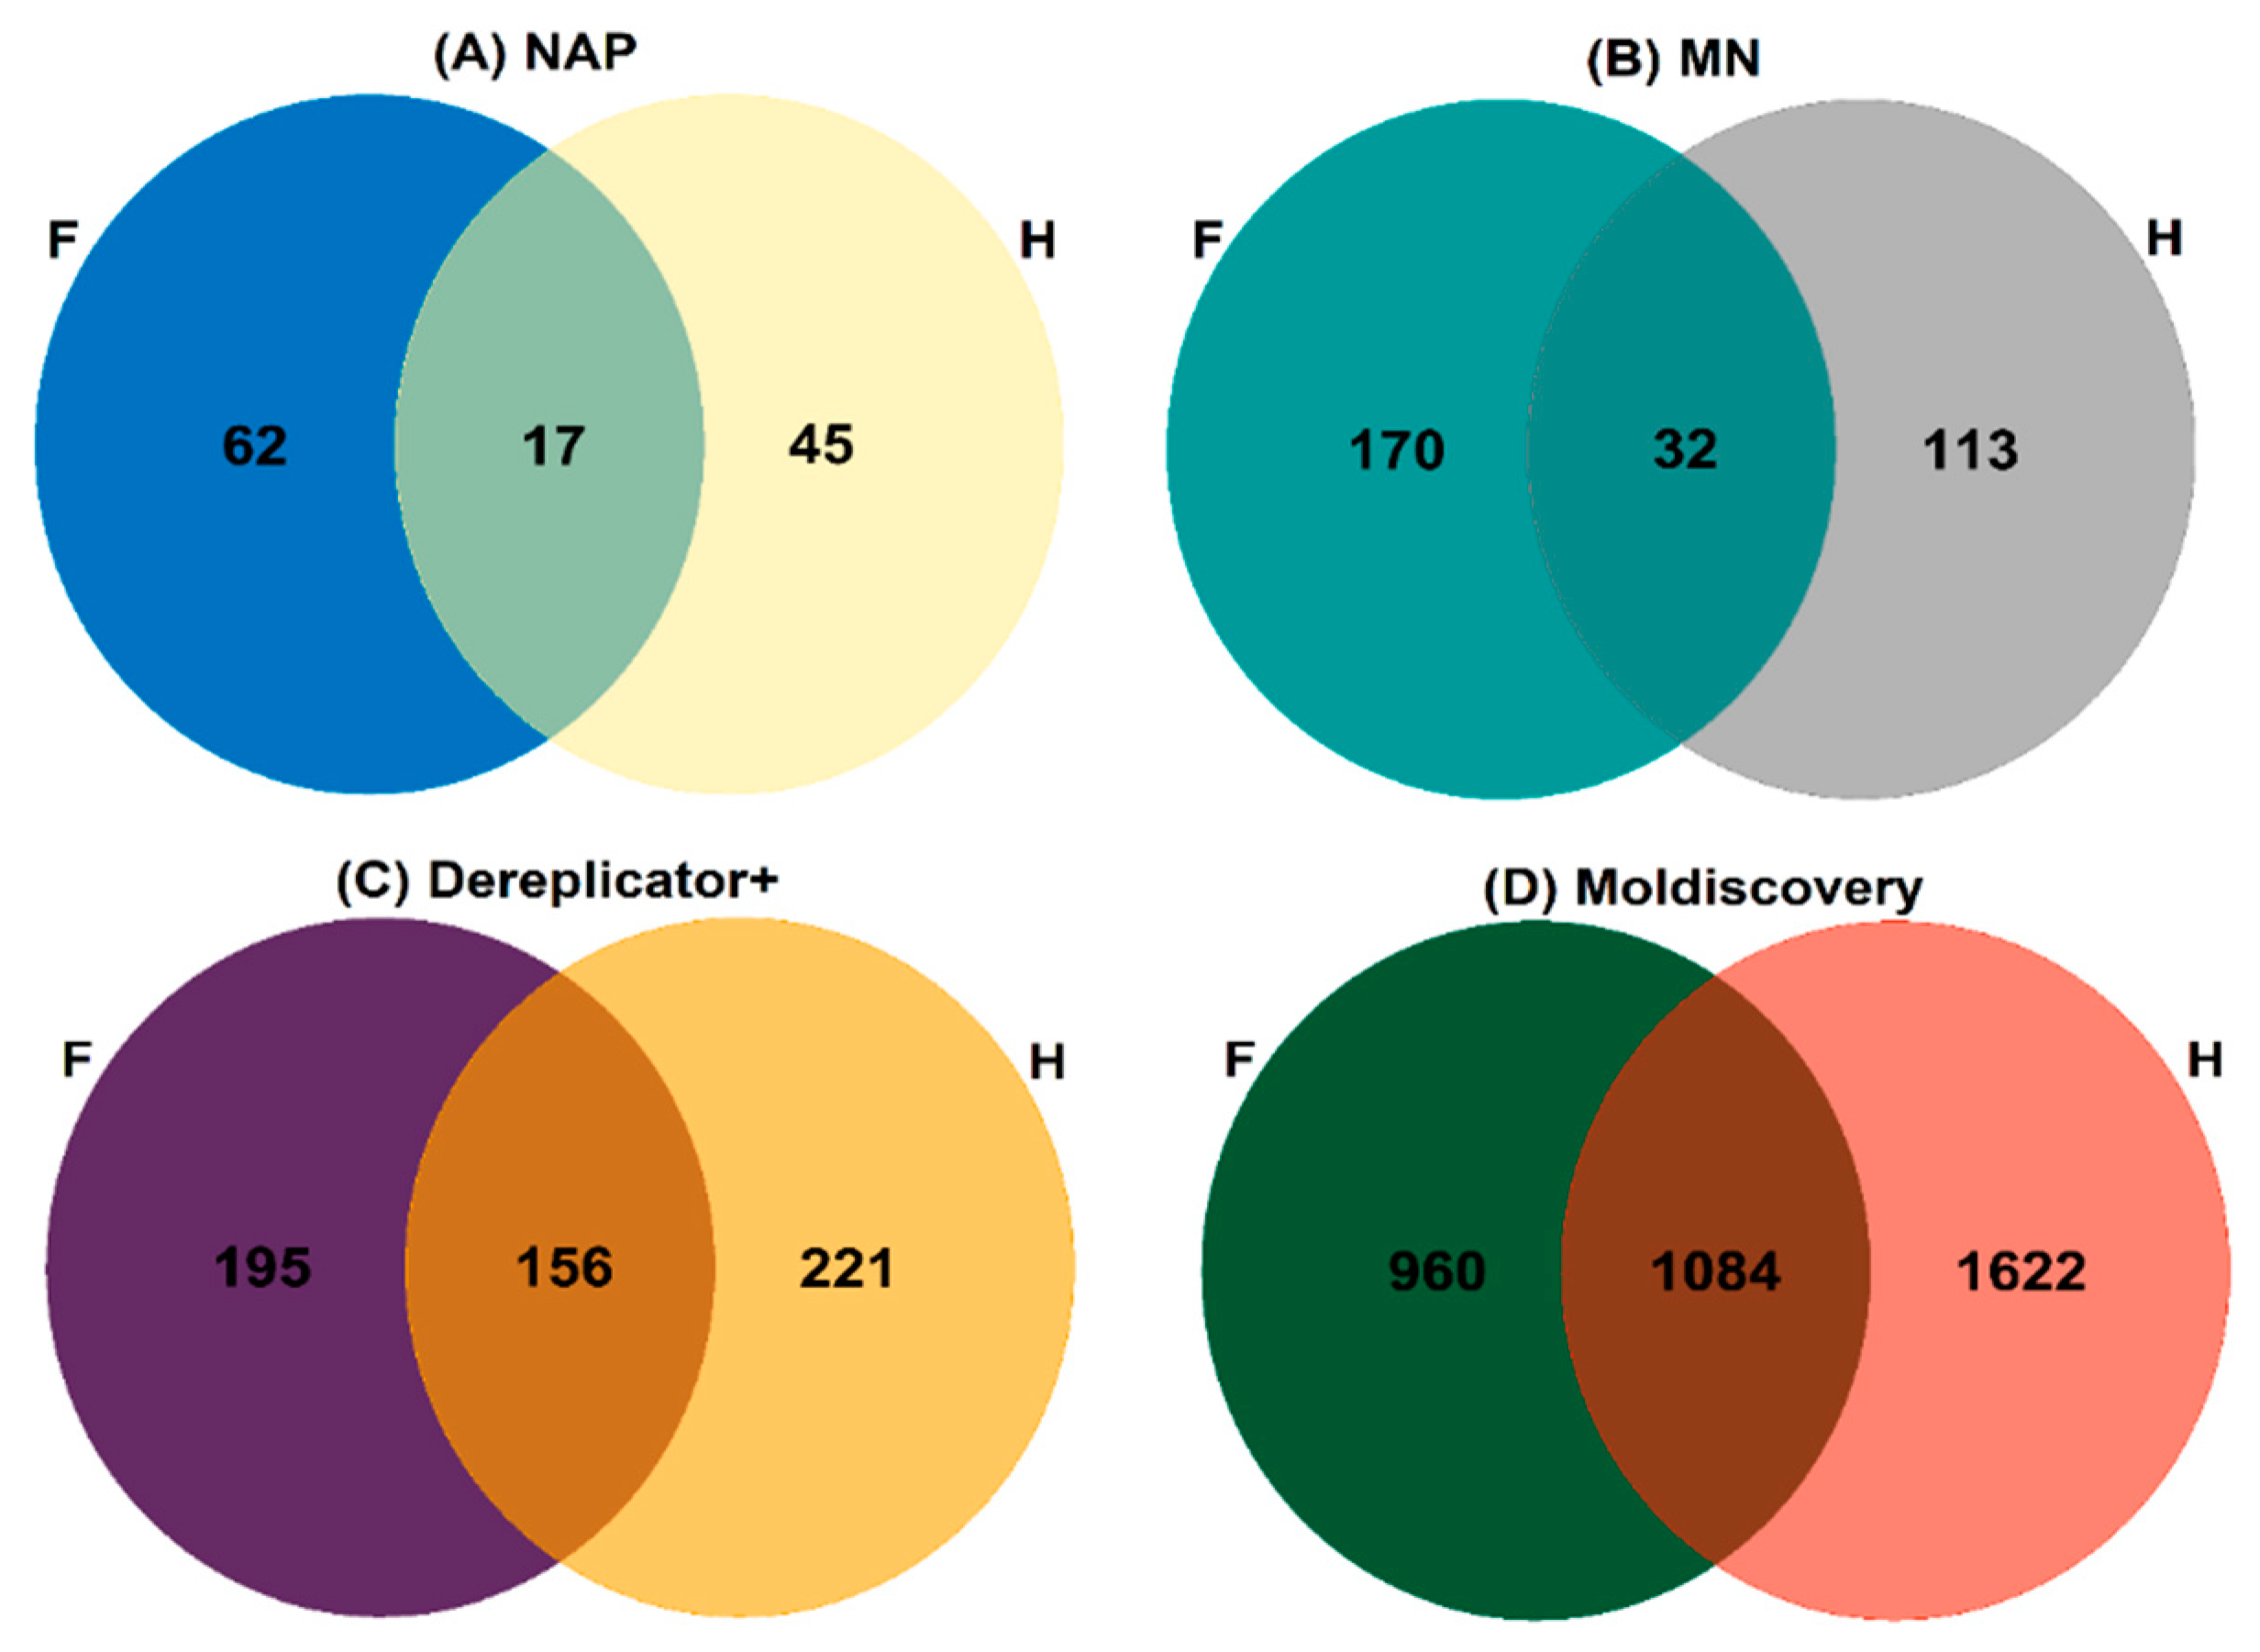
From the evaluation of the secondary metabolism of the genera Vanda and Cattleya, 145 and 202 unique metabolites were detected in samples of fungal-infected plants and healthy species from the genus Cattleya, respectively. For the genus Vanda, 146 and 166 unique metabolites were detected in fungal-infected plants and healthy species samples, respectively. The molecular diversity found in healthy plant samples evidences a greater capacity of plants to synthesize secondary metabolites with biological action. In order to obtain greater metabolic coverage, more sophisticated state-of-the-art tools were applied, such as Moldiscovery, which allows obtained structural candidates with greater accuracy and reliability. The Moldiscovery tool yielded a total of 2044 unique metabolites and 1348 unique metabolites at a cutoff score of 15 from samples of fungal-infected plants. While for samples of healthy plants, 2706 unique metabolites and 1768 unique metabolites were detected at a cutoff score of 15.
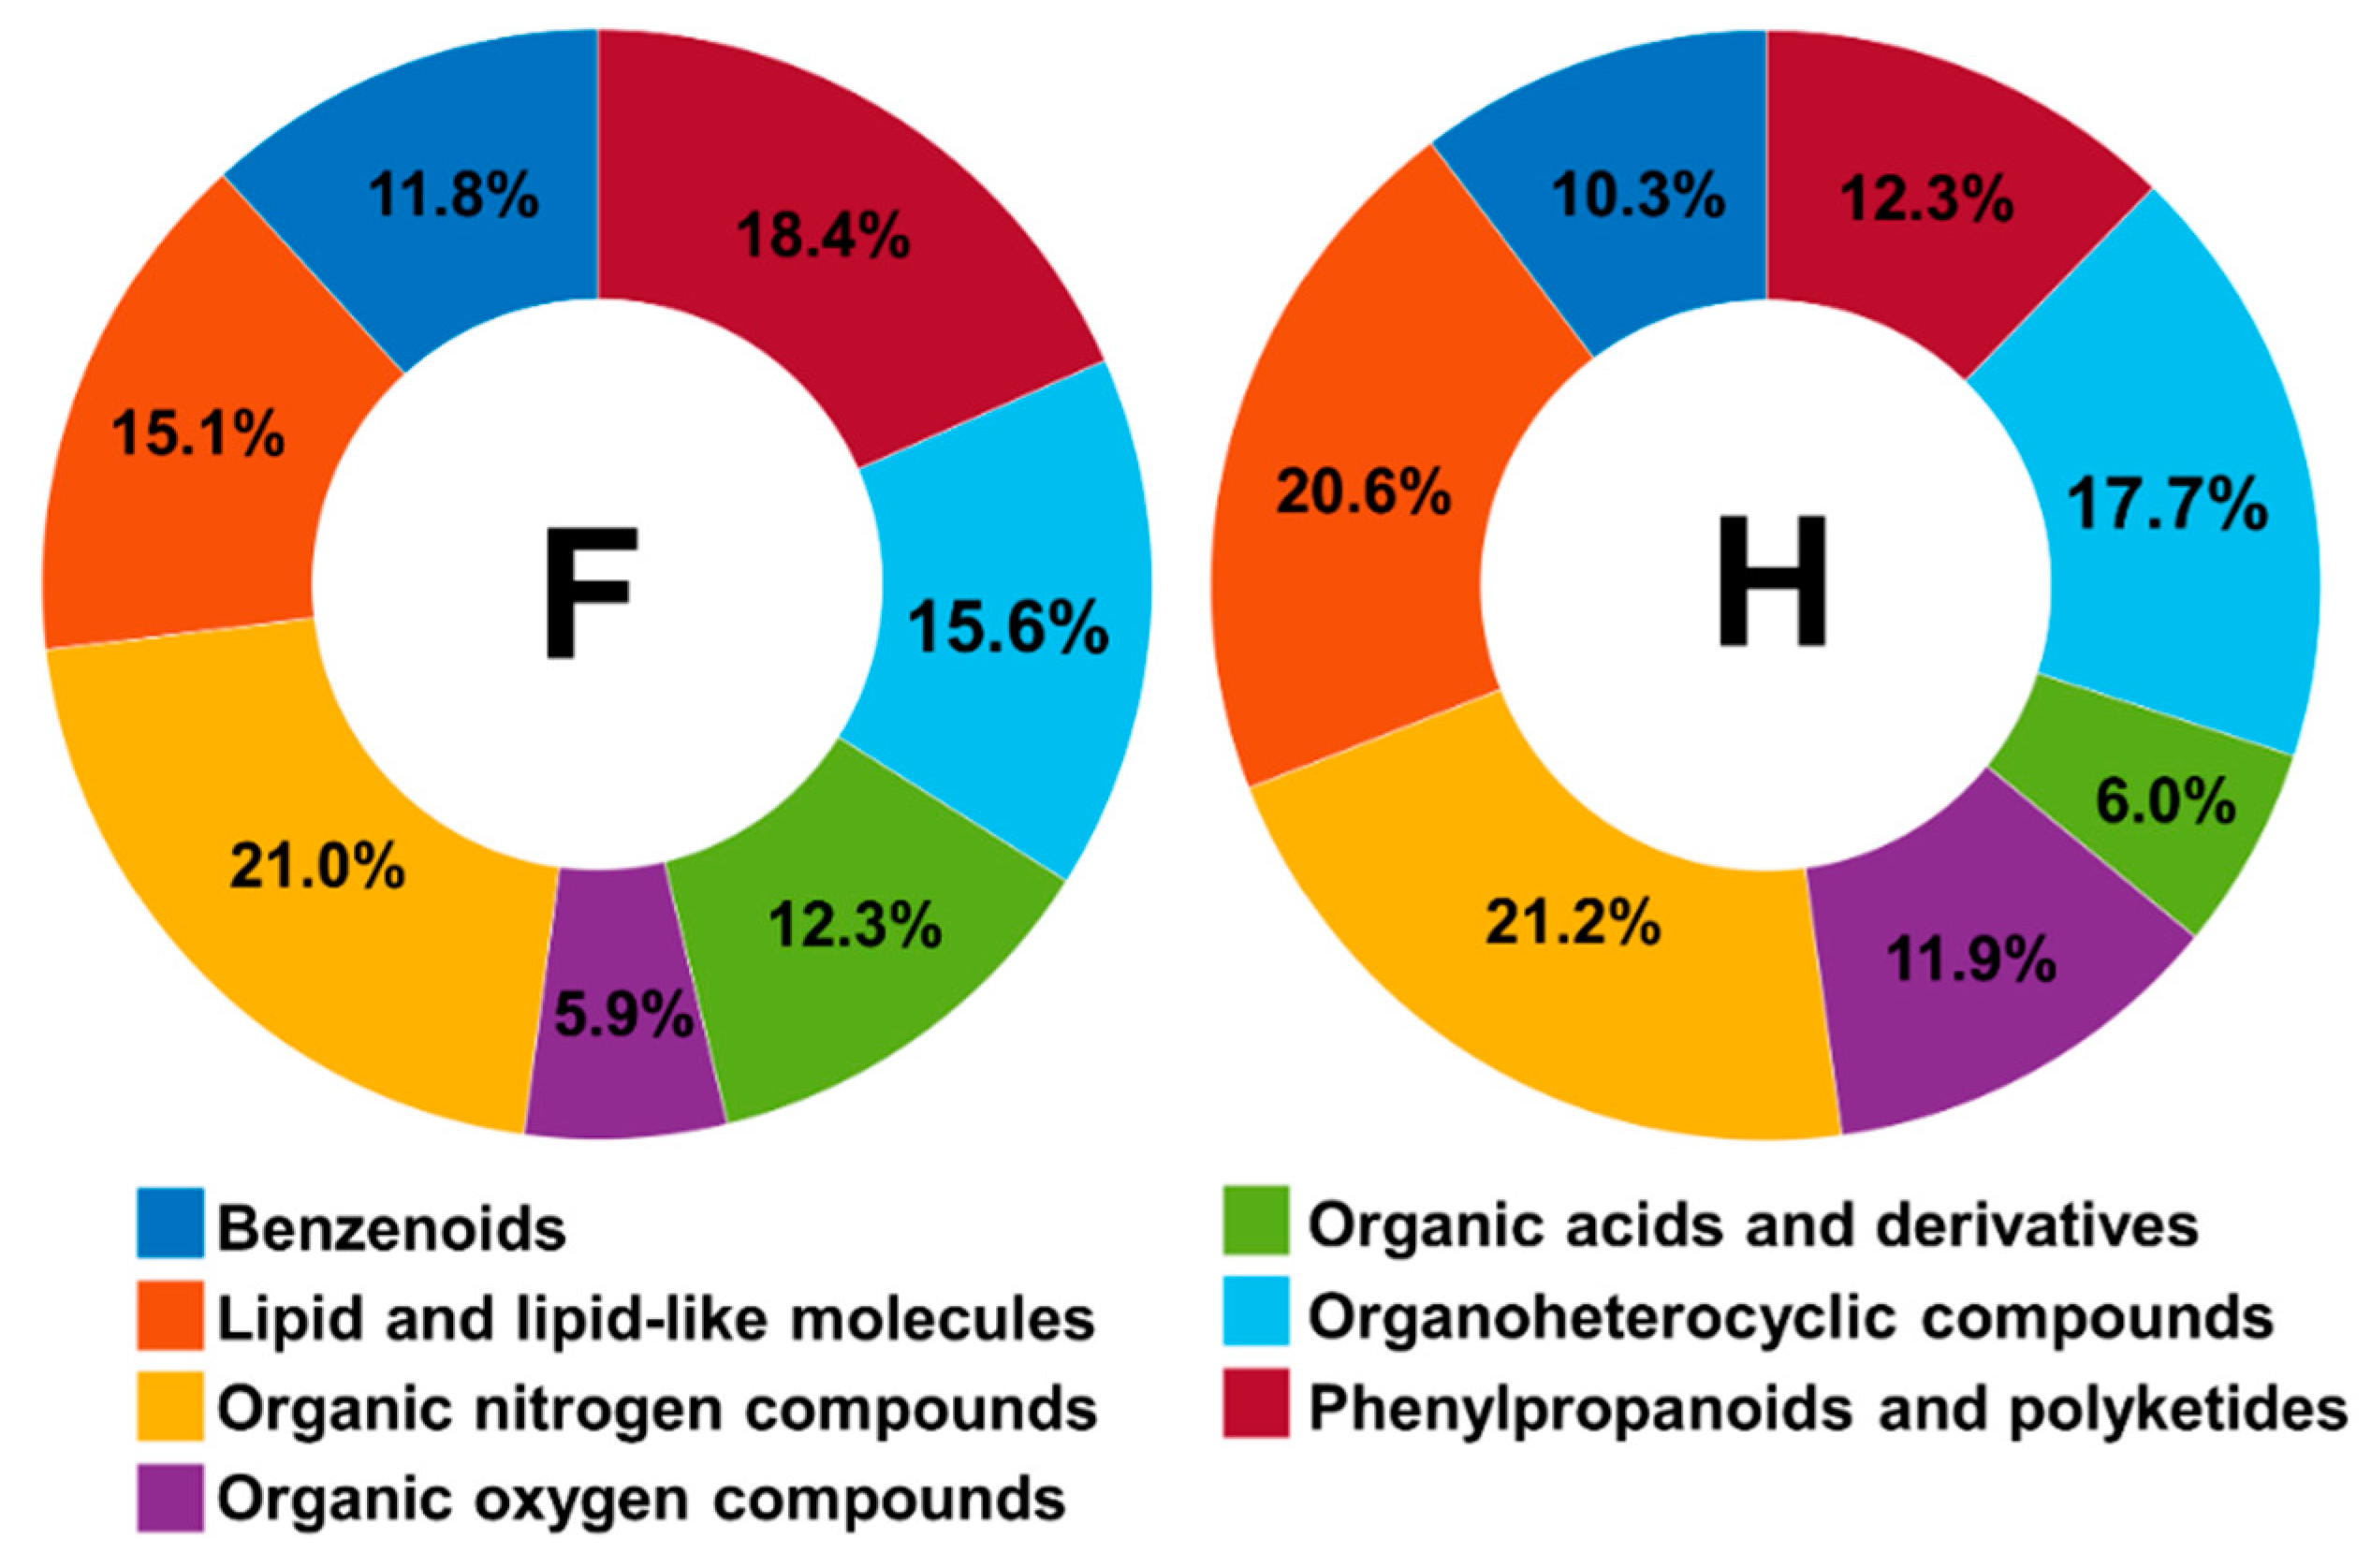
Furthermore, a greater number of unique metabolites were found in healthy plant samples (351) compared to fungal-infected plants (377) using the in silico dereplication tool termed Dereplicator+. To obtain a more comprehensive chemical overview of both sets of samples and chemical structural information, the MolNetEnhancer tool was applied to detect the chemical classes present in the samples and to assist in annotating metabolites that did not show a matching MS/MS spectrum. The analysis showed mostly a higher number of nodes for all classes at the “superclass” level for healthy plant samples, except for the classes of organic acids derivatives and phenylpropanoids and polyketides, which were more abundant in fungal-infected plants (Figure 5).
In a more comprehensive investigation at the “class” level, the coumarin derivatives were found only in healthy plant samples, while the aurone class was found only in fungal-infected plant samples. Other chemical classes were found in both sets of samples. However, they were detected in different proportions, such as stilbenes and cinnamic acid derivatives that were detected mainly in samples of fungal-infected plants, and the flavonoids, phenols, and steroids that were detected in a more significant proportion in healthy plant samples. Through molecular networking, we observe that the fungal-infected plants synthesized twice as many metabolites from the shikimate natural products pathway than healthy plants. This is because the variation of environmental conditions can silence or activate biosynthetic pathways, which impact the synthesis or reduction of the production of secondary metabolites.
The propagation of structural annotations was also performed from unknown fragmentation mass spectrum analysis using the in silico tool Network Annotation Propagation (NAP), which yielded 62 metabolites putatively annotated from NAP-Fusion in silico prediction for fungal-infected plants and 45 for healthy plants samples. A Venn diagram represents the unique metabolites number and overlapped unique metabolites putatively annotated by classical Molecular Networking (MN), Dereplicator+, Moldiscovery, and NAP-fusion annotated metabolites obtained from fungal-infected plants (F) and healthy (H) plants (Figure 6).
A significant number of flavonoids and phenols were found in high abundance in healthy plant samples, which may be responsible for antimicrobial potential since they are metabolites that play a central role in plant defense against pathogen attacks [49]. The dereplication and data mining tools employed in this study provided chemical refinement of metabolomics results for exploration and guided the selection of candidates with antimicrobial potential.

2.3. Chemometrics Methods Applied to Orchidaceae Plants Spectral Analysis

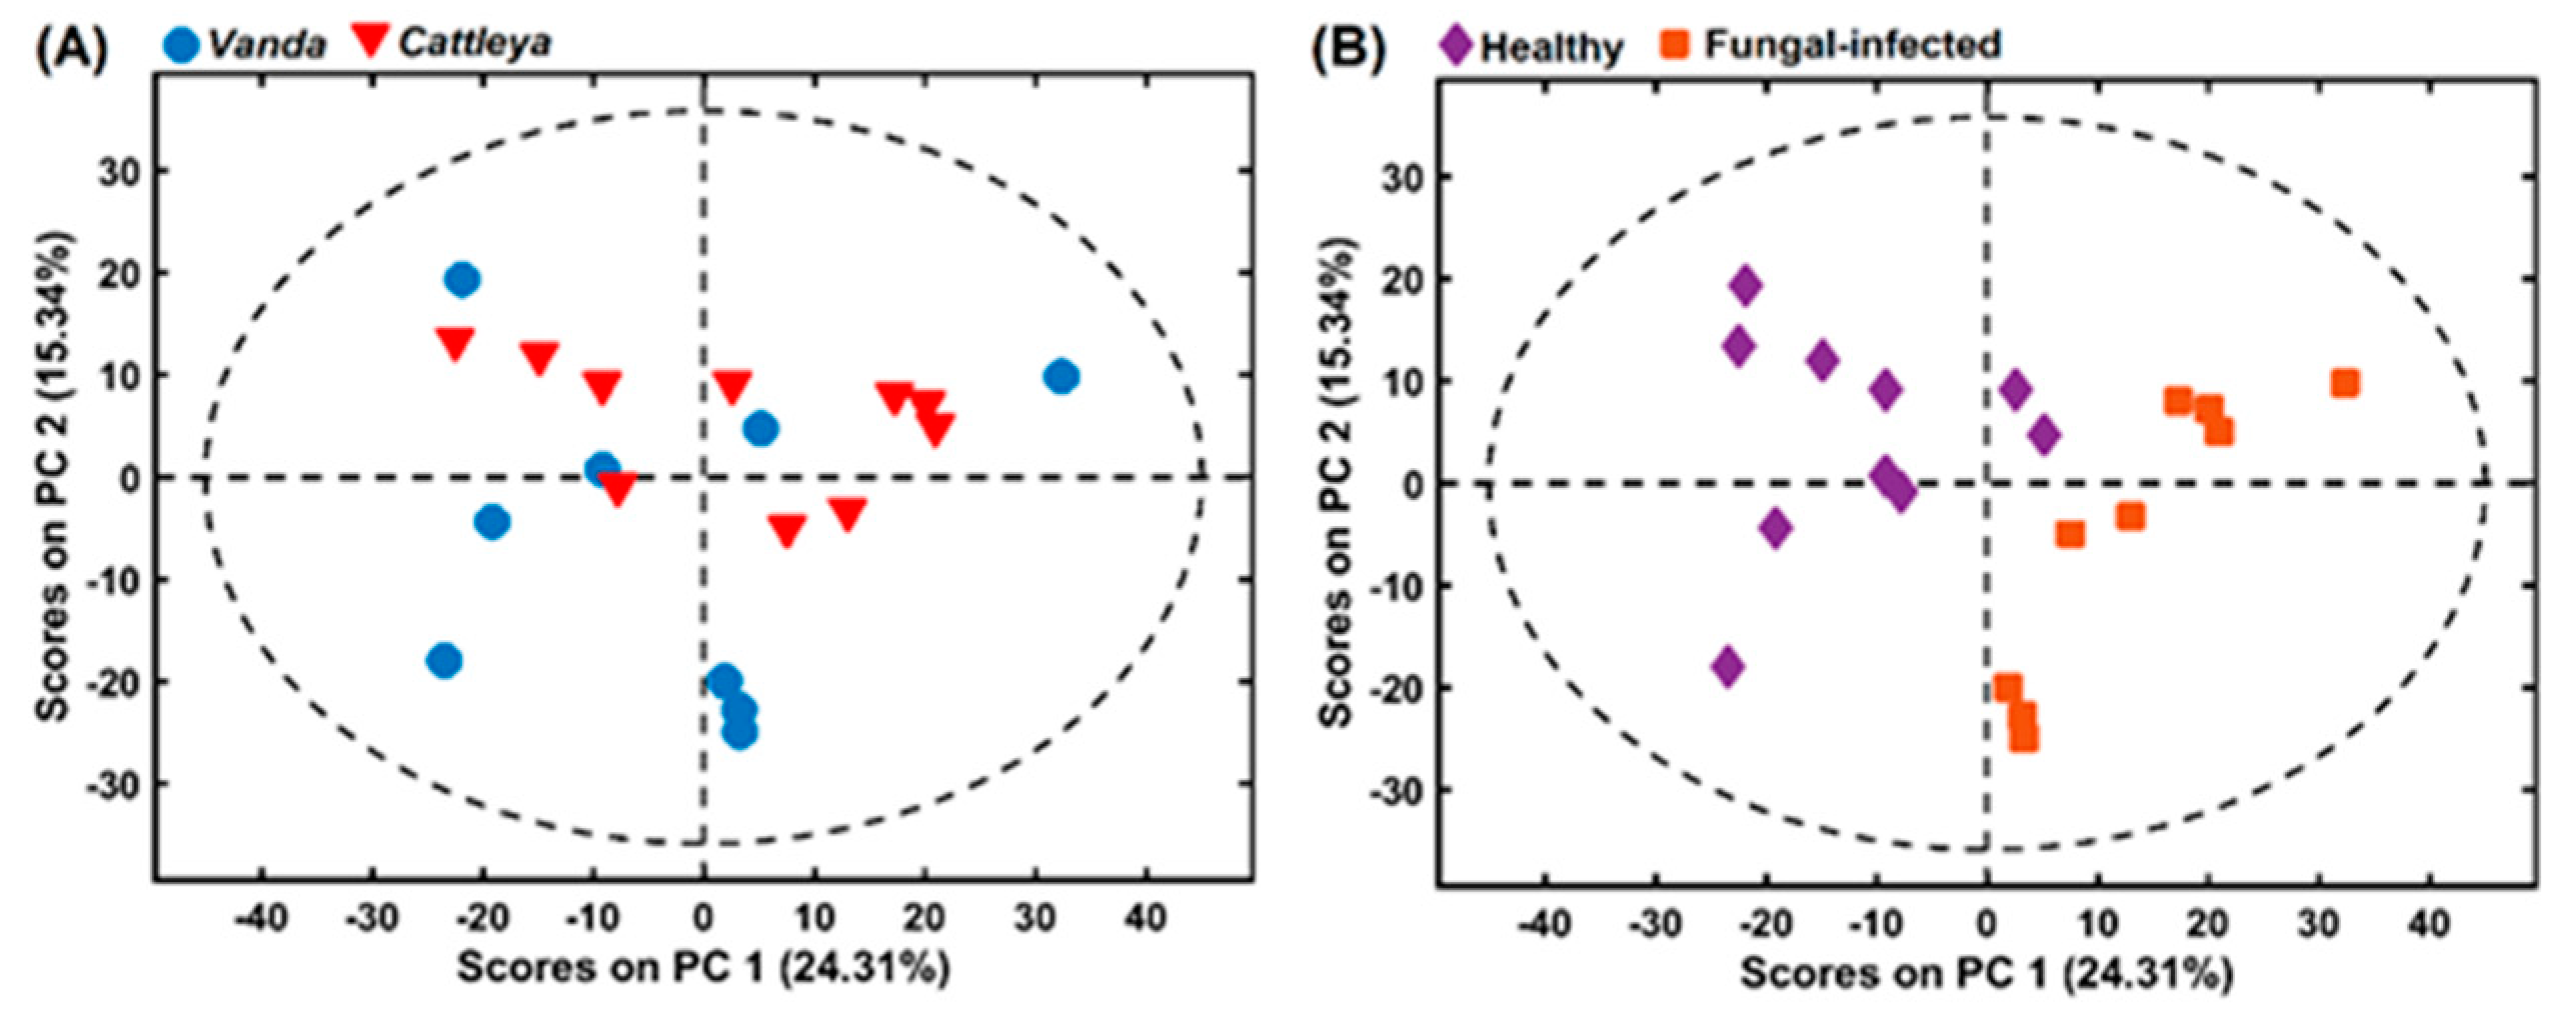
Principal component 1 (PC1) and PC2 explained 24.31% and 15.34% of the variation, respectively, as shown in Figure 7. Both Figure 7A,B are biplot scores of the same PCA, with (A) showing the genus (Vanda and Cattleya) differentiation and (B) the healthy and fungal-infected samples separation. In fact, only the healthy and fungal-infected separation was successful, mainly in the PC1. In this way, PLS-DA and OPS were applied to classify samples as healthy or fungal-infected to find the variables that contribute more to this separation.
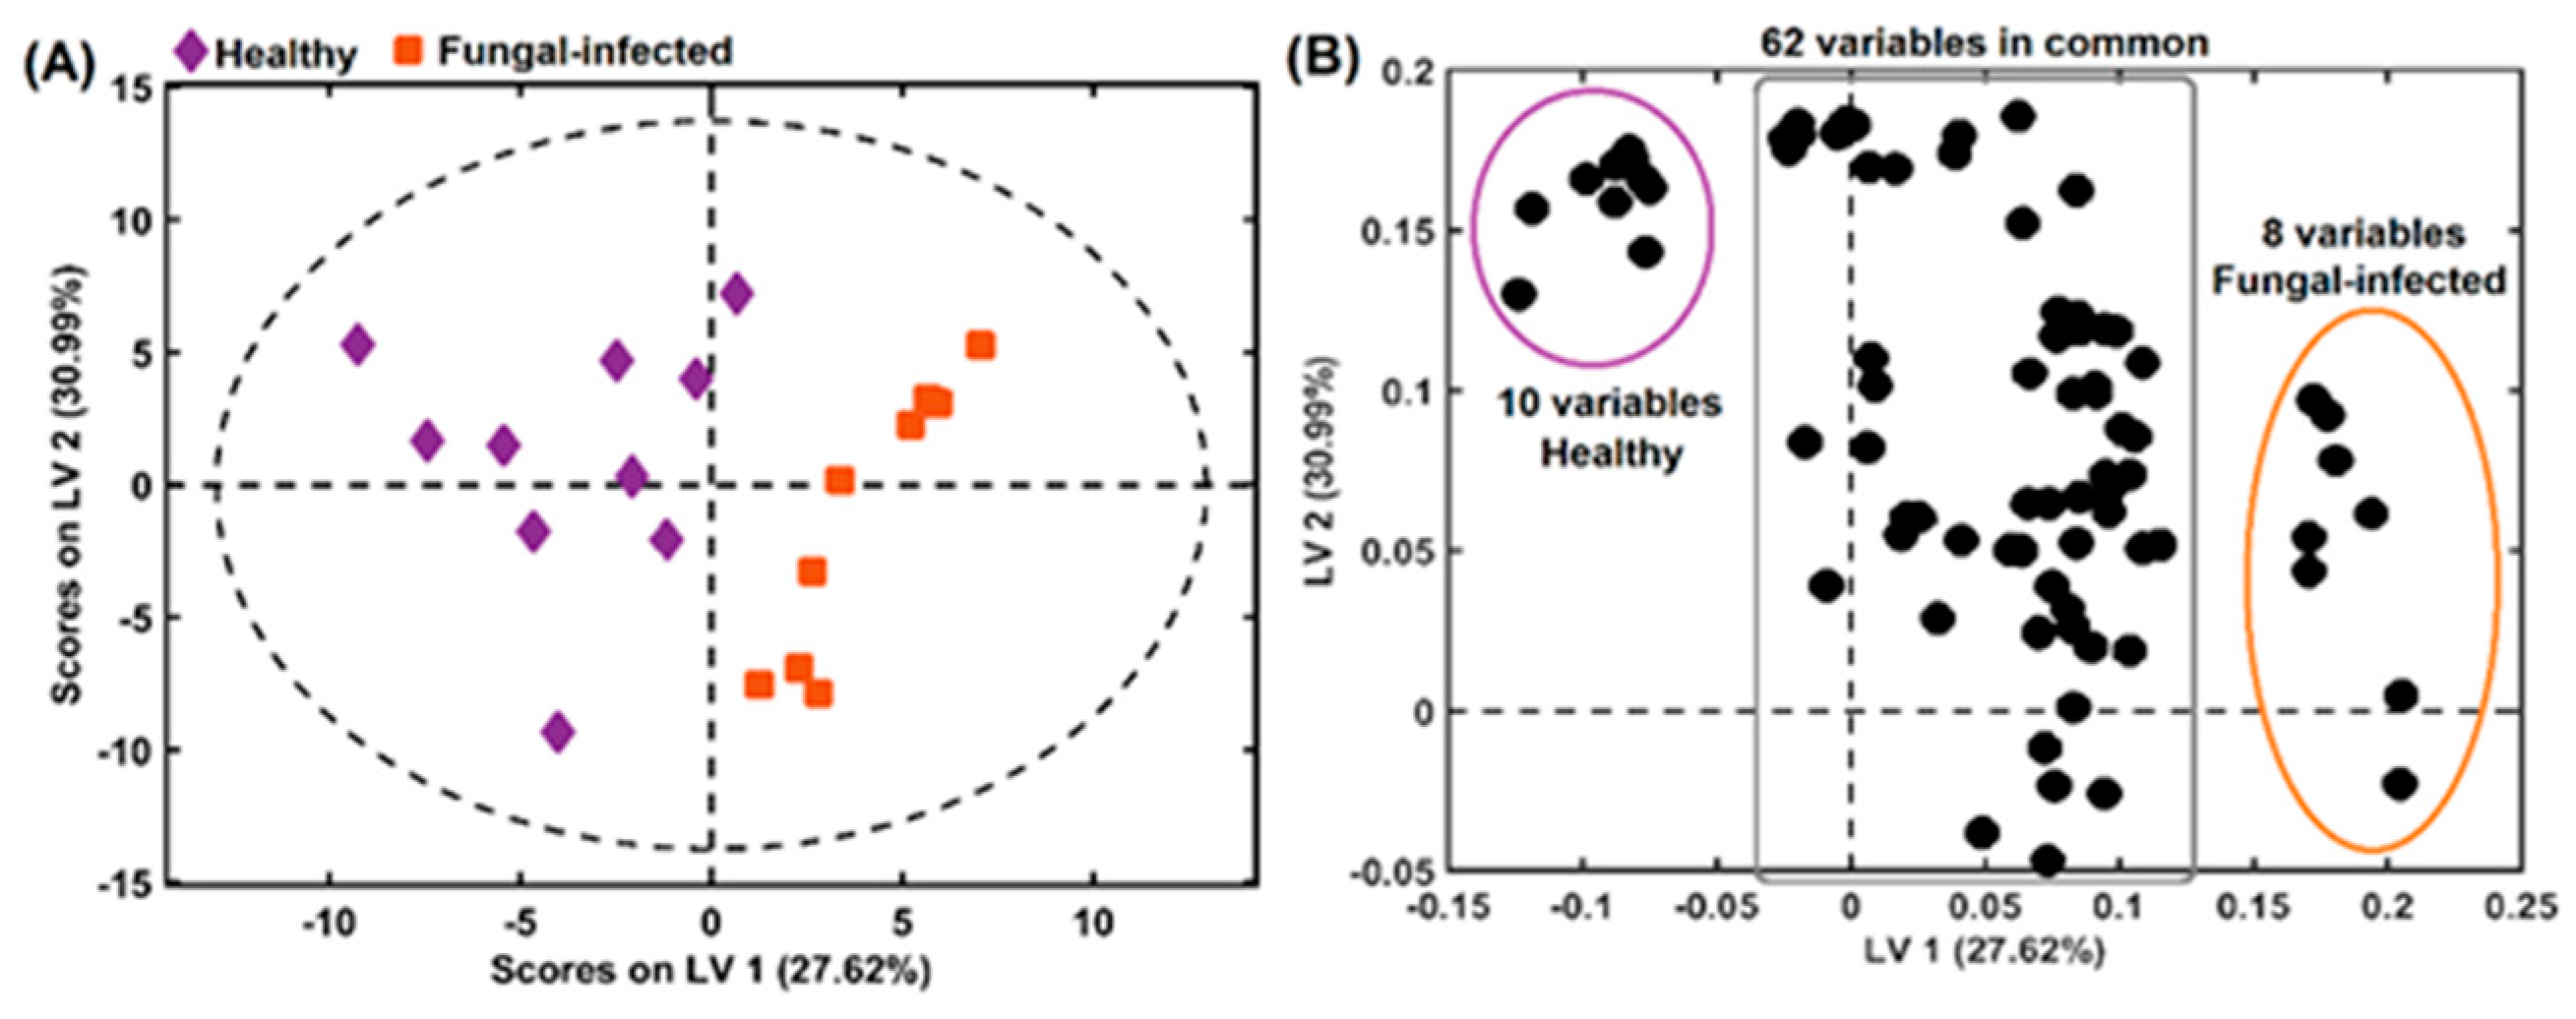
Figure 8A shows the PLS-DA scores with two latent variables (LV), explaining 58.61% of the variance with the selected variables by OPS. In this case, with the selection of only 80 variables for both classes (healthy and fungal-infected), the separation was accentuated in LV1, with 27.62% of explained variance. These 80 variables can be divided into three groups: 62 common variables between healthy and fungal-infected samples, and 10 healthy and 8 fungal-infected variables, as shown in Figure 8B. For each group (healthy or fungal-infected samples), the most important variables were the 10 and 8 different variables highlighted in the loadings plot (Figure 8B). These 18 variables were previously described in Table 1.
In the healthy samples group, the most important selected variables were loliolide (m/z 196.110), 4-methoxy-3-methylbenzaldehyde (m/z 150.068), erianin (m/z 318.146), isorhamnetin 3-galactoside (m/z 478.111), isovitexin 2″-O-arabinoside (m/z 564.148), cinnamic alcohol (m/z 134.073), tricin 5-glucoside (m/z 492.127), isoshaftoside (m/z 564.148), acacetin (m/z 284.068), and allobetulinol (m/z 442.381). Some of these variables were detected in both groups; however, the variable selection appears only in the healthy samples group.
For the fungal-infected group, the following variables were founded: 3-[2-(3-hydroxyphenyl) ethyl]-5-methoxyphenol (m/z 244.109), galaxolidone (m/z 272.177), 3-(4-hydroxy-3-methoxyphenyl) propyl 3-(4-hydroxyphenyl) (m/z 330.147), salidroside (m/z 300.147), rutin (m/z 610.153), gigantol (m/z 274.121), isovitexin (m/z 432.105), and homoorientin (m/z 448.100). Most of these variables were described earlier in this study as detected only in fungal-infected samples.
In summary, our findings in chemometric data analysis were supported by the comprehensive structural annotation of the metabolites, being an essential tool for discovering antifungal compounds from the Orchidaceae family.

3. Materials and Methods

3.1. Chemicals and Materials

Acetonitrile, n-hexane, and methanol HPLC-grade were purchased from Tedia Company (Fairfield,OH, USA). Formic acid, caffeine-13C3, and Supelclean C18 SPE cartridges (3 mL) were purchased from Sigma Aldrich (St. Louis, MO, USA). Progesterone-d9 was purchased from CDN Isotopes (Quebec, Canada). Ultrapure water was produced using a water purification system (Master System MS2000, Gehaka, São Paulo, Brazil) with a resistivity of 18.2 MΩcm.

3.2. Plant Material

Healthy and fungal-infected fresh leaves from five Vanda sp. and Cattleya sp. plants were collected from a private greenhouse in Lençois Paulista, São Paulo, Brazil (22°36′46.2″ S 48°50′02.1″ W). The plants were maintained at −80 °C until freeze-drying and sample preparation.

3.3. Sample Preparation

The fresh leaves were frozen at −80 °C and then freeze-drying for 72 h. The freeze-drying material was extracted with methanol. The solvent was removed using a Speedvac concentrator (Thermo Scientific Savant SPD131DDA). Subsequently, the extracts were submitted to a cleanup step (using SPE C18 cartridges) to eliminate chlorophyll and other interferences. The final extracted material (2 mL of methanol) was concentrated in a Speedvac concentrator. One milligram of dried extracts was made-up to 1 mL of methanol. This solution was diluted to 1:5 (v/v) in methanol, filtered (0.45 µm), and used in LC-MS analysis. Before the injections, the samples were spiked with a mixed standard solution (caffeine-13C3 and progesterone-d9, at 2.5 µg mL−1).

3.4. LC-HRMS Analysis

LC-HRMS/MS analyses were performed on an HPLC-UV 1220 Infinity II (Agilent Technologies) coupled with a Q-Exactive hybrid Quadrupole-Orbitrap high-resolution mass spectrometer (Thermo Scientific) as well as an electrospray ionization source. The column used in this study was an Infinity Lab Poroshell 120 EC-C18 column (4.6 × 100 mm × 2.7 μm Agilent). All samples were analyzed using a gradient elution program. The binary mobile phase comprised A (water with 0.1% formic acid) and B (methanol). The gradient elution started at 5% (B) and linearly increased to 100% (B) in 40 min and kept constant for 10 min at 100% (B). The eluent was restored to the initial conditions in 10 min. The flow rate was set at 0.3 mL min−1. The injection volume was 30 μL, and the column temperature was set at 35 °C. The electrospray ionization was operating with the following parameters: spray voltage 3.5 kV; capillary temperature: 269 °C; S-lens RF level 50 V; sheath gas flow rate at 53 L min−1; aux gas flow rate at 14 L min−1; sweep gas flow rate 3 L min−1. The high-resolution mass spectrometry (HRMS) was obtained under full MS/dd-MS2 mode. The mass range in the full MS scanning experiments was m/z 80–1200. The top 5 (TopN, 5, loop count 5) most abundant precursors were sequentially transferred for collision for fragmentation acquisition. The collision energy for target analytes was 20, 30, and 35 eV. Resolving power was set at 140,000 and 70,000 for full MS and dd-MS2 acquisitions, respectively.

3.5. Compound Characterization

The files acquired in the Q-Exactive hybrid Quadrupole-Orbitrap mass spectrometer for the methanolic extracts were converted from raw into (.mzML) format using MSConvert software (ProteoWizard, Palo Alto, CA, US) before being processed using MZmine software, version 2.53. We used metadata to organize compound information according to the Global Natural Products Social Molecular Networking (GNPS) online workflow (https://ccms-ucsd.github.io/GNPSDocumentation/ (accessed on 16 August 2022).
Metabolite annotations were based on searching the experimental spectra against the GNPS spectral library using the tools Classical Molecular Networking—MN [20], Feature-Based Molecular Networking—FBMN [33], DEREPLICATOR+ [21], Network Annotation Propagation—NAP [22], MOLDISCOVERY [23], MS2LDA [31], MolNetEnhancer [32], and analysis of chromatographic data such as retention time and UV spectra.

3.6. Chemometric Data Analysis

Twenty samples were used in data analysis: ten Vanda and ten Cattleya samples, using five healthy and five fungal-infected of each genus. The obtained .raw files were converted into .cdf format and imported to Matlab R2020a (Math Works, Natick, MA, USA), where all chemometric tools were applied.
An exploratory data analysis was carried out using principal component analysis (PCA) [50] to visualize the Vanda and Cattleya genus and healthy and fungal-infected samples in multidimensional space. PCA was carried out on the normalized and autoscale dataset with twenty samples and 1,021,894 variables (m/z 80 to 1200).
Additionally, partial least squares for discriminant analysis (PLS-DA) [51], a classification method based on PLS regression, was applied in healthy and fungal-infected samples. The ordered predictors selection (OPS) [52], a variable selection method adapted for classification, was applied to find the more essential and interpretative variables for healthy and fungal-infected classification.

4. Conclusions

In this study, we presented the application of the integrated metabolomics approach and the state-of-the-art computational tools to provide acute insights regarding the characterization of phytochemicals of healthy and fungal-infected leaves from Vanda and Cattleya species. The data analysis pipelines of untargeted metabolomics analysis enabled the characterization of a considerable variation in compounds belonging primarily to the class of flavonoids, phenolic acids, chromones, stilbenoids, tannins, terpenoids, and steroids. Flavonoids were identified as the major compounds in both species independent of the physiological condition (healthy or fungal-infected). The flavonoids afrormosin, acacetin, and stilbenoids were found chiefly in fungal-infected plants, while nitrogen compounds were found predominantly in samples from healthy plants. The tricin derivative flavonoid, and the loliolide terpenoid were found only in healthy plants. From the dereplication and in silico fragmentation tools, 202 and 145 unique metabolites were detected in healthy, and fungal-infected Cattleya leaves. For the genus Vanda, 166 and 146 unique metabolites were detected in healthy and fungal-infected leaves. The integrated metabolomics approach and the combination of structural annotation, data mining, and chemometric tools could be applied as a reference dataset for MS/MS-based untargeted metabolomic analysis of species from the Orchidaceae. In addition, based on the interesting results shown in the present study, the model data on the molecular annotation adopted here may be further explored with high efficiency through other species from the Orchidaceae family.

Author Contributions

Conceptualization, G.S.L., N.M.L., G.F.d.S. and B.G.V.; methodology, G.S.L., G.F.d.S., N.M.L., D.V.A.d.A., J.V.A.O. and J.V.R.; writing—original draft preparation, G.S.L., N.M.L. and J.V.R.; writing—review and editing, G.F.d.S. A.R.C. and B.G.V.; supervision, B.G.V.; funding acquisition, A.R.C. and B.G.V. All authors have read and agreed to the published version of the manuscript.

Funding

This research received no external funding.

Institutional Review Board Statement

Not applicable.

Informed Consent Statement

Not applicable.

Data Availability Statement

All support data used in this study are available from the authors.

Acknowledgments

The authors acknowledge financial support from the Coordenação de Aperfeiçoamento de Pessoal de Nível Superior (CAPES), Conselho Nacional de Desenvolvimento Científico e Tecnológico (CNPq) for the institutional and financial support. The authors thank Antonio dos Santos for the Orchidaceae samples used in this study.

Conflicts of Interest

The authors declare no conflict of interest.

References

  1. Gao, Y.; Ji, J.; Zhang, Y.; Yang, N.; Zhang, M. Biochemical and transcriptomic analyses of the symbiotic interaction between Cremastra appendiculata and the mycorrhizal fungus Coprinellus disseminatus. BMC Plant Biol. 2022, 22, 15. [Google Scholar] [CrossRef] [PubMed]
  2. Natta, S.; Mondol, S.A.; Pal, K.; Mandal, S.; Sahana, N.; Pal, R.; Pandit, G.K.; Alam, B.K.; Das, S.S.; Biswas, S.S.; et al. Chemical composition, antioxidant activity and bioactive constituents of six native endangered medicinal orchid species from north-eastern Himalayan region of India. S. Afr. J. Bot. 2022, 150, 248–259. [Google Scholar] [CrossRef]
  3. Gutiérrez, R.M.P. Orchids: A Review of Uses in Traditional Medicine, Its Phytochemistry and Pharmacology. J. Med. Plants Res. 2010, 4, 592–638. [Google Scholar] [CrossRef]
  4. Fisch, M.; Flick, B.H.; Arditti, J. Structure and antifungal activity of hircinol, loroglossol and orchinol. Phytochemistry 1973, 12, 437–441. [Google Scholar] [CrossRef] [Green Version]
  5. Auberon, F.; Olatunji, O.J.; Raminoson, D.; Muller, C.D.; Soengas, B.; Bonté, F.; Lobstein, A. Isolation of novel stilbenoids from the roots of Cyrtopodium paniculatum (Orchidaceae). Fitoterapia 2017, 116, 99–105. [Google Scholar] [CrossRef]
  6. Xiao, K.; Zhang, H.-J.; Xuan, L.-J.; Zhang, J.; Xu, Y.-M.; Bai, D.-L. Stilbenoids: Chemistry and Bioactivities. Stud. Nat. Prod. Chem. 2008, 34, 453–646. [Google Scholar] [CrossRef]
  7. Ward, E.W.B.; Unwin, C.H.; Stoells, A. Loroglossol: An Orchid Phytoalexin. Phytopathology 1975, 65, 632–633. [Google Scholar] [CrossRef]
  8. Ióca, L.P.; Romminger, S.; Santos, M.F.C.; Bandeira, K.F.; Rodrigues, F.T.; Kossuga, M.H.; Nicacio, K.J.; Ferreira, E.L.F.; Morais-Urano, R.P.; Passos, M.S.; et al. A strategy for the rapid identification of fungal metabolites and the discovery of the antiviral activity of pyrenocine a and harzianopyridone. Quím. Nova 2016, 39, 720–731. [Google Scholar] [CrossRef]
  9. Lima, N.M.; Andrade, T.J.A.S.; Silva, D.H.S. Dereplication of terpenes and phenolic compounds from Inga edulis extracts using HPLC-SPE-TT, RP-HPLC-PDA and NMR spectroscopy. Nat. Prod. Res. 2022, 36, 488–492. [Google Scholar] [CrossRef]
  10. Kind, T.; Fiehn, O. Seven Golden Rules for heuristic filtering of molecular formulas obtained by accurate mass spectrometry. BMC Bioinform. 2007, 8, 105. [Google Scholar] [CrossRef]
  11. Hubert, J.; Nuzillard, J.-M.; Renault, J.-H. Dereplication strategies in natural product research: How many tools and methodologies behind the same concept? Phytochem. Rev. 2017, 16, 55–95. [Google Scholar] [CrossRef]
  12. Weidt, S.; Haggarty, J.; Kean, R.; Cojocariu, C.I.; Silcock, P.J.; Rajendran, R.; Ramage, G.; Burgess, K.E.V. A novel targeted/untargeted GC-Orbitrap metabolomics methodology applied to Candida albicans and Staphylococcus aureus biofilms. Metabolomics 2016, 12, 1–10. [Google Scholar] [CrossRef] [Green Version]
  13. Wolfender, J.-L.; Terreaux, C.; Hostettmann, K. The Importance Of LC-MS And LC-NMR in the Discovery of New Lead Compounds from Plants. Pharm. Biol. 2000, 38, 41–54. [Google Scholar] [CrossRef] [Green Version]
  14. Bitzer, J.; Köpcke, B.; Stadler, M.; Hellwig, V.; Ju, Y.-M.; Seip, S.; Henkel, T. Accelerated Dereplication of Natural Products, Supported by Reference Libraries. Chimia 2007, 61, 332–338. [Google Scholar] [CrossRef]
  15. Carter, G.T. NP/MS since 1970: From the basement to the bench top. Nat. Prod. Rep. 2014, 31, 711–717. [Google Scholar] [CrossRef]
  16. Phapale, P.; Palmer, A.; Gathungu, R.M.; Kale, D.; Brügger, B.; Alexandrov, T. Public LC-Orbitrap-MS/MS Spectral Library for Metabolite Identification. bioRxiv 2020. [Google Scholar] [CrossRef]
  17. Kuhl, C.; Tautenhahn, R.; Böttcher, C.; Larson, T.R.; Neumann, S. CAMERA: An Integrated Strategy for Compound Spectra Extraction and Annotation of Liquid Chromatography/Mass Spectrometry Data Sets. Anal. Chem. 2012, 84, 283–289. [Google Scholar] [CrossRef] [Green Version]
  18. Wernisch, S.; Pennathur, S. Evaluation of coverage, retention patterns, and selectivity of seven liquid chromatographic methods for metabolomics. Anal. Bioanal. Chem. 2016, 408, 6079–6091. [Google Scholar] [CrossRef] [Green Version]
  19. Brodsky, L.; Moussaieff, A.; Shahaf, N.; Aharoni, A.; Rogachev, I. Evaluation of Peak Picking Quality in LC−MS Metabolomics Data. Anal. Chem. 2010, 82, 9177–9187. [Google Scholar] [CrossRef]
  20. Wang, M.; Carver, J.J.; Phelan, V.V.; Sanchez, L.M.; Garg, N.; Peng, Y.; Nguyen, D.D.; Watrous, J.; Kapono, C.A.; Luzzatto-Knaan, T.; et al. Sharing and community curation of mass spectrometry data with Global Natural Products Social Molecular Networking. Nat. Biotechnol. 2016, 34, 828–837. [Google Scholar] [CrossRef]
  21. Mohimani, H.; Gurevich, A.; Shlemov, A.; Mikheenko, A.; Korobeynikov, A.; Cao, L.; Shcherbin, E.; Nothias, L.-F.; Dorrestein, P.C.; Pevzner, P.A. Dereplication of microbial metabolites through database search of mass spectra. Nat. Commun. 2018, 9, 1–12. [Google Scholar] [CrossRef] [PubMed] [Green Version]
  22. Da Silva, R.R.; Wang, M.; Nothias, L.-F.; Van Der Hooft, J.J.J.; Caraballo-Rodríguez, A.M.; Fox, E.; Balunas, M.J.; Klassen, J.L.; Lopes, N.P.; Dorrestein, P.C. Propagating annotations of molecular networks using in silico fragmentation. PLoS Comput. Biol. 2018, 14, e1006089. [Google Scholar] [CrossRef] [PubMed]
  23. Cao, L.; Guler, M.; Tagirdzhanov, A.; Lee, Y.-Y.; Gurevich, A.; Mohimani, H. MolDiscovery: Learning mass spectrometry fragmentation of small molecules. Nat. Commun. 2021, 12, 1–13. [Google Scholar] [CrossRef] [PubMed]
  24. Reginaldo, F.P.S.; Bueno, P.C.P.; de Matos, I.C.C.; de Araújo Roque, A.R.; Fett-Neto, A.G.; Cavalheiro, A.J.; Giordani, R.B. Molecular Networking Discloses the Chemical Diversity of Flavonoids and Selaginellins in Selaginella convoluta. Planta Med. 2021, 87, 113–123. [Google Scholar] [CrossRef] [PubMed]
  25. Chacon, D.S.; Santos, M.D.M.; Bonilauri, B.; Vilasboa, J.; da Costa, C.T.; da Silva, I.B.; Torres, T.d.M.; de Araújo, T.F.; Roque, A.D.A.; Pilon, A.C.; et al. Non-target molecular network and putative genes of flavonoid biosynthesis in Erythrina velutina Willd., a Brazilian semiarid native woody plant. Front. Plant Sci. 2022, 13, 947558. [Google Scholar] [CrossRef]
  26. Yáñez-Barrientos, E.; González-Ibarra, A.A.; Wrobel, K.; Wrobel, K.; Corrales-Escobosa, A.R.; Alonso-Castro, A.J.; Carranza-Álvarez, C.; Ponce-Hernández, A.; Isiordia-Espinoza, M.A.; Ortiz-Andrade, R.; et al. Antinociceptive effects of Laelia anceps Lindl. and Cyrtopodium macrobulbon (Lex.) G.A. Romero & Carnevali, and comparative evaluation of their metabolomic profiles. J. Ethnopharmacol. 2022, 291, 115172. [Google Scholar] [CrossRef]
  27. Li, X.; Wang, P.; Tong, Y.; Liu, J.; Shu, G. UHPLC-Q-Exactive Orbitrap MS/MS-Based Untargeted Metabolomics and Molecular Networking Reveal the Differential Chemical Constituents of the Bulbs and Flowers of Fritillaria thunbergii. Molecules 2022, 27, 6944. [Google Scholar] [CrossRef]
  28. Gomes, P.W.P.; Barretto, H.; Reis, J.D.E.; Muribeca, A.; Veloso, A.; Albuquerque, C.; Teixeira, A.; Braamcamp, W.; Pamplona, S.; Silva, C.; et al. Chemical Composition of Leaves, Stem, and Roots of Peperomia pellucida (L.) Kunth. Molecules 2022, 27, 1847. [Google Scholar] [CrossRef]
  29. Delporte, C.; Noret, N.; Vanhaverbeke, C.; Hardy, O.J.; Martin, J.; Tremblay-franco, M.; Touboul, D.; Gorel, A.; Faes, M.; St, C.; et al. Does the Phytochemical Diversity of Wild Plants Like the Erythrophleum Genus Correlate with Geographical Origin? Molecules 2021, 26, 1668. [Google Scholar] [CrossRef]
  30. Sumner, L.W.; Amberg, A.; Barrett, D.; Beale, M.H.; Beger, R.; Daykin, C.A.; Fan, T.W.-M.; Fiehn, O.; Goodacre, R.; Griffin, J.L.; et al. Proposed minimum reporting standards for chemical analysis. Chemical Analysis Working Group (CAWG) Metabolomics Standards Initiative (MSI). Metabolomics 2007, 3, 211–221. [Google Scholar] [CrossRef]
  31. Van der Hooft, J.J.J.; Wandy, J.; Barrett, M.P.; Burgess, K.E.V.; Rogers, S. Topic modeling for untargeted substructure exploration in metabolomics. Proc. Natl. Acad. Sci. USA 2016, 113, 13738–13743. [Google Scholar] [CrossRef] [Green Version]
  32. Ernst, M.; Kang, K.B.; Caraballo-Rodríguez, A.M.; Nothias, L.-F.; Wandy, J.; Chen, C.; Wang, M.; Rogers, S.; Medema, M.H.; Dorrestein, P.C.; et al. MolNetEnhancer: Enhanced Molecular Networks by Integrating Metabolome Mining and Annotation Tools. Metabolites 2019, 9, 144. [Google Scholar] [CrossRef] [Green Version]
  33. Nothias, L.-F.; Petras, D.; Schmid, R.; Dührkop, K.; Rainer, J.; Sarvepalli, A.; Protsyuk, I.; Ernst, M.; Tsugawa, H.; Fleischauer, M.; et al. Feature-based molecular networking in the GNPS analysis environment. Nat. Methods 2020, 17, 905–908. [Google Scholar] [CrossRef]
  34. Arora, M.; Mahajan, A.; Sembi, J.K. A review on phytochemical and pharmacological potential of family orchidaceae. Int. Res. J. Pharm. 2017, 8, 9–24. [Google Scholar] [CrossRef]
  35. Huang, L.-M.; Huang, H.; Chuang, Y.-C.; Chen, W.-H.; Wang, C.-N.; Chen, H.-H. Evolution of Terpene Synthases in Orchidaceae. Int. J. Mol. Sci. 2021, 22, 6947. [Google Scholar] [CrossRef]
  36. Diwan, D.; Rashid, M.; Vaishnav, A. Current understanding of plant-microbe interaction through the lenses of multi-omics approaches and their benefits in sustainable agriculture. Microbiol. Res. 2022, 265, 127180. [Google Scholar] [CrossRef]
  37. Blanco-Ulate, B.; Vincenti, E.; Cantu, D.; Powell, A.L.T. Ripening of Tomato Fruit and Susceptibility to Botrytis Cinerea. In Botrytis—the Fungus, the Pathogen and its Management in Agricultural Systems; Fillinger, S., Elad, Y., Eds.; Springer: Cham, Switzerland, 2016; pp. 387–412. [Google Scholar] [CrossRef]
  38. Amaral, J.; Valledor, L.; Alves, A.; Martín-García, J.; Pinto, G. Studying tree response to biotic stress using a multi-disciplinary approach: The pine pitch canker case study. Front. Plant Sci. 2022, 13, 916138. [Google Scholar] [CrossRef]
  39. Gobbo-Neto, L.; Lopes, N.P. Plantas Medicinais: Fatores de Influência No Conteúdo de Metabólitos Secundários. Quim. Nova 2007, 30, 374–381. [Google Scholar] [CrossRef] [Green Version]
  40. Mwangangi, I.M.; Büchi, L.; Haefele, S.M.; Bastiaans, L.; Runo, S.; Rodenburg, J. Combining host plant defence with targeted nutrition: Key to durable control of hemiparasitic Striga in cereals in sub–Saharan Africa? New Phytol. 2021, 230, 2164–2178. [Google Scholar] [CrossRef]
  41. Hammond-Kosack, K.; Jones, J. Responses to Plant Pathogens. In Biochemistry and Molecular Biology of Plants; Buchanan, B., Gruissem, W., Jones, R.L., Eds.; Wiley: Rockville, MD, USA, 2000; pp. 1102–1156. [Google Scholar]
  42. Stevens, E.J.; Bates, K.A.; King, K.C. Host microbiota can facilitate pathogen infection. PLoS Pathog. 2021, 17, e1009514. [Google Scholar] [CrossRef]
  43. Casadevall, A.; Pirofski, L.-A. Host-Pathogen Interactions: Basic Concepts of Microbial Commensalism, Colonization, Infection, and Disease. Infect. Immun. 2000, 68, 6511–6518. [Google Scholar] [CrossRef] [PubMed] [Green Version]
  44. De Wit, P.J.G.M. How plants recognize pathogens and defend themselves. Cell. Mol. Life Sci. 2007, 64, 2726–2732. [Google Scholar] [CrossRef] [PubMed]
  45. Zhou, J.-M.; Ibrahim, R.K. Tricin—A potential multifunctional nutraceutical. Phytochem. Rev. 2010, 9, 413–424. [Google Scholar] [CrossRef]
  46. Wang, J.; Wei, X.; Qin, X.; Tian, X.; Liao, L.; Li, K.; Zhou, X.; Yang, X.; Wang, F.; Zhang, T.; et al. Antiviral Merosesquiterpenoids Produced by the Antarctic Fungus Aspergillus ochraceopetaliformis SCSIO 05702. J. Nat. Prod. 2016, 79, 59–65. [Google Scholar] [CrossRef] [PubMed]
  47. Mattio, L.; Catinella, G.; Iriti, M.; Vallone, L. Inhibitory activity of stilbenes against filamentous fungi. Ital. J. Food Saf. 2021, 10, 8461. [Google Scholar] [CrossRef]
  48. Dvorakova, M.; Landa, P. Anti-inflammatory activity of natural stilbenoids: A review. Pharmacol. Res. 2017, 124, 126–145. [Google Scholar] [CrossRef]
  49. Samanta, A.; Das, G.; Das, S.K. Roles of Flavonoids in Plants. Int. J. Pharm. Sci. Technol. 2011, 6, 12–35. [Google Scholar]
  50. Bro, R.; Smilde, A.K. Principal component analysis. Anal. Methods 2014, 6, 2812–2831. [Google Scholar] [CrossRef] [Green Version]
  51. Barker, M.; Rayens, W. Partial least squares for discrimination. J. Chemom. 2003, 17, 166–173. [Google Scholar] [CrossRef]
  52. Roque, J.V.; Cardoso, W.; Peternelli, L.A.; Teófilo, R.F. Comprehensive new approaches for variable selection using ordered predictors selection. Anal. Chim. Acta 2019, 1075, 57–70. [Google Scholar] [CrossRef]
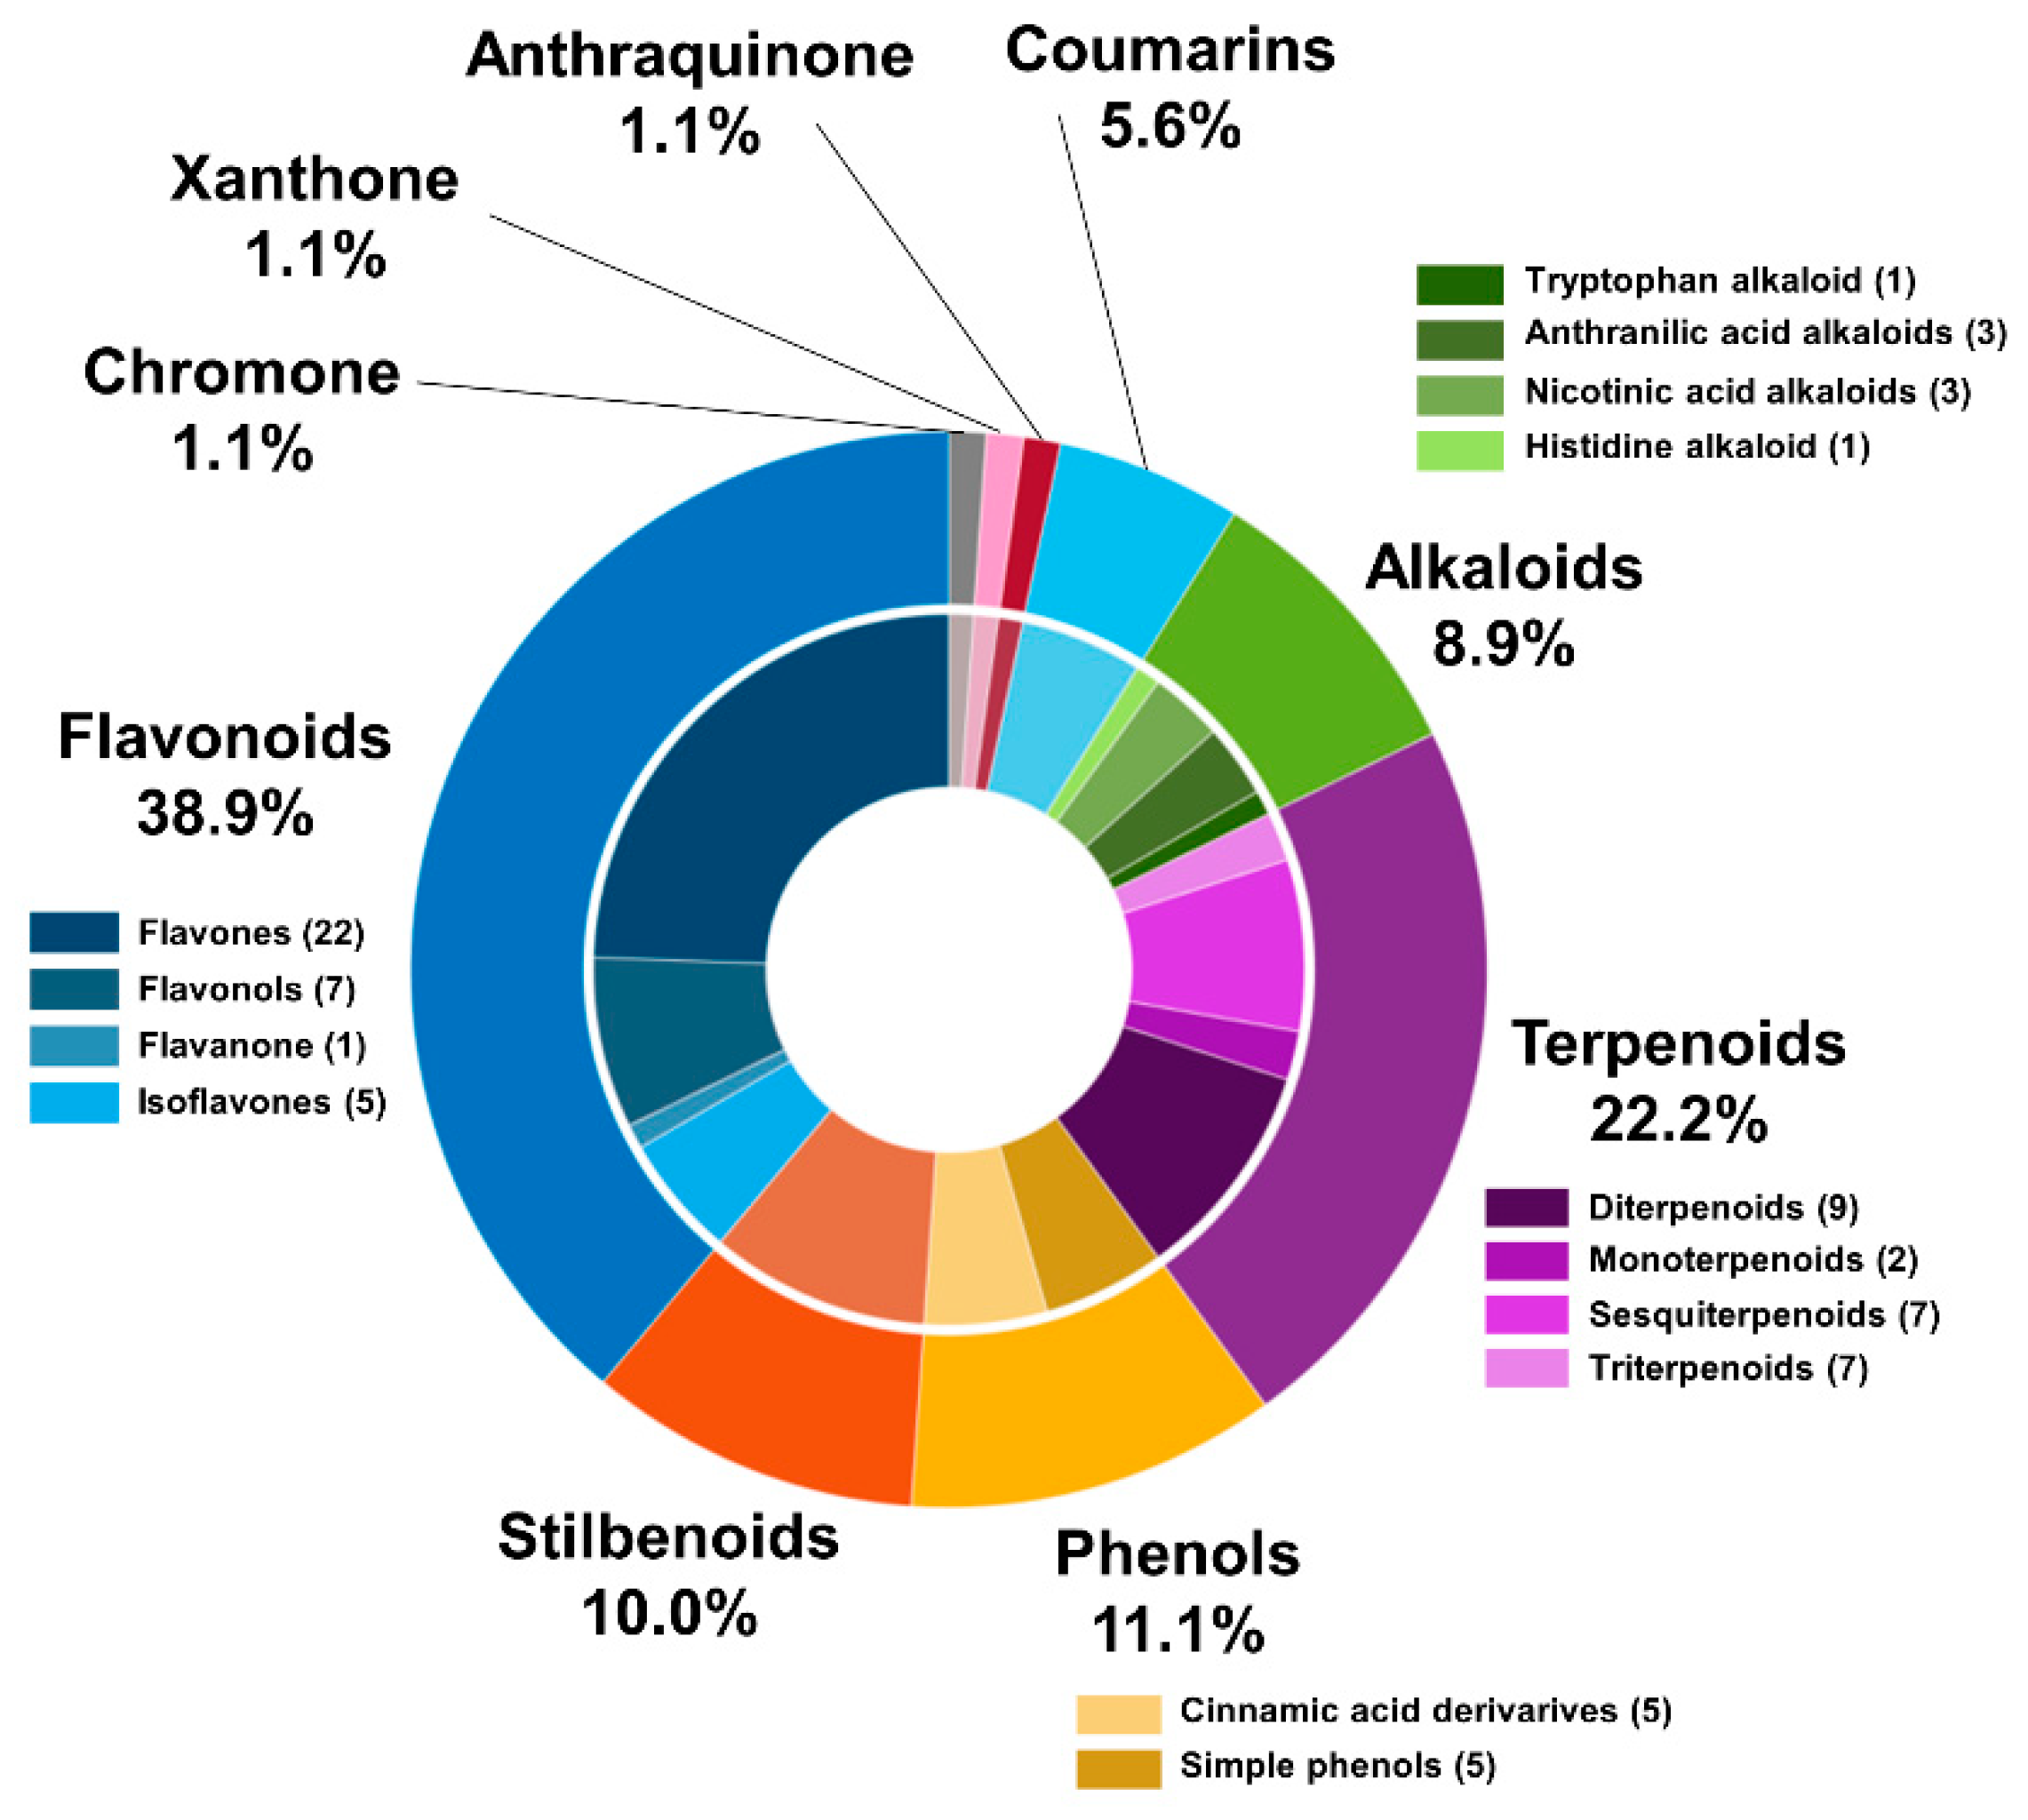
Figure 1. Chemical classes of the compounds annotated from Vanda and Cattleya genera obtained by LC-HRMS/MS in positive ion mode ESI.
Molecules 27 07937 g001
Figure 2. A 3D visualization of the chromatogram from (A) Cattleya fungal-infected (yellow) and healthy (pink) species; and (B) Vanda fungal-infected (green) and healthy (blue) species.
Molecules 27 07937 g002
Figure 3. Molecular families annotated by classical molecular networking (MN) of the samples from fungal-infected plants (green) and healthy plants (yellow) and the metabolites found through GNPS library hits.
Molecules 27 07937 g003
Figure 4. Variation of the metabolic dynamic of stilbenoids in fungal-infected plants (orange) and healthy (violet) plants.
Molecules 27 07937 g004
Figure 5. Nodes number detected through MolNetEnhancer at the “superclass” level for the samples of fungal-infected plants (F) and healthy (H) plants.
Molecules 27 07937 g005
Figure 6. Venn diagram for the unique metabolites number and NAP-fusion annotated obtained of the workflows classical Molecular Networking (MN), Dereplicator+, Moldiscovery, and NAP from fungal-infected plants (F) and healthy (H) plants.
Molecules 27 07937 g006
Figure 7. Samples visualization in 2-D space using scores from PCA with (A) Vanda and Cattleya and (B) healthy and fungal-infected samples. PC: principal component.
Molecules 27 07937 g007
Figure 8. (A) Samples visualization in 2-D space using scores from PLS-DA obtained with OPS variable selection and (B) loadings from 80 variables selected to improve healthy and fungal-infected samples classification. LV: Latent variable.
Molecules 27 07937 g008
Table 1. Results of the metabolite annotation from Orchidaceae species (Vanda and Cattleya) through LC-HRMS/MS analysis in positive ion mode ESI.
GenusRT (Min)Exact MassMolecular FormulaMetabolite NameChemical Class
Vanda1.72122.037C7H6O24-HydroxybenzaldehydePhenolic acid
Vanda1.77124.052C7H8O23-hydroxybenzyl alcoholBenzenoid
Vanda24.22134.073C9H10OCinnamic alcoholPhenylpropanoid
Vanda/Cattleya2.02150.068C9H10O24-methoxy-3-methylbenzaldehydeBenzenoid
Vanda28.78162.068C10H10O24-Methylcinnamic acidPhenylpropanoid
Vanda1.72164.047C9H8O3p-coumaric acidPhenylpropanoid
Cattleya12.53168.042C8H8O4Benzoic acid, 2,4-dihydroxy-, methyl esterPhenolic acid
Vanda20.78196.110C11H16O3LoliolideTerpenoid
Vanda29.26210.089C11H14O4Sinapyl alcoholPhenylpropanoid
Vanda/Cattleya16.80224.068C11H12O5Sinapic acidPhenylpropanoid
Vanda/Cattleya22.06242.094C15H14O3ThunalbeneStilbenoid
Vanda/Cattleya29.32244.109C15H16O33-[2-(3-hydroxyphenyl)ethyl]-5-methoxyphenolStilbenoid
Cattleya31.36254.058C15H10O4DaidzeinIsoflavonoid
Vanda27.28256.074C15H12O4LiquiritigeninFlavonoid
Vanda/Cattleya33.93258.125C16H18O33′-O-Methylbatatasin IIIStilbenoid
Vanda/Cattleya 260.104C15H16O4TristinStilbenoid
Vanda/Cattleya30.11260.105C15H16O4Dendrosinene BStilbenoid
Vanda33.56266.094C17H14O34′-Methoxy-6-methylflavoneFlavonoid
Vanda/Cattleya39.50272.177C18H24O2GalaxolidoneTerpenoid
Vanda/Cattleya28.65274.121C16H18O4GigantolStilbenoid
Vanda/Cattleya32.23274.121C16H18O43-Methoxy-5-[2-(3-methoxyphenyl)ethyl]-1,2-benzenediolStilbenoid
Cattleya31.93284.068C16H12O5AcacetinFlavonoid
Vanda/Cattleya31.68289.143C17H20O43-O-MethylgigantolStilbenoid
Cattleya34.35298.084C17H14O5AfrormosinIsoflavonoid
Cattleya10.01300.120C14H20O7SalidrosidePhenol
Vanda36.41300.136C18H20O42,3,5,7-tetramethoxy-9,10-dihydrophenanthreneStilbenoid
Vanda/Cattleya31.44318.146C18H22O5ErianinStilbenoid
Vanda31.22330.147C19H22O53-(4-hydroxy-3-methoxyphenyl)propyl 3-(4-hydroxyphenyl)propanoatePhenol
Cattleya26.91348.209C24H28O2BexaroteneTerpenoid
Vanda/Cattleya22.81374.230C19H34O7(2R,3S,4S,5R,6R)-2-(hydroxymethyl)-6-[4-(4-hydroxy-2,6,6-trimethylcyclohexen-1-yl)butan-2-yloxy]oxane-3,4,5-triolTerpenoid
Vanda/Cattleya17.70389.217C19H32O8(2R)-4-[(1S)-1-Hydroxy-2,6,6-trimethyl-4-oxo-2-cyclohexen-1-yl]-2-butanyl beta-D-glucopyranosideTerpenoid
Vanda/Cattleya35.31390.204C22H30O67b,9-Dihydroxy-3-(hydroxymethyl)-1,1,6,8-tetramethyl-5-oxo-1,1a,1b,4,4a,5,7a,7b,8,9-decahydro-9aH-cyclopropa [3,4]benzo [1,2-e]azulen-9a-yl acetateTerpenoid
Vanda/Cattleya21.65420.142C21H24O9RhapontinStilbenoid
Vanda16.08432.105C21H20O10IsovitexinFlavonoid
Vanda/Cattleya12.84432.163C19H28O11Darendoside APhenylethanoid
Cattleya44.93442.381C30H50O2AllobetulinolTerpenoid
Vanda16.61448.100C21H20O11HomoorientinFlavonoid
Vanda22.65464.095C21H20O12HyperosideFlavonoid
Vanda24.66478.111C22H22O12Isorhamnetin 3-galactosideFlavonoid
Cattleya29.47492.127C23H24O12Tricin 5-glucosideFlavonoid
Vanda1.80564.148C26H28O14IsoschaftosideFlavonoid
Cattleya21.31564.148C26H28O14Isovitexin 2′’-O-arabinosideFlavonoid
Cattleya18.13582.231C28H38O132-[[5-(4-hydroxy-3,5-dimethoxyphenyl)-6,7-bis(hydroxymethyl)-1,3-dimethoxy-5,6,7,8-tetrahydronaphthalen-2-yl]oxy]-6-(hydroxymethyl)oxane-3,4,5-triolLignan
Vanda/Cattleya15.80594.158C27H30O15SaponarinFlavonoid
Vanda22.84610.153C27H30O16RutinFlavonoid
Publisher’s Note: MDPI stays neutral with regard to jurisdictional claims in published maps and institutional affiliations.