1. Introduction
Diclofenac is a popular nonsteroidal anti-inflammatory drug used in more than 120 countries. It is the first phenylacetic acid derivative developed as an anti-inflammatory agent. Diclofenac sodium is a non-selective reversible and competitive inhibitor of cyclooxygenase, which is extensively used for its analgesic, antipyretic and anti-inflammatory activities. It is a potent drug applied for the treatment of active rheumatoid arthritis and osteoarthritis, ankylosing spondylitis, non-articular rheumatism, and sport injuries [
1]. Topical Diclofenac can be considered a first-line treatment for osteoarthritis, especially for older patients [
2]. Clinical trials suggest that it has a favorable side-effect profile and excellent patient tolerability. At the same time new contradictions [
3] in prescribing Diclofenac are being investigated [
4]. There are many works on the degradation of Diclofenac. However, they are devoted to cases of degradation in the environment (wastewater); see, for example [
5,
6]. To the best of our knowledge, studies of the aging of the drug in packaged tablets have not yet been conducted. In general, Diclofenac is a fairly stable medicine and manufacturers claim its shelf-life as being three years. However, there are cases when experts have observed a rapid degradation of this drug during routine monitoring or using complex laboratory tests. Every year since 2017, during routine testing, from one to three substandard batches of Diclofenac tablets have been identified. It goes without saying that any discrepancy in a medicinal product from the normal state or non-compliance with pharmacopeia requirements should be carefully considered and explained.
In a recently published paper [
7], we presented the analysis of the natural long-term aging of both the API and the intact Diclofenac tablets produced by one manufacturer. The study was undertaken when unexpectedly rapid changes in the NIR spectra of the intact tablets were noticed in the course of routine monitoring of medicines following the workflow described in [
8]. We showed that the NIR spectroscopic analysis of the intact tablets packaged in PVC blisters, supported by chemometrics, is a reliable method for the detection of even slight deviations of the medicine from its regular state. Independent components analysis helped to extract source signals from spectra of the composite object “a coated tablet sealed in PVC blister”. Further analysis of the NIR and MIR-ATR spectra of the Diclofenac substance confirmed that the aging process detected by the analysis of the intact tablets is directly related to the degradation of the API. In this paper, we continue to investigate this case and our new goal is to develop a kinetic model and propose a mechanism for this degradation of Diclofenac.
Aging is a thermodynamically controlled process when a less stable compound converts into a more stable one. This is a general fact, but in each particular case, the process occurs through a specific degradation mechanism. There are three main mechanisms possible: oxidation, hydrolysis, and photo-degradation. The last two are irrelevant in our case. Therefore, we consider oxygen to be the main agent of degradation.
Typically, the stability of pharmaceutical products or substances is studied under stress conditions to force accelerated aging [
9]. Afterward, degradation paths and the mechanisms involved are examined [
10,
11,
12]. This approach has an undeniable advantage, allowing researchers to control the process in terms of concentrations, temperature, humidity, and oxygen pressure. At the same time, it has a serious drawback, which is that one cannot answer the main question–whether artificial accelerated aging corresponds to natural aging.
The principal advantage of our study is that we use data that reflects the natural aging of Diclofenac over a rather long period, up to (or close to) its complete degradation. Another advantage is the inclusion of substance-only data, which adds new information, but at the same time produces new problems in the data interpretation.
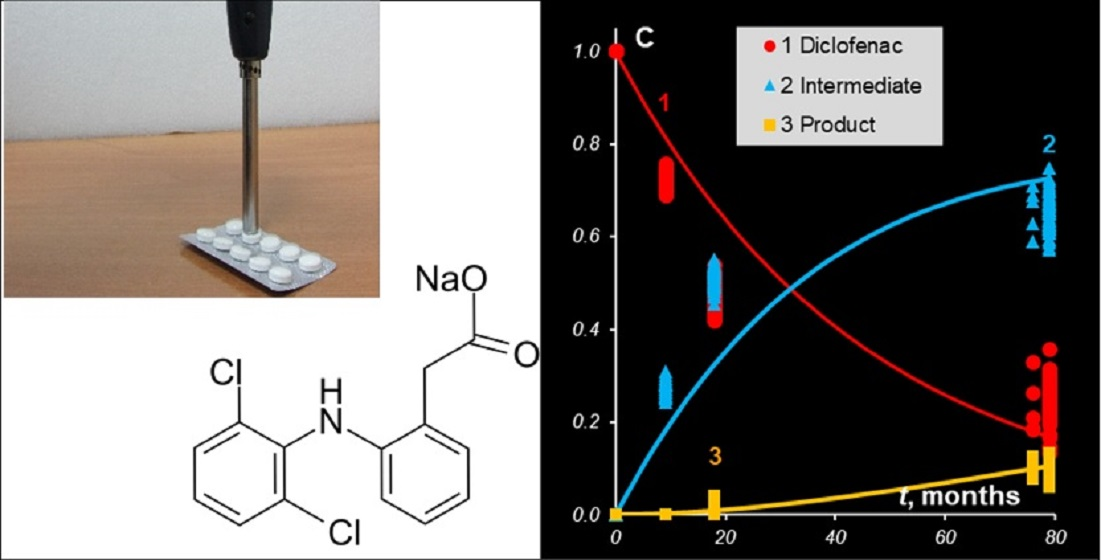
The experimental approach is that the NIR measurements are carried out on the packaged tablets and on the substances at various stages of aging. The kinetic model of Diclofenac (
API) degradation proposed is a sequential two-step first-order reaction:
We assume that it is valid both for tablets and substances. We also assume that the intermediate,
Inter, and the product,
Prod, are the same for the tablets and substances, while the rate constants
k1 and
k2 may be different. The chemometric tool we employ is Multivariate Curve Resolution–Alternating Least Squares (MCR-ALS) in its ‘soft’ version [
13]. Neither “hard” nor “grey” approaches [
14,
15] are used, but the “soft” MCR results are subsequently modeled using kinetic equations [
16].
All these circumstances should be taken into account in reasoning about what can and cannot be expected from the result of this research. We are going to present: a global kinetic model; approximations of the NIR spectra of the intermediate and the product; rough estimates of rate constants. At the same time, we will not be able to demonstrate: a detailed kinetic mechanism; identification of intermediates and products; accurate estimates of the rate constants.
2. Materials and Methods
2.1. Intact Tablets and Substances
All tablets and substances were acquired directly from the manufacturer of the tablets. New tablets packaged in the transparent PVC blister contain: 100 mg of Diclofenac sodium (
API), 90 mg of microcrystalline cellulose (
MCC), and 85 mg of other excipients and coating (
Rest). In the course of aging, the API concentration decreases, and new components appear: intermediate (
Inter) and product (
Prod). Since the NIR measurements are conducted through the PVC blister, there is an additional component (
PVC) that should also be taken into account [
17,
18]. We consider that this is a closed system in which the total sum of concentrations is constant.
Information about this system is given in
Table 1. Five batches of the tablets were produced in February 2013 with an expiration date of February 2016. They were stored in blisters in closed cardboard boxes at room temperature, as prescribed by the manufacturer.
In the European Pharmacopeia [
19], the substance is defined as sodium 2-[2-[(2,6-dichlorophenyl)amino]phenyl]acetate with formula C
14H
10Cl
2NNaO
2. A set of samples produced by a single manufacturer have been collected and monitored over the last ten years. We consider the Diclofenac substance as a closed system consisting of
API,
Inter, and
Prod.
2.2. NIR Spectrometry
All spectra were acquired using an FT-NIR spectrometer (MPA, Bruker) in the diffuse-reflectance mode with a fiber probe over the 12,500–4000 cm−1 range, at a resolution of 2 cm−1. The informative range of 9000–4000 cm−1 is selected for data analysis. Three replicas for each object are averaged.
The tablets were measured through the transparent PVC blister. For the substance measurements, small optically transparent glass bottles with flat bottoms were used. In total, we collected 165 spectra of tablets and 36 spectra of substances. A more detailed description of the experiments can be found in [
7]. All spectra were baseline-corrected before data processing.
2.3. MCR-ALS
MCR-ALS is an iterative method of data processing [
13] that is based on model bi-linearity
Here X is the (I × J) matrix that contains spectra of I samples recorded for J wavelengths. C is the (I × N) matrix of the component concentrations, and S is the (J × N) matrix of pure spectra. N is the number of pure components in the system. E is the (I × J) matrix, which contains variations not explained by the model.
The ALS procedure consists of two types of steps, the C-type step and the S-type step, which are repeated until convergence. At the C-type step, the value of
S is set fixed as
Shat, and the
C matrix is calculated using the unconstrained least squares (LS) estimator
Here + means the pseudo-inverse of the matrix i.e., for any matrix A, A+ = A(AtA)−1. Afterward, matrix Cin is transformed into a matrix Chat by incorporating any of the constraints chosen for the concentration profile.
For the S-type step, the value of
C is set fixed at
Chat, and matrix
S is found by applying a similar LS estimator
Subsequently, matrix Sin is transformed into matrix Shat to account for any chosen spectral profile constraints.
All constraints are chosen to give a physicochemical meaning to the LS estimates Cin and Sin and, where it is possible, to resolve rotation and/or scaling ambiguity. We used non-negativity and closure for concentrations and non-negativity for spectra. The so-called ‘grey’ modeling procedure assumes that there are kinetic equations, which constrain the concentration profiles in matrix C. Kinetics are only taken into account in this study after the MCR-ALS step, without using the ‘grey’ approach within the course of MCR-ALS.
Prior knowledge regarding some spectral components is a special type of constraint. Consider the case when matrix
S consists of two parts: the known spectra
S1, and the unknown part
S2, i.e.,
S = {
S1,
S2}. In this case, Equation (4) is replaced with the following equation
where
C1 and
C2 are the corresponding parts of the concentration matrix i.e.,
C = {
C1,
C2}. A very special case is one where all spectra are known. Then the MCR problem is solved in one C-step given by Equation (3).
The application of MCR-ALS in the current study has several specific features. Usually, in order to start the iteration procedure, we have to know the number of components
N and have an initial approximation of matrix
S. In our case, the number
N is known. The NIR spectra of components
PVC,
MCC, and
API have been reported in many papers and we also measured them. Thus, they are also known. Concentrations of
MCC,
API, and
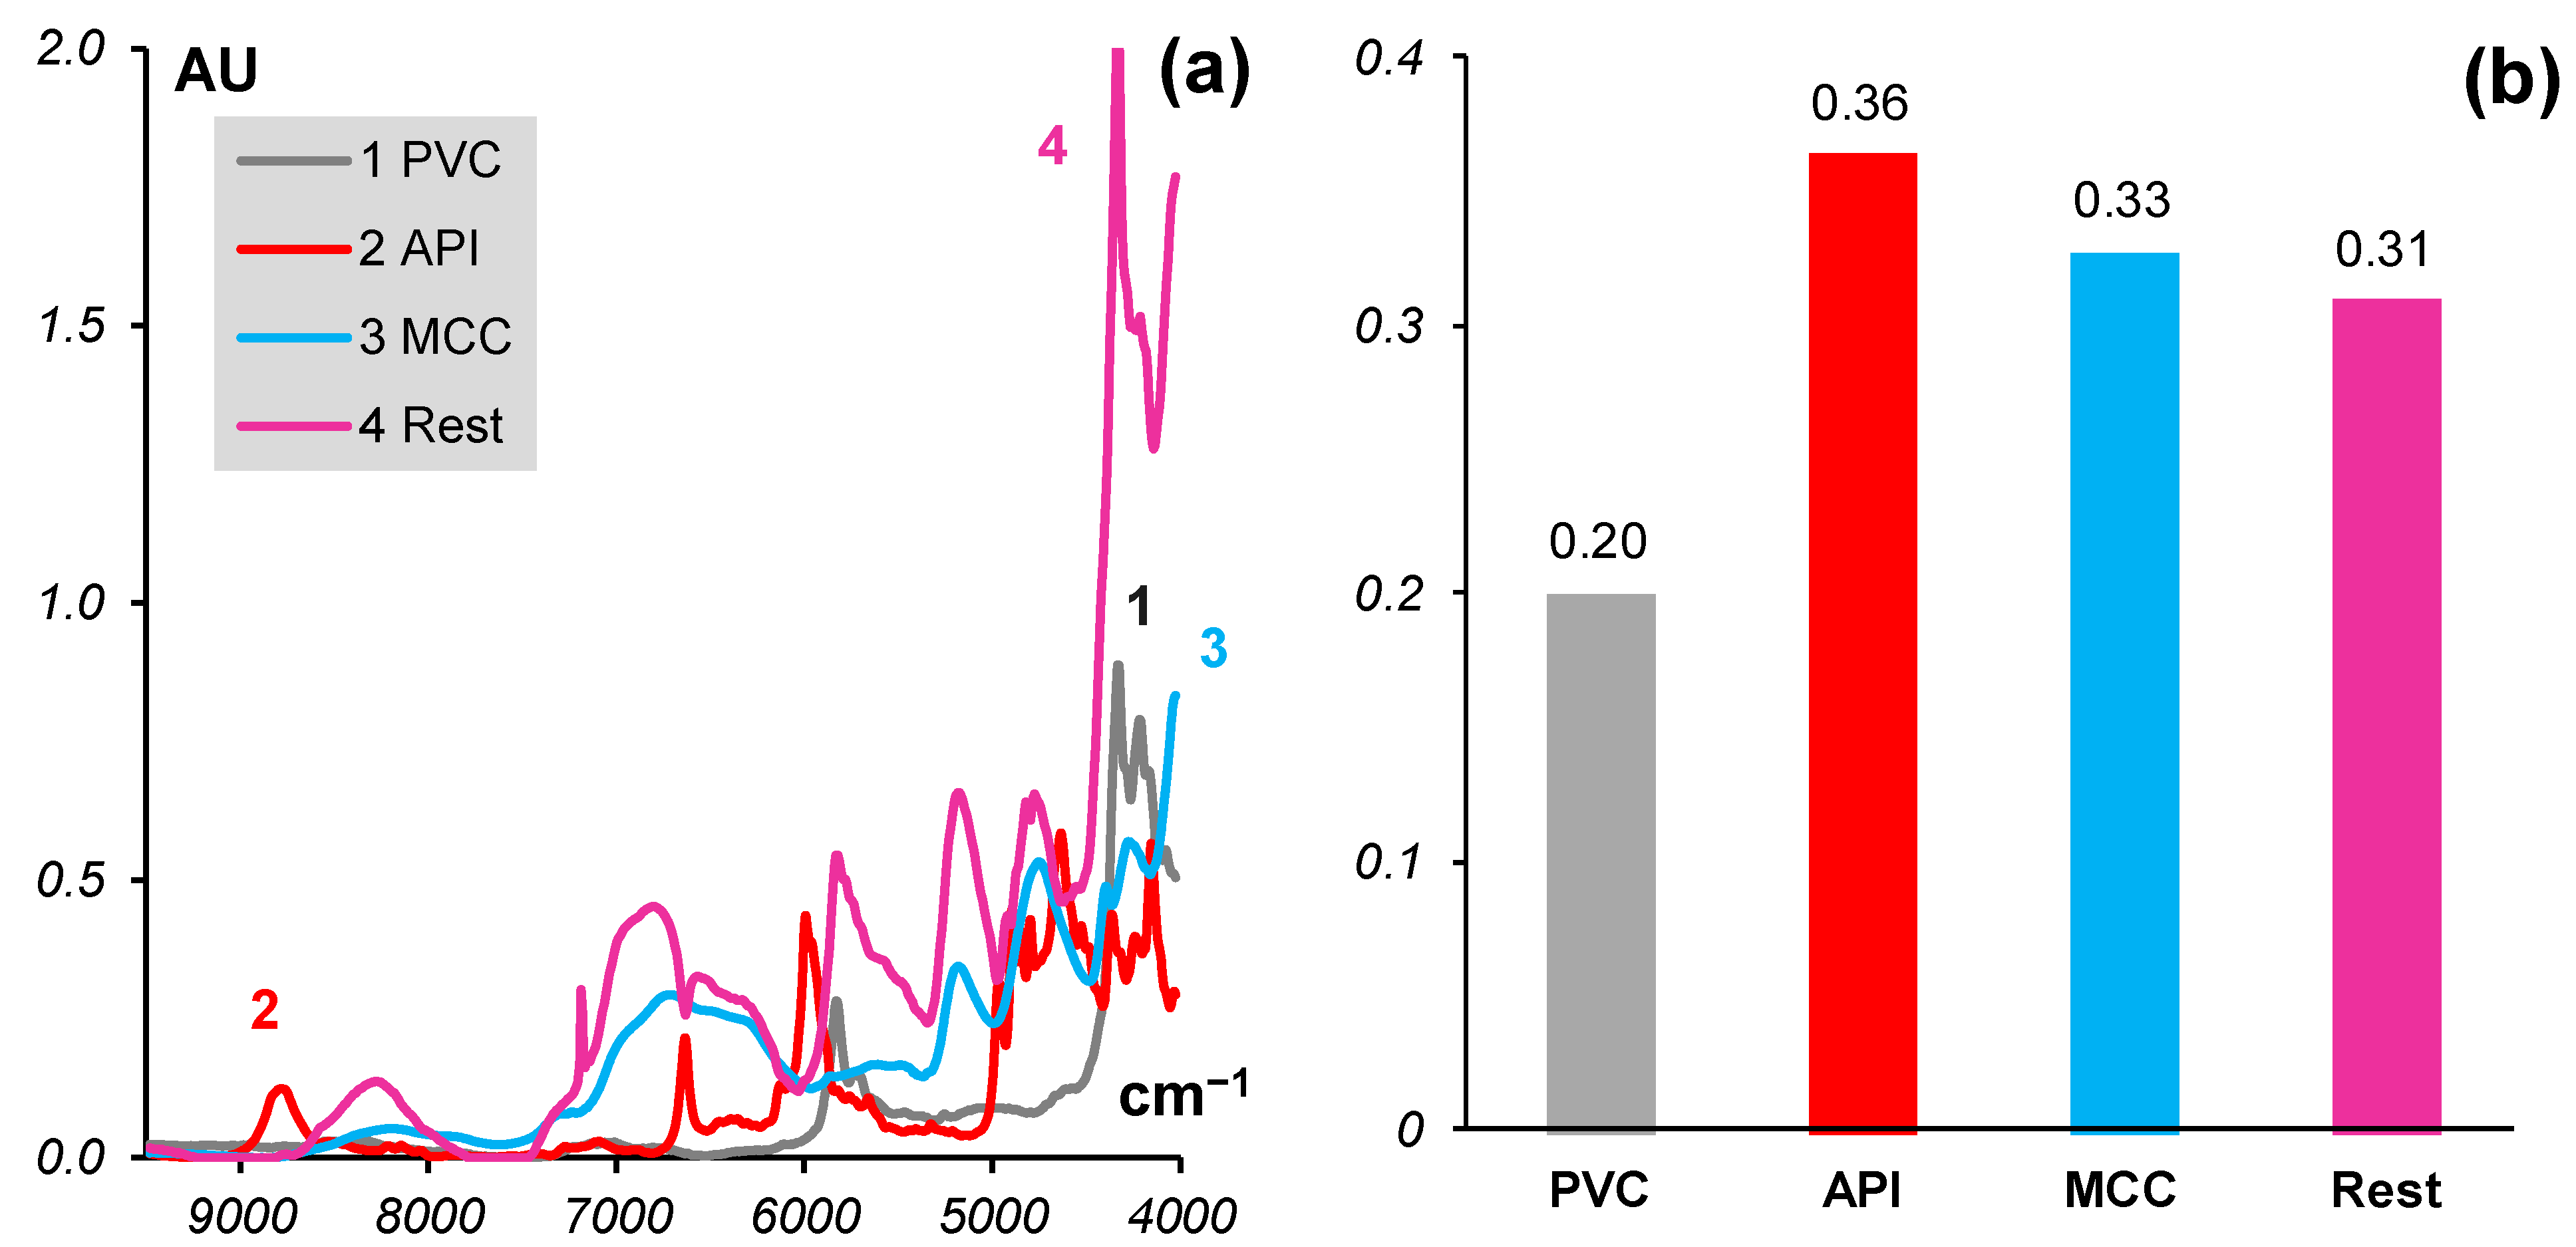
Rest are given in the tablet prescription, and their relative values are correspondingly 0.33 + 0.36 + 0.31 = 1.00. It is worth noting that the concentration of
PVC is not a real concentration, but a weighting factor that corresponds to the contribution of the PVC layer to the entire spectrum of the tablet [
17].
To assess an overall quality for the MCR modeling of the spectral matrix
X, we calculate the relative lack of fit (LoF %) as follows
3. Results
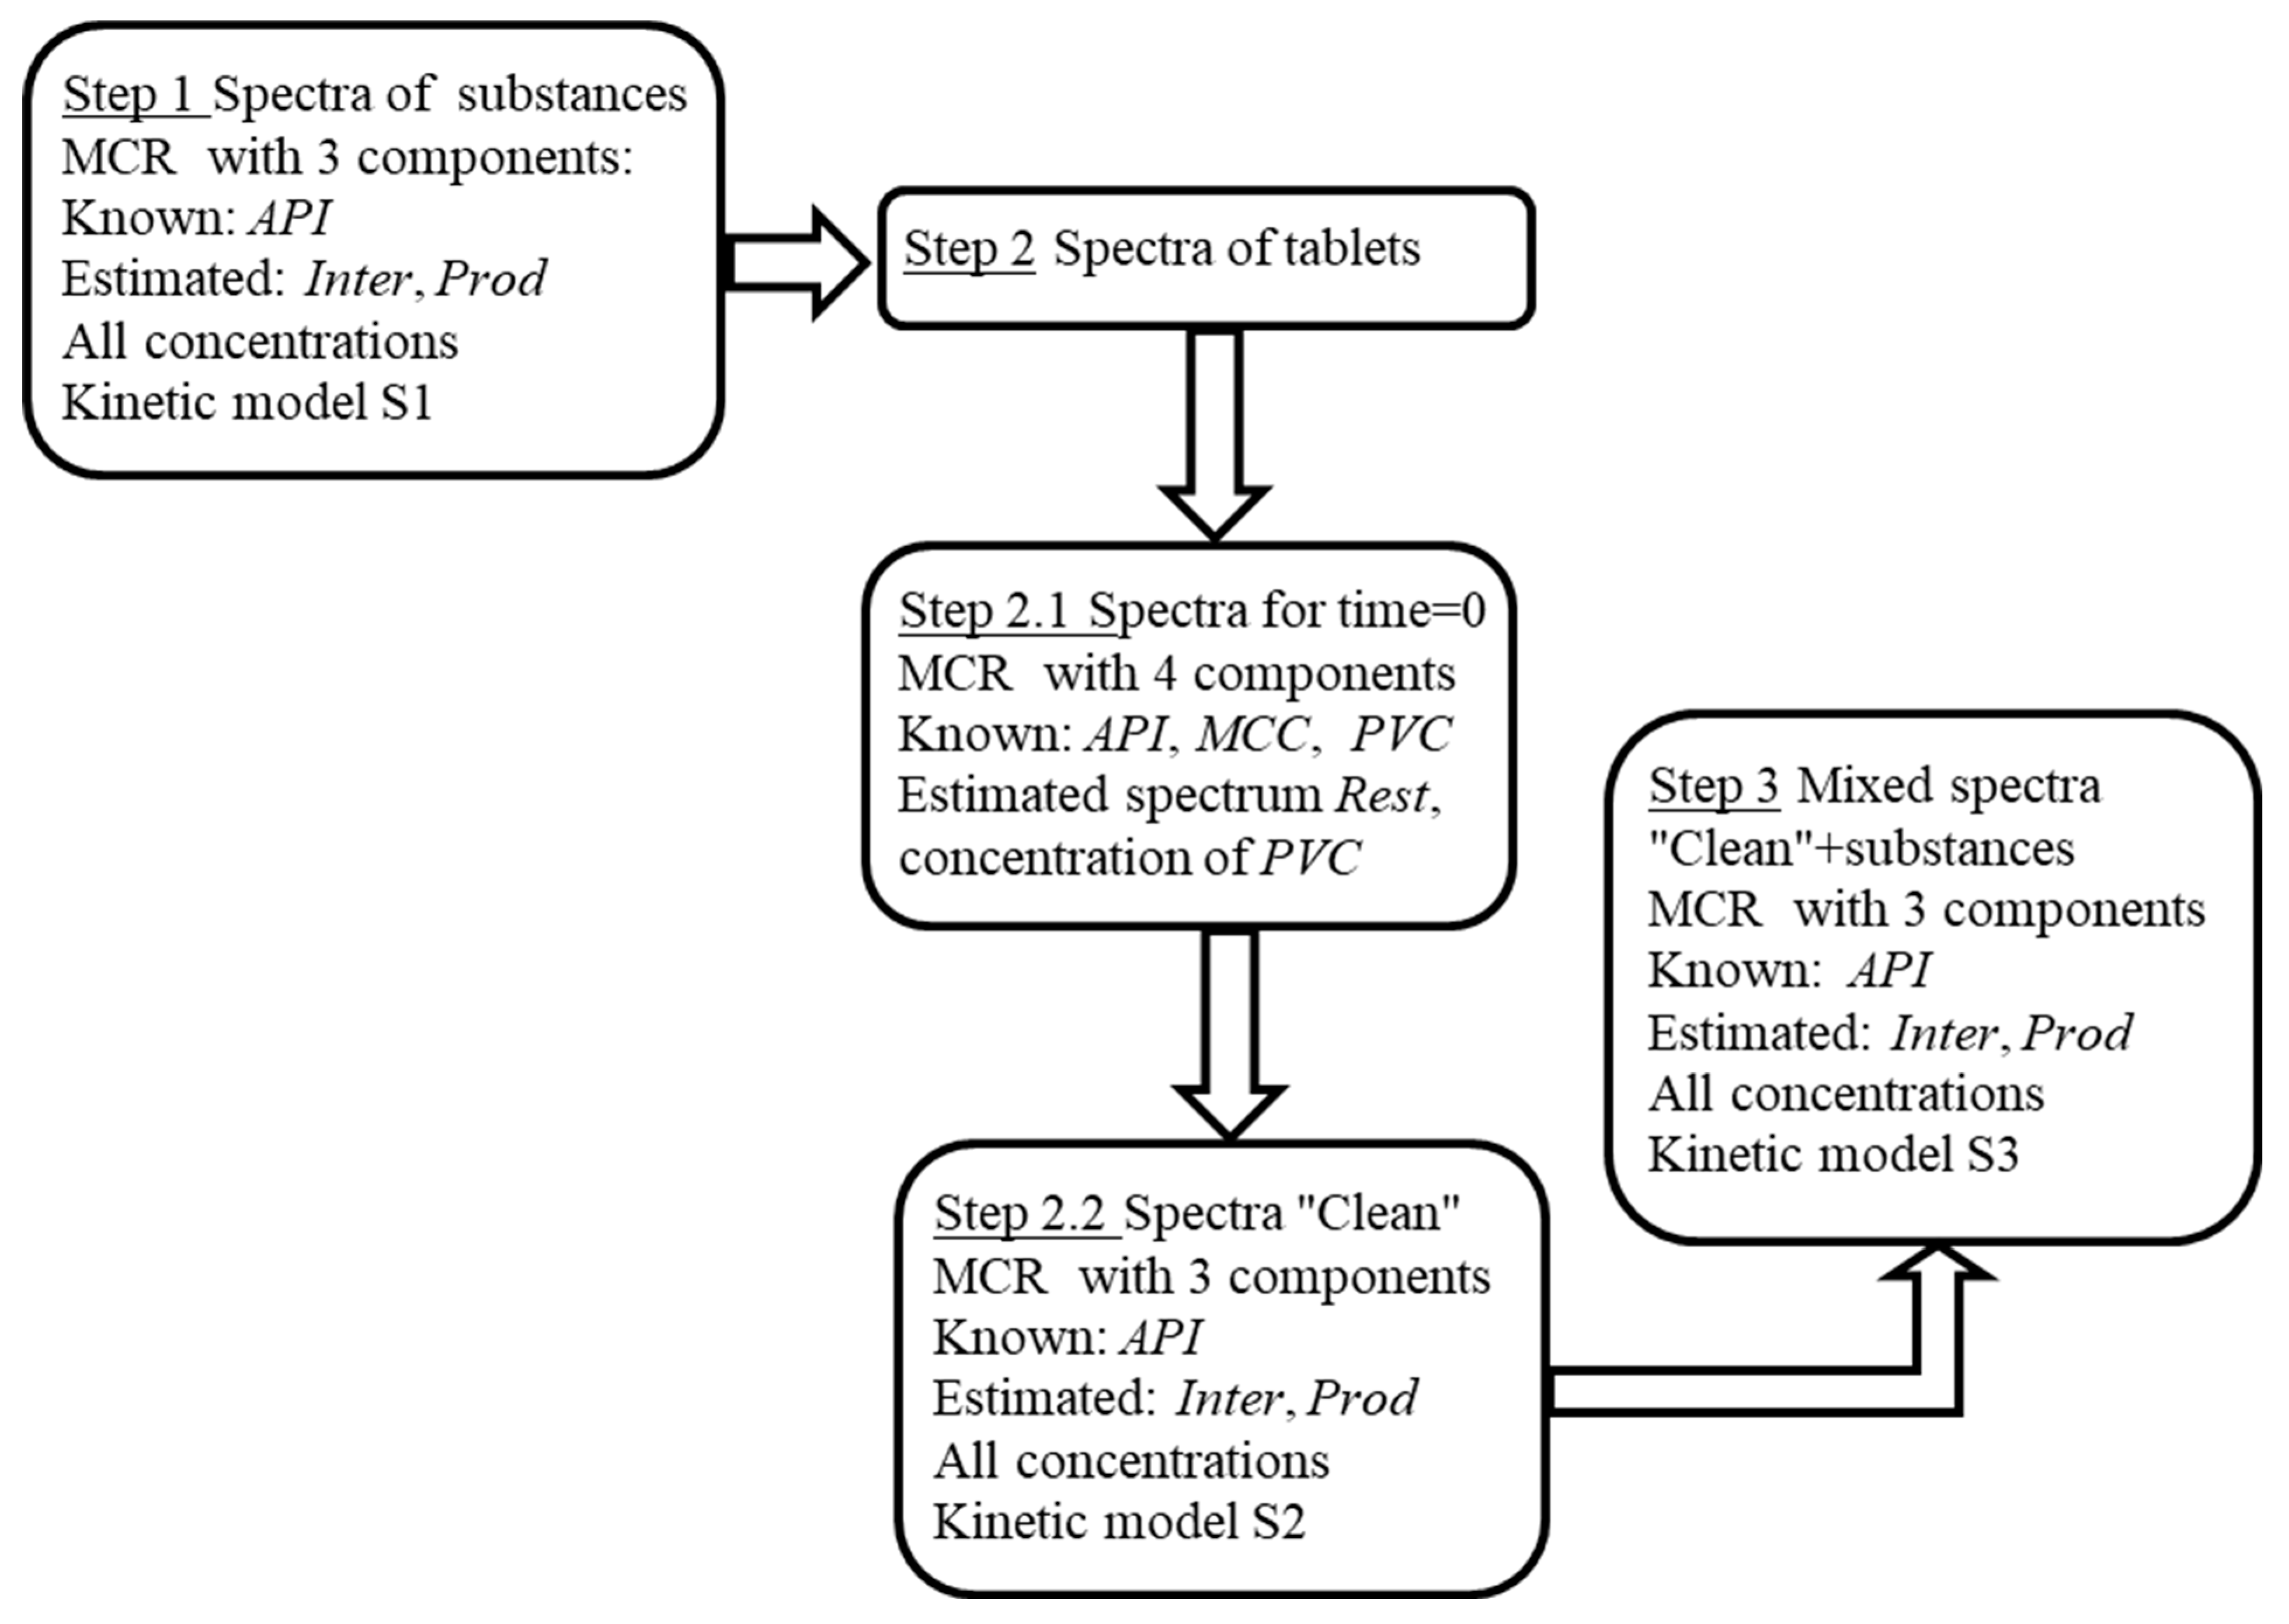
We suppose that in all steps, the main ‘players’ are the three main components,
API,
Inter, and
Prod. In the course of multi-step MCR-ALS, the spectra for
Inter and
Prod estimated in the previous step are used as an initial approximation for the next step. In each step, we try to improve spectra estimations and calculate the corresponding concentrations of the components. At the end of each step, the kinetic model is built. The brief scheme is depicted in
Figure 1.
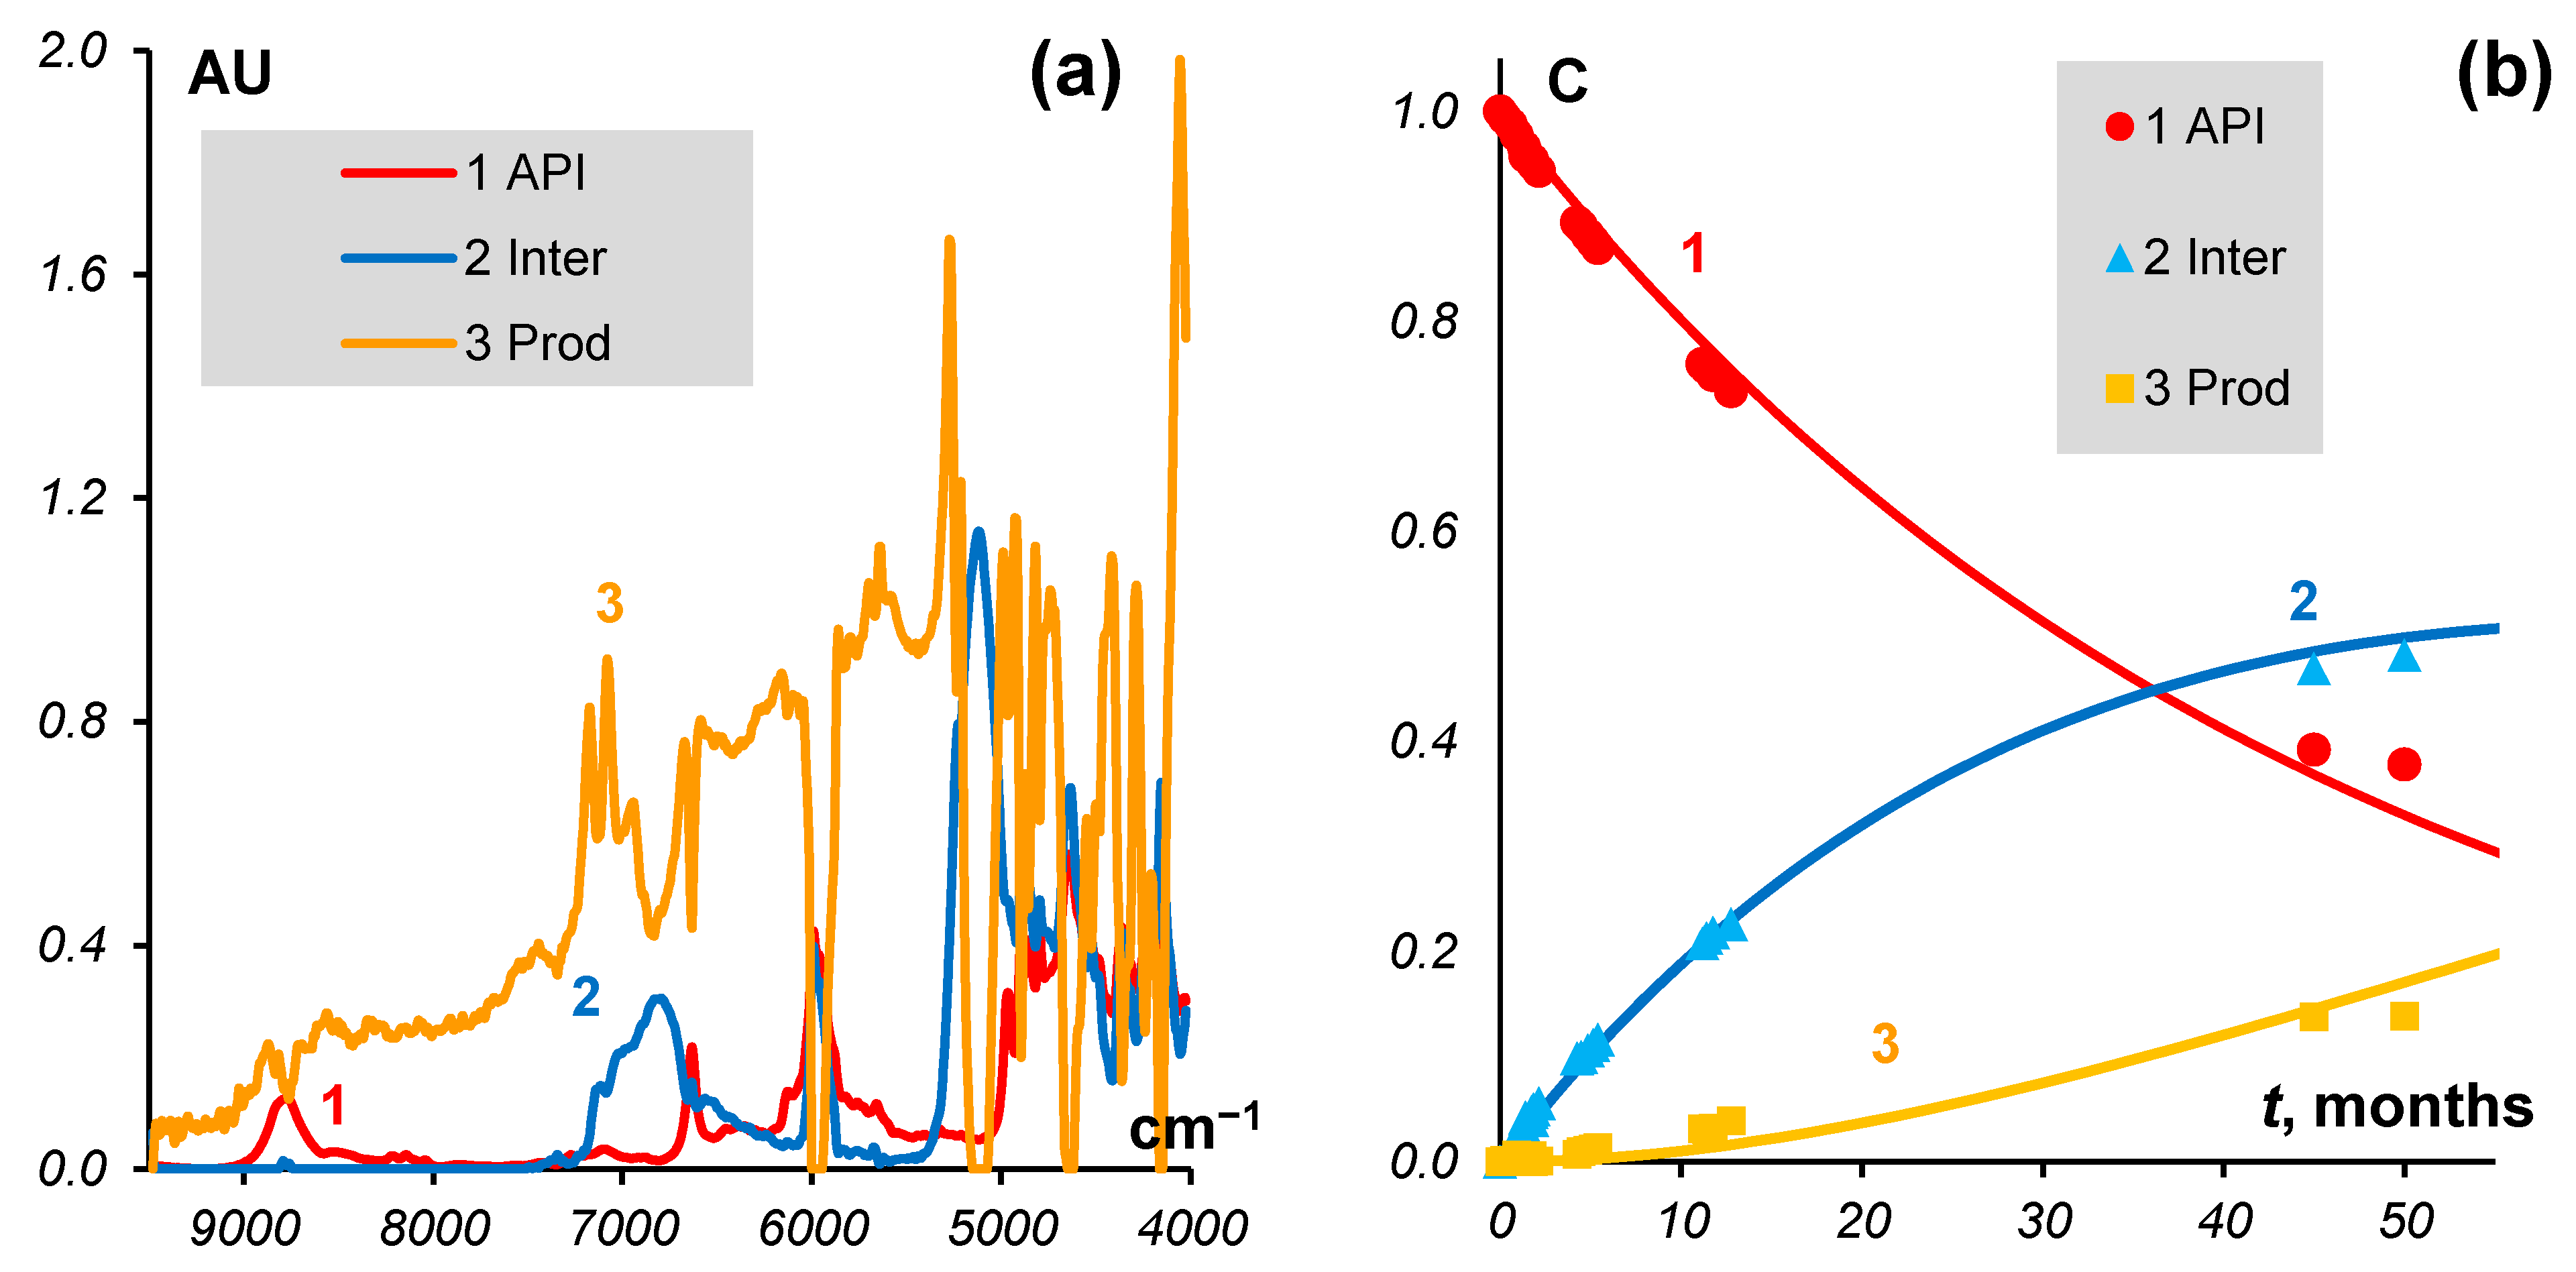
3.1. Step 1. Substances
The first task is the MCR modeling of the API degradation using substance NIR data. We presume that this process can be represented by the sequential two-step, first-order reaction given in Equation (1). Therefore, the MCR model is comprised of three components that are API (spectrum and initial concentration known), Inter (both unknown), and Prod (both unknown). The ALS procedure converges to a value of LoF = 2.3%.
In this case, the kinetic modeling of the MCR outcomes is a challenging task, complicated by two issues. The first is that the substance samples are produced at very different times. Therefore, the quality of the substances is not as identical as in the case of tablets, which are produced by the same manufacturer. The second issue is that the values for the time intervals between production and measurement are not as reliable as for the tablet data. In fact, they are only known within a few months. Thus, when fitting the kinetic model given in Equation (1), not only are the rate constants estimated but also the time points are selected.
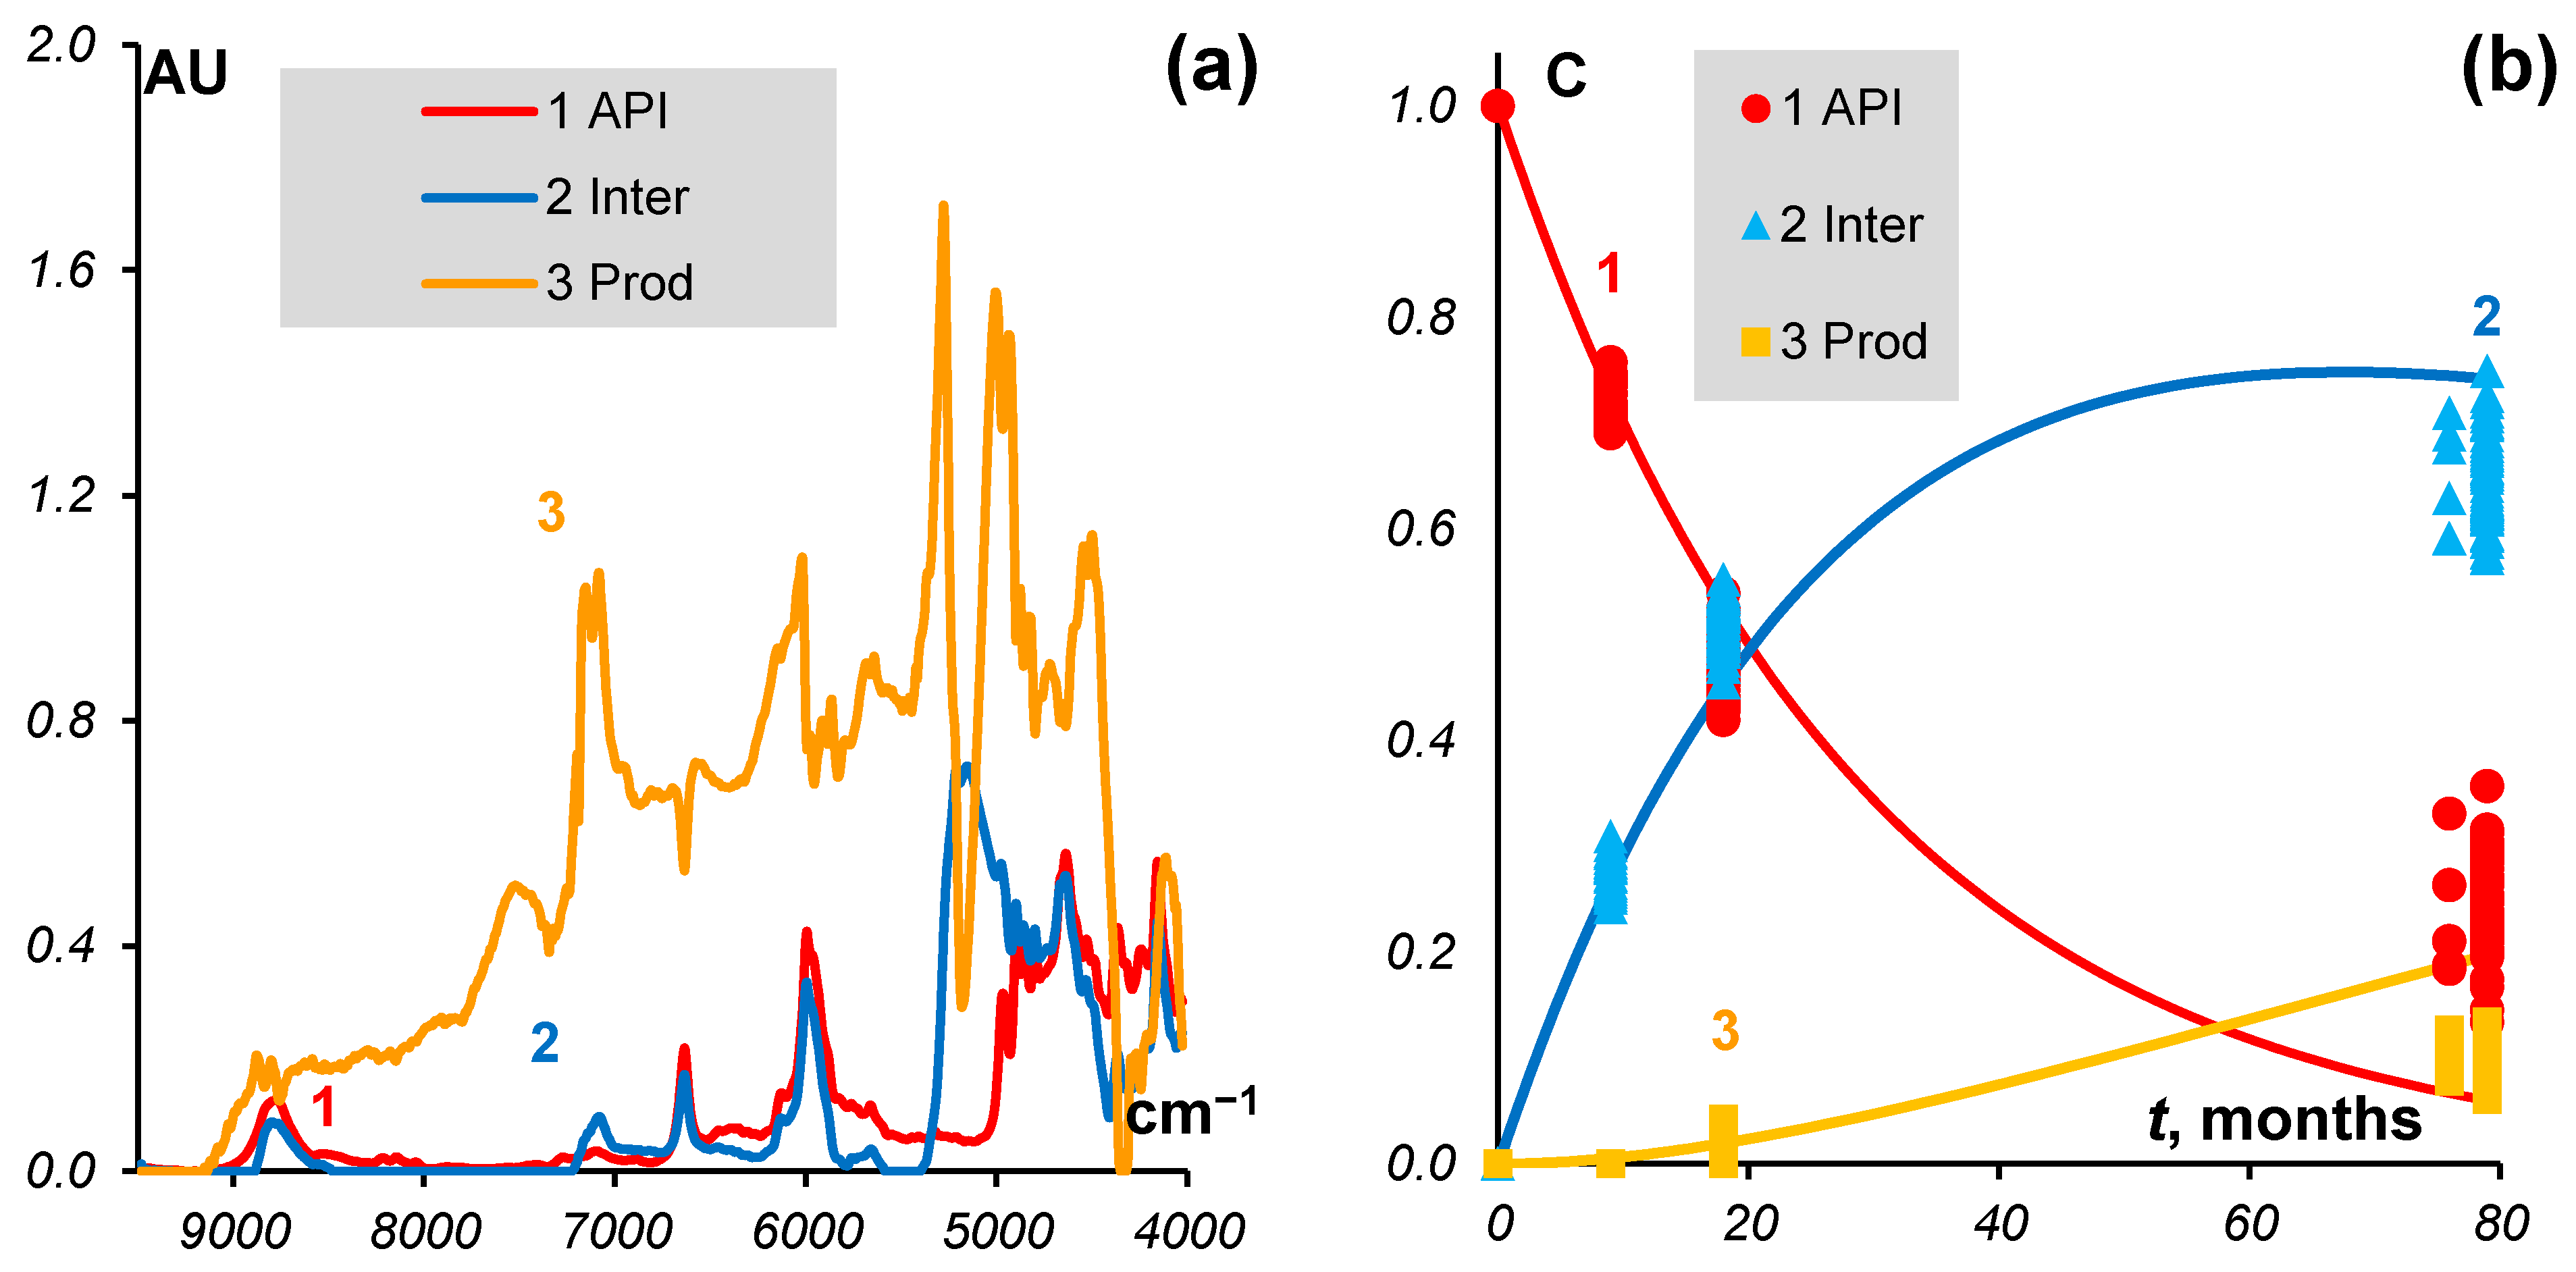
The estimated rate constants for the substance data are
k1 = 0.023 and
k2 = 0.01 (month
−1). The results are presented in
Figure 2.
3.2. Step 2. Tablets
This step consists of two sub-steps. At first, only the NIR spectra of the un-aged tablets are analyzed, and afterward, the estimation of the Inter and Prod spectra is performed.
3.2.1. Step 2.1
There are two objectives for this modeling. The first is to estimate the spectrum Rest that comprises all unknown excipients and coating components, which make up 31% of the total mass of the tablet. The second goal is to find the ‘pseudo-concentration’ of the PVC blister that, in fact, is a weighting factor participating in the concentration matrix C. These objectives can be achieved using the MCR-ALS modeling of the initial part of the NIR data obtained from new, freshly manufactured tablets that do not show signs of degradation. Three batches with 10 tablets each are used for this modeling.
The MCR problem is solved for four components: PVC, API, MCC, and Rest, where three spectra (PVC, API, MCC in matrix S) and two concentrations (API, MCC in matrix C) are known. The unknown components searched for are the spectrum of Rest and the pseudo-concentration of PVC. The obvious natural constraints are that none of the concentrations change, that is, they are constants.
The results of MCR-ALS are shown in
Figure 3. The left panel (a) shows the estimated spectrum of
Rest together with the spectra of other components of the tablets. The right (b) panel shows the concentrations of the tablet components: known (
API,
MCC, and
Rest) and estimated pseudo-concentration of the
PVC blister.
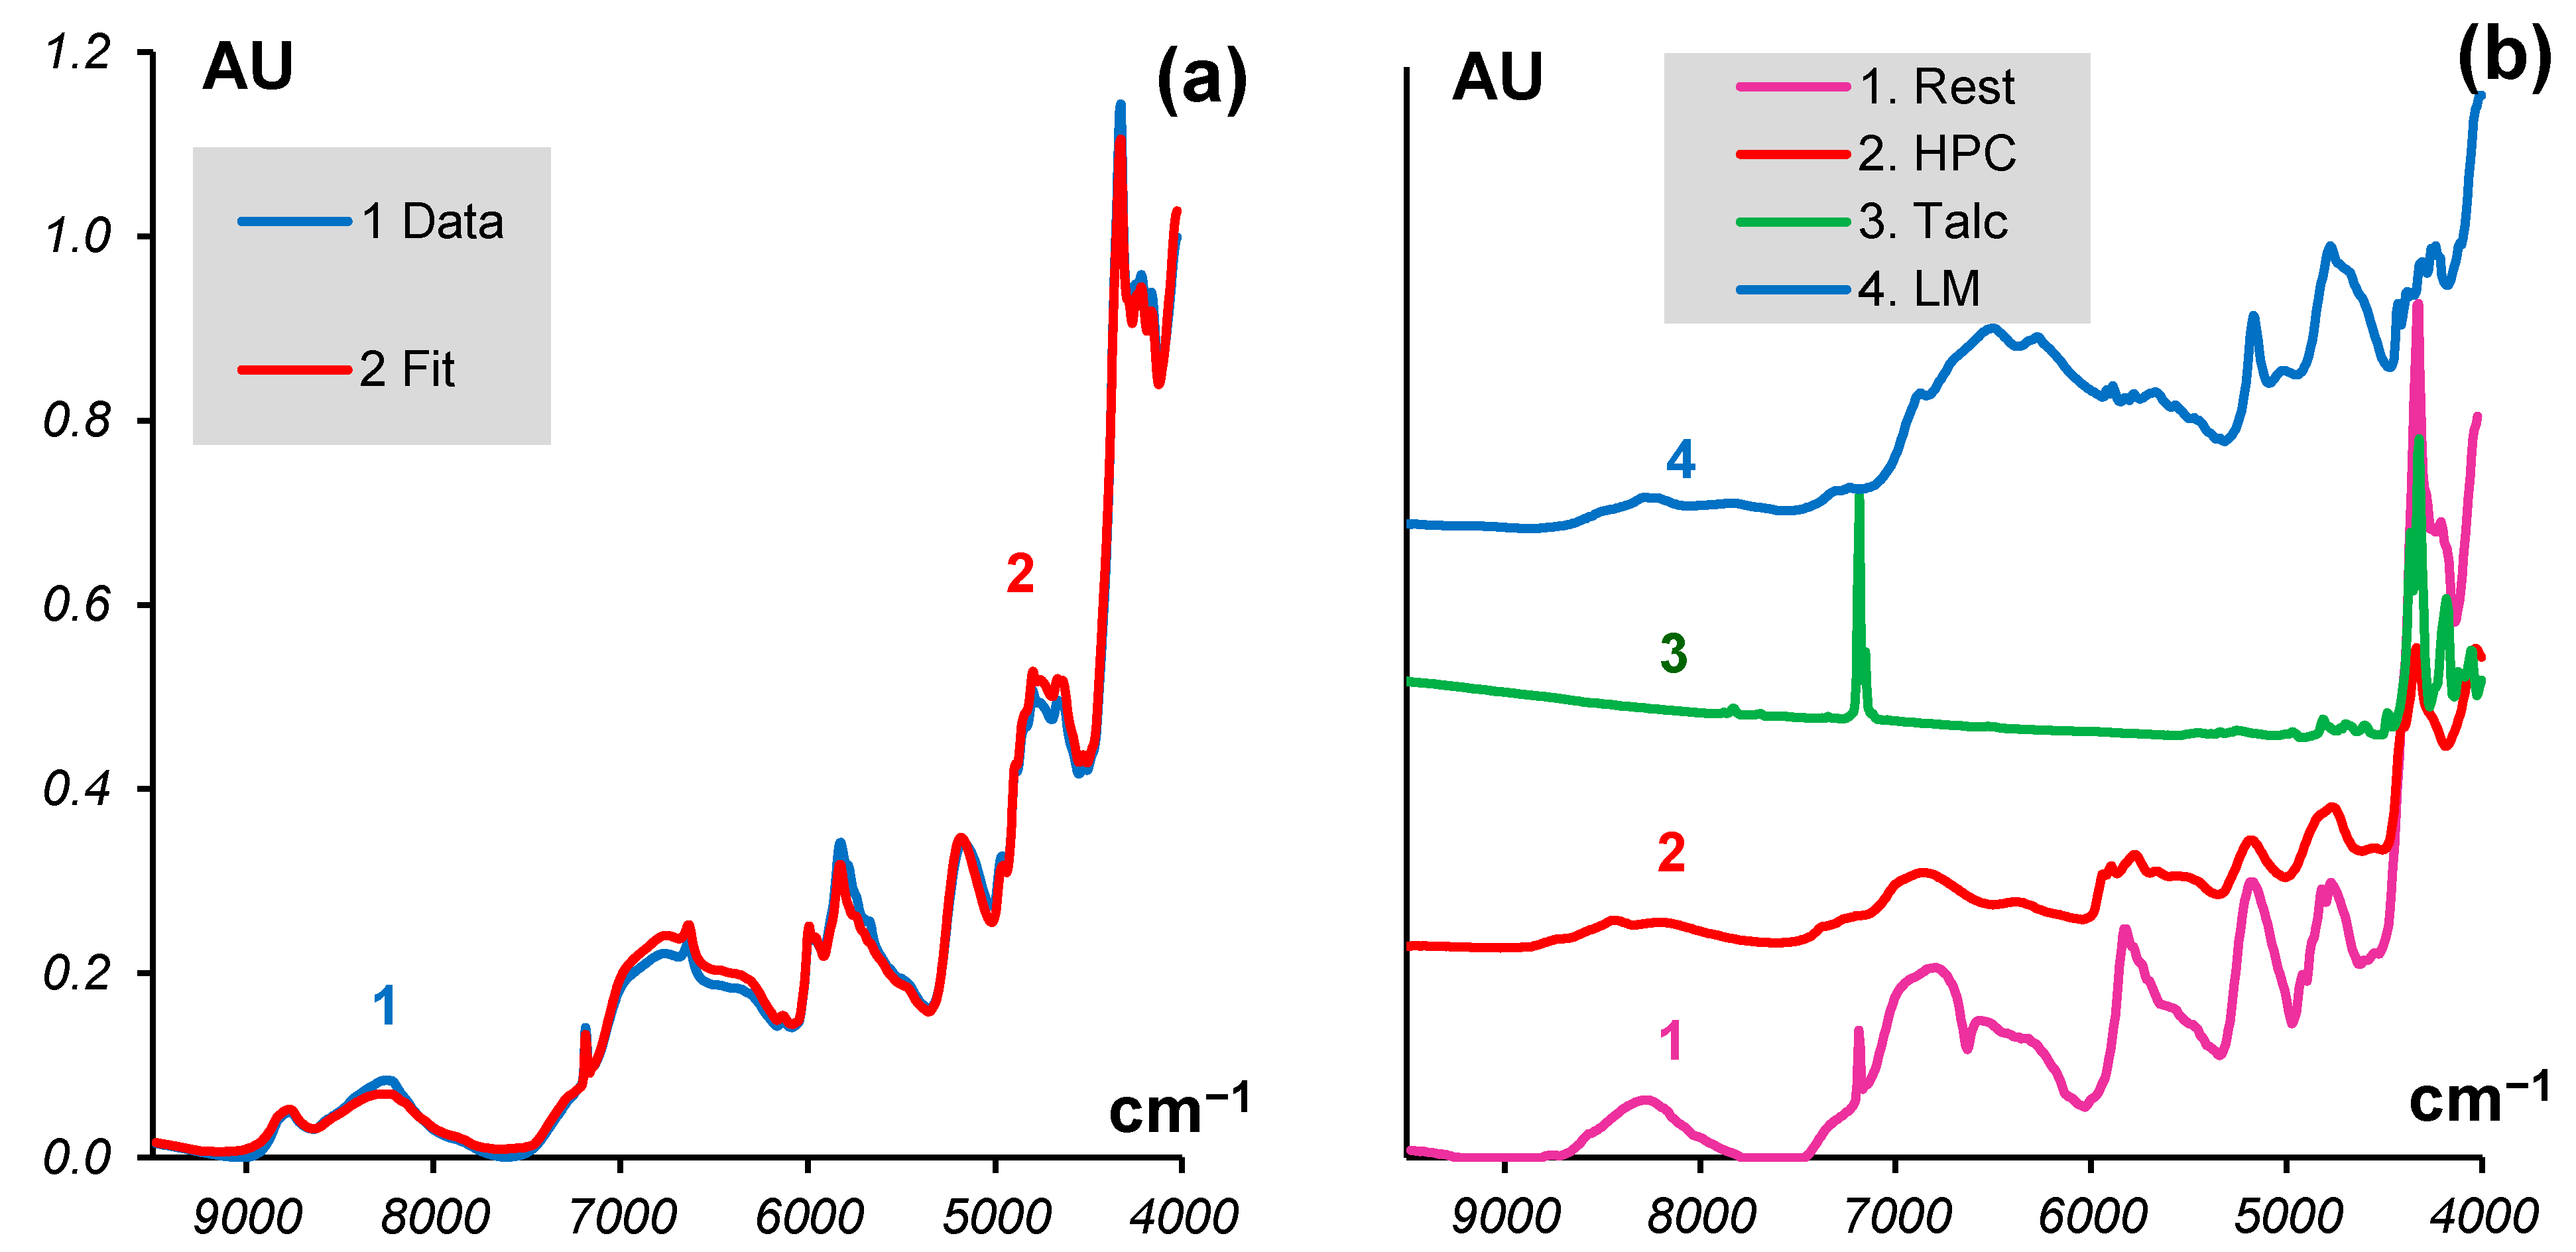
The procedure converged with a good discrepancy that is characterized by a value of LoF = 1.7%. The left panel (a) of
Figure 4 shows an example of the MCR fit for sample #25, which is the worst of the 30 samples. Nevertheless, it was fitted with the individual LoF = 5%. The right panel (b) shows the estimated spectrum of
Rest together with the spectra of some common excipients that are expected to be in the tablet. From this plot, it can be concluded that there is talc in the
Rest. Another component could be Hydroxypropyl cellulose (HPC), whose characteristic peaks are seen around 5280 and 4750 cm
−1. Lactose monohydrate (LM) may also be seen in
Rest due to its band near 8300 cm
−1.
Afterward, we eliminate from the NIR spectra of the tablets,
Xtab, the part which does not change with time. This fraction includes the spectral data originating from the components
PVC,
MCC, and
Rest.
Here matrices Cfix and Sfix include the known concentrations and spectra of the fixed components: PVC, MCC, and Rest. The cleaned spectra, Xclean, correspond to the mixture of the API and the products of its degradation. Considering that the prescribed relative concentration of API in the fresh tablets is 0.36, the spectra found by Equation (7) should be further normalized by dividing by 0.36.
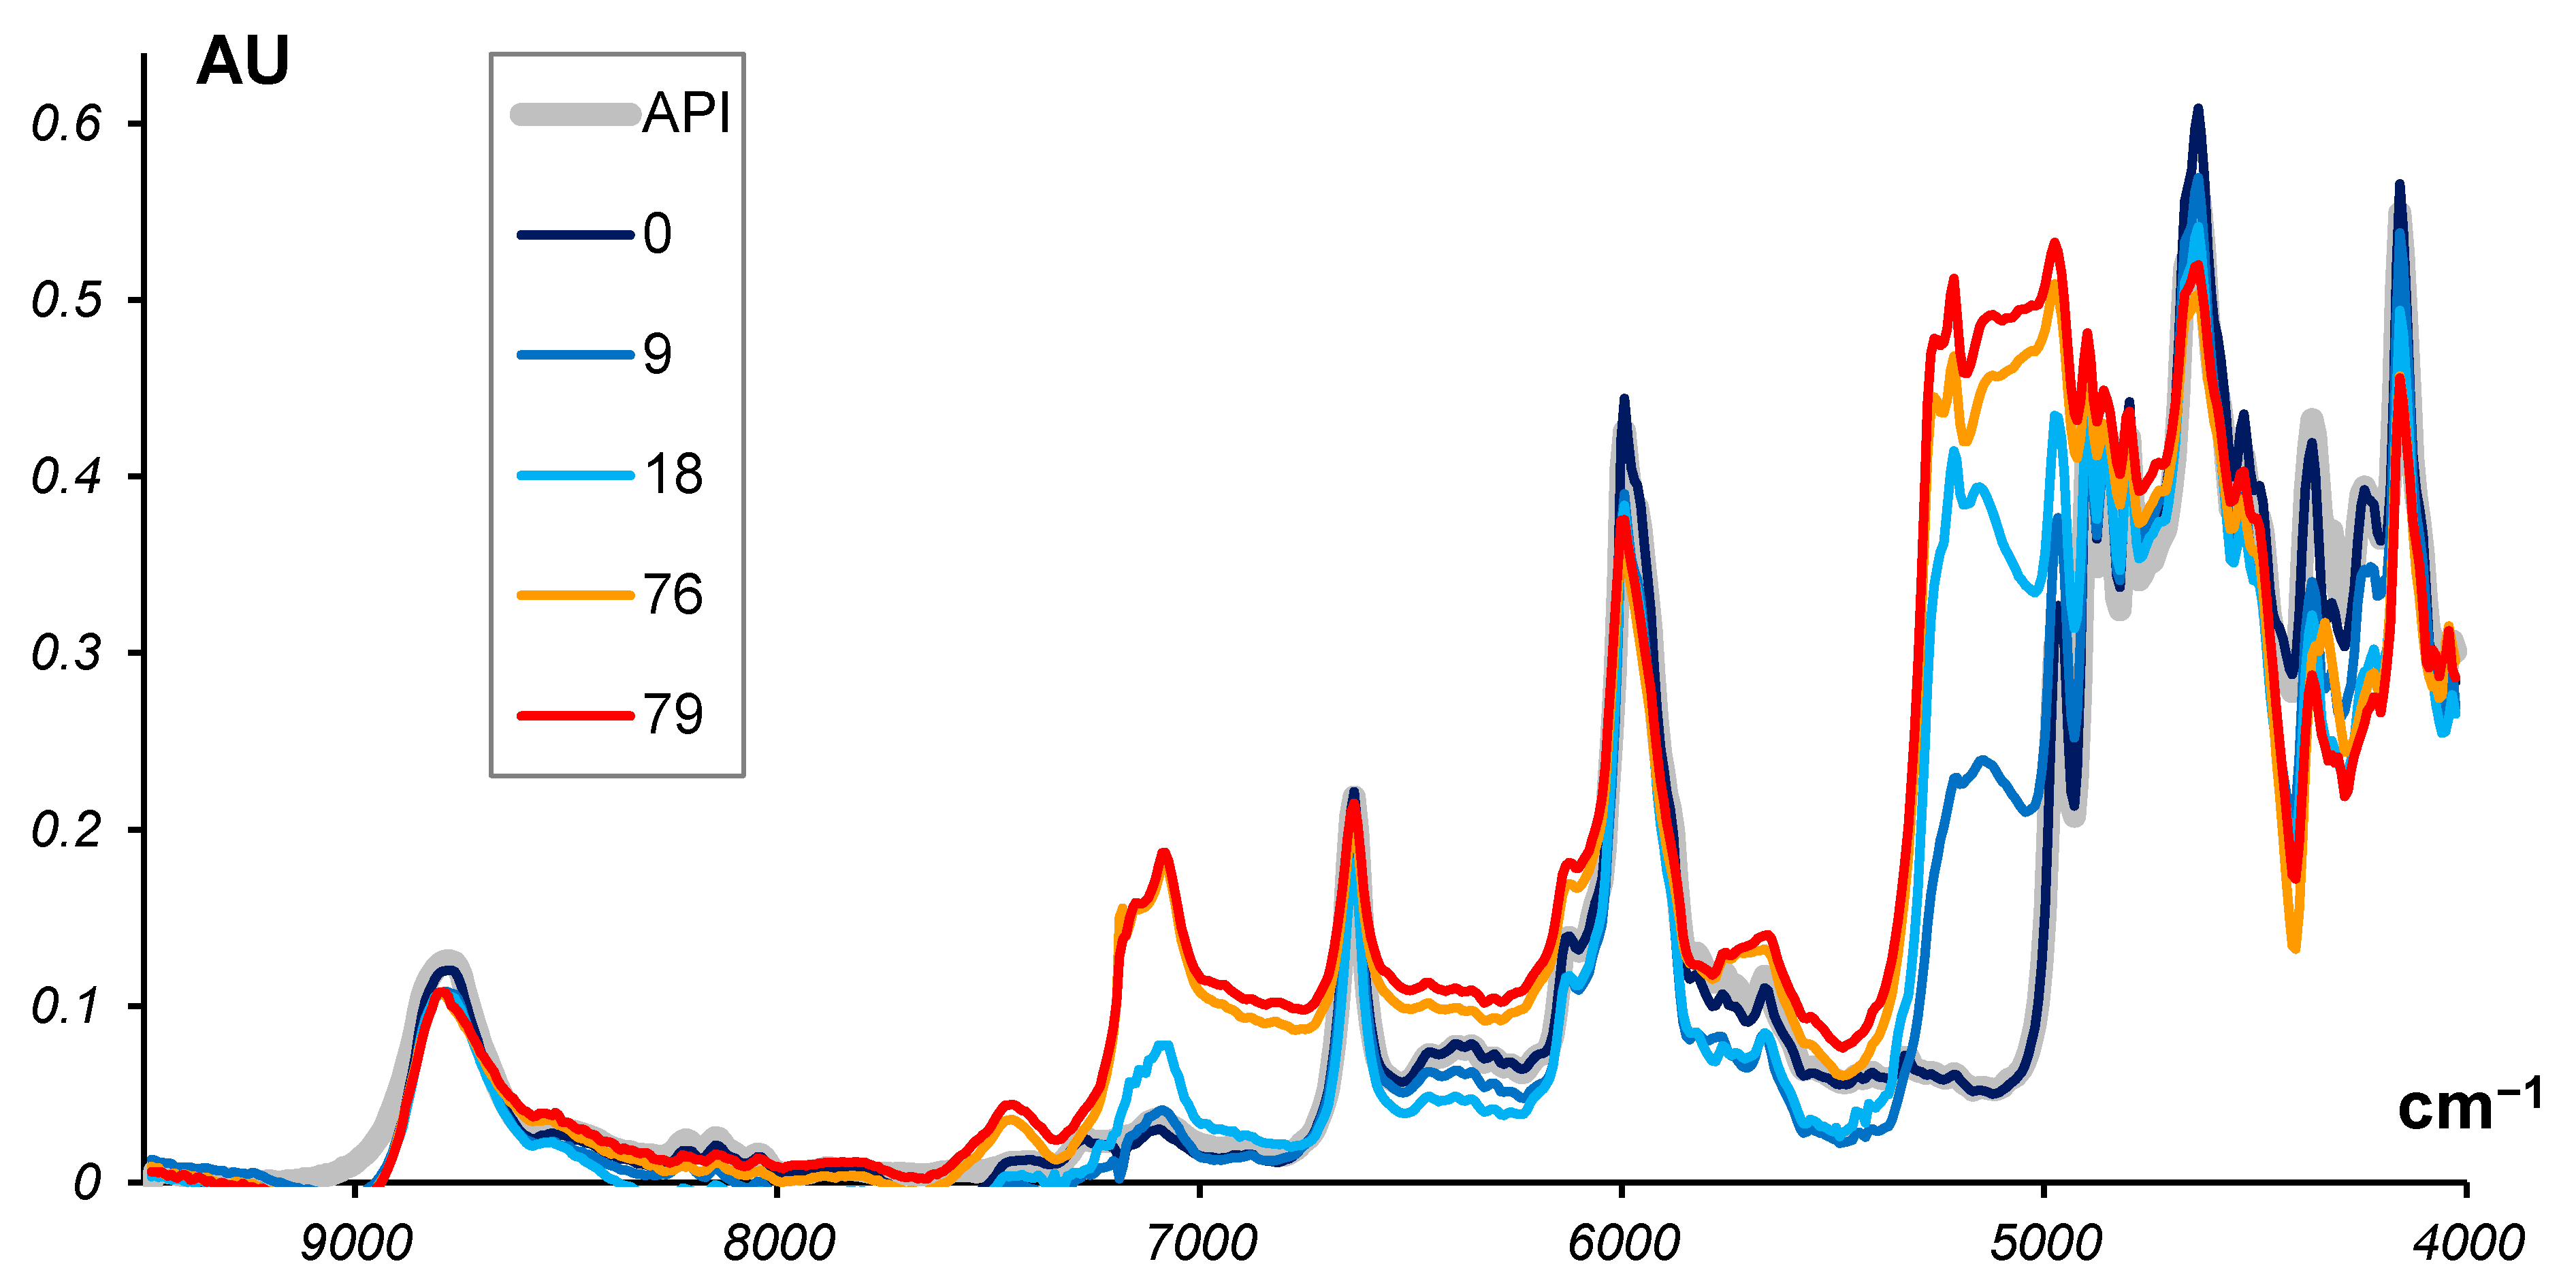
These spectra are shown in
Figure 5 which presents five selected ‘clean’ spectra of the tablets stored for 0, 9, 18, 76, and 79 months.
The known spectrum of API is given as a reference, and it shows that the ‘clean’ spectrum at t = 0 (new, un-aged tablets) matches the API spectrum.
3.2.2. Step 2.2
At this point, we are modeling the degradation of the tablets using the ‘clean’ data set. In the same way as for the substance, the MCR model comprises three components that are API (spectrum and initial concentration known), Inter (both unknown), and Prod (both unknown). To start the ALS procedure, we use the spectra Inter and Prod found in Step 1. The ALS procedure converges to a value of LoF = 7.1%, which is worse than the MCR on the spectral data of the substance alone. The concentrations obtained are well modeled by the proposed kinetics with rate constants k1 = 0.028 and k2 = 0.003 (month−1).
The kinetic equations were not used in the ALS step in the procedure. The curves of the kinetics shown in
Figure 6b were subsequently fitted to the concentrations calculated by the MCR step.
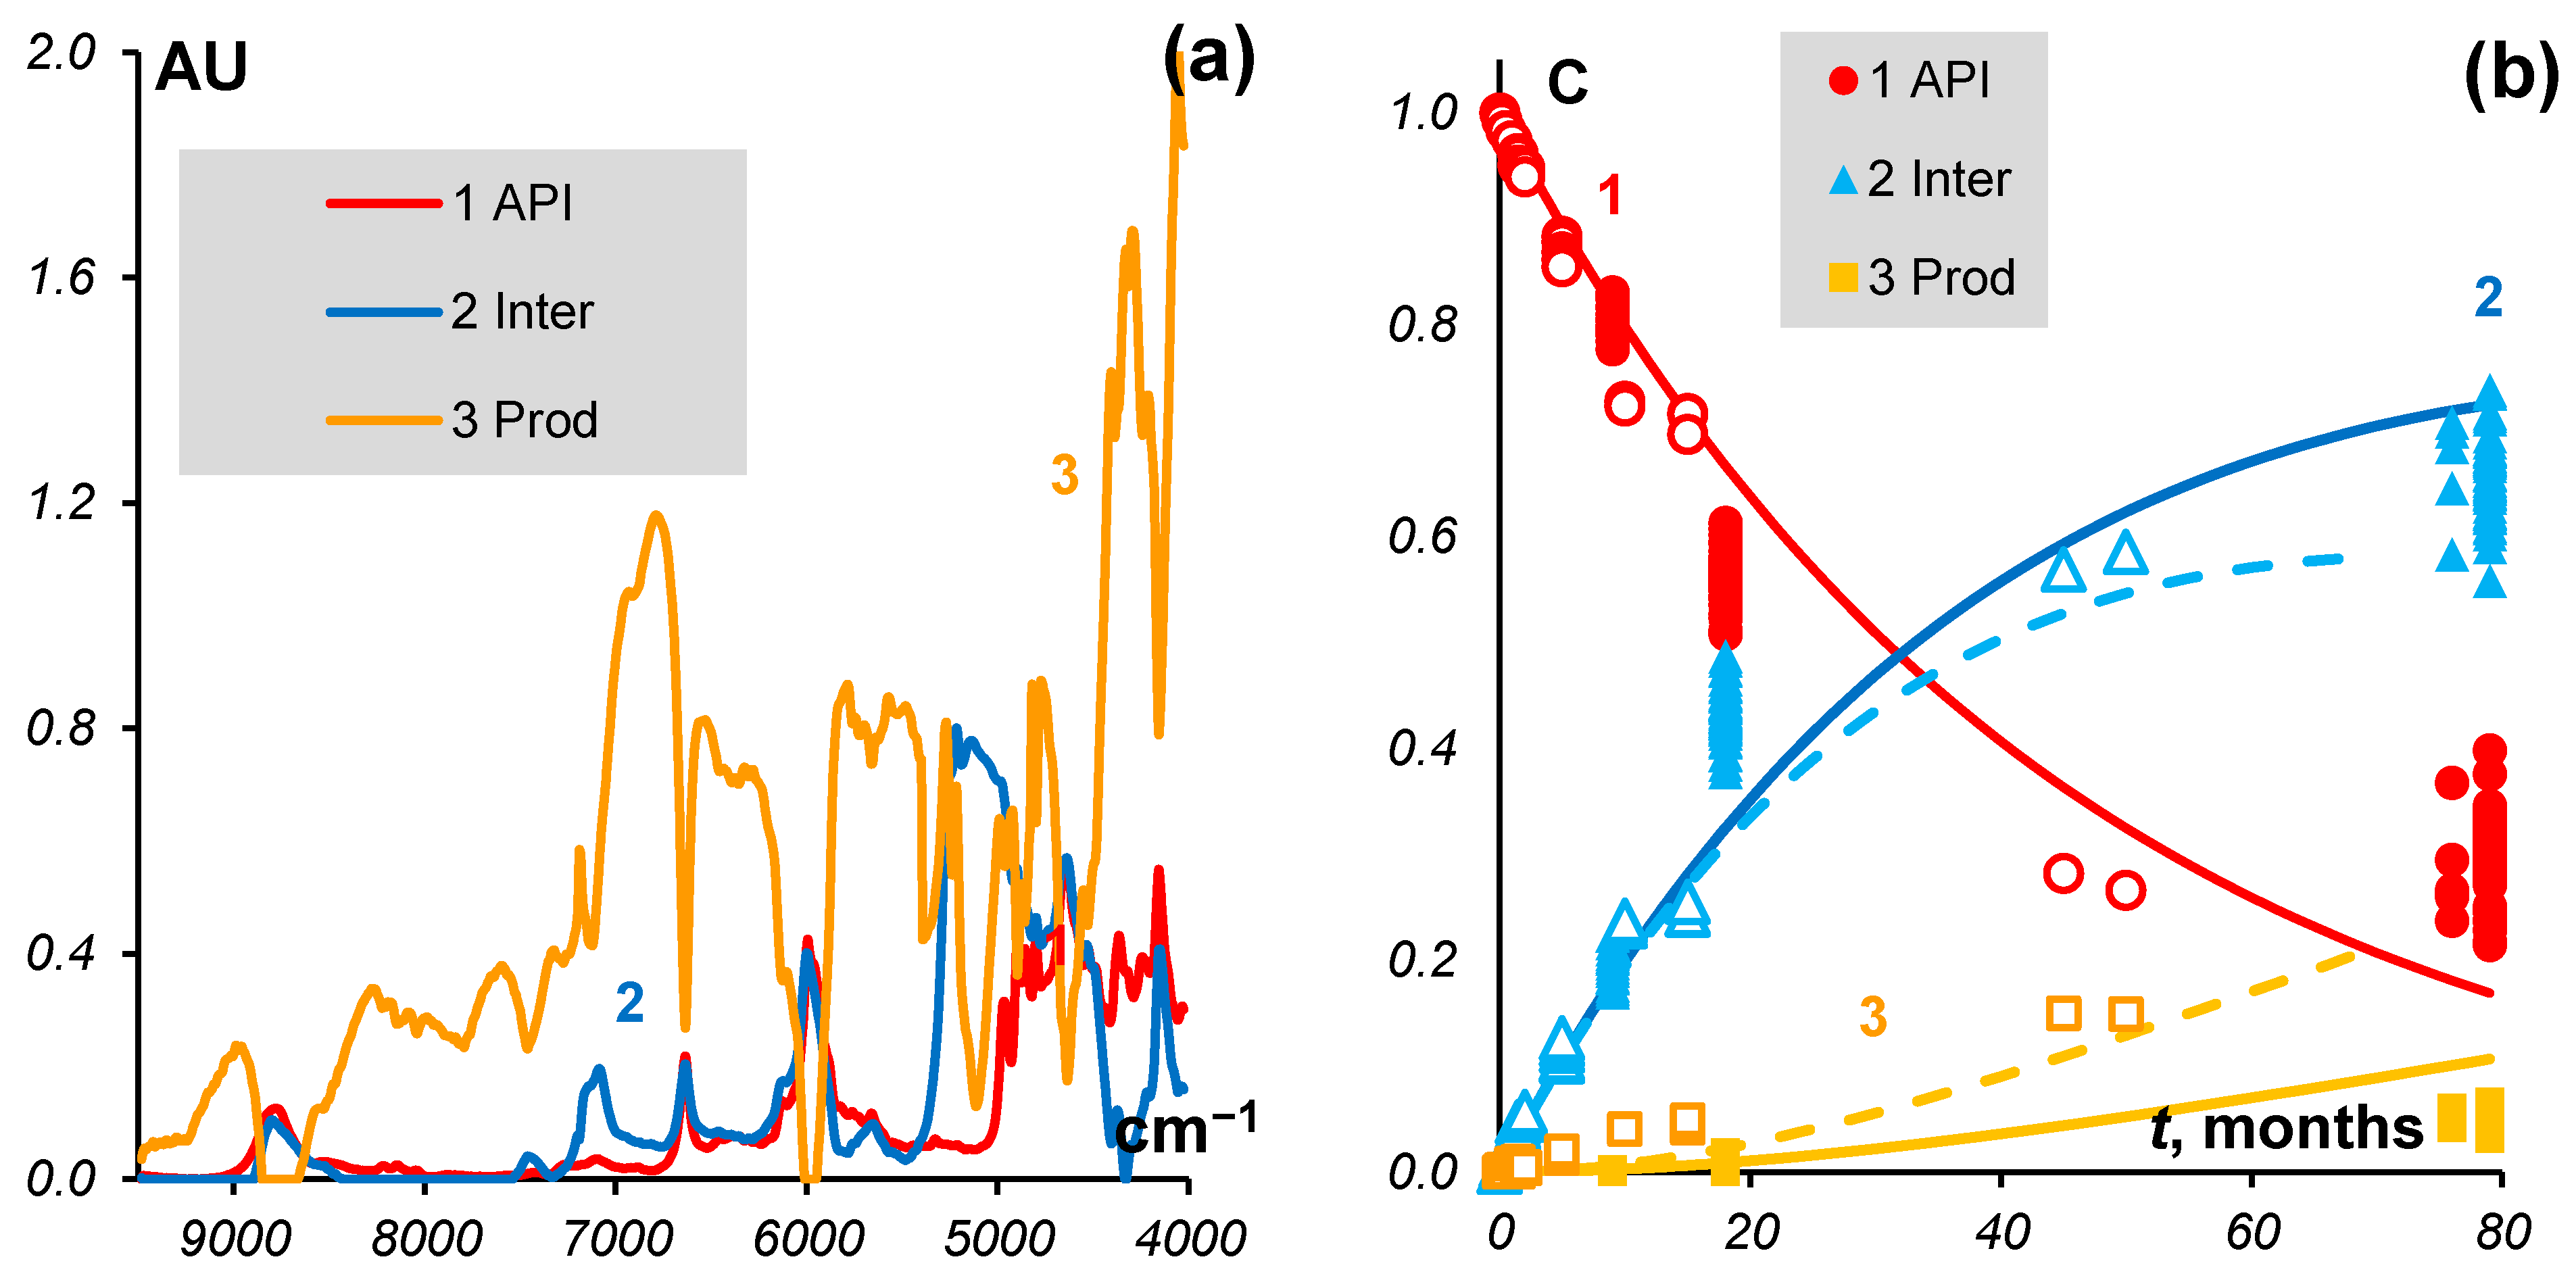
3.3. Step 3. Tablets and Substances Combined
Since both the ‘clean’ tablet data and the substance data can be described by the same three components, the MCR models and the kinetic fits should be similar. The pure spectra of Inter and Prod found by MCR should also be very similar in the case of the tablets and the substances. Therefore, since there are some differences in the results obtained using the separate data sets, it is interesting to use the combined data in order to try to have better estimates of the spectra and kinetics. The MCR model for this combined dataset has a value of LoF = 7.9%.
Here we consider the case when the second stage
is different in the tablets and substances, so the constant
k1 is the same, but
k2 is different. The spectra and kinetic model under such a hypothesis are shown in
Figure 7.
The found constants are summarized in
Table 2.
From
Figure 7, we can see that the first stage of the reaction is almost over at 79 months and API is close to complete degradation. As to the second stage, it is far from being completed. Thus, in the ‘clean’ spectra for 76 and 79 months (
Figure 5), we observe a mixture of intermediate and final products.
4. Discussion and Conclusions
Looking at the experimental setup that we are using, one could argue that it should be the last in the list of approaches suitable for kinetic analysis. In fact, we were working with the following object: the mixture of the API with known components pressed into tablets, coated with a complex cover, and packaged in the PVC film. This object was placed in an NIR spectrometer. Of course, this setup gives rise to many problems in data analysis, but it monitors the natural aging of real products, and this is the only way to understand the mechanism of aging. As was said in the introduction, we consider oxygen to be the main agent of degradation. There are two aspects we have to take into account.
First, Diclofenac itself is quite resistant to oxidation. The key role in oxidation is due to its contaminants, and impurities, acting as initiators. If these contaminants are more or less harmless, oxidation proceeds rather slowly. However, in the presence of metallic salts, the process goes quite quickly, and the tablets may deteriorate even within their theoretical shelf-life.
The second aspect is the oxygen availability in tablets and substances. It is evident that the tablets have a low concentration of O2, so the reactions occur under an oxygen shortage. On the contrary, there is an excess of O2 in the substance, so oxygen does not limit the reaction rate. These reasons explain why the rate constants in the tablet differ from those in the substances. There are even more subtle matters involved in the reaction mechanism, but we will not touch on them here.
The solution in which k1 has the same value, but k2 is different for the tablets and substances is rather unusual and it should be explained. The constant k1 means that the presence of O2 does not matter in the first step, so we must conclude that impurities are the main players here. It is their concentration that regulates the rate of the reaction. The tablets are produced from the substances (API and excipients), so it is reasonable to assume that concentrations of contaminants in the tablets and substances are the same. This could explain the fact that k1 does not change.
The second finding that k2 is different is more difficult to explain. We can only suppose that the oxidation mechanism in the second stage is not the same as in the first. We have assumed that in the first stage a degenerate chain reaction occurs with the participation of impurities acting as initiators. Due to the hydroxyl group (clearly seen near 5000 cm−1 in the NIR spectra), Inter is itself rather reactive with oxygen without an initiator. Thus, its transformation into Prod (stage 2) is controlled by the O2 concentration, which is much higher in the substance than in the tablet. This possible mechanism for the second stage could explain why k2 in the second stage is 2.5 times greater than in the first.
We understand that moving from one stage of data processing to the other, we extract more information regarding the intermediate and final products, but on the other hand, we inevitably add extra noise to spectral data. This is the reason why we do not analyze the final ‘pure’ spectra of Inter and Prod in detail. At the same time, using multi-step MCR and kinetic modeling, we managed to propose the mechanism of degradation of a rather complex object, sealed Diclofenac tablets.


