Article

Synthesis of Nanosilica for the Removal of Multicomponent Cd2+ and Cu2+ from Synthetic Water: An Experimental and Theoretical Study

by
Basel Al-Saida
1,
Arwa Sandouqa
2,
Reyad A. Shawabkeh
2,* and
Ibnelwaleed Hussein
3,4,*
1
Department of Chemistry, Faculty of Science, Al-Balqa Applied University, Salt 19117, Jordan
2
Chemical Engineering Department, School of Engineering, The University of Jordan, Amman 11942, Jordan
3
Gas Processing Center, College of Engineering, Qatar University, Doha P.O. Box 2713, Qatar
4
Department of Chemical Engineering, College of Engineering, Qatar University, Doha P.O. Box 2713, Qatar
*
Authors to whom correspondence should be addressed.
Molecules 2022, 27(21), 7536; https://doi.org/10.3390/molecules27217536
Submission received: 14 September 2022 / Revised: 24 October 2022 / Accepted: 27 October 2022 / Published: 3 November 2022

Abstract

:
Copper and cadmium ions are among the top 120 hazardous chemicals listed by the Agency for Toxic Substances and Disease Registry (ATSDR) that can bind to organic and inorganic chemicals. Silica is one of the most abundant oxides that can limit the transport of these chemicals into water resources. Limited work has focused on assessing the applicability of nanosilica for the removal of multicomponent metal ions and studying their interaction on the surface of this adsorbent. Therefore, this study focuses on utilizing a nanosilica for the adsorption of Cd2+ and Cu2+ from water. Experimental work on the single- and multi-component adsorption of these ions was conducted and supported with theoretical interpretations. The nanosilica was characterized by its surface area, morphology, crystallinity, and functional groups. The BET surface area was 307.64 m2/g with a total pore volume of 4.95 × 10 3 cm3/g. The SEM showed an irregular amorphous shape with slits and cavities. Several Si–O–Si and hydroxyl groups were noticed on the surface of the silica. The single isotherm experiment showed that Cd2+ has a higher uptake (72.13 mg/g) than Cu2+ (29.28 mg/g). The multicomponent adsorption equilibrium shows an affinity for Cd2+ on the surface. This affinity decreases with increasing Cu2+ equilibrium concentration due to the higher isosteric heat from the interaction between Cd and the surface. The experimental data were modeled using isotherms for the single adsorption, with the Freundlich and the non-modified competitive Langmuir models showing the best fit. The molecular dynamics simulations support the experimental data where Cd2+ shows a multilayer surface coverage. This study provides insight into utilizing nanosilica for removing heavy metals from water.

1. Introduction

Water pollution by dyes and toxic heavy metals represents a principal global environmental issue [1,2,3,4]. Heavy metals, such as Cu(II), Cd(II), Cr(VI), Cu(II), Hg(II), and As(III, V), are some of the most harmful pollutants due to their high toxicity, solubility in water and impact on aquatic ecosystems, and hazardous environmental effects [5,6,7]. Unlike organic pollutants, heavy metals are non-biodegradable and accumulate in living organisms. There are many sources that discharge heavy metals into water systems, such as metal plating, smelt, and electrolysis industries [8,9]. Releasing large amounts of heavy metals into water systems has severe environmental impacts. Copper and cadmium, for example, are considered among the top toxic substances that need urgent treatment [10]. According to the recommendations of the World Health Organization (WHO), drinking water’s standards for Cd2+ and Cu2+ levels are 0.003 ppm and 1.3 mg/L, respectively [11]. The United States Environmental Protection Agency (USEPA) has set these values in drinking water to 0.005 ppm and 2.0 mg/L, respectively [12,13].
Numerous treatment methods have been adopted to remove these heavy metals from down streams using precipitation [14], ion exchange [15], photo-Fenton oxidation [16], flocculation [17], electrochemical treatment [18], and adsorption [3,19,20]. Some of these methods have limitations, including producing harmful byproducts [21], high energy consumption, and high installation costs [22]. Adsorption, on the other hand, has gained great interest from many researchers due to its low cost of operation, ease of handling, high efficiency at low concentrations, and desorption ability [23,24].
Many adsorbents are available in the literature for removing heavy metals from aqueous solutions. These include activated lignocellulosic materials, alumina, silica, aluminosilicates, and nanodiamond materials [25,26,27,28,29].
When dealing with the fate of these heavy metals in water aquifers, silica (SiO2) is the most abundant natural adsorbent for capturing these metals before reaching the water blanket. It has gained significant interest because of its unique properties as an eco-friendly adsorbent with very low toxicity and rigidity [30,31]. Due to its high surface area (ca. 180–400 m2/g) [32], a wide range of zero point of charge (depending on impurities pHZPC 3.8–7.1) [33], stability, strength, and recyclability, nanosized silica has been used in many applications [34]. However, the literature has little information on using this adsorbent for the multi-component removal of copper and cadmium.
This research aims to prepare a nanoscale silica using the sol–gel method and apply this material for the simultaneous removal of Cu2+ and Cd2+ from water. Adsorption isotherm experiments using a multi-component system coupled with isotherm models are presented.

2. Theoretical

The Langmuir isotherm is used to predict the monolayer coverage of single metal ions on the surface of the produced nanosilica. The model assumes a finite and uniform number of adsorbed sites, where the surface reaches a maximum adsorption capacity at equilibrium. This model is presented in Equation (1) [35]:
q e = Q k C e 1 + k C e  
where q e [ mg / g ] is the solid uptake at a given equilibrium concentration of a metal ion in solution, C e [ mg / L ]; Q m a x is the maximum metal ion uptake by the surface [ mg / g ]; and k is a constant related to the affinity of the binding sites and is directly proportional to the energy of adsorption (L/mg).
To predict the surface energy heterogeneity of the active adsorption sites, the Freundlich isotherm is employed using the following equation [36]:
q e = k L   C e
where k L and are the isotherm constants.
The Dubinin–Radushevich (DR) isotherm is applied to distinguish the type of adsorption of the metal ions based on the mean free energy of interaction and pore-filling, instead of layer-by-layer coverage [37]. The amount of ion uptake, q e [ mg / g ], is related to the adsorption potential, ε [ kJ / mol ], based on the following equations:
q e = Q   e k d   ε 2  
ε = R T l n 1 + 1 C e  
where Q m a x is the maximum metal ion uptake by the surface [ mg / g ], and k d [ mol 2 / kJ 2 ] is a constant related to the mean adsorption energy, E [ kJ / mol ], as calculated using the following equation:
k d = 1 2 E

3. Material and Methods

3.1. Materials and Reagents

Tetraethoxysilane (TEOS 98% Fluka), nitric acid (AR 65–68% JHD), sodium hydroxide (99% GCC), and ethanol absolute (AR 99.9% Merck) were used.

3.2. Synthesis of the Nanosilica Material

Tetraethoxysilane (TEOS) is a precursor for synthesizing nanosilica using the sol–gel method (Scheme 1). First, a mixture (A) of 10 mL of ethanol, 10 mL of distilled water, and 5 mL of concentrated HNO3 was added to a mixture (B) of 20 mL of ethanol and 20 mL of tetraethoxysilane using dropwise addition with continuous stirring for 15 min. The mixture was stirred for 15 min and left heated at around 80–90 °C for one minute; the milky formed gel indicated the formation of nanoparticles. Finally, the nanoparticles were aged for 24 h, dried at 50 °C, and then calcined for two hours at 400 °C to obtain the nanosilica (NS) [38].

3.3. Characterization of Nanosilica Materials

The synthesized nanosilica was fully characterized using a Fourier transform infrared (FTIR) spectroscopy, an X-ray diffraction (XRD), a differential scanning calorimetry (DSC), a scanning electron microscopy (SEM), and an atomic absorption spectroscopy (AAS).

3.4. Adsorption Isotherms

The adsorption isotherm was determined by mixing 0.1 gm of the adsorbent with 50 mL of a metal solution that included varying initial metal concentrations ranging from 25–200 ppm. The pH of the multicomponent solution was adjusted to 6.0 using NaOH (1 M) and kept at 25 ± 1 °C (room temperature) for 72 h to attain equilibrium. Then, the concentrations of Cu+2 and Cd+2 were measured using an atomic absorption spectroscopy.

4. Results and Discussion

4.1. Structure Characterization of the Nanosilica

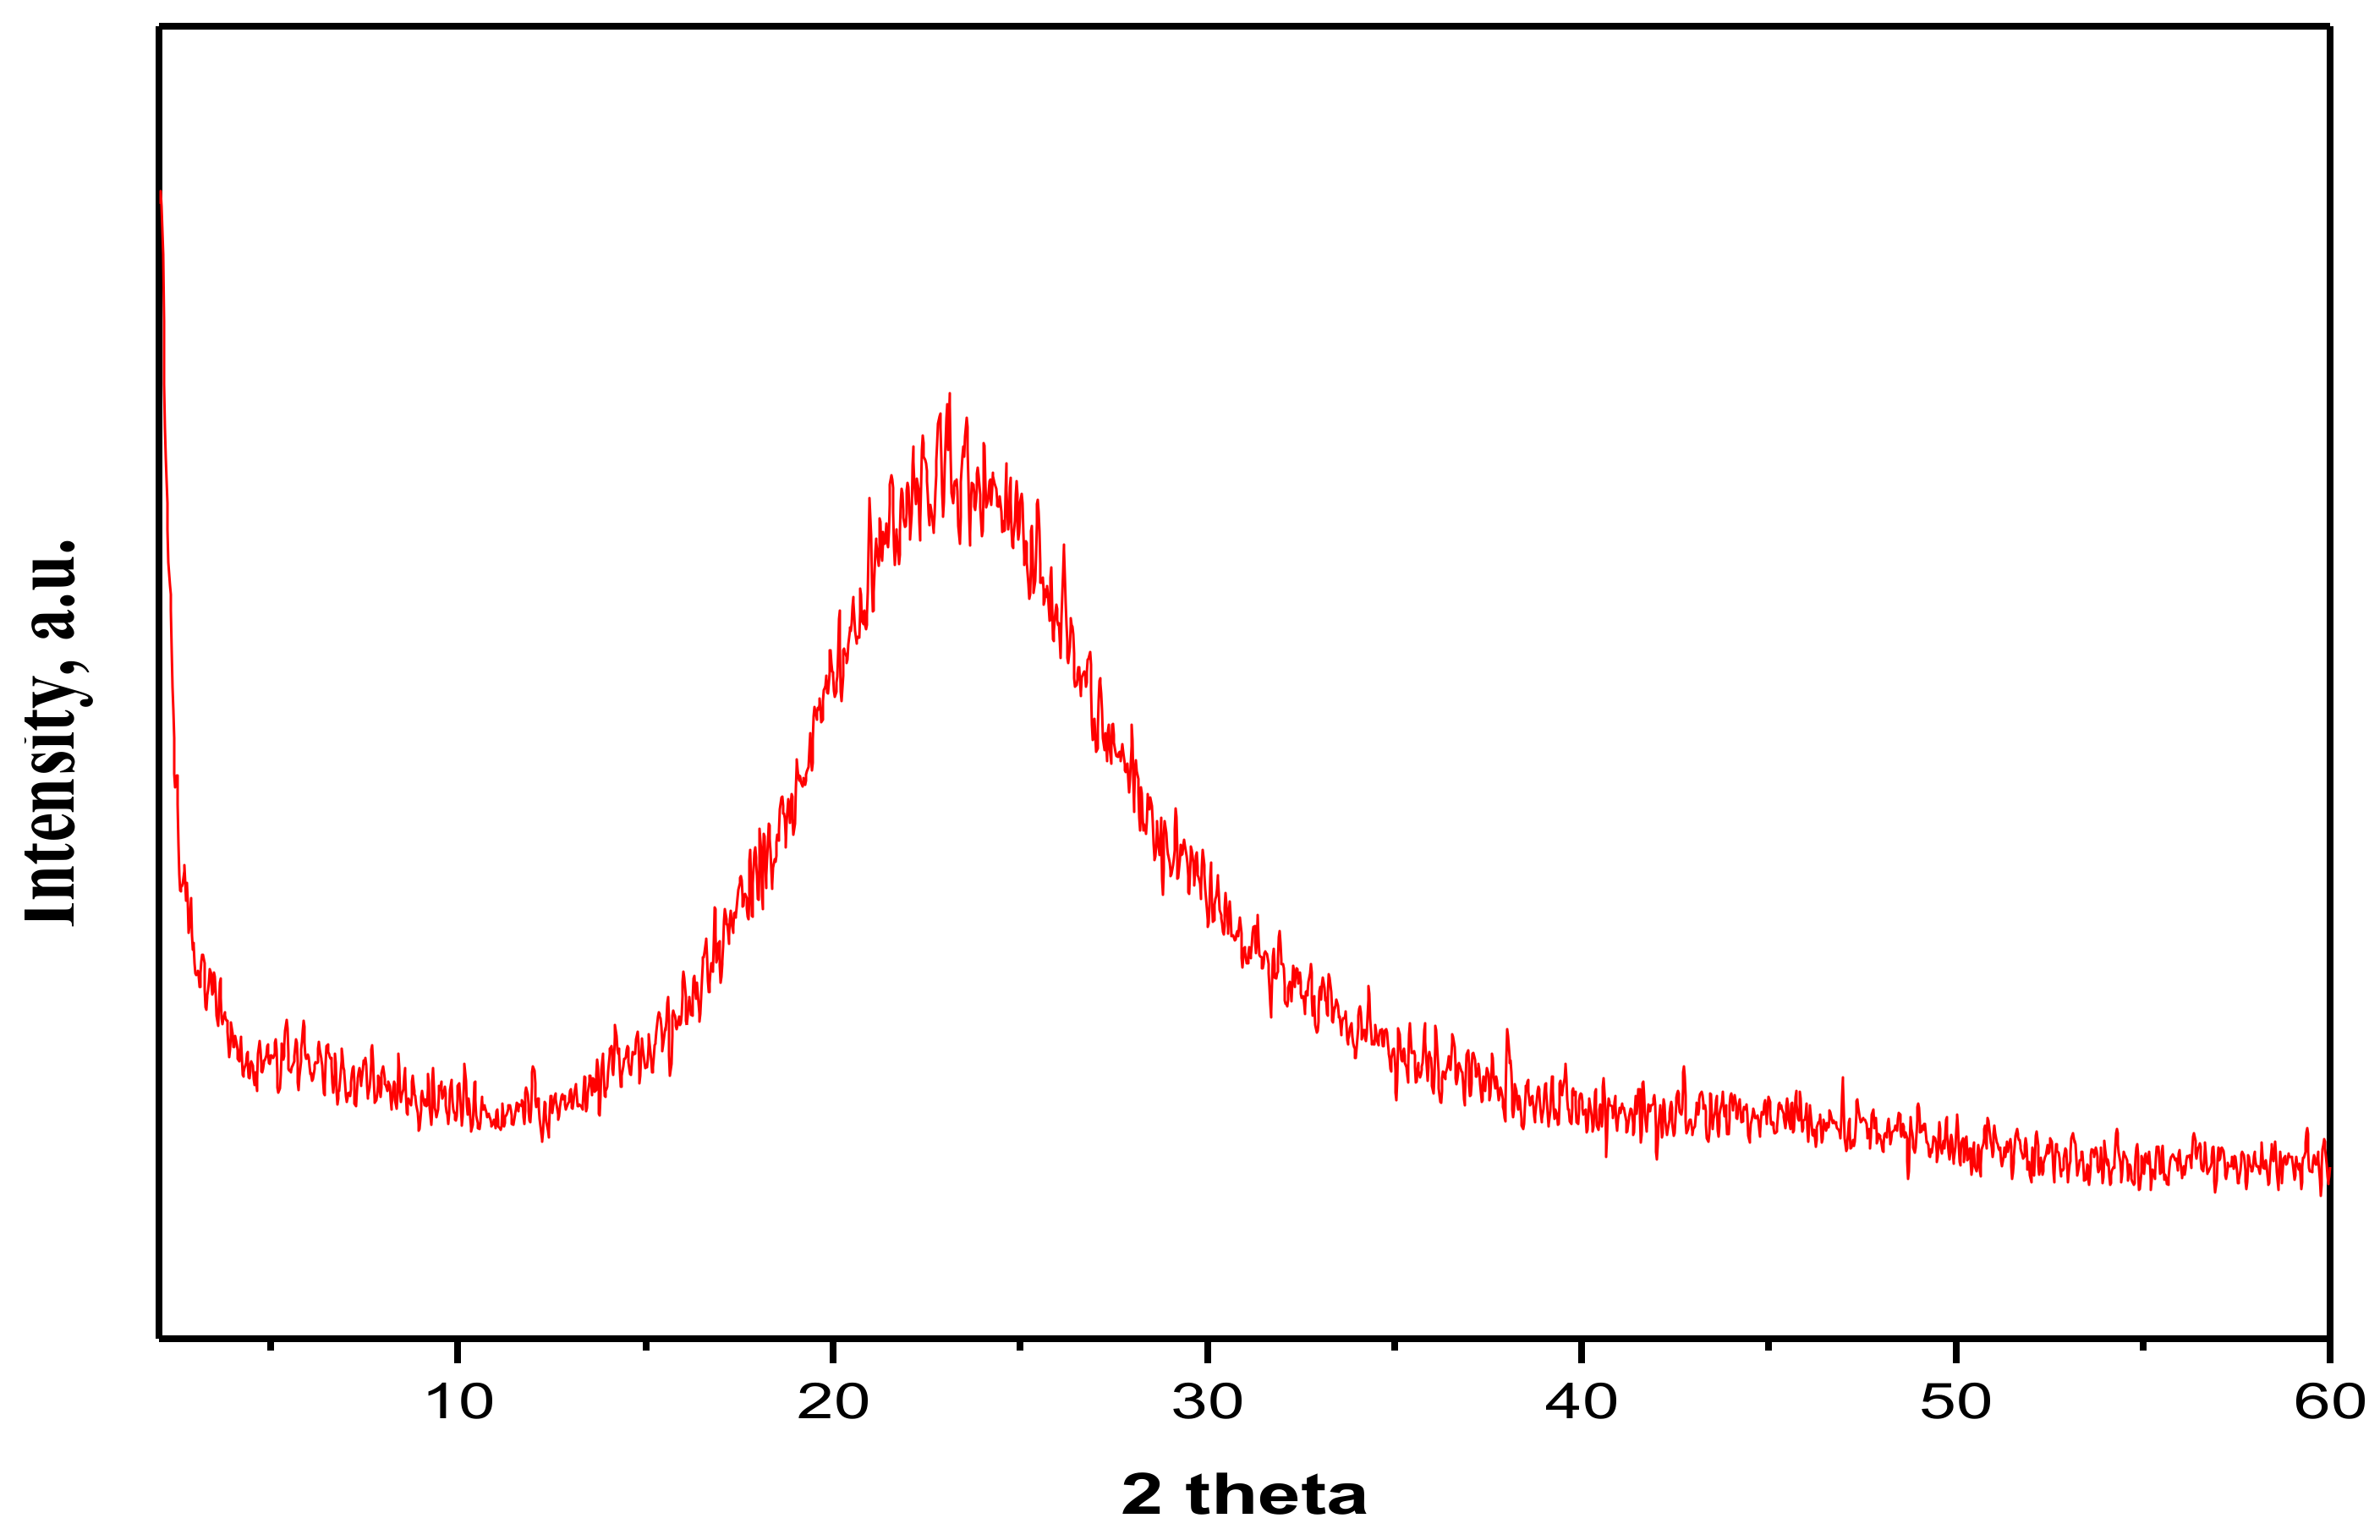
The XRD chromatogram for the produced nanosilica (Figure 1) shows a broad peak at ca. 23 2 θ with a peak width of 20 2 θ and an intensity of 850 counts. This peak broadness represents an amorphous silica due to non-arranged crystals in 3D space; hence, X-rays are scattered in several directions [39,40]. The Scherrer equation was used to determine the crystal size, d   nm , as follows:
d = K   λ B   cos θ
The shape factor of the measured crystals, K , is approximated to 0.94 for the Full Width at Half the Maximum peak of spherical crystals with cubic symmetry. The wavelength, λ , has a value of 0.15418 (Cu K-alpha). The value of B is 9.6 2 θ , considered at the FWHM. Consequently, the grain size of the silica is calculated to be 3.6 nm, which agrees with published work [41,42]. The broad diffracted peak of the produced material is attributed to the amorphous structure of the sample.
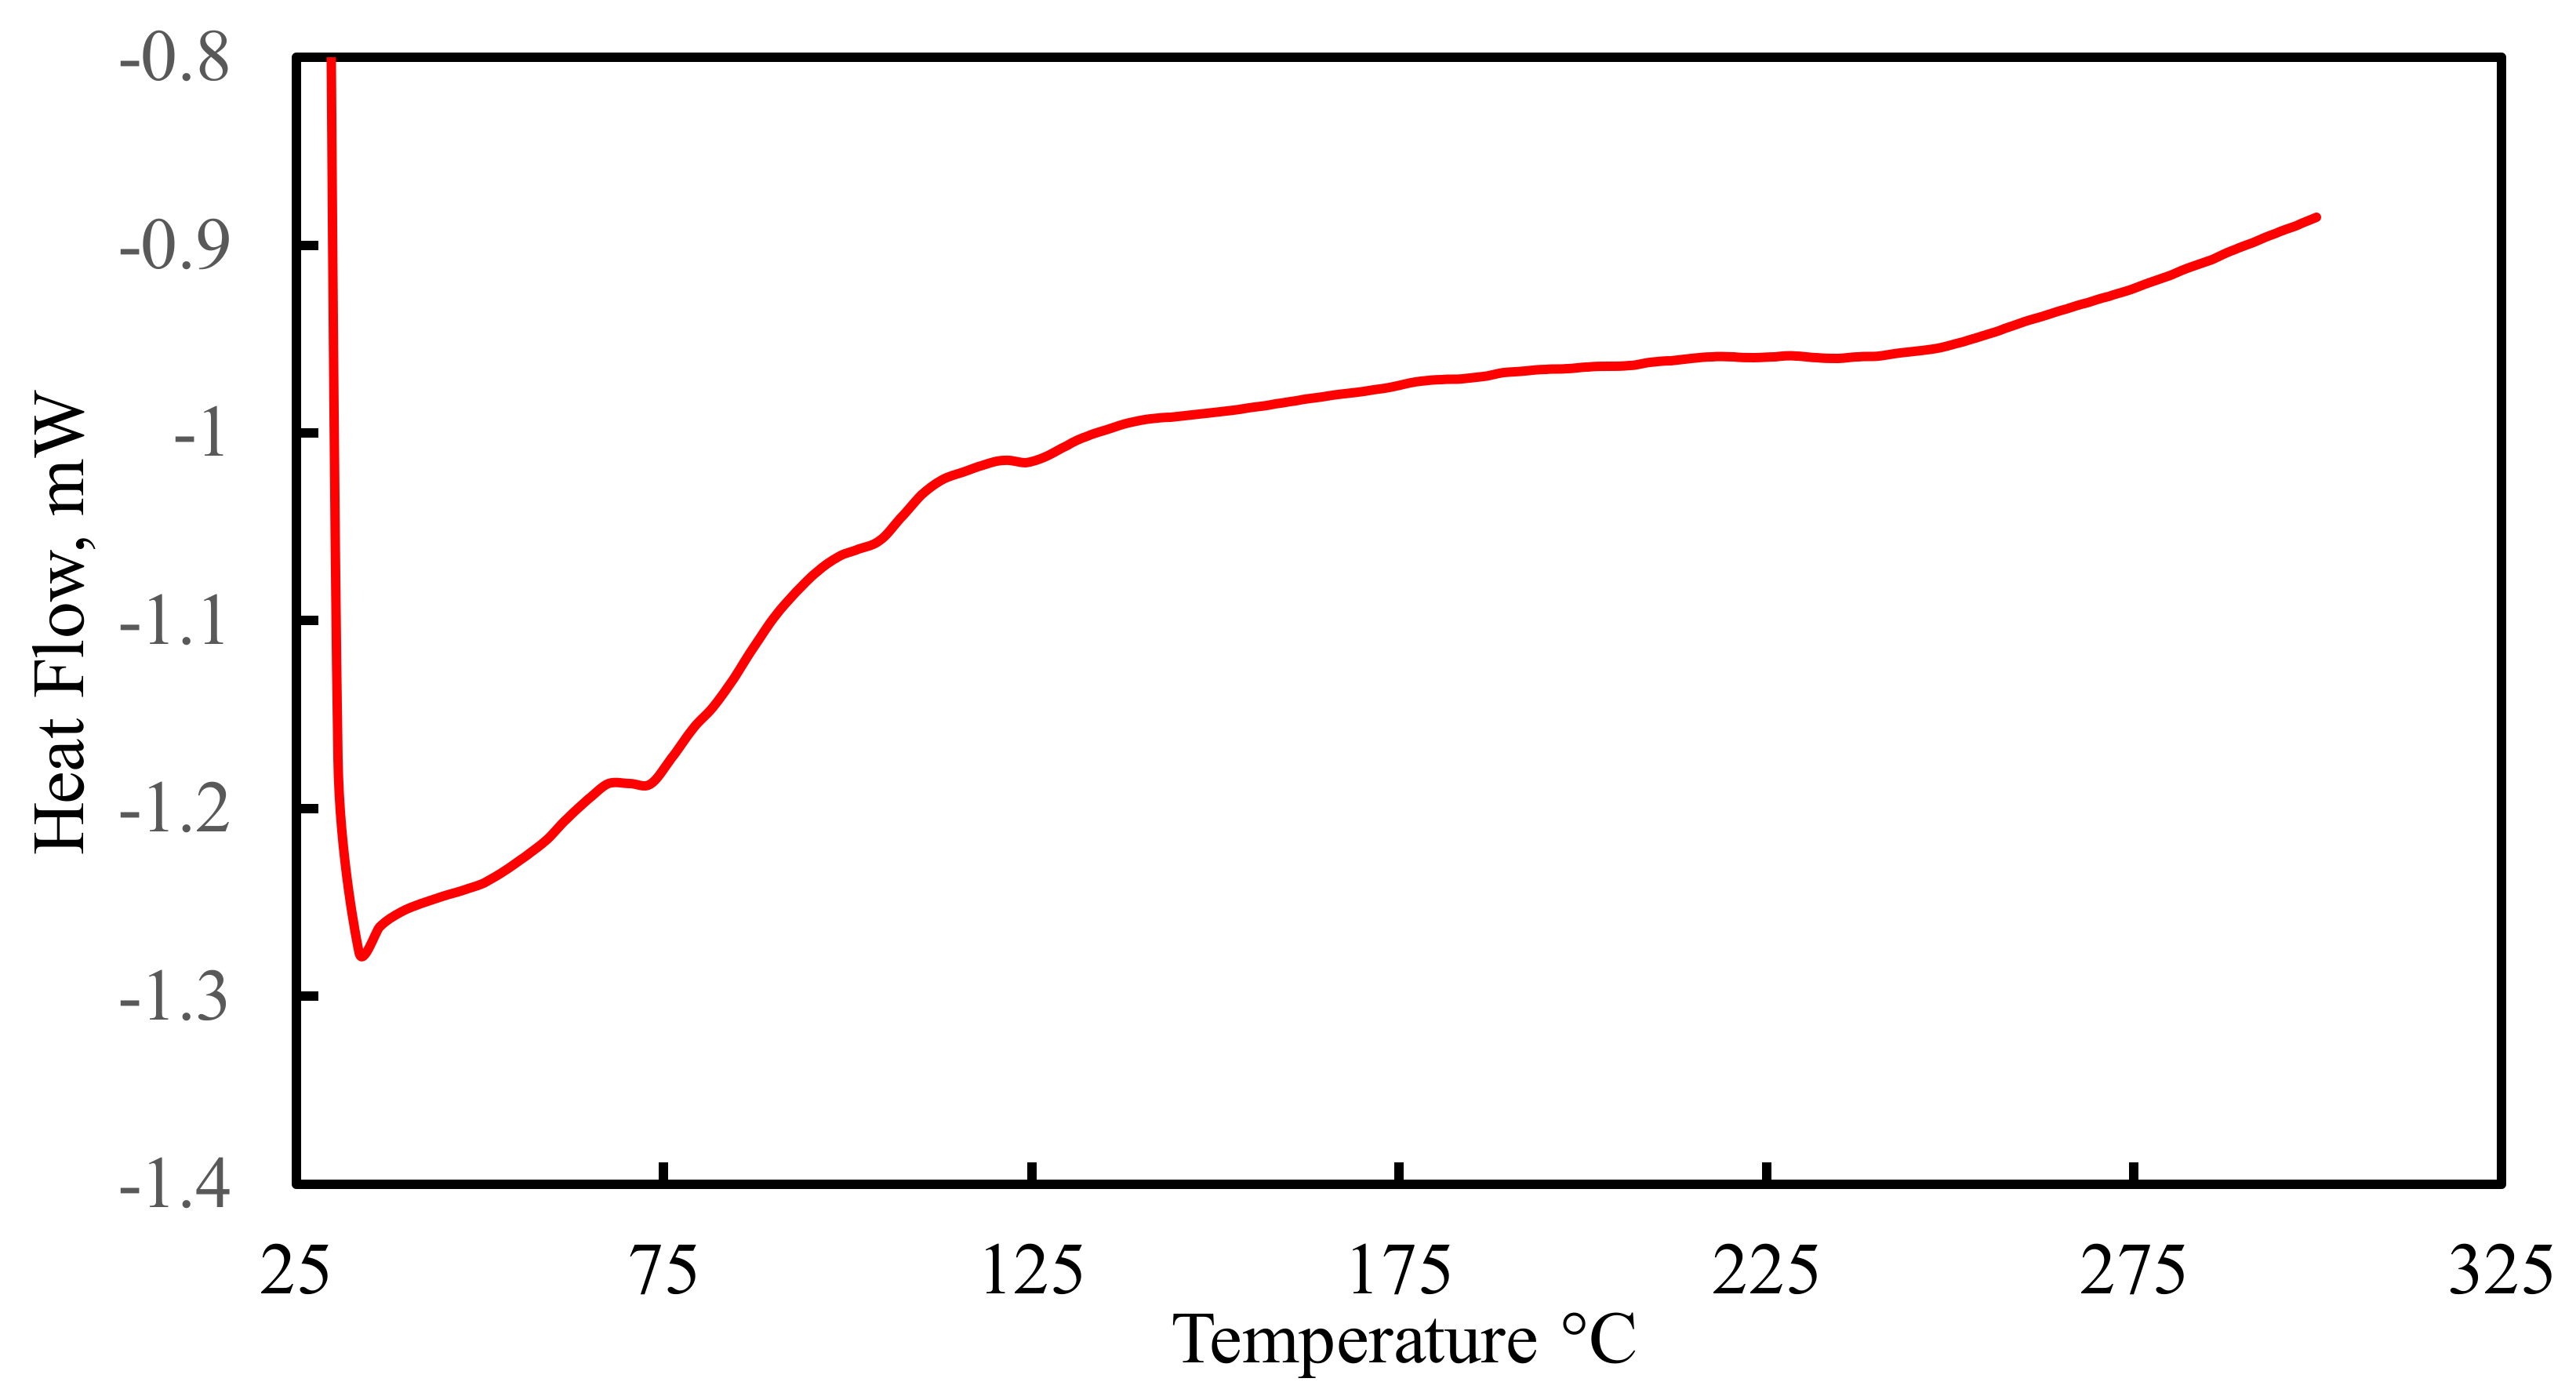
Differential scanning calorimetry for the produced silica sample was conducted in the temperature range from 0 to 300 °C (Figure 2). At a temperature of around 33.5 °C, the silica particles show removal of nonbounded free water that has a weak interaction with the surface [43], resulting in the endothermic effect of water dropping from about 0 to −1.25 mW. Then, there is a gradual increase in heat flow with increasing temperature. In addition, a continuous weight loss appears with increasing temperature up to 104–110 °C with a change in slope at 73 °C. At a temperature of ca. 243 °C, there is a change in the slope that might be attributed to structural hydroxyl elimination, according to Scheme 2:
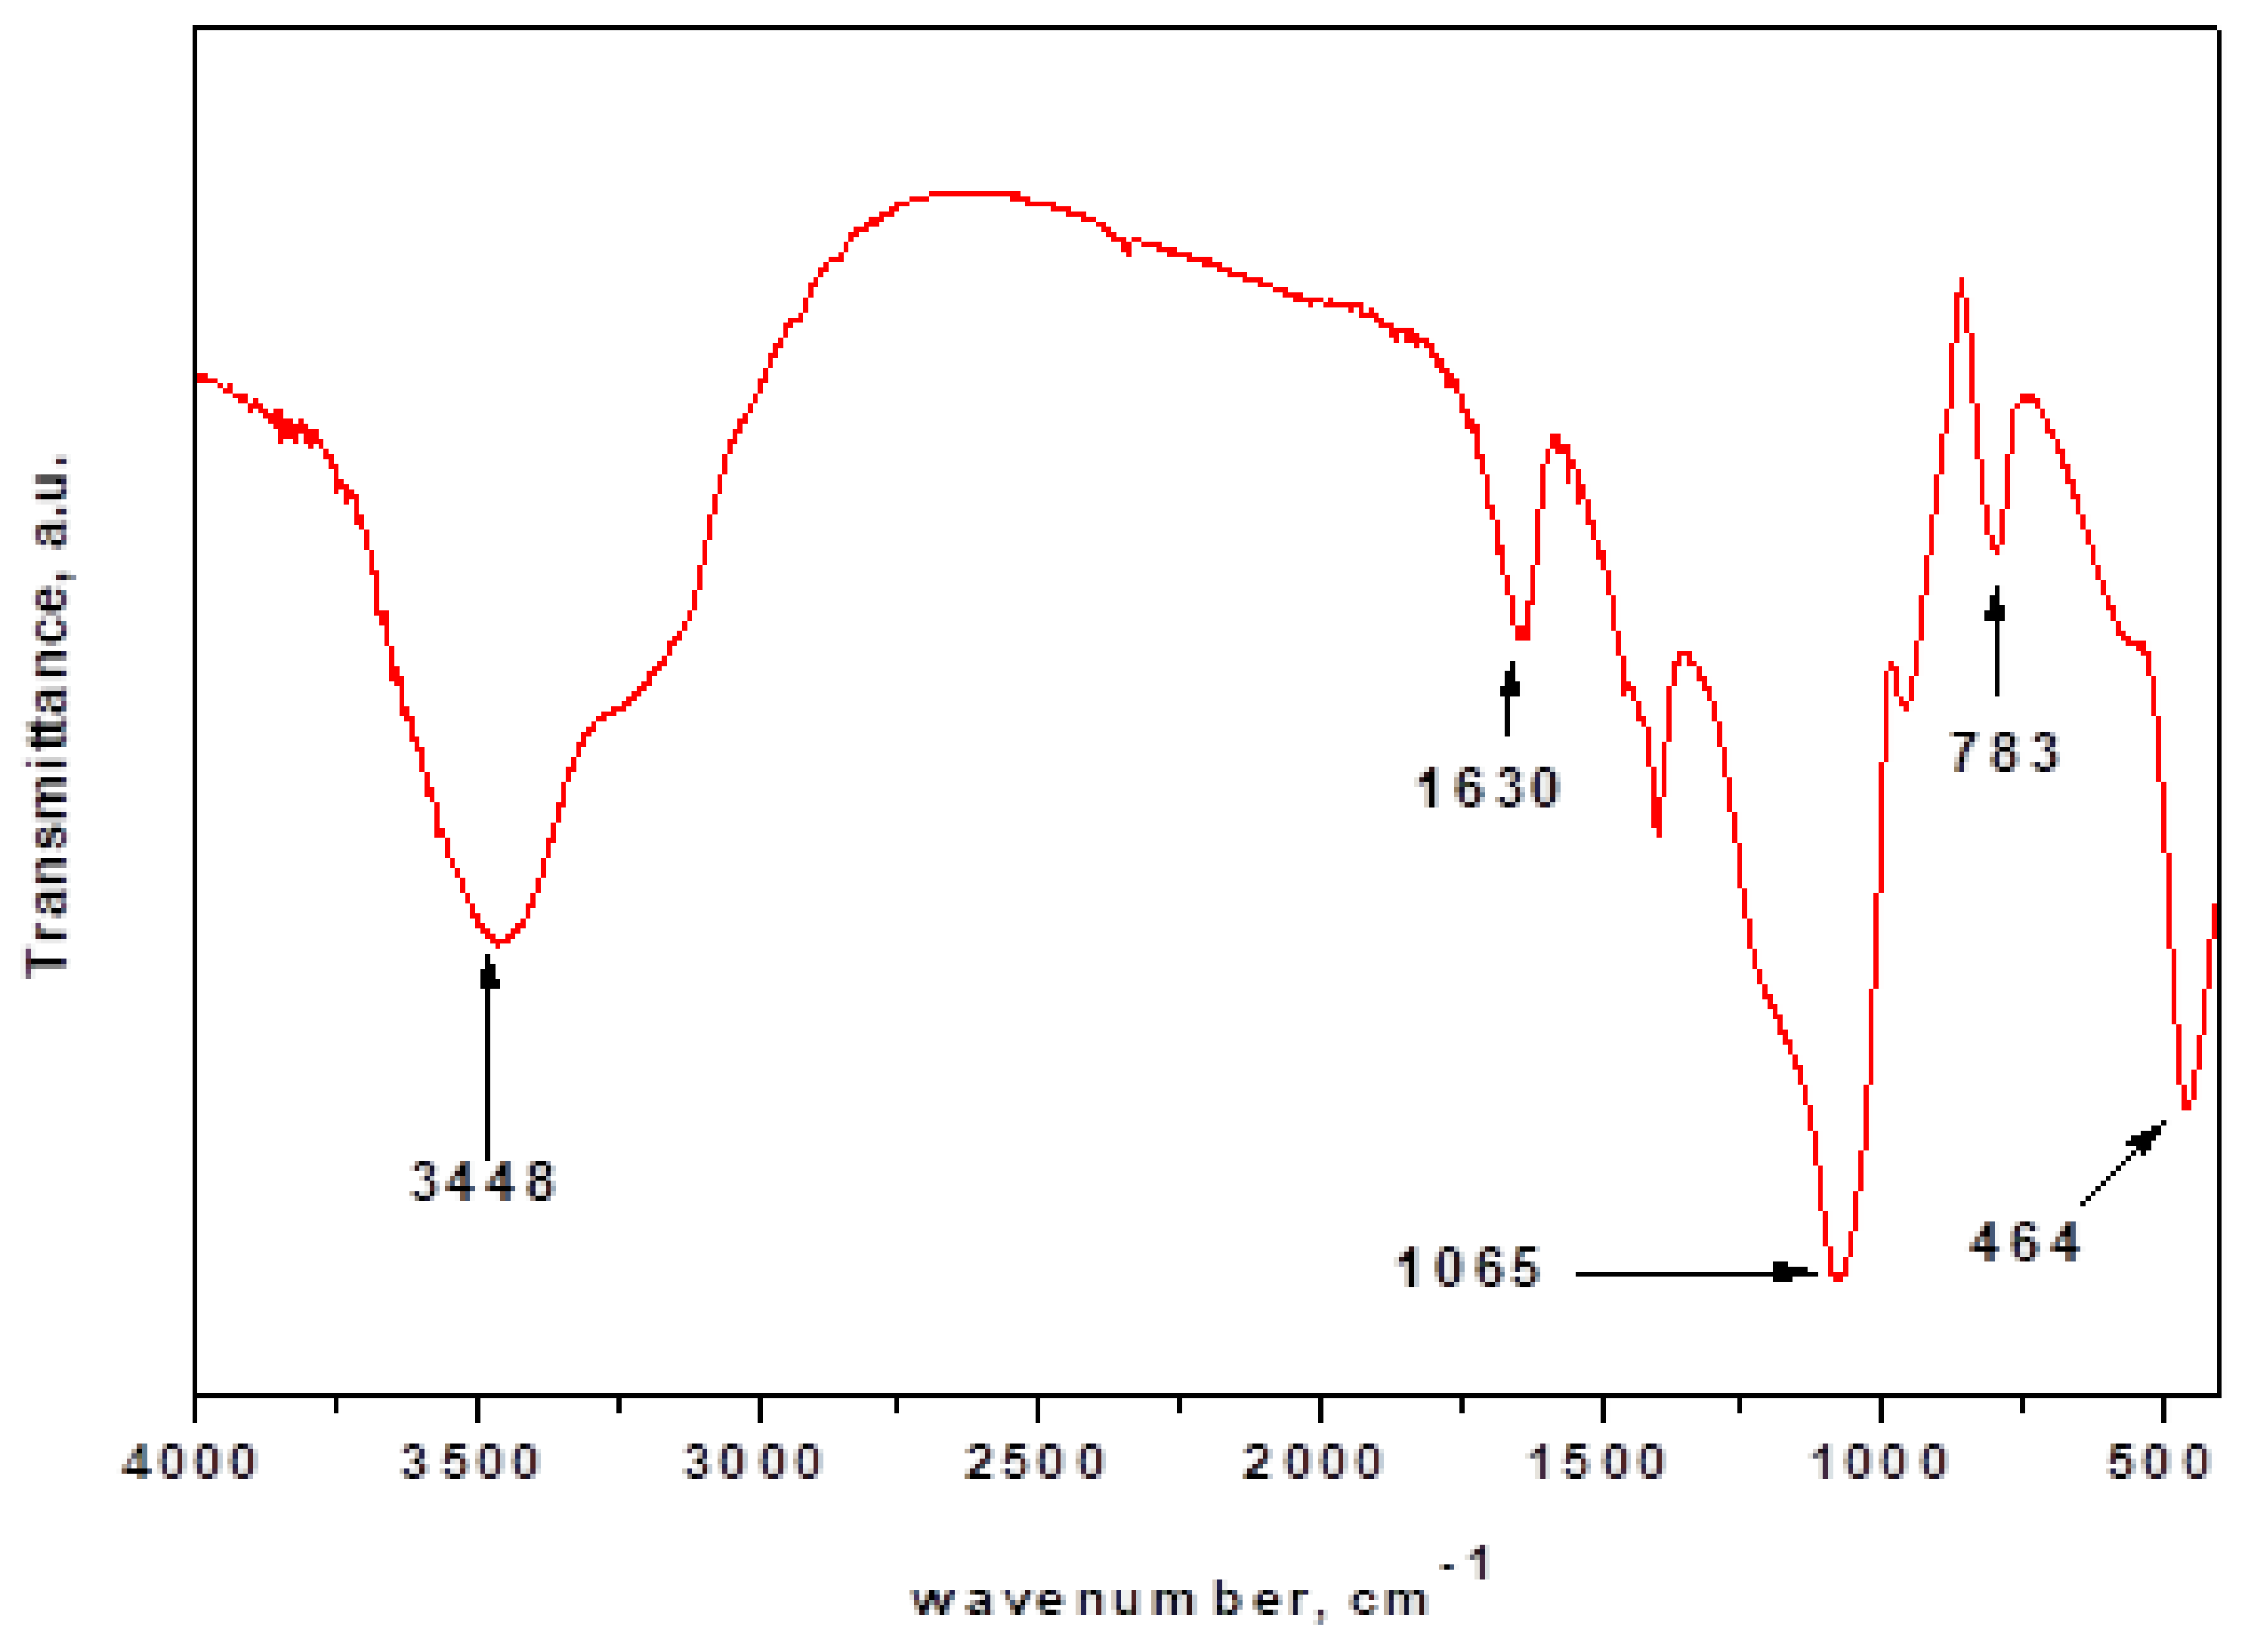
The silica nanoparticles’ functional groups before interaction with the cadmium and copper ions were investigated, and the FTIR is shown in Figure 3. An absorption peak at 3160 cm−1 and at 1636 cm−1 is attributed to the -OH group and H–O–H vibrations [44]. The peak belonging to the Si–O–Si stretching vibration is at 1041 cm−1, and the peak around 778 cm−1 corresponds to the Si–O–Si symmetric stretching [45].
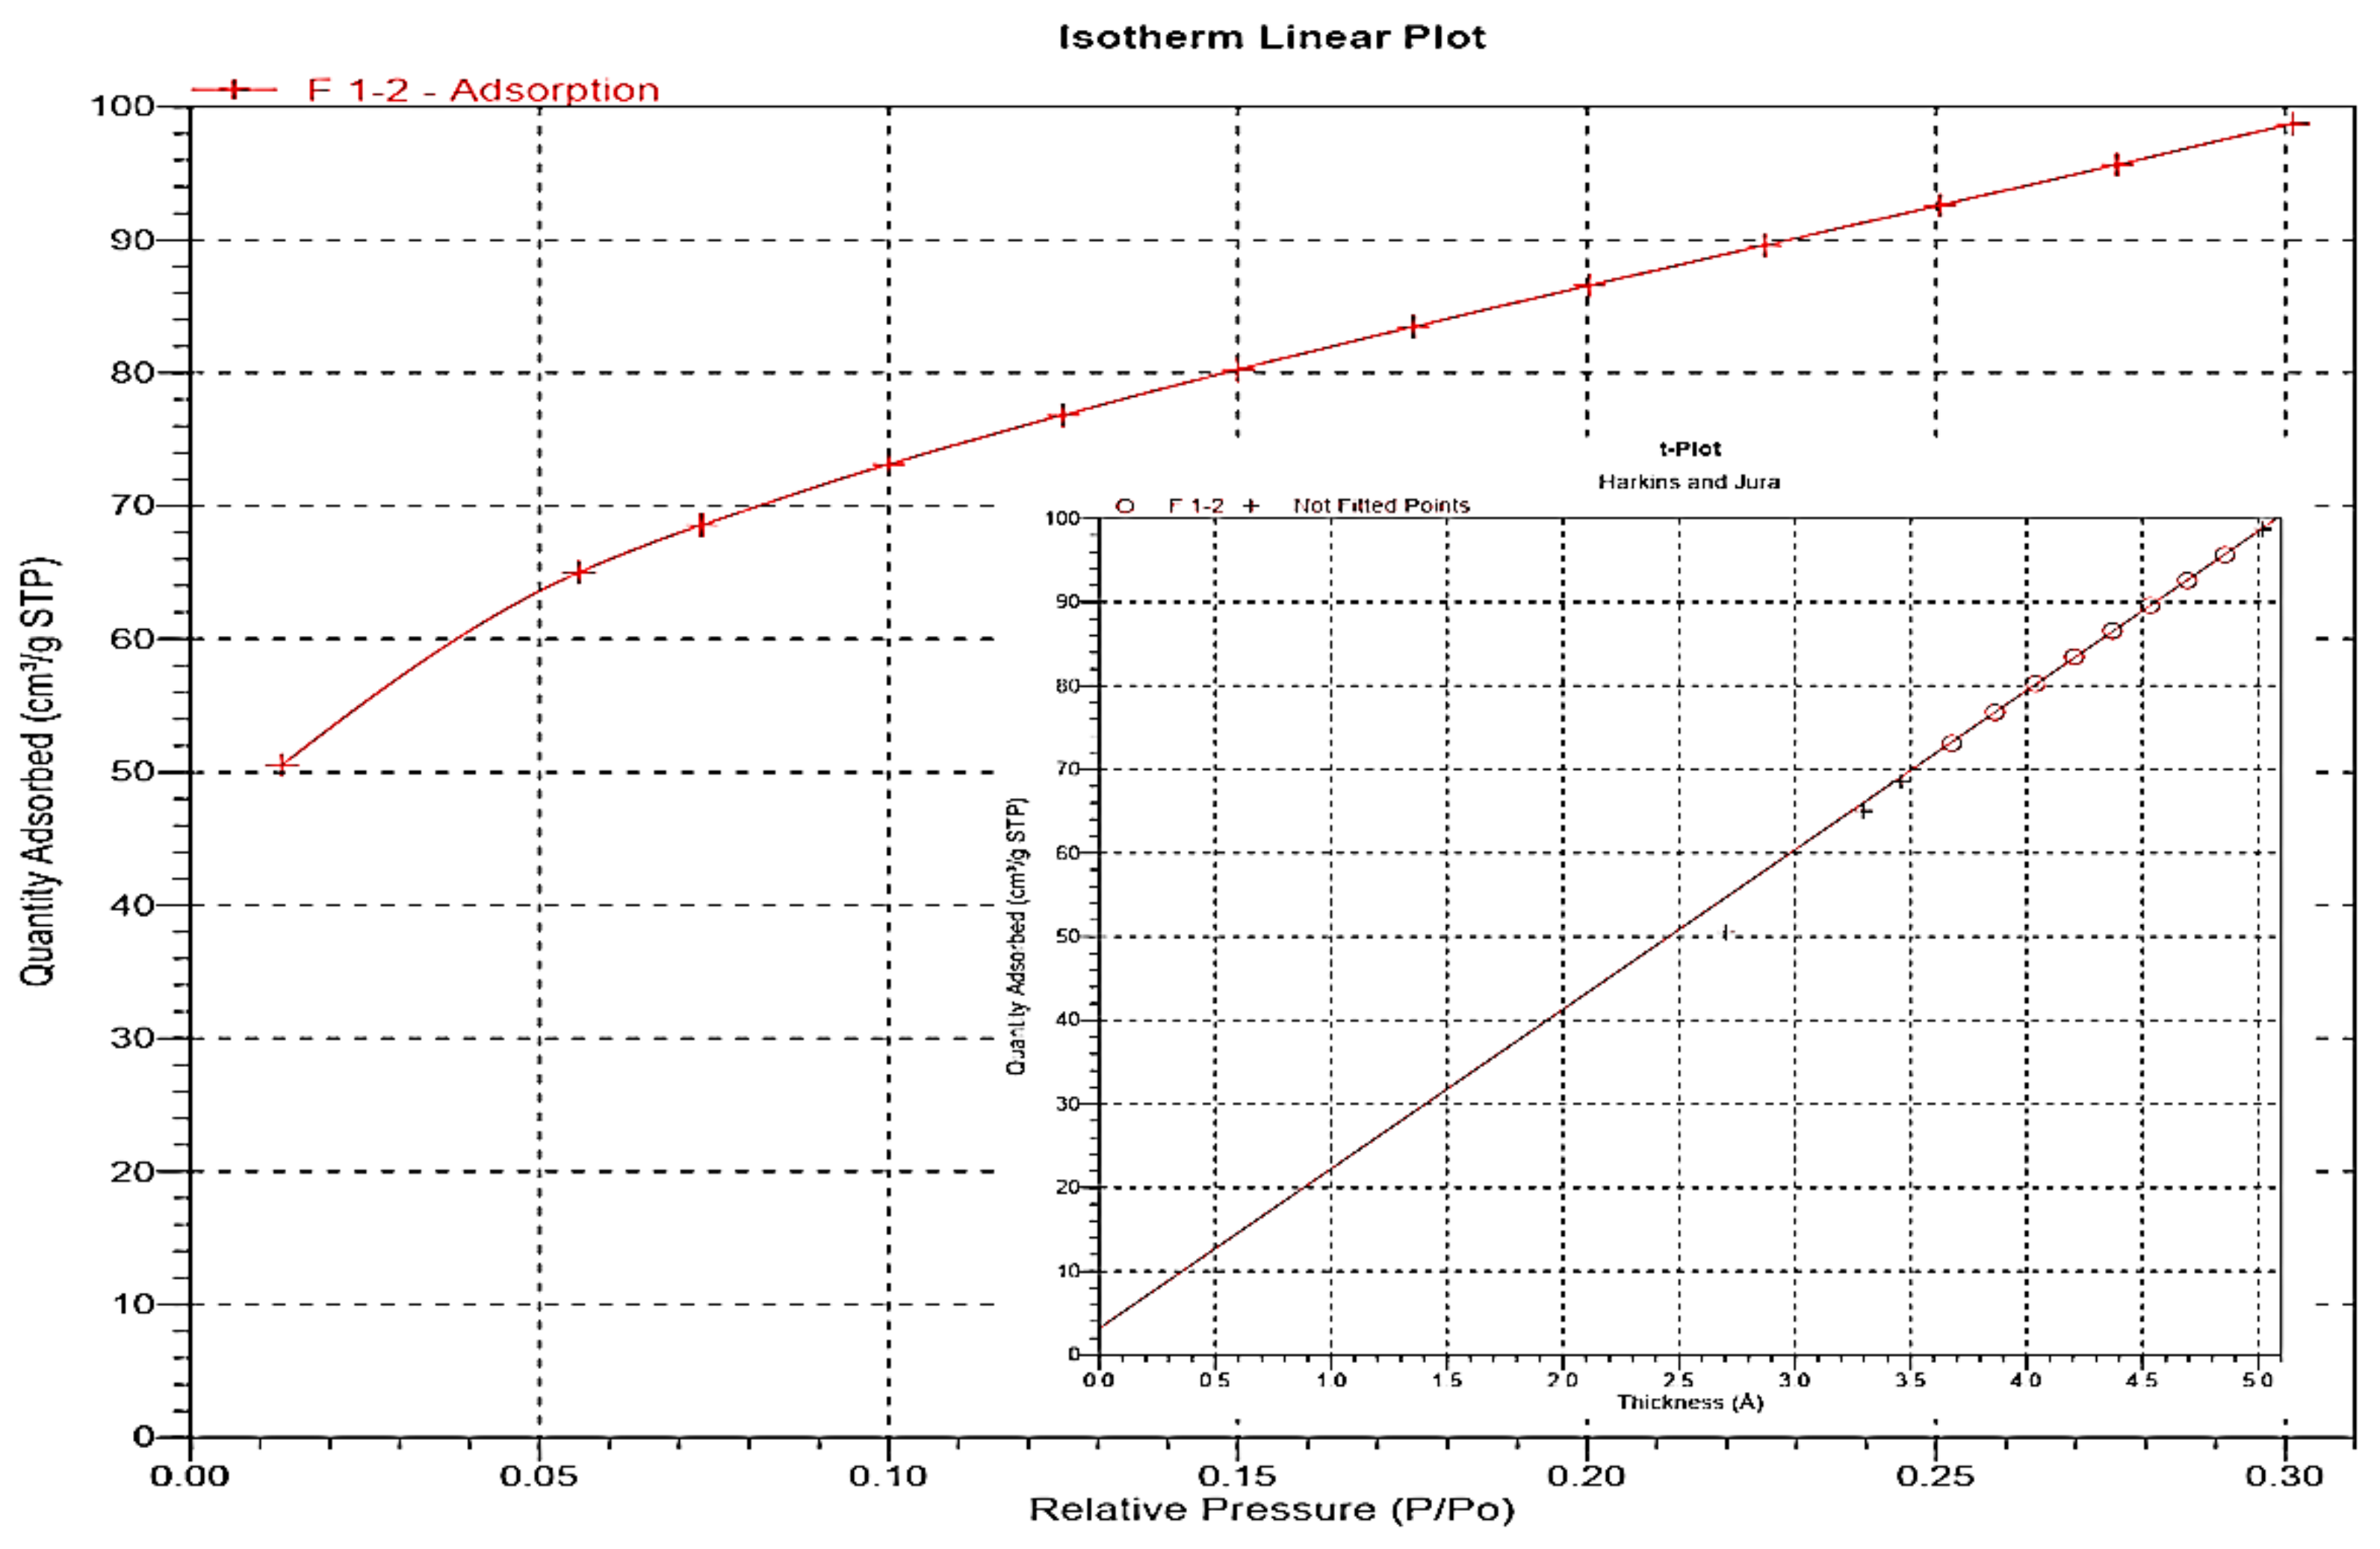
The BET adsorption isotherm of N2 at 77 K by the produced silica sample is illustrated in Figure 4. It is shown that, with an increase in the relative pressure of nitrogen from 0.05 to 0.3, the quantity of nitrogen uptake increases linearly from 65 to 98 cm3/g at STP with a slope of 133.3. A plot of the linearized BET isotherm yields a monolayer coverage of 70.67 cm3/g and a constant value of 140. This produces a single-point surface area of 300.4 m3/g and a multi-point value of 307.6 m2/g, as shown in Table 1. The sample surface area obtained from the Langmuir isotherm offers a value of 461 m3/g. A micropore volume of 0.0049 cm3/g and an area of 12.89 m2/g are achieved at a relative pressure (P/Po) of less than 0.1. Hence, the micropore depth is 0.384 nm. The total pore radius is obtained using the Kelvin Equation (Equation (8)) and shows a value of 49 nm to indicate a mesoporous structure of the sample.
r m = 2   σ   v m R T   l n p p o  
where σ is the surface tension of nitrogen (8.85 erg/cm2); v m is the monolayer coverage obtained at the relative pressure value, p / p o of 0.3; R is the ideal gas constant ( 8.314 × 10 7 erg/K.mol); and T is the temperature (77 K). The adsorbed layer thickness and porosity data were estimated using the Harkins–Jura thickness equation:
t = 0.1399 0.034 l o g p p o 1 / 2  
where t is the thickness of the BET multilayer of adsorbed N2 molecules at a relative pressure p / p o .  Figure 4 also illustrates the variation in the N2 adsorbed with the adsorption layer thickness. The linear range of the t-plot lies within the adsorbed layer thickness with values of 0.37–0.48 nm.
The SEM image of the produced nanosilica is presented in Figure 5. It shows irregular amorphous shapes ranging from 30 to 300 nm; the surface morphology is non-uniform with a pore diameter of sub-meso size. The snowy-shaped agglomerated particles show micropores in the range of sub-nanometer. Some slits and cavities appear between some tiny silica crystals in between the agglomerated particles.

4.2. Adsorption Isotherms of Cu2+ and Cd2+ by the Nanosilica

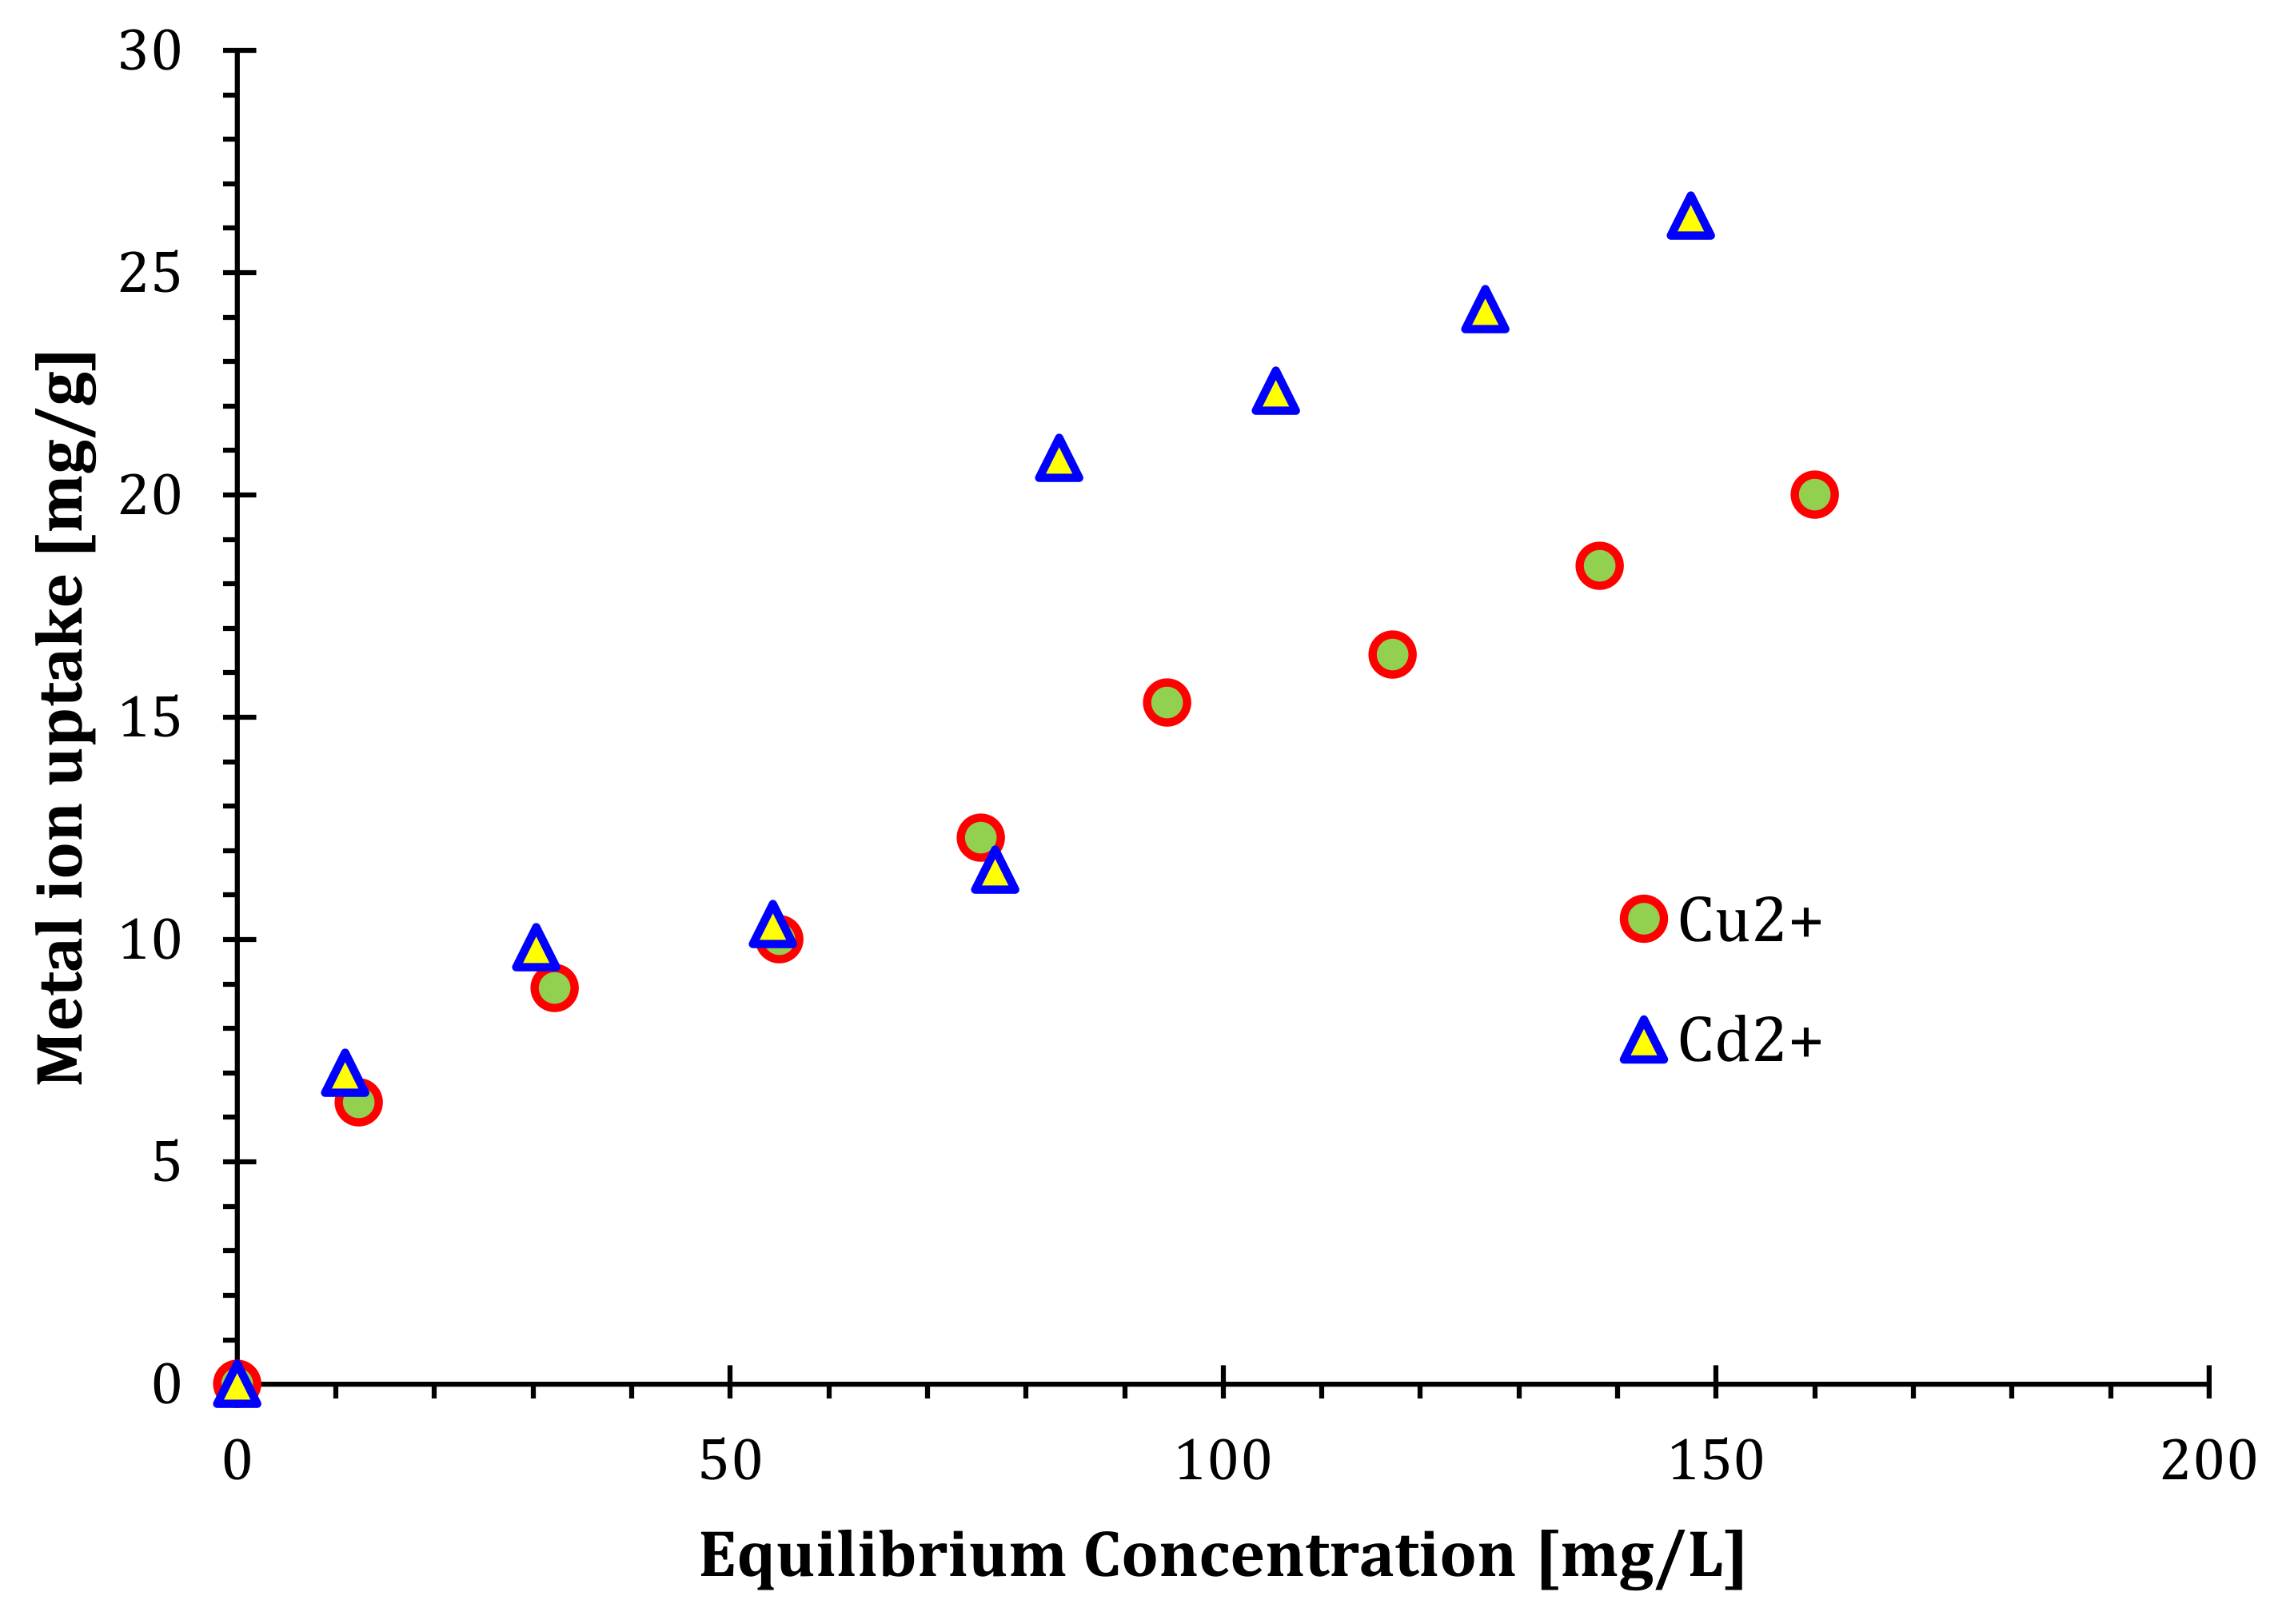
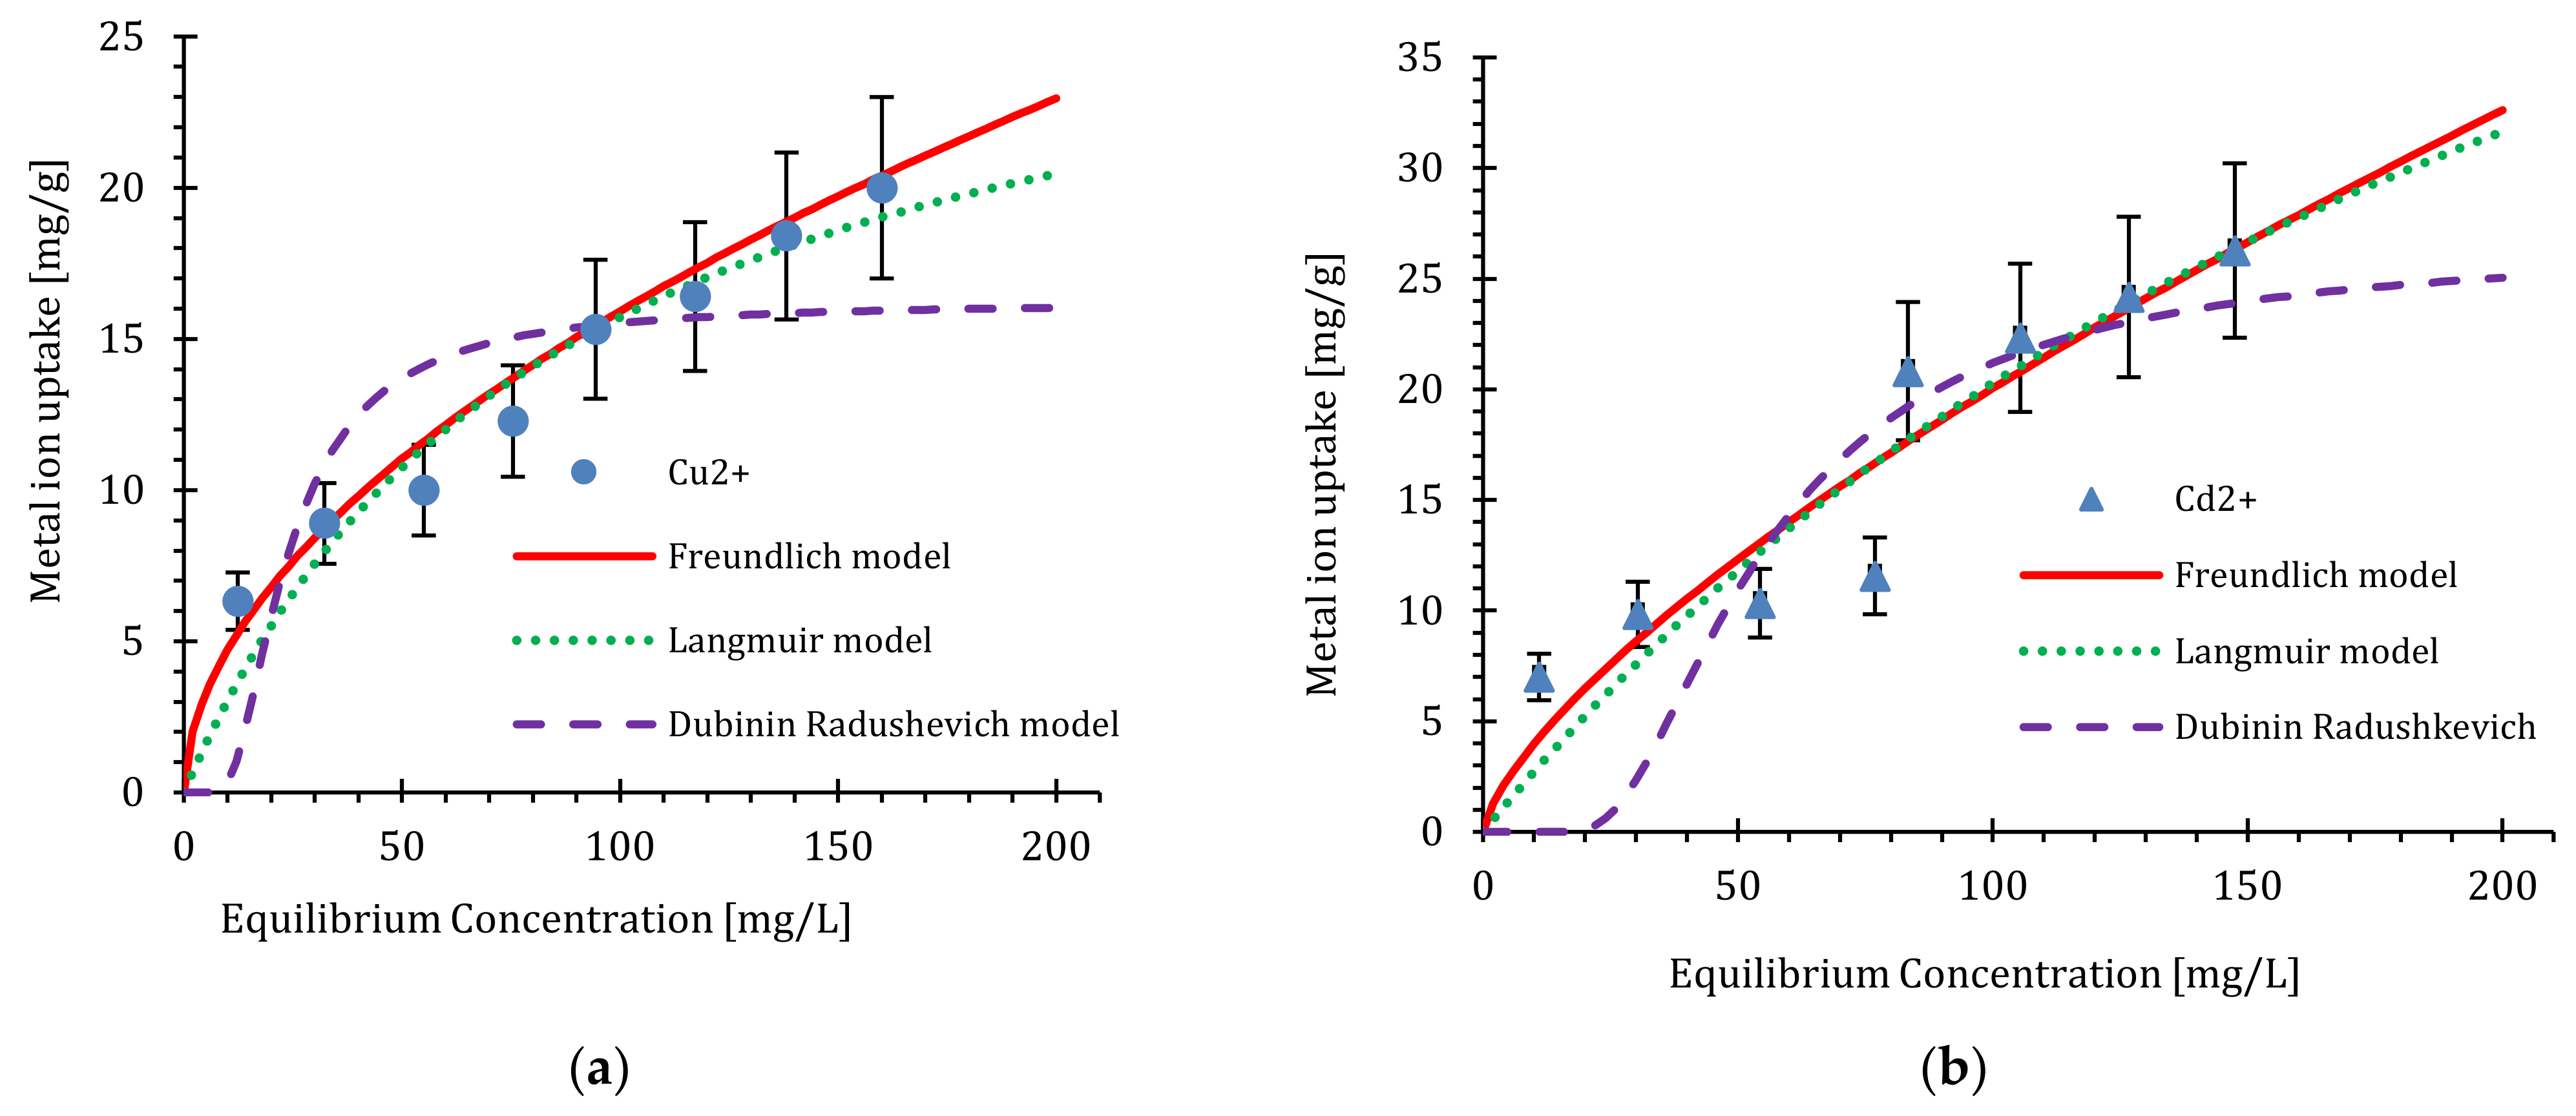
The adsorption equilibrium for both copper and cadmium ions is illustrated in Figure 6. Both ions’ uptake shows a gradual increase with a multilayer of adsorption, which can be attributed to the surface heterogeneity of the produced nanosilica [46]. Alan et al. showed that the surface charge of nanosilica is directly affected by the cavities within the silica structure, where it increases with increasing particle roughness and curvature hills of the surface structure [47]. Cárdenas and Müller used molecular dynamics simulation to study the Lennard–Jones fluid’s behavior within the nanopores of different shapes. They proved that different pore shapes, sizes, and cavities have various adsorption capacities, where capillary condensation occurs in the acute corners of the surface [48]. Alosaimi et al. showed that Cd2+ is coordinated with the carboxylate group on the surface of the silica composite to form multilayer adsorption [49]. Similar results for multilayer adsorption of Cu2+ by silica nanoparticles from leaf biomass have also been reported [50]. The Langmuir, Freundlich, and Dubinin–Radushevich isotherm models were used to fit the experimental data, and the values of these models’ parameters are listed in Table 2. The Freundlich model best fits these experimental data, with regression coefficients of 0.974 and 0.990 for both Cu2+ and Cd2+ isotherms (Figure 7a,b). At the same time, the saturation capacities for both solutes obtained by the Langmuir model are 29.28 and 72.13 mg/g, respectively. When comparing to other published work, Rauf Foroutan et al. used a nanosilica from white sandstone for the removal of cadmium ions; the results showed that the maximum uptake of Cd(II) adsorbed only 55.13 mg/g [30]. Mahmoud et al. used SiO2 nano-powder to study Cd(II) biosorption from aqueous solutions; the maximum cadmium capacity determined was 600 μmol/g (67.2 mg/g) [51].

4.3. Binary Component Isotherm

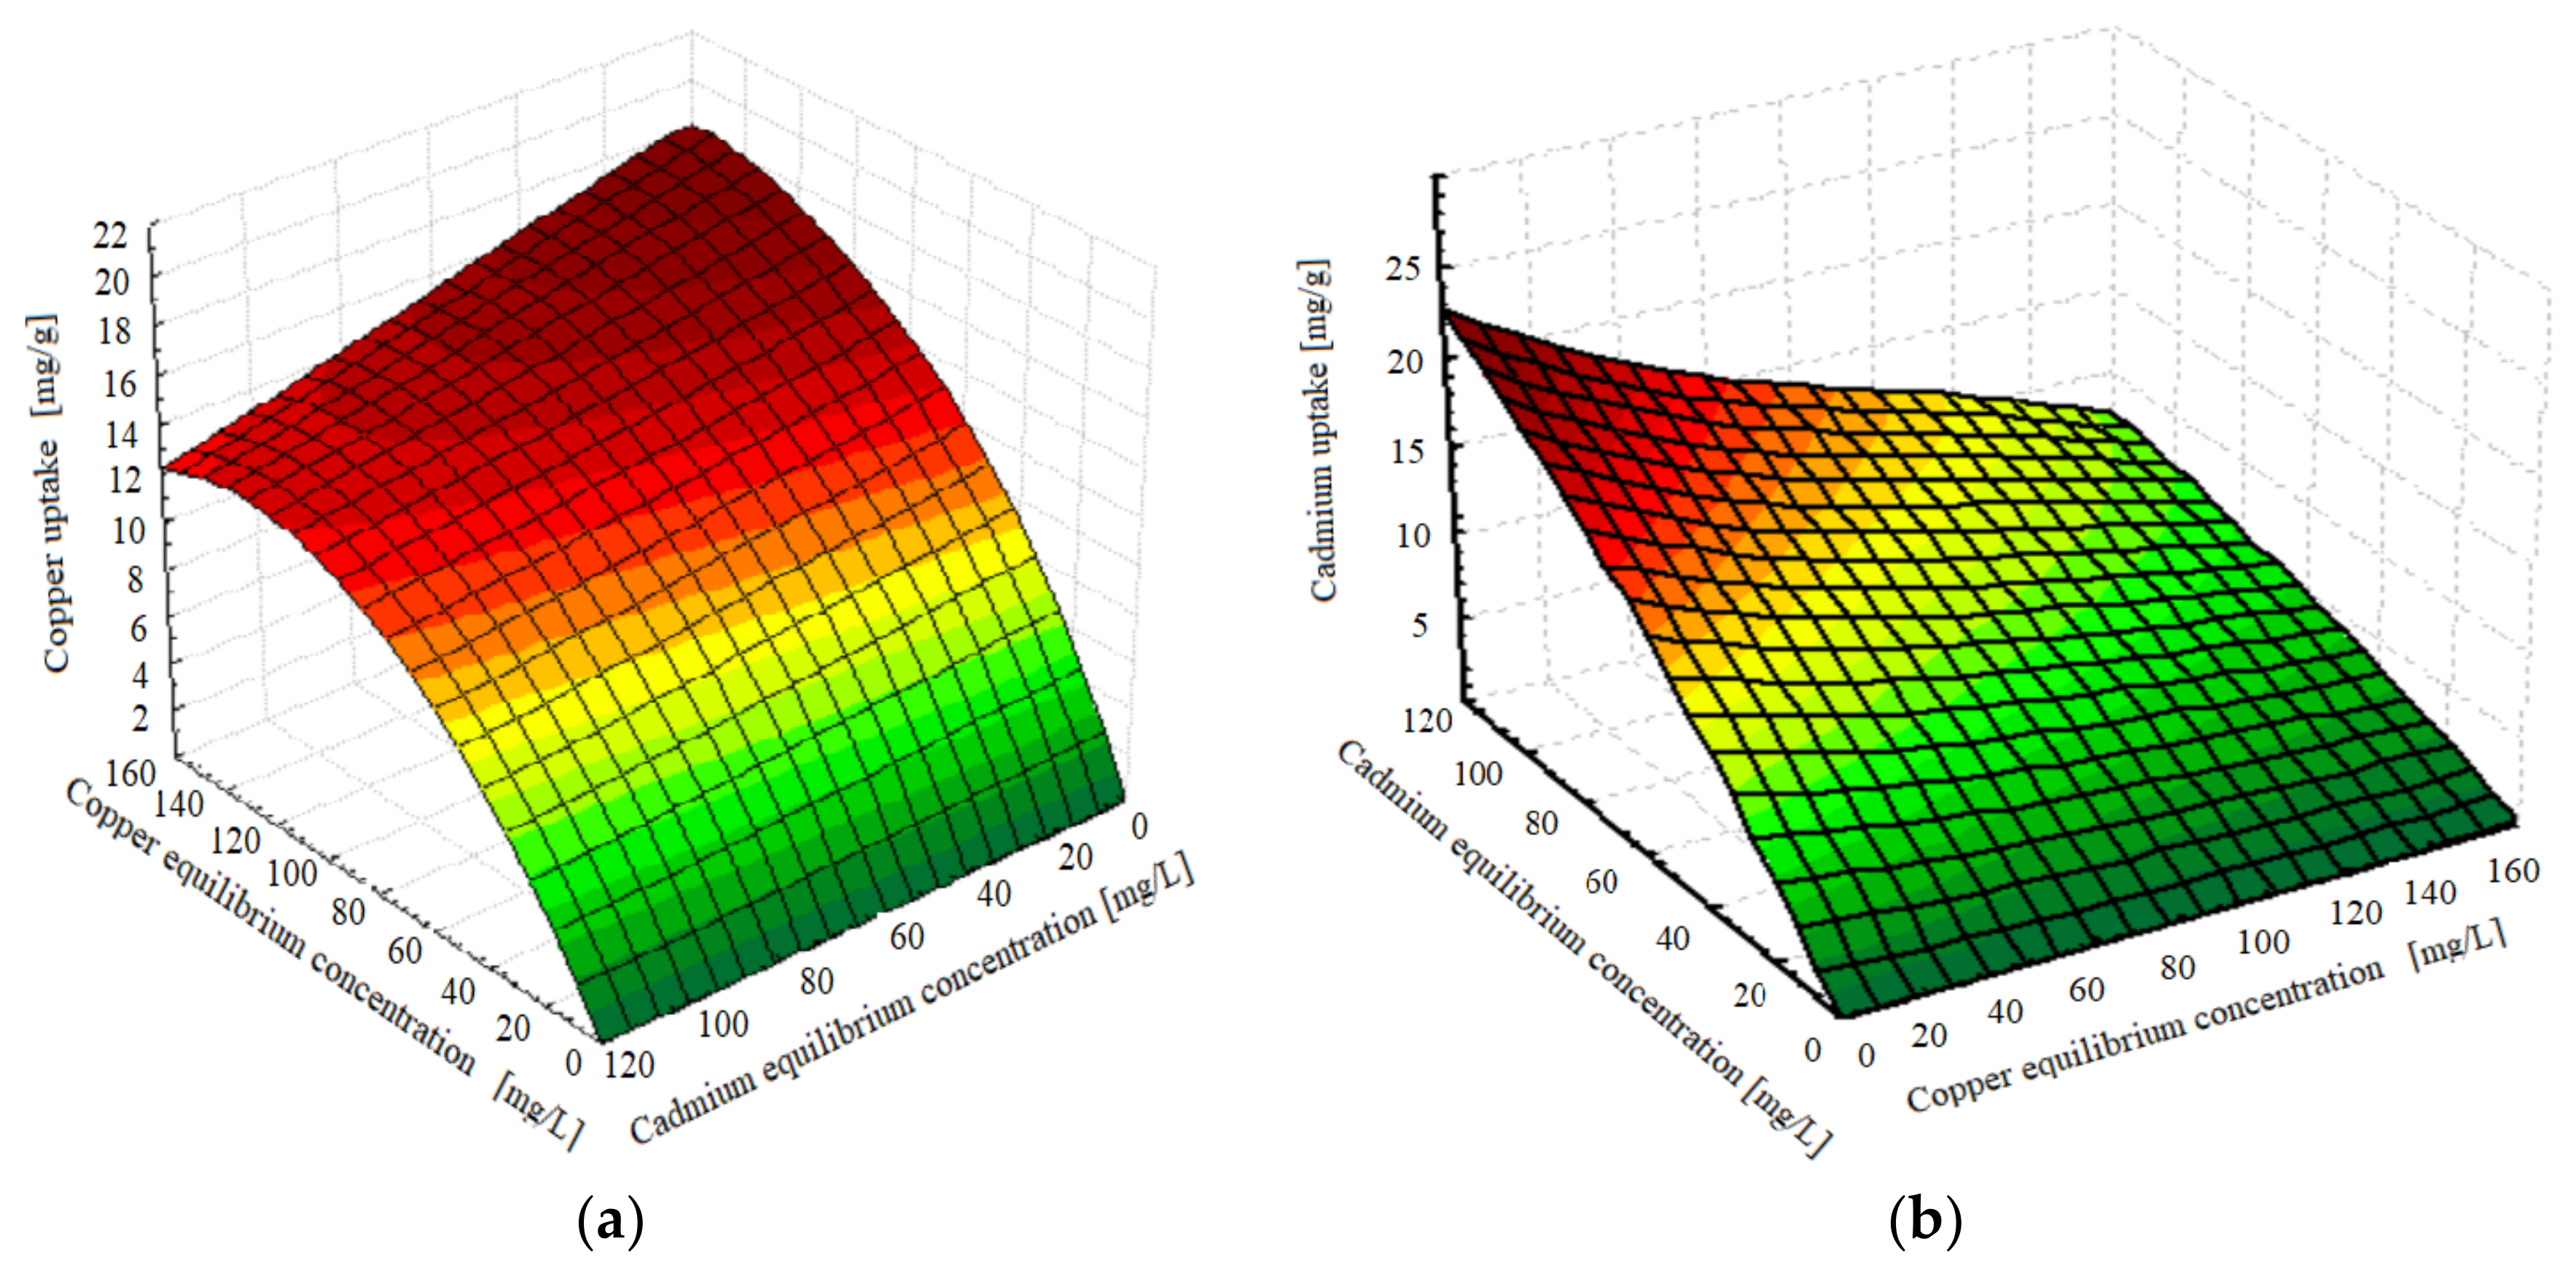
Binary isotherm experiments were carried out using 80 samples; each had the same adsorbent concentration of 100 mg/50 mL solution with a temperature of 22 ± 1 °C. All multicomponent adsorption isotherms were measured at equilibrium concentrations (0 for the pure component to 120 mg ion/L for Cu2+ and Cd2+). Figure 8a,b illustrate the effect of the equilibrium concentration of both copper and cadmium ions on their uptake on the nanosilica, respectively. In both figures, the increase in each metal’s concentration results in a decrease in the reduction efficiency of the adsorbent. It is also noticed that Cd2+ has higher uptake than that of Cu2+ as a result of its higher affinity toward the adsorbent surface. Cadmium ions compete for the active surface of the adsorbent more than copper ions, which results in a decrease in Cu2+ uptake with increasing Cd2+ in the solution. A maximum adsorption capacity of 18 mg/g of pure copper is obtained at an equilibrium concentration of 120 mg/L.
Similarly, cadmium ion uptake obtains a value of 23 mg/g at these given concentrations. Increasing the concentration of cadmium ions in the solution decreases copper uptake to 12 mg/g when 120 mg/L of cadmium is presented in the solution. This decrease in uptake follows a linear relation when adding cadmium ions into the solution. On the other hand, the maximum adsorption capacity of pure cadmium ions obtained at an equilibrium concentration of 120 mg/L is 23 mg/g. This value drops to 11 mg/g when the copper concentration in the solution is 120 mg/L.
This antagonism effect is related to the competitive adsorption on the fixed surface area of the adsorbent. When both ions compete at a concentration of 120 mg/L, a reduction in the adsorption capacity of 33% and 52% is obtained for Cu2+ and Cd2+, respectively. It is also noted that copper ions compete on the surface of adsorbent at a higher order of magnitude than cadmium. This is related to the physicochemical properties of each ion, where the relative binding strength and the Pauling electronegativity of Cu2+ are higher than those of Cd2+ [52]. The difference in electronegativity between the oxygen atoms on the surface of the silica and cadmium is higher than that of copper. Therefore, the adsorption of cadmium ions on the surface is favored over copper. The addition of copper ions to the cadmium solution decreases the electronegativity difference, thereby decreasing surface uptake.
These results were compared to other published results regarding competitive adsorption on different types of modified silica (Table 3): the total uptake of these ions by the developed adsorbent is higher than that obtained when magnetite was coated on the silica surface and is comparable to that obtained for nitrogen-doped nanosilica.

4.4. Regeneration of the Adsorbent

Nanosilica samples were regenerated using 50 mL of 1 M hydrochloric acid solution. Then the samples were washed with distilled water several times until the solution pH reached a neutral value (pH 6.5–7). Table 4 illustrates the adsorption capacity of the adsorbent with the number of regeneration cycles. Isotherm experiments showed a minor reduction in the metal ions’ capacities, with an average decrease in adsorbent activity of 8% being obtained at the end of the fifth cycle.

4.5. The Molecular Dynamics of Cu and Cd on SiO2 Crystalline Structure

Molecular dynamics simulations were carried out using Accelrys Material Studio (V7). A semi-hydrated silica crystal with dimensions of (1 nm × 1 nm × 1.5 nm) was developed as an adsorbent to be used for the theoretical adsorption calculation of Cu2+ and Cd2+ from an aqueous solution. A cleaved plane (0 1 0) with a fractional thickness of one shows 24 silicone and 48 oxygen atoms. The total charge of the structure was adjusted based on its isoelectric charge obtained at pH 6 to include 2000 effective charges in a 1 µm2 silica sphere [56].
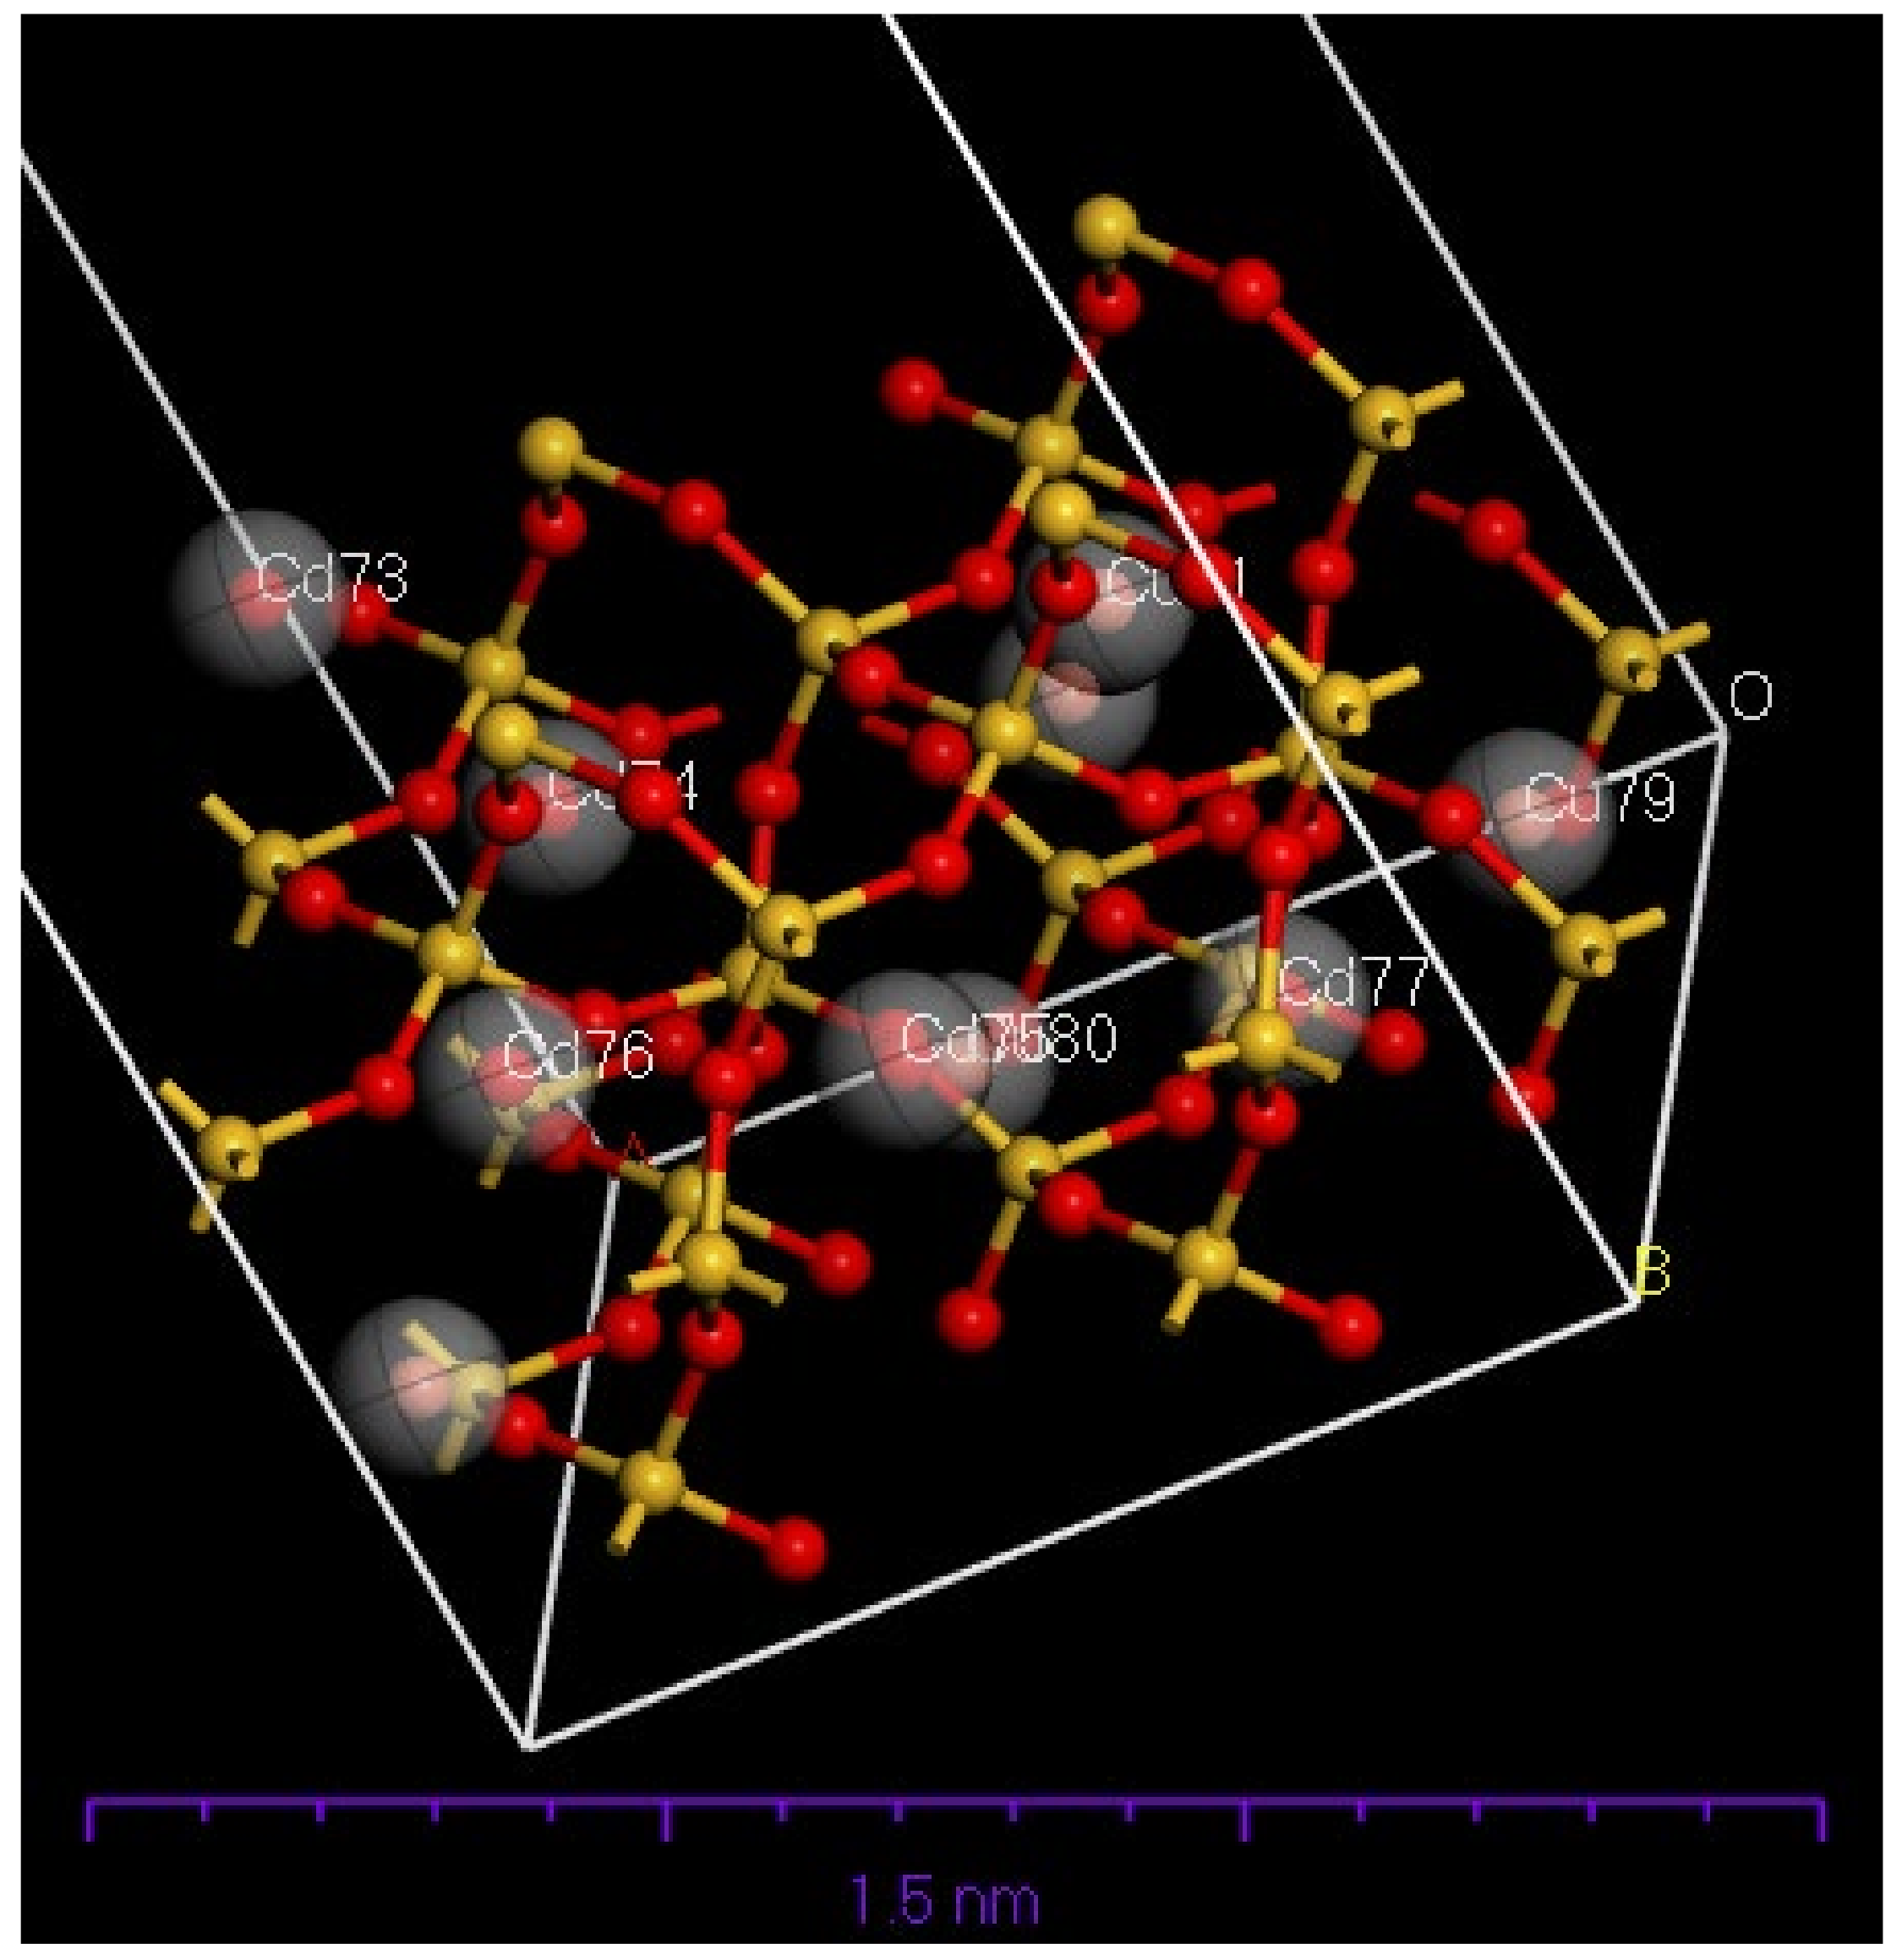
Ions of copper and cadmium were built using 3D atomistic drawing, and the charges for both metals were adjusted to be (+2) each and loaded equally on the surface of the silica. Figure 9 shows the unit cell for the hydrated silica, and the copper and cadmium ions as cleaned to maintain minimum free energy of interaction between the atoms. The Forcite module, with the COMPASS Forcefield and the Ewald electrostatic summation method, was used to optimize the surface geometry of the silica with an accuracy of 0.0001 kcal/mol. Both Cu2+ and Cd2+ were also optimized similarly.
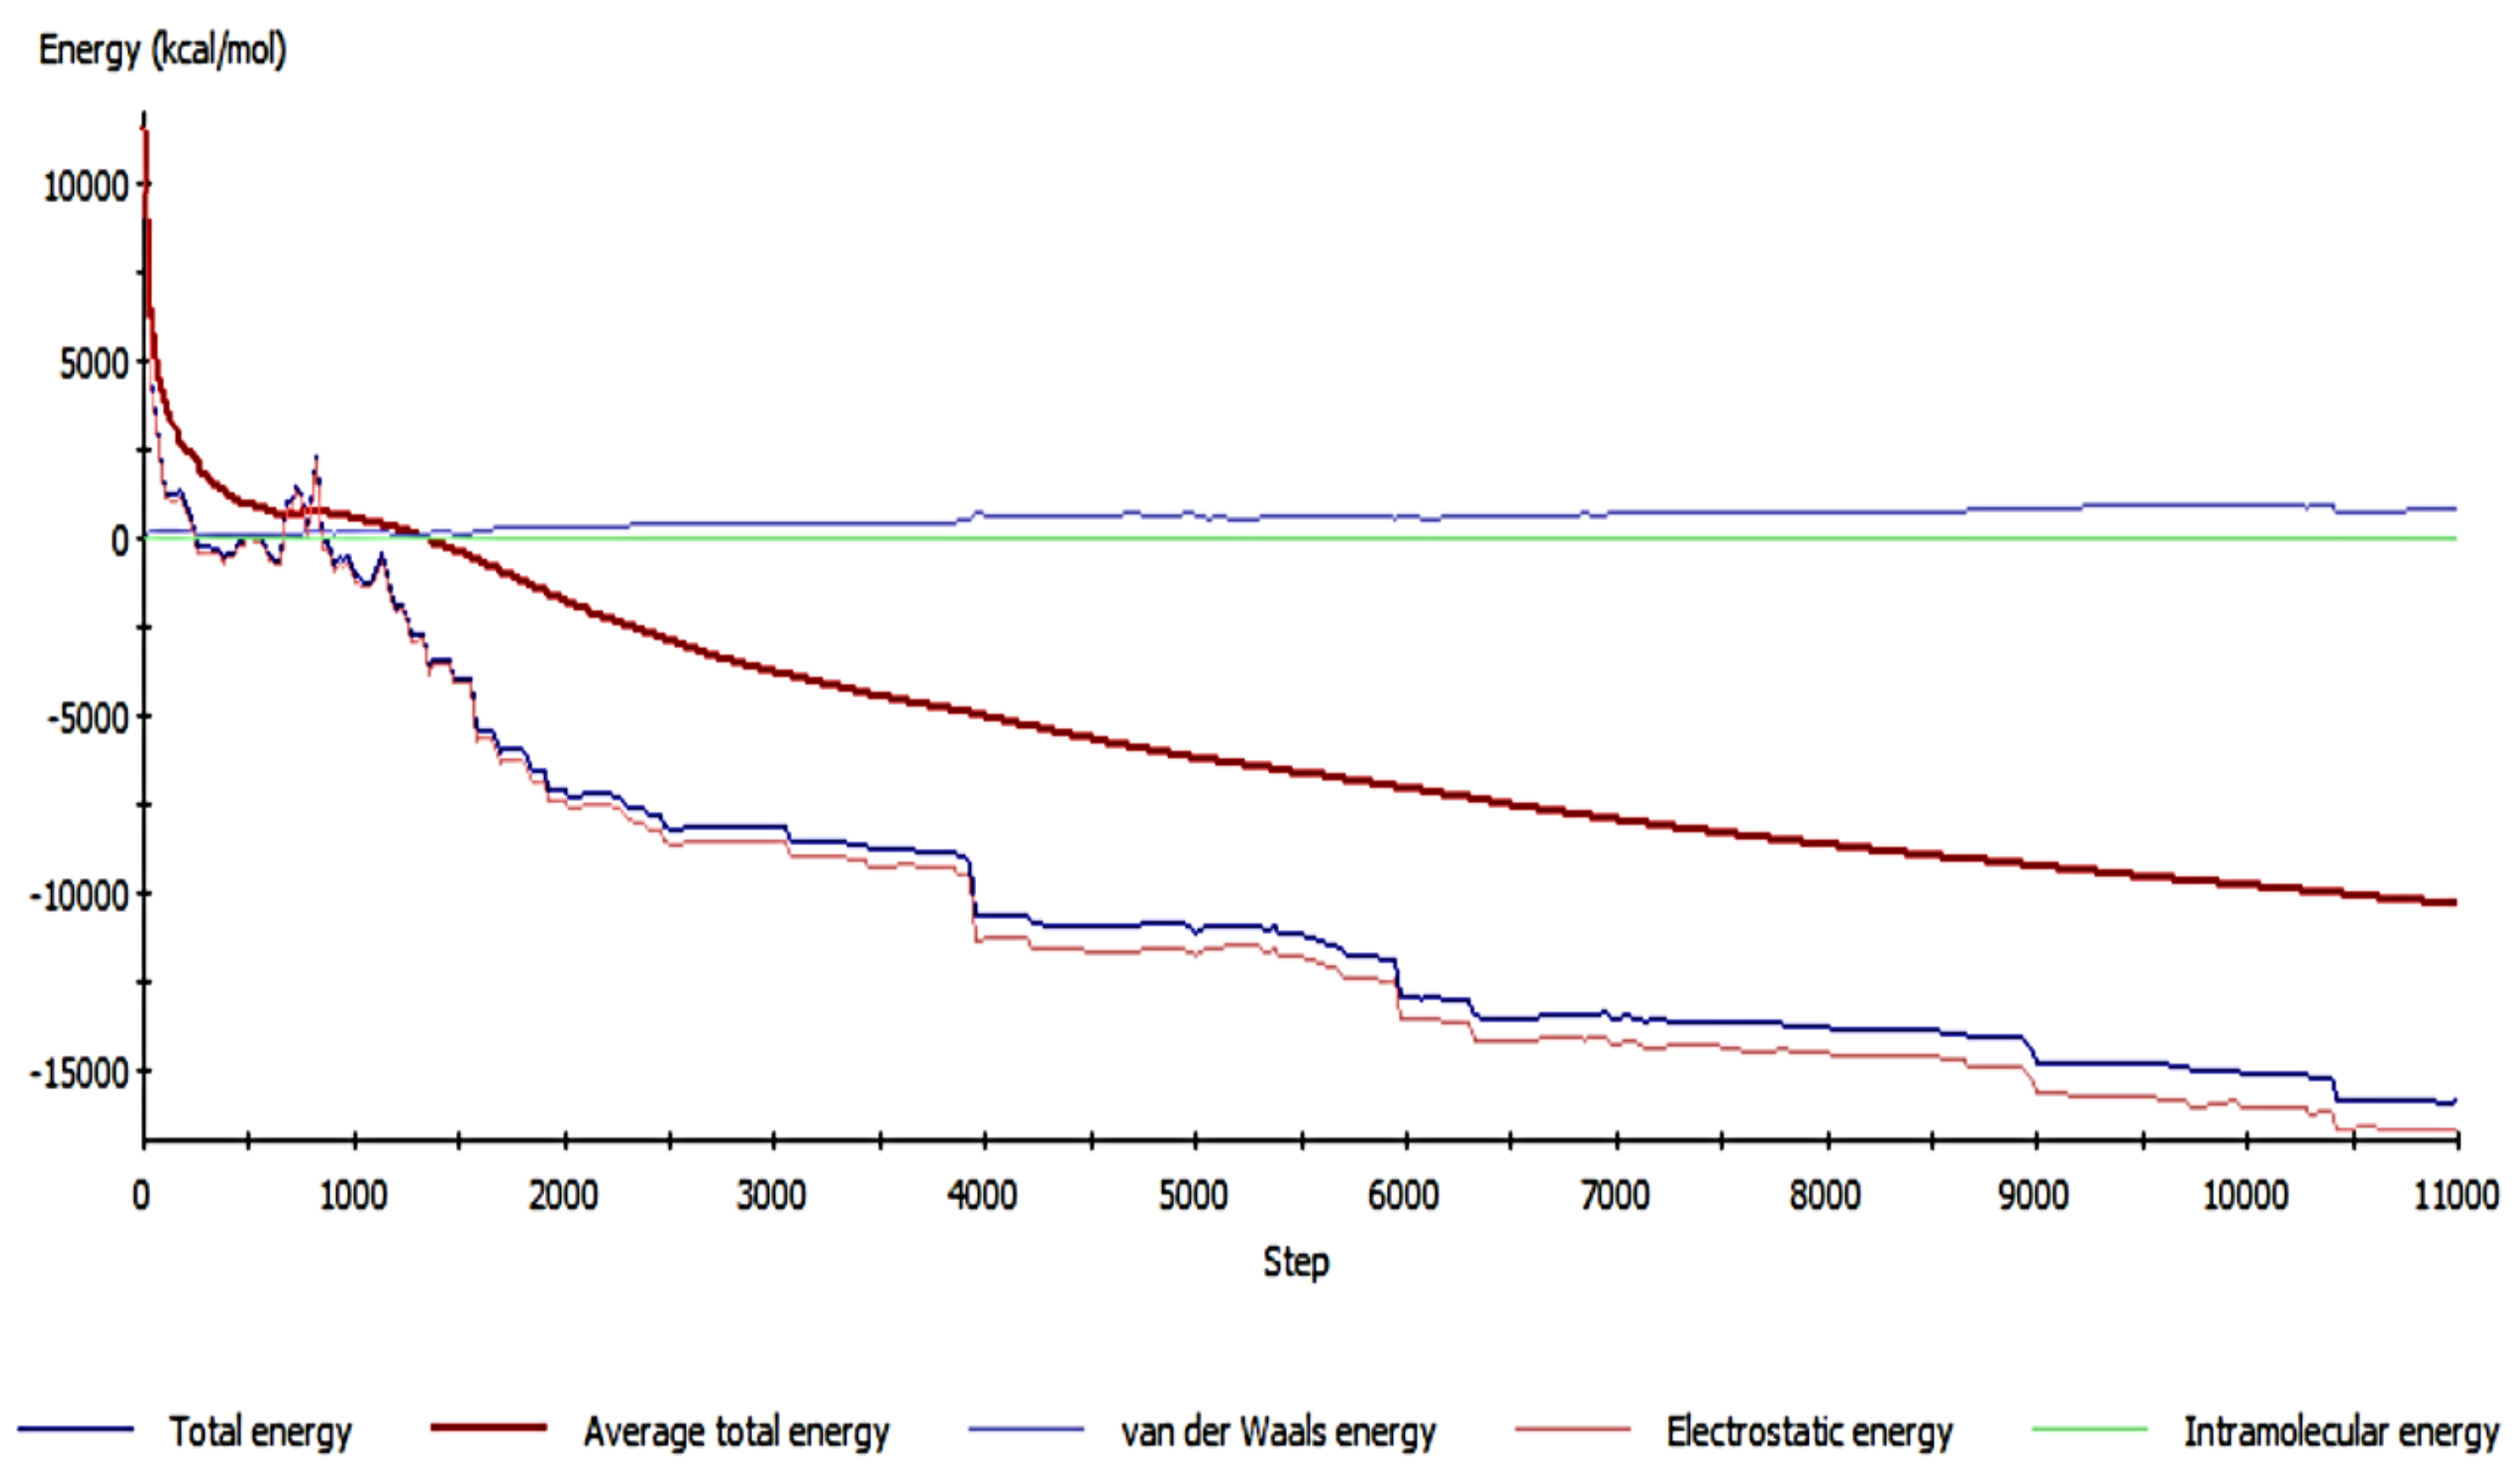
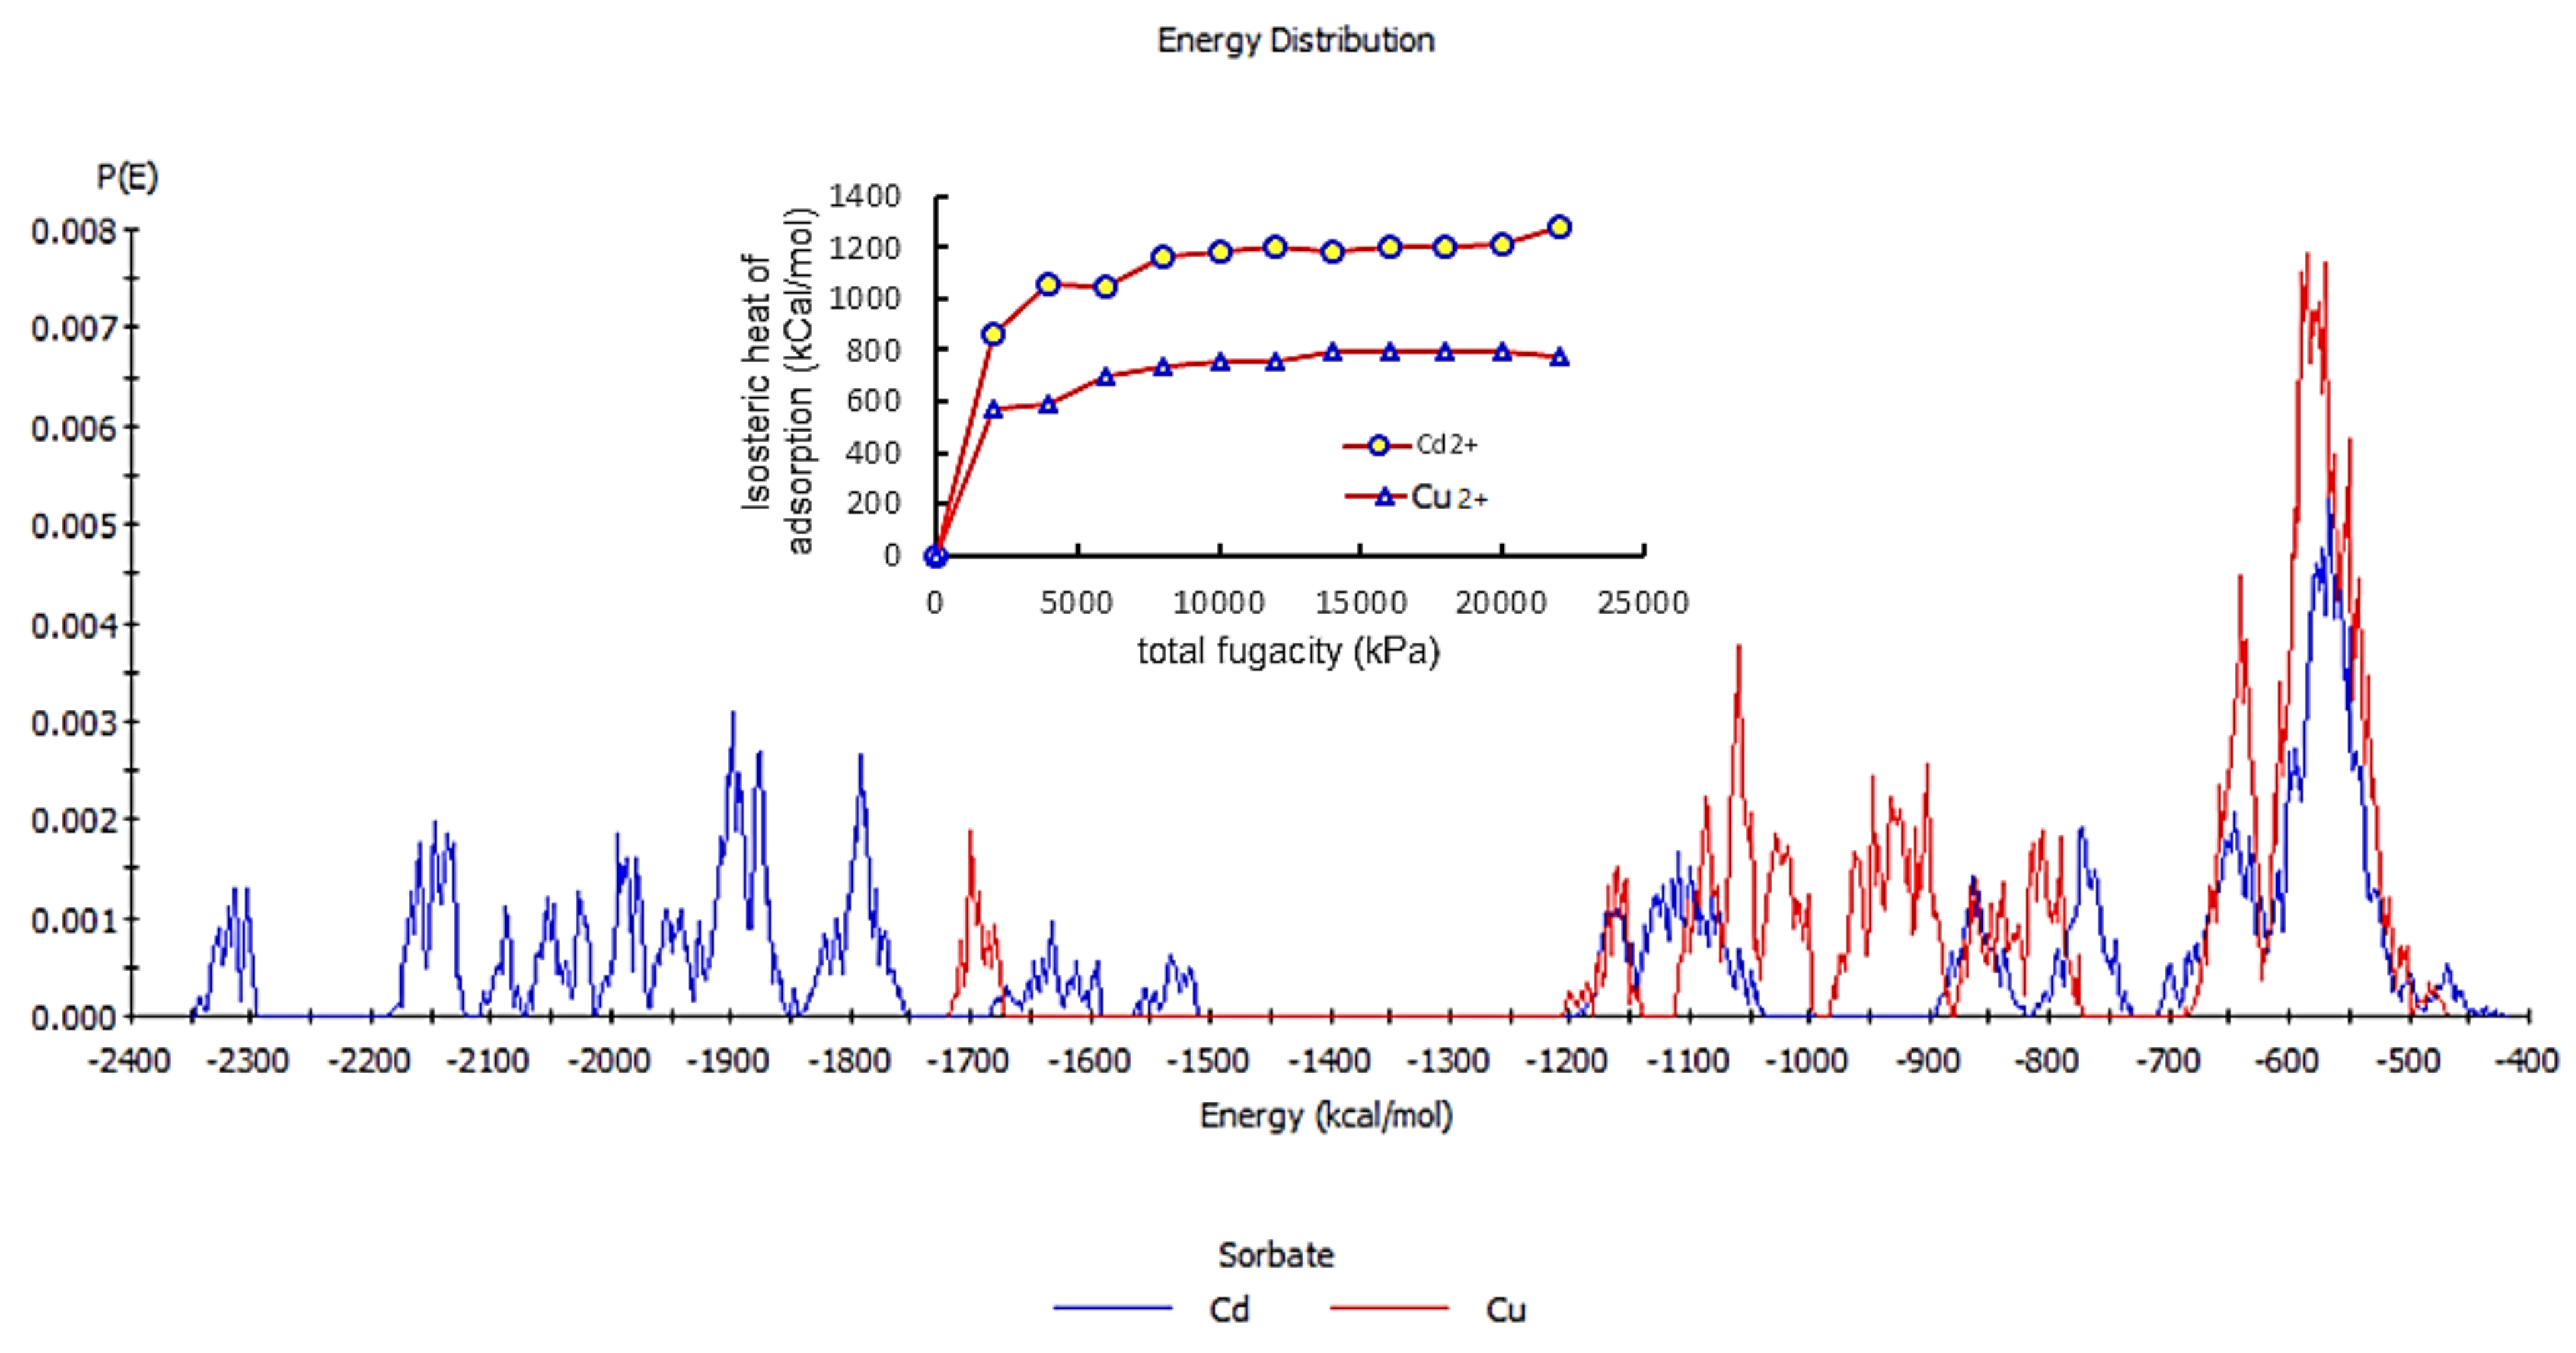
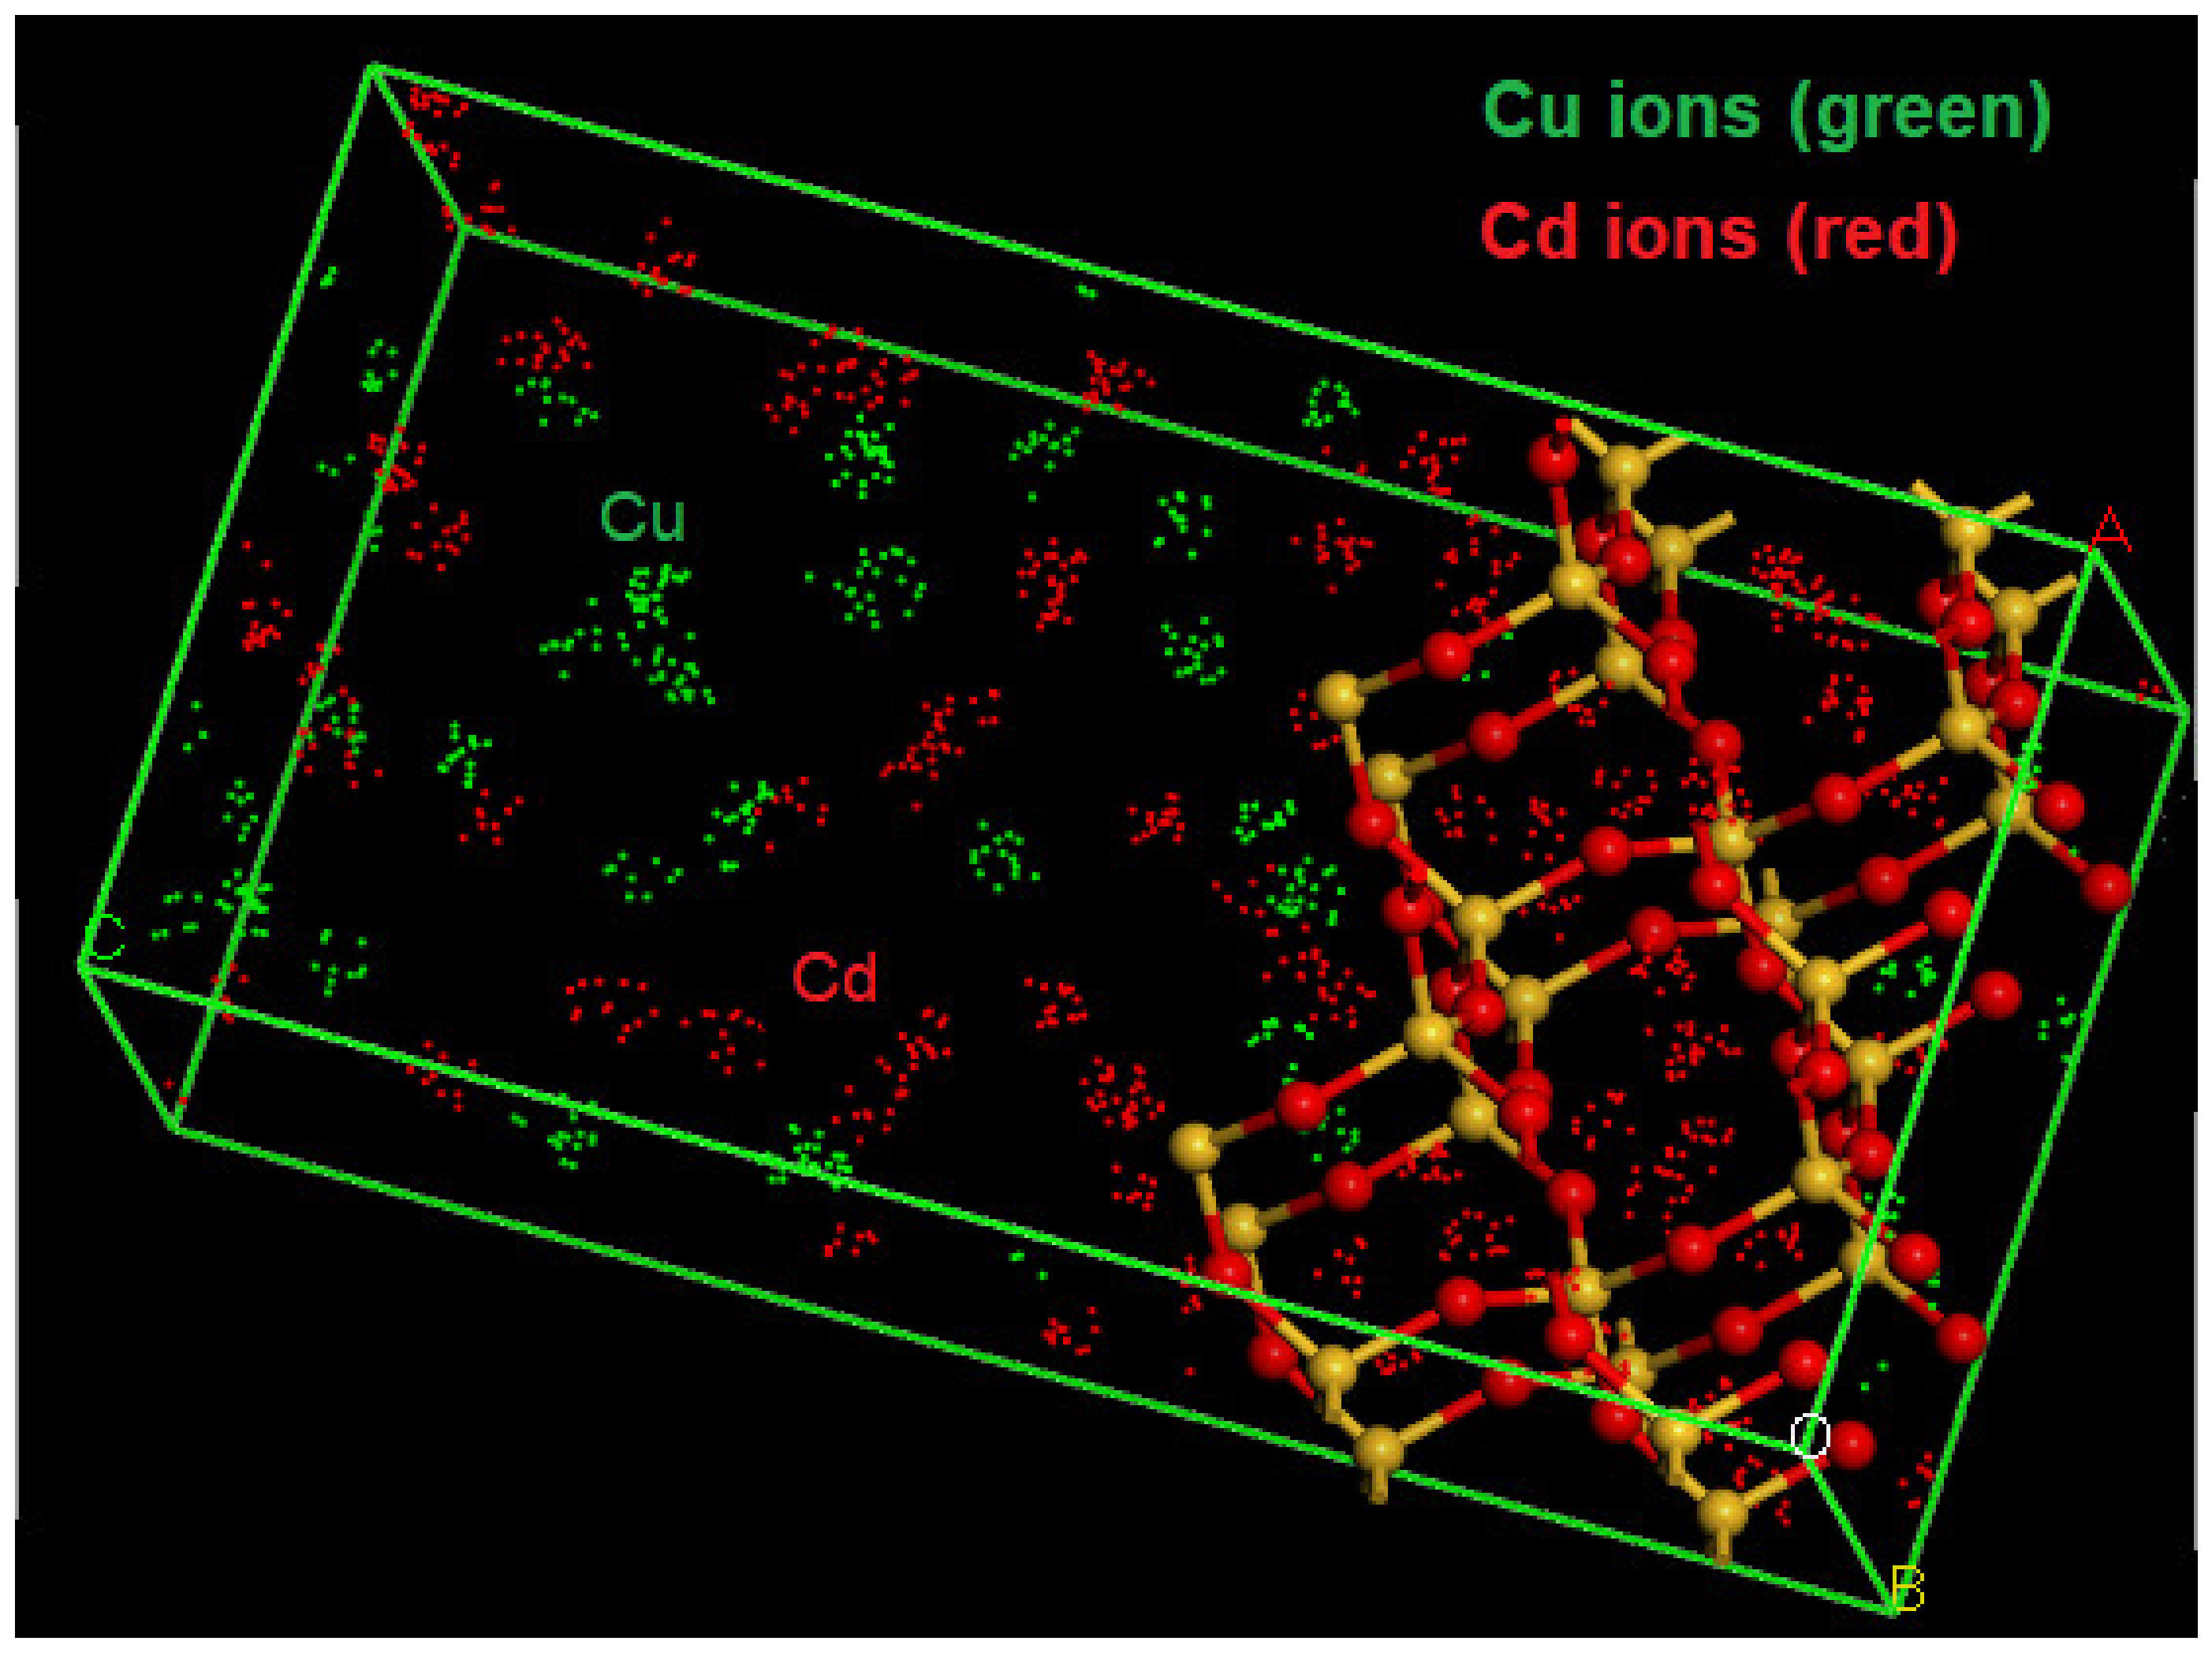
An adsorption locator for both Cu2+ and Cd2+ on the silica surface was performed using the universal forcefield and the Ewald summation method, with 100,000 loading steps and one heating cycle. The interaction energy was measured at 11,000 steps, with an incremental 1000 steps each. The framework charge contains 48 electrons/cell with a maximum of five ions for each Cu2+ and Cd2+. The loadings of both ions are shown in Figure 10, where both ions demonstrate homogeneous uptake within the silica structure. The interaction energy during the adsorption rate is related to the van-der-Waals energy and the electrostatic and intermolecular energies, as shown in Figure 11. The van-der-Waals and intermolecular energies demonstrate a minor change, while the electrostatic energy decreases with the loading steps. The isosteric heat of adsorption for the interaction of both ions with the surface shows an increase in uptake (Figure 12). At the same time, the energy of interaction of the cadmium ions with the surface is higher than that of the copper ions, which agrees with the obtained experimental results. The gradient of the isosteric heat of adsorption decreases with loading, which is attributed to the loss of free surface energy needed for further ion uptake. Moreover, both ions are loaded equally on the surface at the same energy range (400–1200 kcal/mol), but cadmium ions are further adsorbed at a higher energy range (1500–2400 kcal/mol). These findings support the higher cadmium uptake by the surface where a multilayer of adsorption occurs.
Theoretical equilibrium uptake of both ions was conducted using the Sorption module. The Metropolis and Monte Carlo method has 219 million random seeds and 10,000 equilibrium steps. The universal forcefield energy was employed correctly with the Ewald electrostatic summation method. The isotherm results were obtained as the average loading of molecules per unit cell. Figure 13 and Figure 14 illustrate the average loading for each ion in a multi-component system, where cadmium ions show better uptake than copper ions. The maximum loadings for these ions per unit cell are 69 and 31, where each ion’s Langmuir equilibrium trend is noticed.

5. Conclusions

Naturally occurring and synthesized silica are among the effective adsorbents used for heavy metal removal from water. A nanosilica was synthesized using the sol–gel technique and characterized for its surface characteristics and adsorption competency. An irregular amorphous shape with several cavities and slits, a total surface area of 307.64 m2/g, and a total pore volume of 4.95 × 10 3 cm3/g was obtained.
The competitive uptake of heavy metals, such as Cd2+ and Cu2+, on the silica surface determines the adsorption capacity of these ions. Single component systems for the removal of Cd2+ and Cu2+ from water were investigated using experimental and theoretical techniques with the produced nanosilica. The results showed that cadmium ions are adsorbed electrostatically by the nanosilica surface due to the high energy of interaction, which forms a multilayer of uptake, resulting in a maximum single adsorption capacity of 72.13 mg/g. Copper adsorption shows an uptake capacity of 29.28 mg/g. These values are reduced by 52% and 33% when competitive adsorption occurs at a maximum equilibrium concentration of 120 mg/L for each ion.
Molecular dynamic simulations of the interaction of Cd2+ and Cu2+ on the modeled silica surface demonstrated that the isosteric heat of adsorption is a significant factor in the competitive uptake of these ions. This interaction energy between the Cd2+ ions and the silica is higher than that of the Cu2+ ions; therefore, a multilayer coverage could be obtained for the Cd2+ ions. The nanosilica demonstrates the feasibility of removing Cd2+ and Cu2+ ions due to the difference in electrostatic charge.

Author Contributions

Conceptualization, R.A.S., I.H. and B.A.-S.; methodology, A.S.; software, R.A.S.; validation, R.A.S., I.H., B.A.-S. and A.S.; formal analysis, I.H.; investigation, R.A.S.; resources, I.H., R.A.S. and A.S.; data curation, A.S.; writing—original draft preparation, R.A.S., B.A.-S. and A.S.; writing—review and editing, I.H.; visualization, R.A.S.; supervision, R.A.S. and I.H.; project administration, R.A.S.; funding acquisition, R.A.S. All authors have read and agreed to the published version of the manuscript.

Funding

This research was funded by Deanship of Scientific research at the University of Jordan, grant number 2163.

Institutional Review Board Statement

Not applicable.

Informed Consent Statement

Not applicable.

Data Availability Statement

The data presented in this study are available on request from the corresponding author. The data are not publicly available due to the limitation of the university server.

Acknowledgments

The authors would like to acknowledge the University of Jordan, Deanship of Scientific research, and the Department of Chemical Engineering for providing the facility to conduct this research; the Gas Processing Center at Qatar University for performing the characterization techniques for the samples; and Hassan Asiri from King Fahd University of Petroleum and Minerals for providing access to the dynamic molecular simulator.

Conflicts of Interest

The authors declare no conflict of interest.

Sample Availability

Samples of the nanosilica is available from the authors.

References

  1. Al-Saida, B.; Amer, W.; Kandyel, E.E.; Ayad, M.M. Enhanced dual catalytic activities of silver-polyaniline/titanium dioxide magnetic nanocomposite. J. Photochem. Photobiol. A Chem. 2020, 392, 112423. [Google Scholar] [CrossRef]
  2. Amer, W.A.; Al-Saida, B.; Ayad, M.M. Rational design of a polypyrrole-based competent bifunctional magnetic nanocatalyst. RSC Adv. 2019, 9, 18245–18255. [Google Scholar] [CrossRef] [PubMed] [Green Version]
  3. Shawabkeh, R.; Rockstraw, D.A.; Bhada, R.K. Copper and strontium adsorption by a novel carbon material manufactured from pecan shells. Carbon 2002, 40, 781–786. [Google Scholar] [CrossRef]
  4. Zahir, A.; Aslam, Z.; Kamal, M.S.; Ahmad, W.; Abbas, A.; Shawabkeh, R.A. Development of novel cross-linked chitosan for the removal of anionic Congo red dye. J. Mol. Liq. 2017, 244, 211–218. [Google Scholar] [CrossRef]
  5. Shawabkeh, R.; Al-Harahsheh, A.; Al-Otoom, A. Copper and zinc sorption by treated oil shale ash. Sep. Purif. Technol. 2004, 40, 251–257. [Google Scholar] [CrossRef]
  6. Al-Degs, Y.S.; Tutunju, M.F.; Shawabkeh, R.A. The feasibility of using diatomite and Mn–diatomite for remediation of Pb2+, Cu2+, and Cd2+ from water. Sep. Sci. Technol. 2000, 35, 2299–2310. [Google Scholar] [CrossRef]
  7. Shiyu, Q.; Hongen, L.; Zhaojun, N.; Rengel, Z.; Wei, G.; Chang, L.; Peng, Z. Toxicity of cadmium and its competition with mineral nutrients for uptake by plants: A review. Pedosphere 2020, 30, 168–180. [Google Scholar]
  8. Kiran, M.G.; Pakshirajan, K.; Das, G. Heavy metal removal from multicomponent system by sulfate reducing bacteria: Mechanism and cell surface characterization. J. Hazard. Mater. 2017, 324, 62–70. [Google Scholar] [CrossRef]
  9. Yang, W.; Ding, P.; Zhou, L.; Yu, J.; Chen, X.; Jiao, F. Preparation of diamine modified mesoporous silica on multi-walled carbon nanotubes for the adsorption of heavy metals in aqueous solution. Appl. Surf. Sci. 2013, 282, 38–45. [Google Scholar] [CrossRef]
  10. ATSDR. Substances Priority List; Division of Toxicology and Human Health Sciences: Atlanta, GA, USA, 2021; p. 30329. [Google Scholar]
  11. Yue, Y.; Gu, J.; Han, J.; Wu, Q.; Jiang, J. Effects of cellulose/salicylaldehyde thiosemicarbazone complexes on PVA based hydrogels: Portable, reusable, and high-precision luminescence sensing of Cu2+. J. Hazard. Mater. 2021, 401, 123798. [Google Scholar] [CrossRef]
  12. Imran, M.; Khan, Z.U.H.; Iqbal, J.; Shah, N.S.; Muzammil, S.; Ali, S.; Muhammad, N.; Aziz, A.; Murtaza, B.; Naeem, M.A. Potential of siltstone and its composites with biochar and magnetite nanoparticles for the removal of cadmium from contaminated aqueous solutions: Batch and column scale studies. Environ. Pollut. 2020, 259, 113938. [Google Scholar] [CrossRef] [PubMed]
  13. Al-Saydeh, S.A.; El-Naas, M.H.; Zaidi, S.J. Copper removal from industrial wastewater: A comprehensive review. J. Ind. Eng. Chem. 2017, 56, 35–44. [Google Scholar] [CrossRef]
  14. Charerntanyarak, L. Heavy metals removal by chemical coagulation and precipitation. Water Sci. Technol. 1999, 39, 135–138. [Google Scholar] [CrossRef]
  15. Liang, F.-B.; Song, Y.-L.; Huang, C.-P.; Li, Y.-X.; Chen, B.-H. Synthesis of novel lignin-based ion-exchange resin and its utilization in heavy metals removal. Ind. Eng. Chem. Res. 2013, 52, 1267–1274. [Google Scholar] [CrossRef]
  16. Tarkwa, J.-B.; Oturan, N.; Acayanka, E.; Laminsi, S.; Oturan, M.A. Photo-Fenton oxidation of Orange G azo dye: Process optimization and mineralization mechanism. Environ. Chem. Lett. 2019, 17, 473–479. [Google Scholar] [CrossRef]
  17. Zhao, C.; Shao, S.; Zhou, Y.; Yang, Y.; Shao, Y.; Zhang, L.; Zhou, Y.; Xie, L.; Luo, L. Optimization of flocculation conditions for soluble cadmium removal using the composite flocculant of green anion polyacrylamide and PAC by response surface methodology. Sci. Total Environ. 2018, 645, 267–276. [Google Scholar] [CrossRef]
  18. Qiao, Q.; Yang, X.; Liu, L.; Luo, Y.; Tan, W.; Liu, C.; Dang, Z.; Qiu, G. Electrochemical adsorption of cadmium and arsenic by natural Fe-Mn nodules. J. Hazard. Mater. 2020, 390, 122165. [Google Scholar] [CrossRef]
  19. Devatha, C.; Shivani, S. Novel application of maghemite nanoparticles coated bacteria for the removal of cadmium from aqueous solution. J. Environ. Manag. 2020, 258, 110038. [Google Scholar] [CrossRef] [PubMed]
  20. Shawabkeh, R.A. Adsorption of chromium ions from aqueous solution by using activated carbo-aluminosilicate material from oil shale. J. Colloid Interface Sci. 2006, 299, 530–536. [Google Scholar] [CrossRef] [PubMed]
  21. Smith, S.C.; Rodrigues, D.F. Carbon-based nanomaterials for removal of chemical and biological contaminants from water: A review of mechanisms and applications. Carbon 2015, 91, 122–143. [Google Scholar] [CrossRef]
  22. Kurniawan, T.A.; Chan, G.Y.; Lo, W.-H.; Babel, S. Physico–chemical treatment techniques for wastewater laden with heavy metals. Chem. Eng. J. 2006, 118, 83–98. [Google Scholar] [CrossRef]
  23. Foroutan, R.; Mohammadi, R.; Adeleye, A.S.; Farjadfard, S.; Esvandi, Z.; Arfaeinia, H.; Sorial, G.A.; Ramavandi, B.; Sahebi, S. Efficient arsenic (V) removal from contaminated water using natural clay and clay composite adsorbents. Environ. Sci. Pollut. Res. 2019, 26, 29748–29762. [Google Scholar] [CrossRef]
  24. Kausar, A.; Bhatti, H.N.; MacKinnon, G. Re-use of agricultural wastes for the removal and recovery of Zr (IV) from aqueous solutions. J. Taiwan Inst. Chem. Eng. 2016, 59, 330–340. [Google Scholar] [CrossRef] [Green Version]
  25. Ahmad, R.; Hasan, I.; Mittal, A. Adsorption of Cr (VI) and Cd (II) on chitosan grafted polyaniline-OMMT nanocomposite: Isotherms, kinetics and thermodynamics studies. Desalin Water Treat 2017, 58, 144–153. [Google Scholar] [CrossRef]
  26. Volkov, D.S.; Krivoshein, P.K.; Mikheev, I.V.; Proskurnin, M.A. Pristine detonation nanodiamonds as regenerable adsorbents for metal cations. Diam. Relat. Mater. 2020, 110, 108–121. [Google Scholar] [CrossRef]
  27. Mahmud, H.N.M.E.; Huq, A.O.; Yahya, R.B. The removal of heavy metal ions from wastewater/aqueous solution using polypyrrole-based adsorbents: A review. RSC Adv. 2016, 6, 14778–14791. [Google Scholar] [CrossRef]
  28. Shao, N.; Li, S.; Yan, F.; Su, Y.; Liu, F.; Zhang, Z. An all-in-one strategy for the adsorption of heavy metal ions and photodegradation of organic pollutants using steel slag-derived calcium silicate hydrate. J. Hazard. Mater. 2020, 382, 121120. [Google Scholar] [CrossRef]
  29. Pourshadlou, S.; Mobasherpour, I.; Majidian, H.; Salahi, E.; Bidabadi, F.S.; Mei, C.-T.; Ebrahimi, M. Adsorption system for Mg2+ removal from aqueous solutions using bentonite/γ-alumina nanocomposite. J. Colloid Interface Sci. 2020, 568, 245–254. [Google Scholar] [CrossRef]
  30. Foroutan, R.; Mohammadi, R.; Peighambardoust, S.J.; Jalali, S.; Ramavandi, B. Application of nano-silica particles generated from offshore white sandstone for cadmium ions elimination from aqueous media. Environ. Technol. Innov. 2020, 19, 101031. [Google Scholar] [CrossRef]
  31. Li, S.; Li, S.; Wen, N.; Wei, D.; Zhang, Y. Highly effective removal of lead and cadmium ions from wastewater by bifunctional magnetic mesoporous silica. Sep. Purif. Technol. 2021, 265, 118341. [Google Scholar] [CrossRef]
  32. Khater, H. Nano-Silica effect on the physicomechanical properties of geopolymer composites. Adv. Nano Res. 2016, 4, 181. [Google Scholar] [CrossRef]
  33. Milonjic, S.; Cerović, L.; Cokesa, D.; Zec, S. The influence of cationic impurities in silica on its crystallization and point of zero charge. J. Colloid Interface Sci. 2007, 309, 155–159. [Google Scholar] [CrossRef] [PubMed]
  34. Maity, A.; Polshettiwar, V. Dendritic fibrous nanosilica for catalysis, energy harvesting, carbon dioxide mitigation, drug delivery, and sensing. ChemSusChem 2017, 10, 3866. [Google Scholar] [CrossRef] [PubMed] [Green Version]
  35. Liu, H.; Pan, B.; Wang, Q.; Niu, Y.; Tai, Y.; Du, X.; Zhang, K. Crucial roles of graphene oxide in preparing alginate/nanofibrillated cellulose double network composites hydrogels. Chemosphere 2021, 263, 128240. [Google Scholar] [CrossRef]
  36. Liu, C.; Liu, H.; Xiong, T.; Xu, A.; Pan, B.; Tang, K. Graphene Oxide Reinforced Alginate/PVA Double Network Hydrogels for Efficient Dye Removal. Polymers 2018, 10, 835. [Google Scholar] [CrossRef] [PubMed] [Green Version]
  37. Štefanko, A.U.; Leszczynska, D. Evaluation of Cd2+, Cu2+, Pb2+, and Zn2+ Removal by Cow Manure and Corn Stover Biochar with the Emphasis on the Solubility-Normalized Dubinin-Radushkevich Approach for the Computation of the Adsorption Potential (ϵ). J. Environ. Eng. 2021, 147, 04021069. [Google Scholar] [CrossRef]
  38. Jiang, X.; Tang, X.; Tang, L.; Zhang, B.; Mao, H. Synthesis and formation mechanism of amorphous silica particles via sol–gel process with tetraethylorthosilicate. Ceram. Int. 2019, 45, 7673–7680. [Google Scholar] [CrossRef]
  39. Rozainee, M.; Ngo, S.P.; Salema, A.; Tan, K.G.; Ariffin, M.; Zainura, Z. Effect of fluidising velocity on the combustion of rice husk in a bench-scale fluidised bed combustor for the production of amorphous rice husk ash. Bioresour. Technol. 2008, 99, 703–713. [Google Scholar] [CrossRef]
  40. Shoaib, A.; Elabasy, A.; Waqas, M.; Lin, L.; Cheng, X.; Zhang, Q.; Shi, Z.-H. Entomotoxic effect of silicon dioxide nanoparticles on Plutella xylostella (L.)(Lepidoptera: Plutellidae) under laboratory conditions. Toxicol. Environ. Chem. 2018, 100, 80–91. [Google Scholar] [CrossRef]
  41. Moosa, A.; Saddam, B. Synthesis and characterization of nanosilica from rice husk with applications to polymer composites. Am. J. Mater. Sci. 2017, 7, 223–231. [Google Scholar]
  42. Golbamaki, N.; Rasulev, B.; Cassano, A.; Robinson, R.L.M.; Benfenati, E.; Leszczynski, J.; Cronin, M.T. Genotoxicity of metal oxide nanomaterials: Review of recent data and discussion of possible mechanisms. Nanoscale 2015, 7, 2154–2198. [Google Scholar] [CrossRef] [PubMed]
  43. Petrisor, G.; Ficai, D.; Motelica, L.; Trusca, R.D.; Bîrcă, A.C.; Vasile, B.S.; Voicu, G.; Oprea, O.C.; Semenescu, A.; Ficai, A.; et al. Mesoporous Silica Materials Loaded with Gallic Acid with Antimicrobial Potential. Nanomaterials 2022, 12, 1648. [Google Scholar] [CrossRef] [PubMed]
  44. Li, P.; Gao, B.; Li, A.; Yang, H. Evaluation of the selective adsorption of silica-sand/anionized-starch composite for removal of dyes and Cupper (II) from their aqueous mixtures. Int. J. Biol. Macromol. 2020, 149, 1285–1293. [Google Scholar] [CrossRef] [PubMed]
  45. Tian, Y.; Yin, P.; Qu, R.; Wang, C.; Zheng, H.; Yu, Z. Removal of transition metal ions from aqueous solutions by adsorption using a novel hybrid material silica gel chemically modified by triethylenetetraminomethylenephosphonic acid. Chem. Eng. J. 2010, 162, 573–579. [Google Scholar] [CrossRef]
  46. Singhon, R. Adsorption of Cu(II) and Ni(II) Ions on Functionalized Colloidal Silica Particles Model Studies for Wastewater Treatment. Doctoral Dissertation, Université de Franche-Comté, Besançon, France, 2014. [Google Scholar]
  47. Alan, B.O.; Barisik, M.; Ozcelik, H.G. Roughness Effects on the Surface Charge Properties of Silica Nanoparticles. J. Phys. Chem. C 2020, 124, 7274–7286. [Google Scholar] [CrossRef]
  48. Cárdenas, H.; Müller, E.A. How does the shape and surface energy of pores affect the adsorption of nanoconfined fluids? AIChE J. 2021, 67, e17011. [Google Scholar] [CrossRef]
  49. Alosaimi, E.H.; Alsohaimi, I.H.; Dahan, T.E.; Chen, Q.; Melhi, S. Adsorptive performance of tetracarboxylic acid-modified magnetic silica nanocomposite for recoverable efficient removal of toxic Cd(II) from aqueous environment: Equilibrium, isotherm, and reusability studies. J. Mol. Liq. 2021, 334, 116069. [Google Scholar] [CrossRef]
  50. Sachan, D.; Ramesh, A.; Das, G. Green synthesis of silica nanoparticles from leaf biomass and its application to remove heavy metals from synthetic wastewater: A comparative analysis. Environ. Nanotechnol. Monit. Manag. 2021, 16, 100467. [Google Scholar] [CrossRef]
  51. Mahmoud, M.E.; Yakout, A.A.; Abdel-Aal, H.; Osman, M.M. Enhanced biosorptive removal of cadmium from aqueous solutions by silicon dioxide nano-powder, heat inactivated and immobilized Aspergillus ustus. Desalination 2011, 279, 291–297. [Google Scholar] [CrossRef]
  52. Kinraide, T.B.; Yermiyahu, U. A scale of metal ion binding strengths correlating with ionic charge, Pauling electronegativity, toxicity, and other physiological effects. J. Inorg. Biochem. 2007, 101, 1201–1213. [Google Scholar] [CrossRef]
  53. Jin, S.; Park, B.C.; Ham, W.S.; Pan, L.; Kim, Y.K. Effect of the magnetic core size of amino-functionalized Fe3O4-mesoporous SiO2 core-shell nanoparticles on the removal of heavy metal ions. Colloids Surf. A Physicochem. Eng. Asp. 2017, 531, 133–140. [Google Scholar] [CrossRef]
  54. Wang, J.; Zheng, S.; Shao, Y.; Liu, J.; Xu, Z.; Zhu, D. Amino-functionalized Fe3O4@ SiO2 core–shell magnetic nanomaterial as a novel adsorbent for aqueous heavy metals removal. J. Colloid Interface Sci. 2010, 349, 293–299. [Google Scholar] [CrossRef]
  55. Liu, Y.; Fu, R.; Sun, Y.; Zhou, X.; Baig, S.A.; Xu, X. Multifunctional nanocomposites Fe3O4@ SiO2-EDTA for Pb (II) and Cu (II) removal from aqueous solutions. Appl. Surf. Sci. 2016, 369, 267–276. [Google Scholar] [CrossRef]
  56. Behrens, S.H.; Grier, D.G. The charge of glass and silica surfaces. J. Chem. Phys. 2001, 115, 6716–6721. [Google Scholar] [CrossRef]
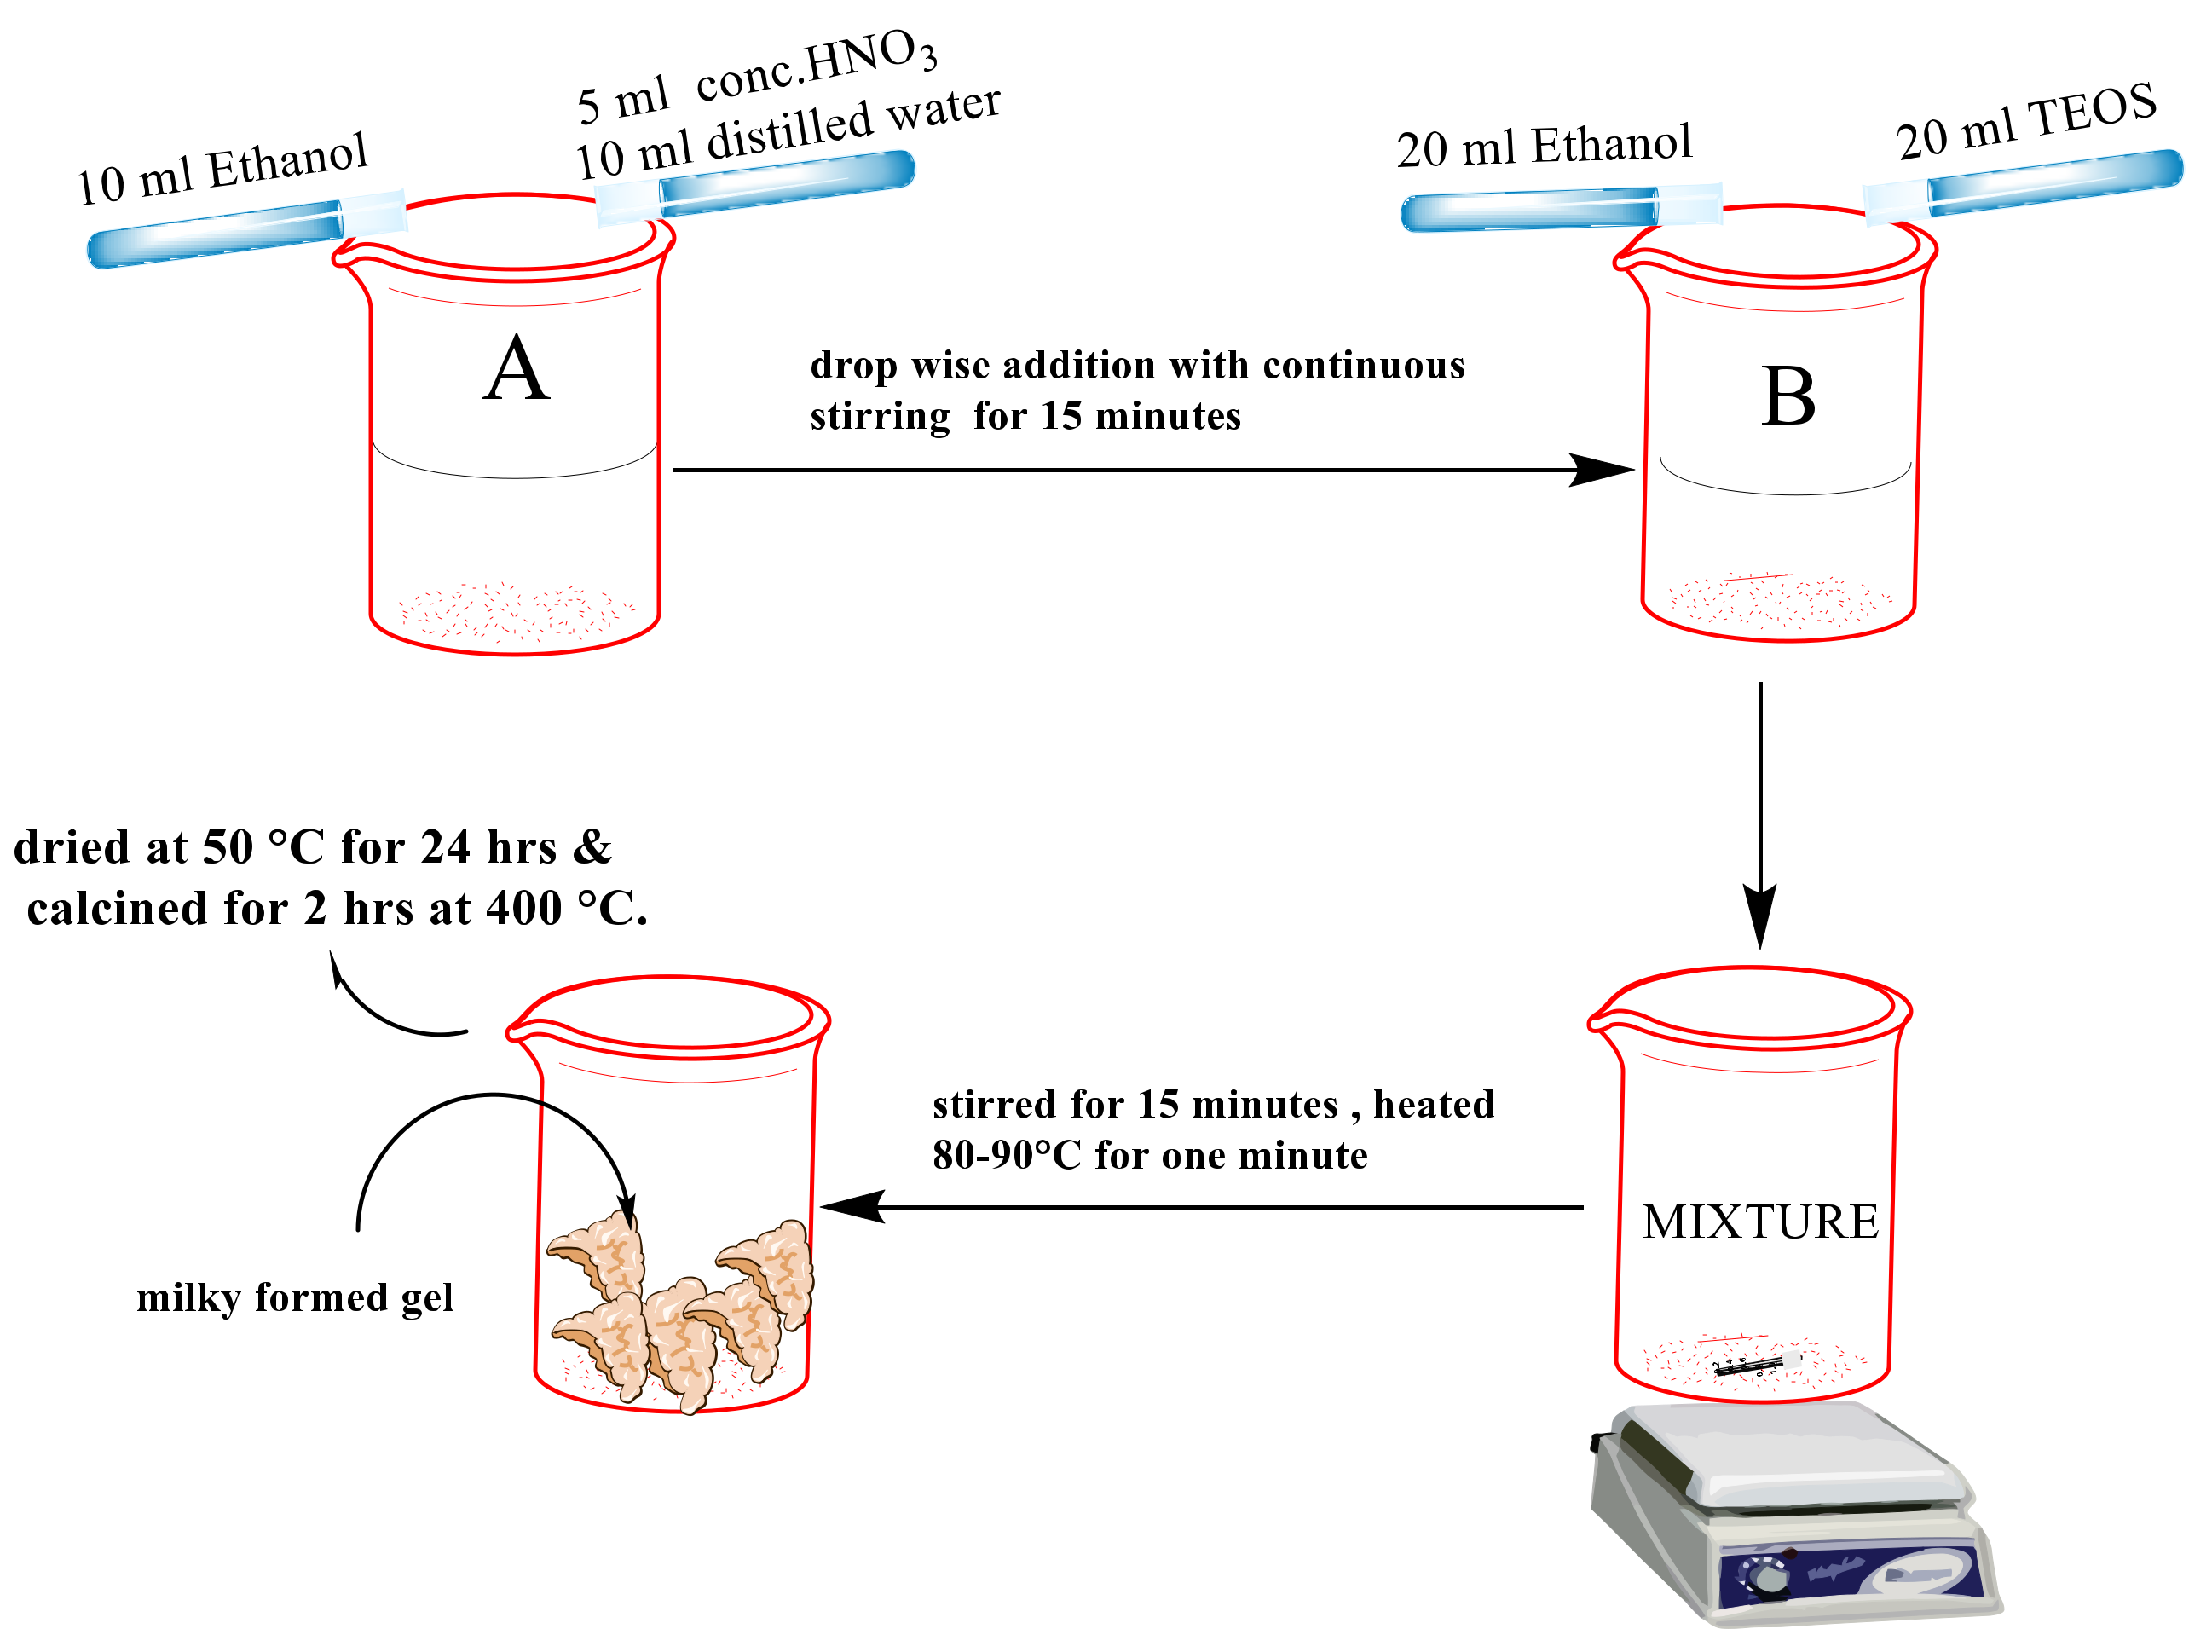
Scheme 1. Steps in the synthesis of the nanosilica using the sol–gel method.
Molecules 27 07536 sch001
Figure 1. XRD pattern for the produced nanosilica from a sol–gel method.
Molecules 27 07536 g001
Scheme 2. Dehydroxylation of the silica at high temperature.
Molecules 27 07536 sch002
Figure 2. DSC of the nanosilica particles.
Molecules 27 07536 g002
Figure 3. FTIR spectra of the silica NPs.
Molecules 27 07536 g003
Figure 4. BET adsorption isotherm and H–J t-plot (inside) of N2 at 77 K for the produced silica sample.
Molecules 27 07536 g004
Figure 5. SEM image of the produced nanosilica.
Molecules 27 07536 g005
Figure 6. Adsorption isotherms of copper and cadmium ions using the nanosilica (mass of adsorbent is 0.1 g, volume of solution is 50 mL, temperature is 25 °C, and equilibrium time is 72 h).
Molecules 27 07536 g006
Figure 7. The Freundlich, Langmuir, and DR models’ fit for the adsorption equilibrium of (a) Cu2+ and (b) Cd2+ using the nanosilica (mass of adsorbent is 0.1 g, volume of solution is 50 mL, temperature is 25 °C, equilibrium time is 72 h, and confidence limit is 15%).
Molecules 27 07536 g007
Figure 8. Effect of the equilibrium concentration of (a) Cd2+ and (b) Cu2+ on the multicomponent adsorption of copper (mass of adsorbent is 0.1 g, volume of solution is 50 mL, temperature is 25 °C, and equilibrium time is 72 h).
Molecules 27 07536 g008
Figure 9. Cleaned hydrated silica structure: (a) Si (yellow), O (red), H (white), and (b) Cu and Cd ions.
Molecules 27 07536 g009
Figure 10. Adsorption location of Cu2+ and Cd2+ within the silica crystal structure.
Molecules 27 07536 g010
Figure 11. Variation in the silica structure’s energies during ions loadings.
Molecules 27 07536 g011
Figure 12. Energy distribution and isosteric heat of adsorption for Cd2+ and Cu2+ by the nanosilica surface.
Molecules 27 07536 g012
Figure 13. Theoretical equilibrium isotherms for Cu2+ and Cd2+.
Molecules 27 07536 g013
Figure 14. Unit cell loading of cadmium and copper ions.
Molecules 27 07536 g014
Table 1. Pore structure parameters were obtained using the BET, Langmuir, and t-plot methods.
Langmuir EquationBET Methodt-Plot with H–J Thickness Equation
S t o t a l (m2/g) S t o t a l (m2/g) S m i c r o (m2/g) S e x t (m2/g) S m i c r o (m2/g) V m i c r o ( 10 3   cm 3 / g )
461.06307.64-294.7512.894.95
Table 2. Parameters of the adsorption isotherm models.
ModelParameters and Values
Cu2+Cd2+
Freundlich k L = 1.3962
= 0.5284
R 2 = 0.974
k = 0.7894
= 0.7023
R 2 = 0.990
Langmuir Q = 29.2835
b = 1.1596 × 10 2
R 2 = 0.933
Q = 72.1328
b = 3.9102 × 10 3
R 2 = 0.985
Dubinin–Radushkevich Q = 16.2049
k d = 7.0000 × 10 5
R 2 = 0.587
Q = 26.48772
k d = 3.6736 × 10 4
R 2 = 0.892
Table 3. Comparison of adsorption of Cu2+ and Cd2+ by various silica adsorbents.
CatalystInitial Conc. (ppm)Total Surface Area m2/gCu2+ Uptake (mg/g)Cd2+ Uptake (mg/g)Competitive Total Uptake (mg/g)Reference
Fe3O4-mesoporousSiO2 core-shell5483.7884.480.5-[53]
Amino-functionalized Fe3O4@SiO250216.229.922.5-[54]
Nanosilica from offshore white sandstone25298.71-55.18-[30]
Fe3O4@SiO2-EDTA2570.99--34.65[55]
Silicon dioxide-nano-powder (N-Si)56--67.4548[51]
This work200307.6429.2872.1318 for Cu2+
23 for Cd2+
Table 4. Variation in the adsorption capacities of Cd+2 and Cu+2 with increasing numbers of regeneration cycles.
ElementFirst Cycle Uptake (%)Second Cycle Uptake (%)Third Cycle Uptake (%)Fourth Cycle Uptake (%)Fifth Cycle Uptake (%)
Cd+2Cu+2Cd+2Cu+2Cd+2Cu+2Cd+2Cu+2Cd+2Cu+2
Single component Cd+2100-96-94-94-92-
Single component Cu+2-56-50-48-47-44
Publisher’s Note: MDPI stays neutral with regard to jurisdictional claims in published maps and institutional affiliations.