
Chemical Profiling and Biological Activity of Extracts from Nine Norwegian Medicinal and Aromatic Plants
 , , and
Abstract
1. Introduction
2. Results and Discussion
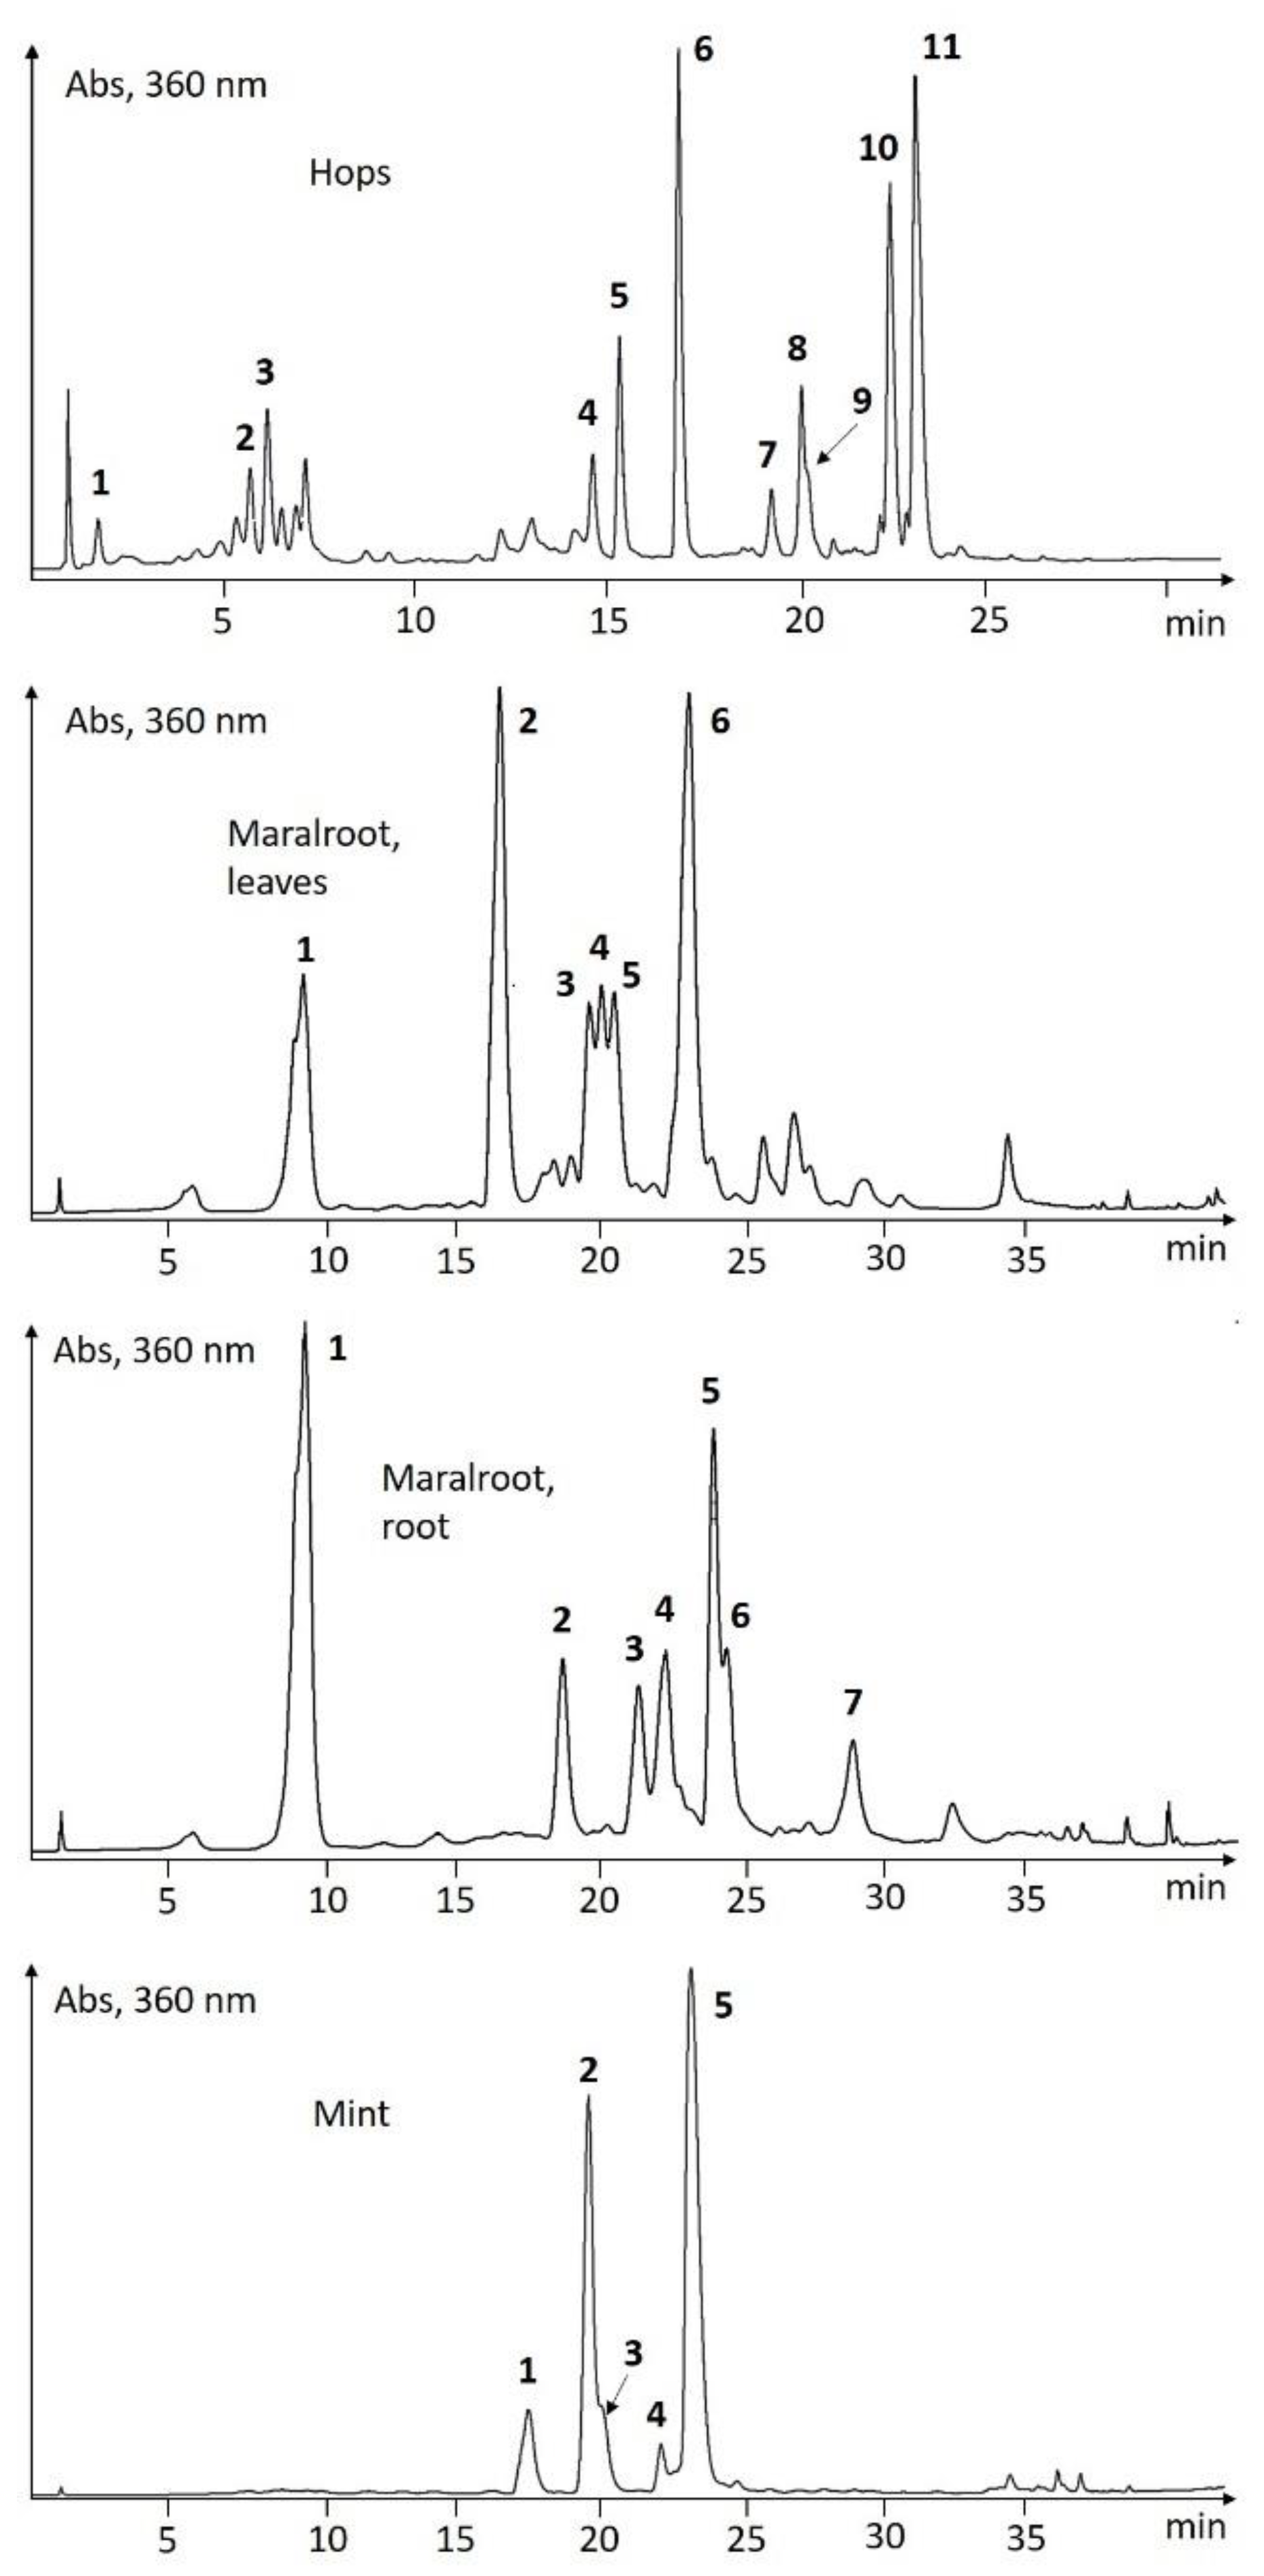
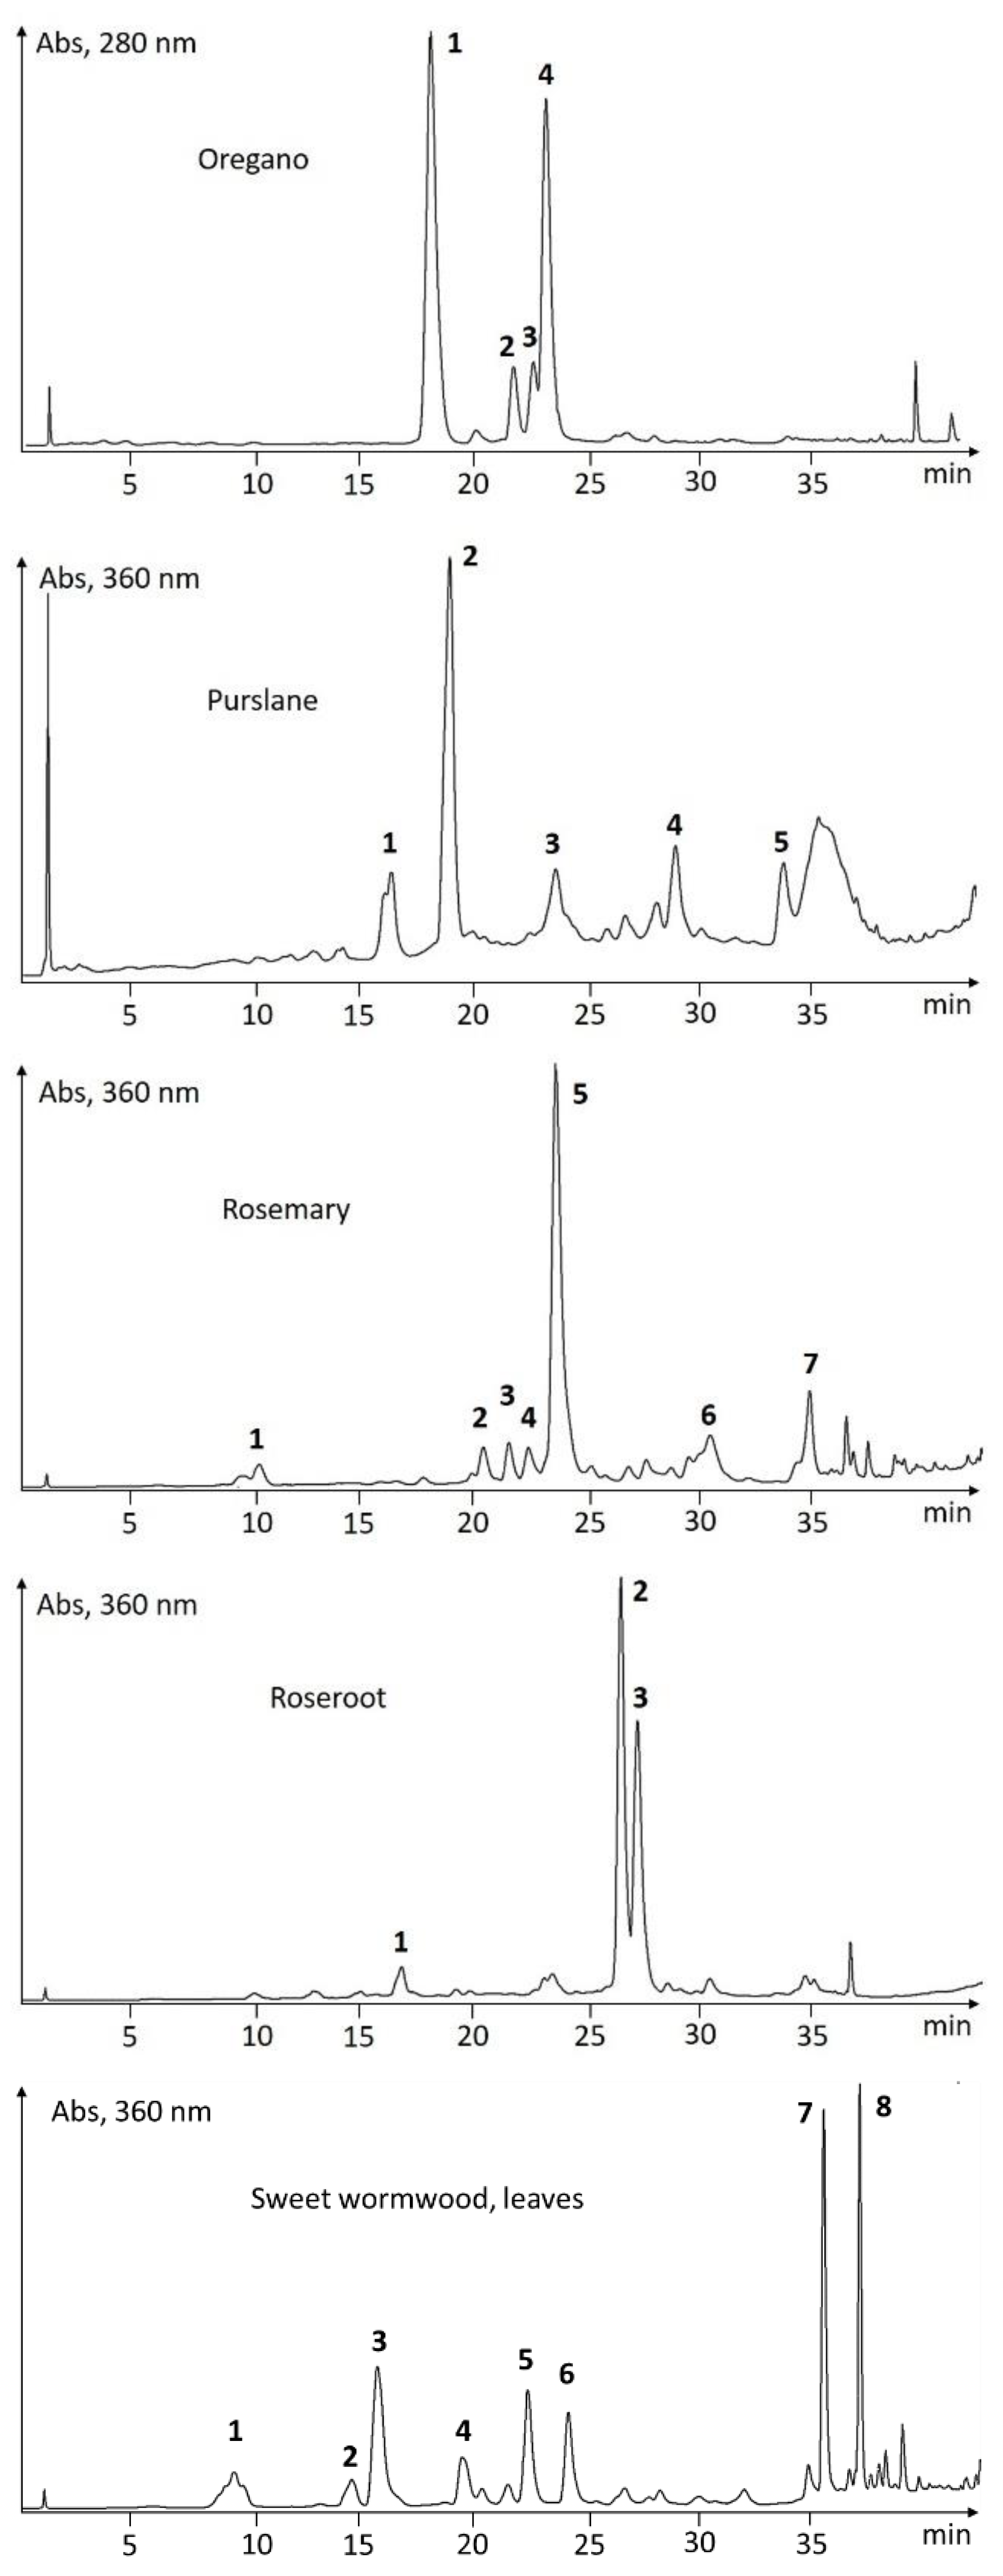
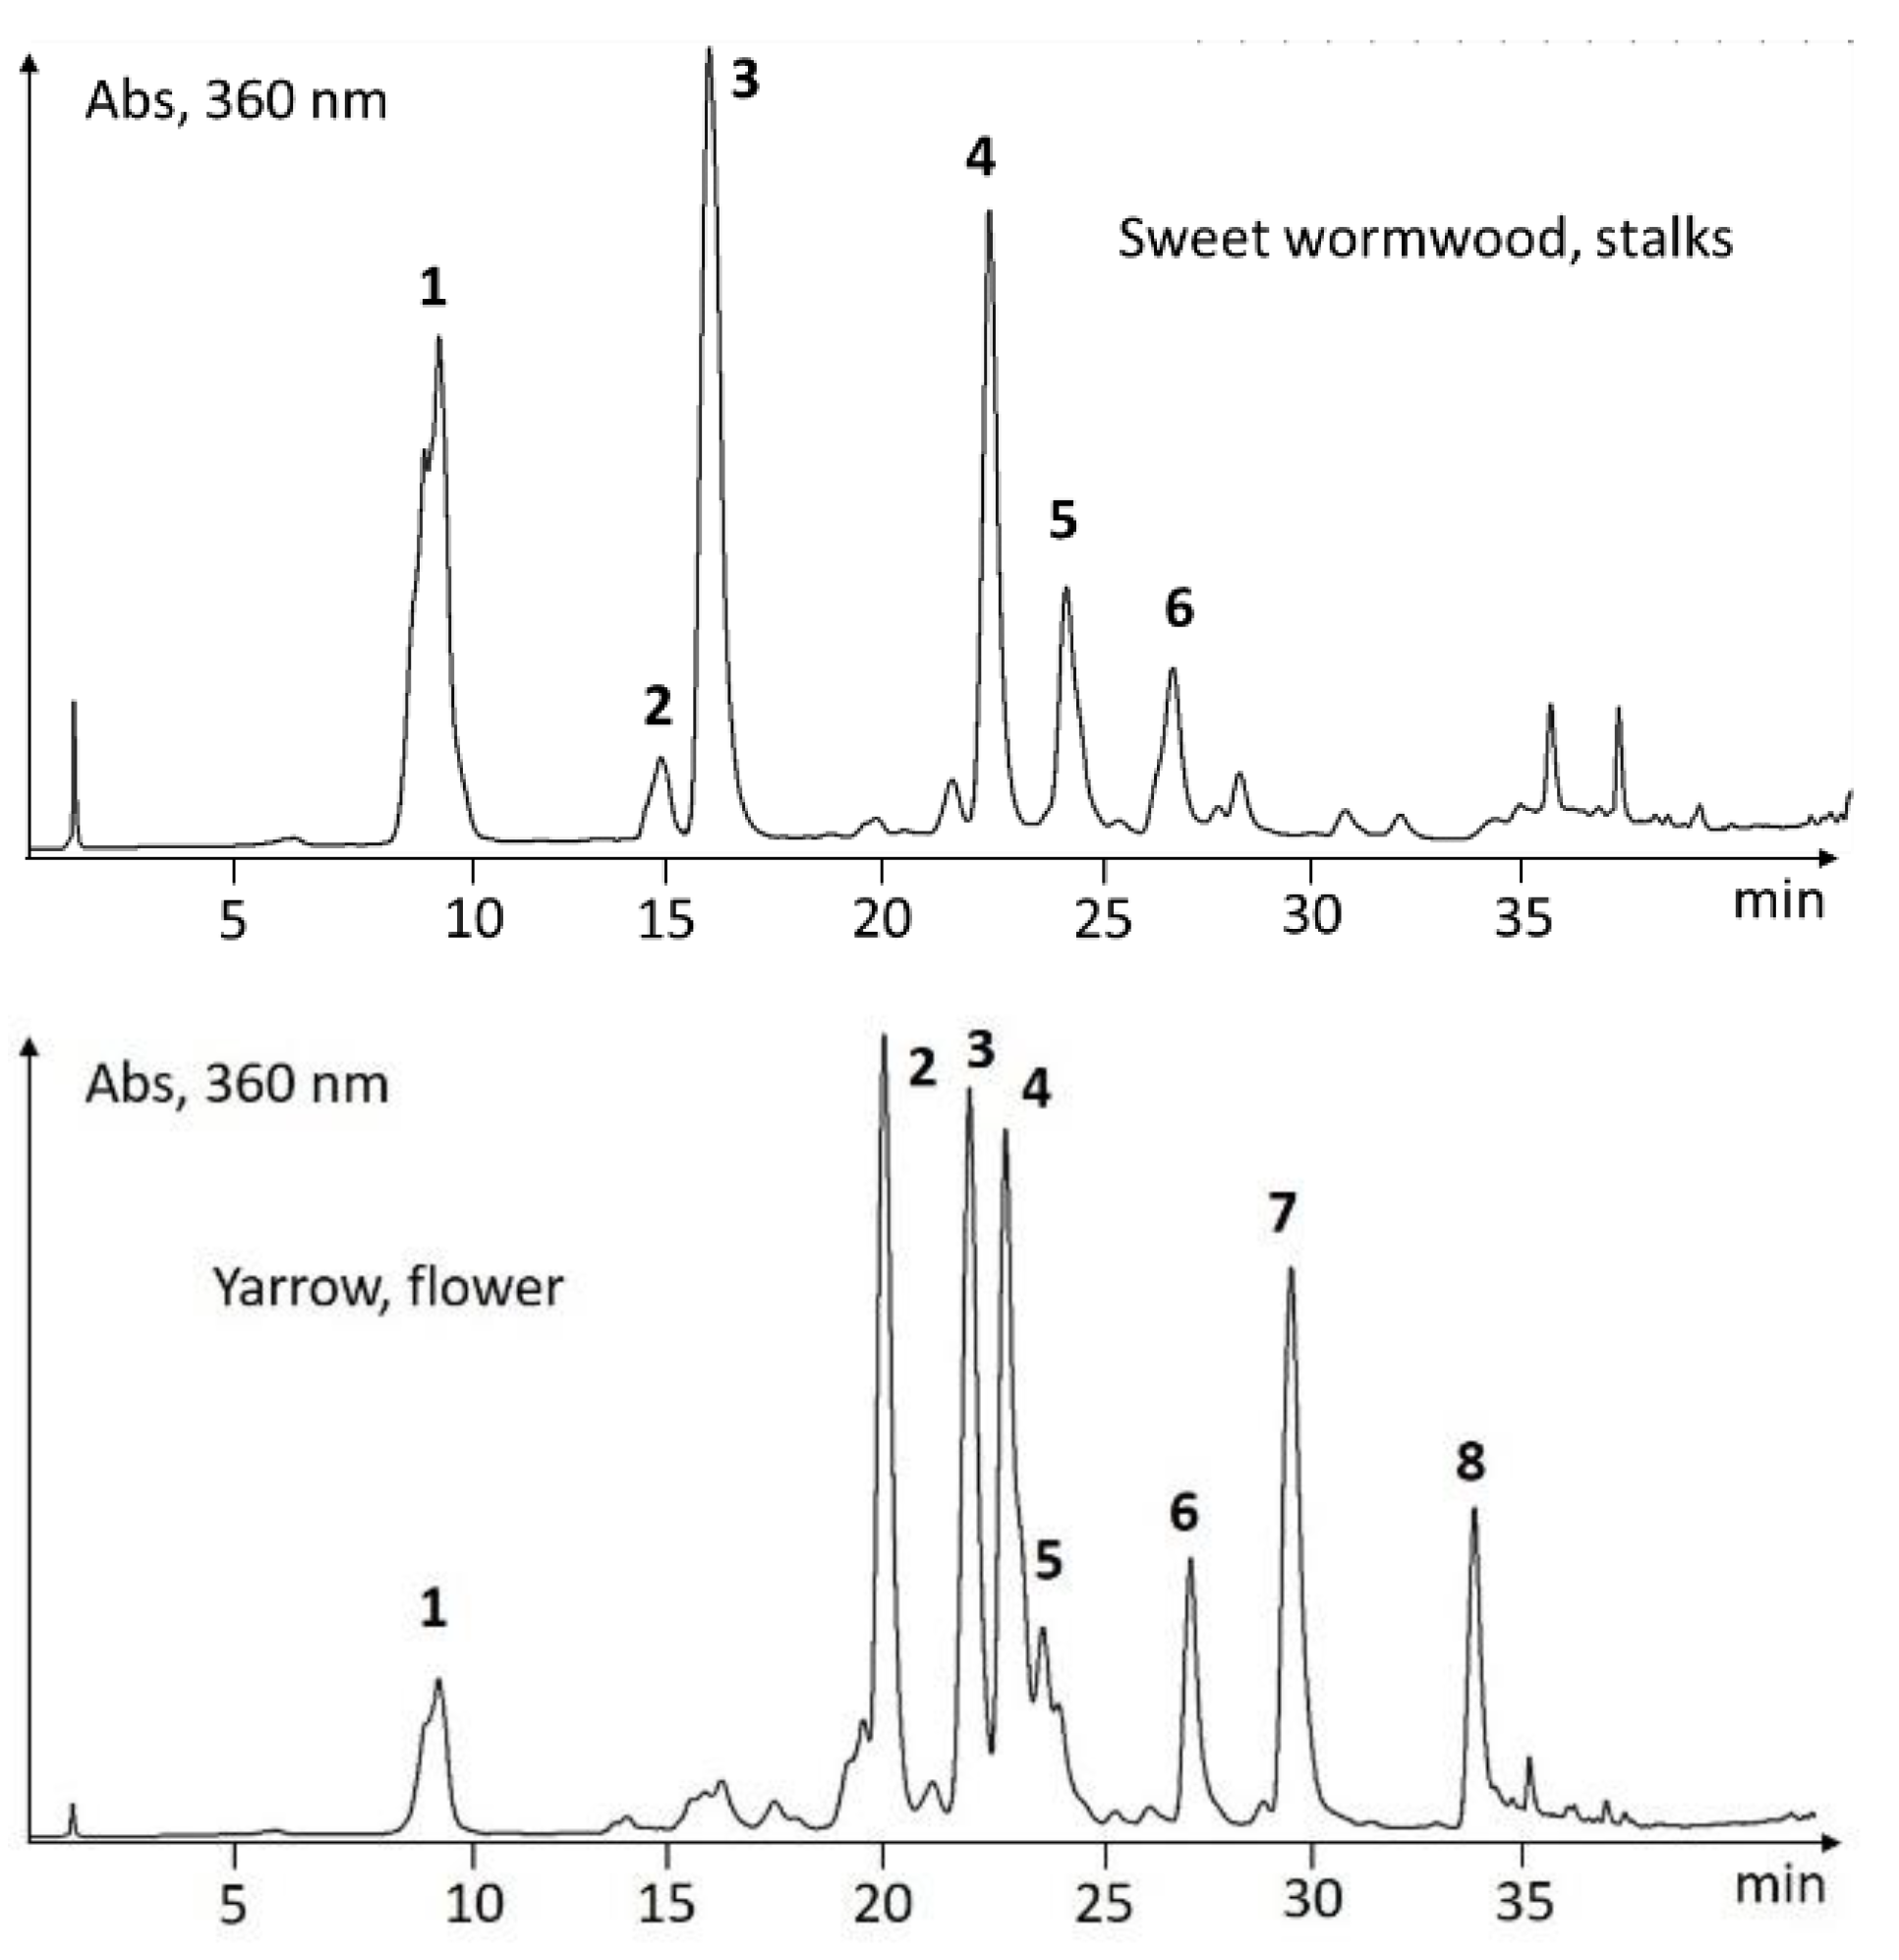
UHPLC-Screening of EtOH-Extracts
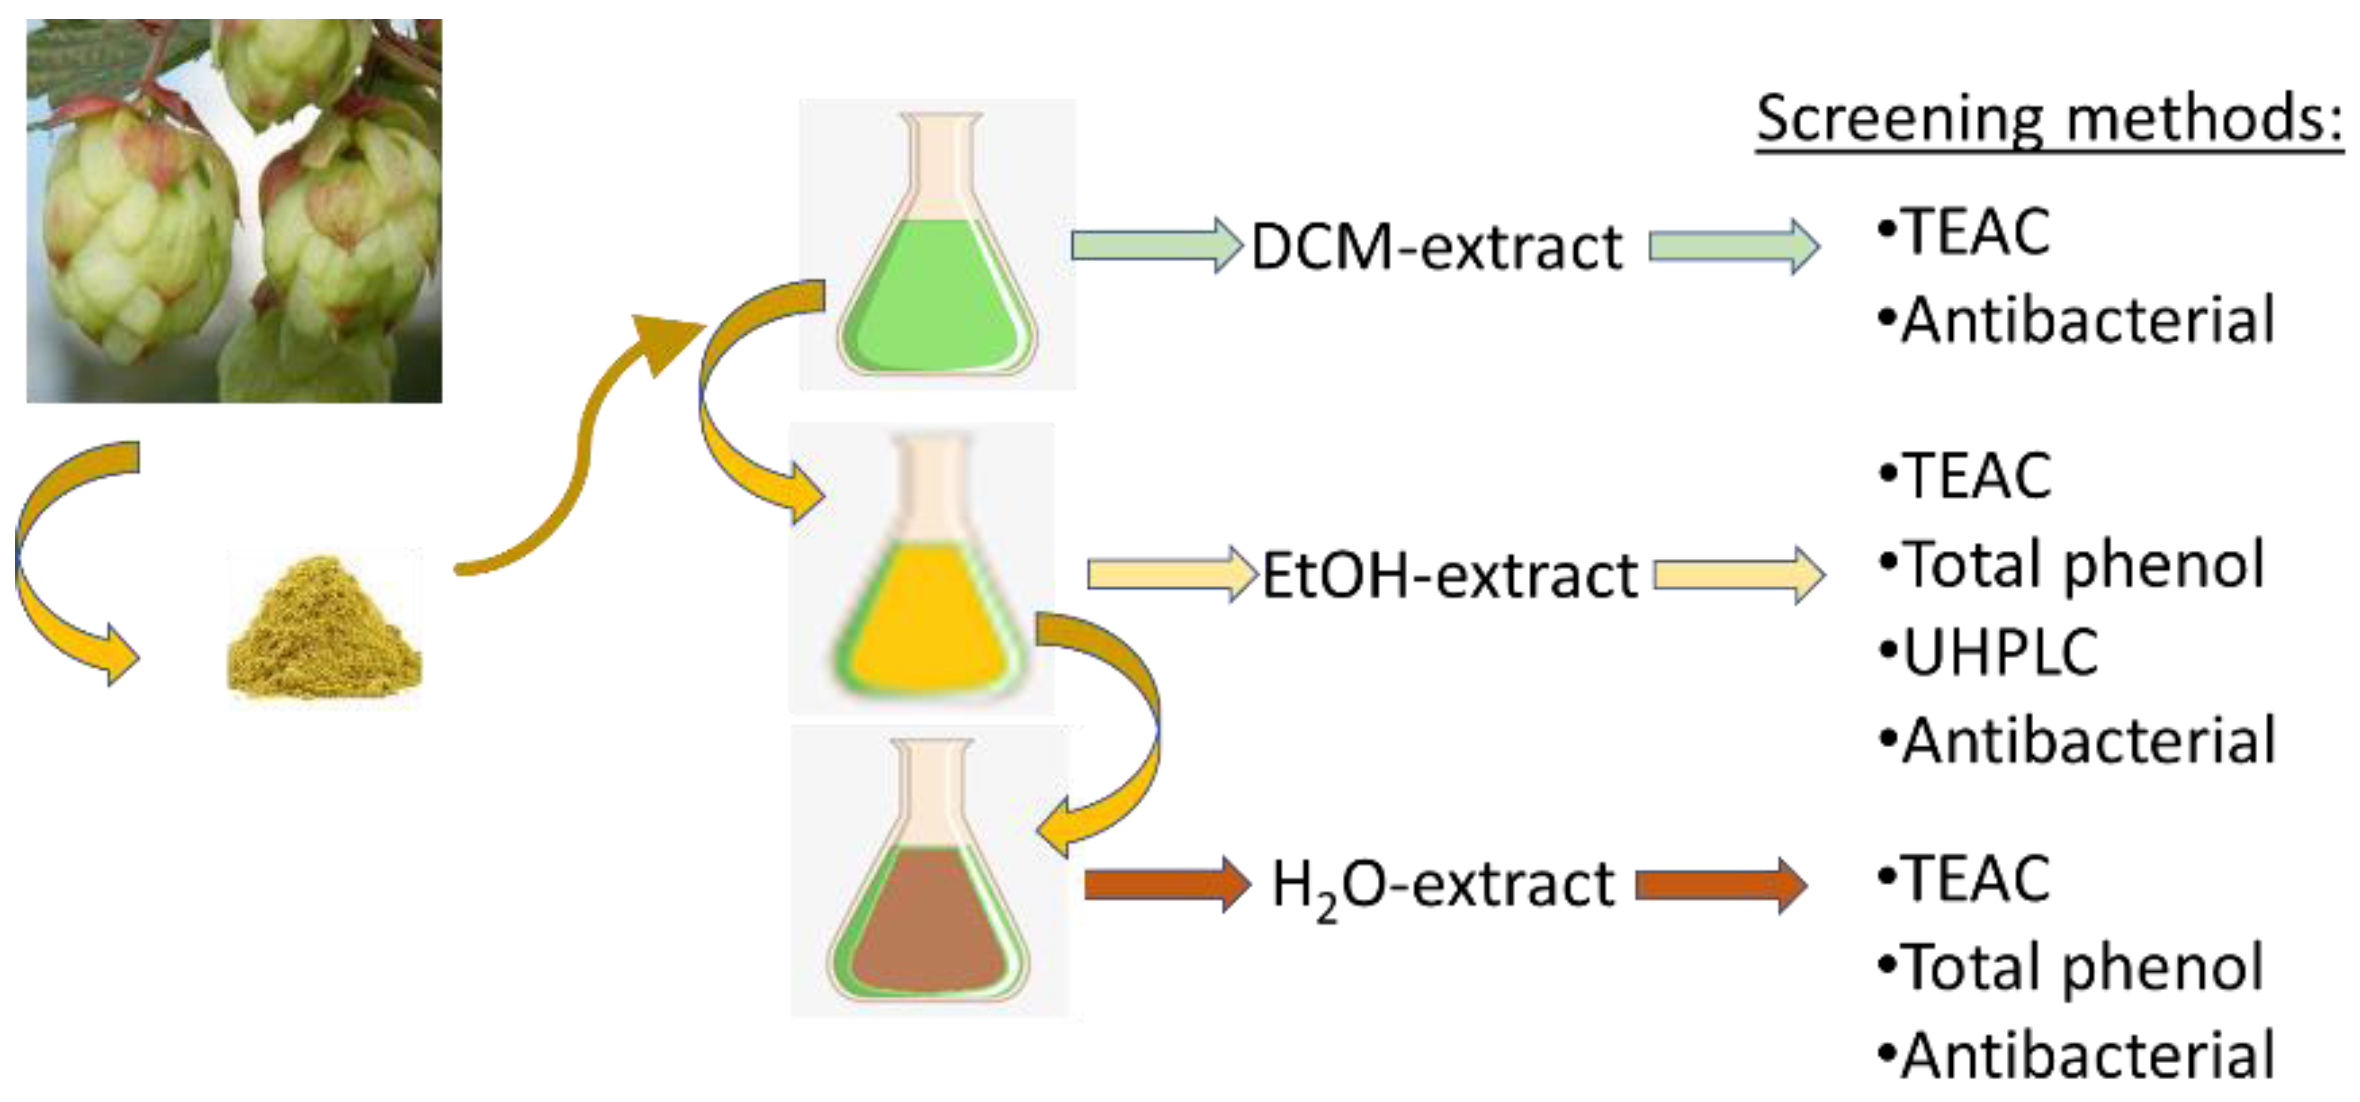
3. Materials and Methods
4. Conclusions
Author Contributions
Funding
Institutional Review Board Statement
Informed Consent Statement
Data Availability Statement
Acknowledgments
Conflicts of Interest
Sample Availability
References
- Tucker, A.O.; DeBaggio, T. The Encyclopedia of Herbs; DeBaggio, F., Ed.; Timber Press: Portland, OR, USA; London, UK, 2009; p. 23. [Google Scholar]
- Dou, H.; Niu, G.; Gu, M.; Masabni, J.G. Effects of light quality on growth and phytonutrient accumulation of herbs under controlled environments. Horticulturae 2017, 3, 36. [Google Scholar] [CrossRef]
- Manukyan, A. Effects of PAR and UV-B radiation on herbal yield, bioactive compounds and their antioxidant capacity of some medicinal plants under controlled environmental conditions. Photochem. Photobiol. 2013, 89, 406–414. [Google Scholar] [CrossRef] [PubMed]
- Martinussen, I.; Volodin, V.; Volodina, S.; Uleberg, E. Effect of climate on plant growth and level of adaptogenic compounds in maral root (Leuzea charthamoides (Willd.) DC.), crowned saw-wort (Serratula coronata L.) and roseroot (Rhodiola rosea L.). Eur. J. Plant Sci. Biotech. 2011, 5, 72–77. [Google Scholar]
- Anastasiou, T.I.; Mandalakis, M.; Krigas, N.; Vézignol, T.; Lazari, D.; Katharios, P.; Dailianis, T.; Antonopoulou, E. Comparative Evaluation of Essential Oils from Medicinal-Aromatic Plants of Greece: Chemical Composition, Antioxidant Capacity and Antimicrobial Activity against Bacterial Fish Pathogens. Molecules 2020, 25, 148. [Google Scholar] [CrossRef]
- Cunha, J.A.; Heinzmann, B.M.; Baldisserotto, B. The effects of essential oils and their major compounds on fish bacterial pathogens—A review. J. Appl. Microbiol. 2018, 125, 328–344. [Google Scholar] [CrossRef] [PubMed]
- Alam, M.N.; Ahmed, G.U.; Chowdhury, M.B. Performance of herbal extracts on diseased fish. Bangladesh J. Vet. Med. 2014, 12, 225–230. [Google Scholar] [CrossRef]
- Abeyrathne, E.D.N.S.; Nam, K.; Huang, X.; Ahn, D.U. Plant- and animal-based antioxidants structure, efficacy, mechanisms, and applications. Antioxidants 2022, 11, 1025. [Google Scholar] [CrossRef]
- Norouzi, B.; Quotbi, A.A.A.; Seidavi, A.; Schiavone, A.; Martínez Marín, A.L. Effect of different dietary levels of rosemary (Rosmarinus officinalis) and yarrow (Achillea millefolium) on the growth performance, carcass traits and ileal microbiota of broilers. It. J. Animal Sci. 2015, 14, 448–453. [Google Scholar] [CrossRef]
- Abdel-Wareth, A.A.A.; Kehraus, S.; Südekum, K.H. Peppermint and its respective active component in diets of broiler chickens: Growth performance, viability, economics, meat physicochemical properties, and carcass characteristics. Poultry Sci. 2019, 98, 3850–3859. [Google Scholar] [CrossRef]
- Karlsen, C.; Vanberg, C.; Mikkelsen, H.; Sørum, H. Co-infection of Atlantic salmon (Salmo salar), by Moritella viscosa and Aliivibrio wodanis, development of disease and host colonization. Vet. Microbiol. 2014, 171, 112–121. [Google Scholar] [CrossRef]
- Sommerset, I.; Walde, C.S.; Bang Jensen, B.; Wiik-Nielsen, J.; Bornø, G.; Oliveira, V.H.S.; Haukaas, A.; Brun, E. Norwegian Fish Health Report 2021, Norwegian Veterinary Institute Report; Series #2a/2022; Norwegian Veterinary Institute: Aas, Norway, 2022. [Google Scholar]
- Lourenço, S.C.; Moldão-Martins, M.; Alves, V.D. Antioxidants of natural plant origins: From sources to food industry applications. Molecules 2019, 24, 4132. [Google Scholar] [CrossRef]
- Vilkhu, K.; Mawson, R.; Simons, L.; Bates, D. Applications and opportunities for ultrasound assisted extraction in the food industry—A review. Inn. Food Sci. Emerg. Technol. 2008, 9, 161–169. [Google Scholar] [CrossRef]
- Lefebvre, T.; Destandau, E.; Lesellier, E. Selective extraction of bioactive compounds from plants using recent extraction techniques: A review. J. Chrom. A 2021, 1635, 461770. [Google Scholar] [CrossRef] [PubMed]
- Hrnčič, M.K.; Cör, D.; Simonovska, J.; Knez, Z.; Kavrakovski, Ž; Rafajlovska, V. Extraction techniques and analytical methods for characterization of active compounds in origanum species. Molecules 2020, 25, 4735. [Google Scholar] [CrossRef] [PubMed]
- Hashemi, S.M.B.; Khaneghah, A.M.; Akbarirad, H. The effects of amplitudes ultrasound-assisted solvent extraction and pretreatment time on the yield and quality of Pistacia Khinjuk Hull Oil. J. Oleo Sci. 2016, 65, 733–738. [Google Scholar] [CrossRef] [PubMed]
- Luque de Castro, M.D.; Priego-Capote, F. Soxhlet extraction: Past and present panacea. J. Chrom. A 2010, 1217, 2383–2389. [Google Scholar] [CrossRef] [PubMed]
- Ruan, J.; Liu, Z.; Qiu, F.; Shi, H.; Wang, M. Simultaneous quantification of five sesquiterpene components after ultrasound extraction in Artemisia annua L. by an accurate and rapid UPLC–PDA assay. Molecules 2019, 24, 1530. [Google Scholar] [CrossRef] [PubMed]
- Zeroual, A.; Sakar, E.H.; Eloutassi, N.; Mahjoubi, F.; Chauch, M.; Chaqroune, A. Wild Chamomile [Cladanthus mixtus (L.) Chevall.] Collected from Central-Northern Morocco: Phytochemical Profiling, Antioxidant, and Antimicrobial Activities. Biointerface Res. Appl. Chem. 2021, 11, 11440–11457. [Google Scholar] [CrossRef]
- Zeroual, A.; Sakar, E.H.; Mahjoubi, F.; Chauch, M.; Chaqroune, A.; Taleb, M. Effects of Extraction Technique and Solvent on Phytochemicals, Antioxidant, and Antimicrobial Activities of Cultivated and Wild Rosemary (Rosmarinus officinalis L.) from Taounate Region (Northern Morocco). Biointerface Res. Appl. Chem. 2022, 12, 8441–8452. [Google Scholar] [CrossRef]
- Stevens, J.F.; Ivancic, M.; Hsu, V.L.; Deinzer, M.L. Prenylflavonoids from Humulus lupulus. Phytochemistry 1997, 44, 1575–1585. [Google Scholar] [CrossRef]
- McCallum, G.L.; Nabuurs, M.H.; Gallant, S.T.; Kirby, C.W.; Mills, A.A.S. Phytochemical characterization of wild hops (Humulus lupulus ssp. lupuloides) germplasm resources from the maritimes region of Canada. Fron. Plant Sci. 2019, 11, 1438. [Google Scholar] [CrossRef]
- Seliger, J.M.; Cicek, S.S.; Witt, L.T.; Martin, H.J.; Maser, E.; Hintzpeter, J. Selective inhibition of human AKR1B10 by n-humulone, adhumulone and cohumulone isolated from Humulus lupulus extract. Molecules 2018, 23, 3041. [Google Scholar] [CrossRef] [PubMed]
- Mabry, T.J.; Markham, K.R.; Thomas, M.B. The Systematic Identification of Flavonoids; Springer: Berlin/Heidelberg, Germany, 1970. [Google Scholar]
- Markham, K.R. Techniques of Flavonoid Identification; Academic Press: London, UK, 1982; p. 50. [Google Scholar]
- Stodulka, P.; Koleckar, V.; Jun, D.; Kuca, K.; Rehakova, Z.; Kubikova, K.; Jahodar, L.; Kunes, J.; Opletal, L. High-performance liquid chromatography analysis of four Leuzea carthamoides flavonoid. J. Chrom. Sci. 2008, 46, 162–164. [Google Scholar] [CrossRef] [PubMed][Green Version]
- Pereira, O.R.; Cardoso, S.M. Overview on Mentha and Thymus polyphenols. Curr. Anal. Chem. 2013, 9, 382–396. [Google Scholar] [CrossRef]
- Matsuura, H.; Chiji, H.; Asakawa, C.; Amano, M.; Yoshihara, T.; Mizutani, J. DPPH radical scavengers from dried leaves of oregano (Origanum vulgare). Biosci. Biotechnol. Biochem. 2003, 67, 2311–2316. [Google Scholar] [CrossRef]
- Nakatani, N.; Kikuzaki, H. A new antioxidative glucoside isolated from oregano (Origanum vulgare L.). Agric. Biol. Chem. 1987, 51, 2727–2732. [Google Scholar] [CrossRef]
- Voynikov, Y.; Nedialkov, P.; Gevrenova, R.; Zheleva-Dimitrova, D.; Balabanova, V.; Dimitrov, I. UHPLC-orbitrap-MS tentative identification of 51 oleraceins (cyclo-dopa amides) in Portulaca oleracea L. cluster analysis and MS2 filtering by mass difference. Plants 2021, 10, 1921. [Google Scholar] [CrossRef] [PubMed]
- Xiang, L.; Xing, D.; Wang, W.; Wang, R.; Ding, Y.; Du, L. Alkaloids from Portulaca oleracea L. Phytochem. 2005, 66, 2595–2601. [Google Scholar] [CrossRef] [PubMed]
- Mizutani, M.; Hashidoko, Y.; Tahara, S. Factors responsible for inhibiting the motility of zoospores of the phytopathogenic fungus Aphanomyces cochlioides isolated from the non-host plant Portulaca oleracea. FEBS Lett. 1998, 438, 236–240. [Google Scholar] [CrossRef]
- Feng, P.C.; Haynes, L.J.; Magnus, K.E. High concentration of (-)-Noradrenaline in Portulaca oleracea L. Nature 1961, 191, 1108. [Google Scholar] [CrossRef] [PubMed]
- Nieto, G.; Ros, G.; Castillo, J. Antioxidant and antimicrobial properties of rosemary (Rosmarinus officinalis, L.): A review. Medicines 2018, 5, 98. [Google Scholar] [CrossRef]
- Li, P.; Liu, A.; Li, Y.; Yuan, B.; Xiao, W.; Liu, Z.; Zhang, S.; Lin, H. Development and validation of an analytical method based on HPLC-ELSD for the simultaneous determination of rosmarinic acid, carnosol, carnosic acid, oleanolic acid and ursolic acid in rosemary. Molecules 2019, 24, 323. [Google Scholar] [CrossRef] [PubMed]
- Mena, P.; Cirlini, M.; Tassotti, M.; Herrlinger, K.A.; Dall’Asta, C.; Del Rio, D. Phytochemical profiling of flavonoids, phenolic acids, terpenoids, and volatile fraction of a rosemary (Rosmarinus officinalis L.) extract. Molecules 2016, 21, 1576. [Google Scholar] [CrossRef] [PubMed]
- Peixoto, J.A.B.; Álvarez-Rivera, G.; Alves, R.C.; Costa, A.S.G.; Machado, S.; Cifuentes, A.; Ibáñez, E.; Oliveira, M.B.P.P. Comprehensive phenolic and free amino acid analysis of rosemary infusions: Influence on the antioxidant potential. Antioxidants 2021, 10, 500. [Google Scholar] [CrossRef]
- Lee, S.H.; Kim, H.W.; Lee, M.K.; Kim, Y.J.; Asamenew, G.; Cha, Y.S.; Kim, J.B. Phenolic profiling and quantitative determination of common sage (Salvia plebeia R. Br.) by UPLC-DAD-QTOF/MS. Eur. Food Res. Technol. 2018, 244, 1637–1646. [Google Scholar] [CrossRef]
- Alperth, F.; Turek, I.; Weiss, S.; Vogt, D.; Bucar, F. Qualitative and Quantitative Analysis of Different Rhodiola rosea Rhizome Extracts by UHPLC-DAD-ESI-MSn. Sci. Pharm. 2019, 87, 8. [Google Scholar] [CrossRef]
- Tan, D.C.; Quek, A.; Kassim, N.K.; Ismail, I.S.; Lee, J.J. Rapid quantification and validation of biomarker scopoletin in Paederia foetida by qNMR and UV–Vis for herbal preparation. Molecules 2020, 25, 5162. [Google Scholar] [CrossRef]
- Czechowski, T.; Larson, T.R.; Catania, T.M.; Harvey, D.; Wei, C.; Essome, M.; Brown, G.D.; Graham, I.A. Detailed phytochemical analysis of high- and low artemisinin-producing chemotypes of Artemisia annua. Front. Plant Sci. 2018, 9, 641. [Google Scholar] [CrossRef]
- Stein, W.; Anhut, S.; Zinsmeister, H.D.; Mues, R. New flavone glucoside malonylesters from Bryum capillare. Z. Naturforsch. C 1985, 40, 469–473. [Google Scholar] [CrossRef]
- Steckel, A.; Schlosser, G. An organic chemist’s guide to electrospray mass spectrometric structure elucidation. Molecules 2019, 24, 611. [Google Scholar] [CrossRef]
- Yuan, G.; Guan, Y.; Yi, H.; Lai, S.; Sun, Y.; Cao, S. Antibacterial activity and mechanism of plant flavonoids to gram-positive bacteria predicted from their lipophilicities. Sci. Rep. 2021, 11, 10471. [Google Scholar] [CrossRef] [PubMed]
- Dürwald, A.; Zühlke, M.-K.; Schlüter, R.; Gebbe, R.; Bartosik, D.; Unfried, F.; Becher, D.; Schweder, T. Reaching out in anticipation: Bacterial membrane extensions represent a permanent investment in polysaccharide sensing and utilization. Environ. Microbiol. 2021, 23, 3149–3163. [Google Scholar] [CrossRef] [PubMed]
- Bouhlel, Z.; Arnold, A.A.; Warschawski, D.E.; Lemarchand, K.; Tremblay, R.; Marcotte, I. Labelling strategy and membrane characterization of marine bacteria Vibrio splendidus by in vivo 2H NMR. Biochim. Biophys. Acta (BBA)-Biomembr. 2019, 1861, 871–878. [Google Scholar] [CrossRef]
- Gberikon, G.M.; Adeoti, I.I.; Aondoackaa, A.D. Effect of ethanol and aqueous solutions as extraction solvents on phytochemical screening and antibacterial activity of fruit and stem bark extracts of Tetrapleura tetrapteraon Streptococcus salivarus and Streptococcus mutans. Int. J. Curr. Microbiol. Appl. Sci. 2015, 5, 404–410. [Google Scholar]
- Waterman, P.G.; Cole, S. Analysis of Phenolic Plant Metabolites; Blackwell Scientific Publications: London, UK, 1994; p. 84. [Google Scholar]
- Slimestad, R.; Vangdal, E.; Brede, C. Analysis of phenolic compounds in six Norwegian plum cultivars (Prunus domestica L.). J. Agric. Food Chem. 2009, 57, 11370–11375. [Google Scholar] [CrossRef] [PubMed]
- Re, R.; Pellegrini, N.; Proteggente, A.; Pannala, A.; Yang, M.; Rice-Evans, C. Antioxidant activity applying an improved ABTS radical cation decolorization assay. Free Rad. Biol. Med. 1999, 26, 1231–1237. [Google Scholar] [CrossRef]


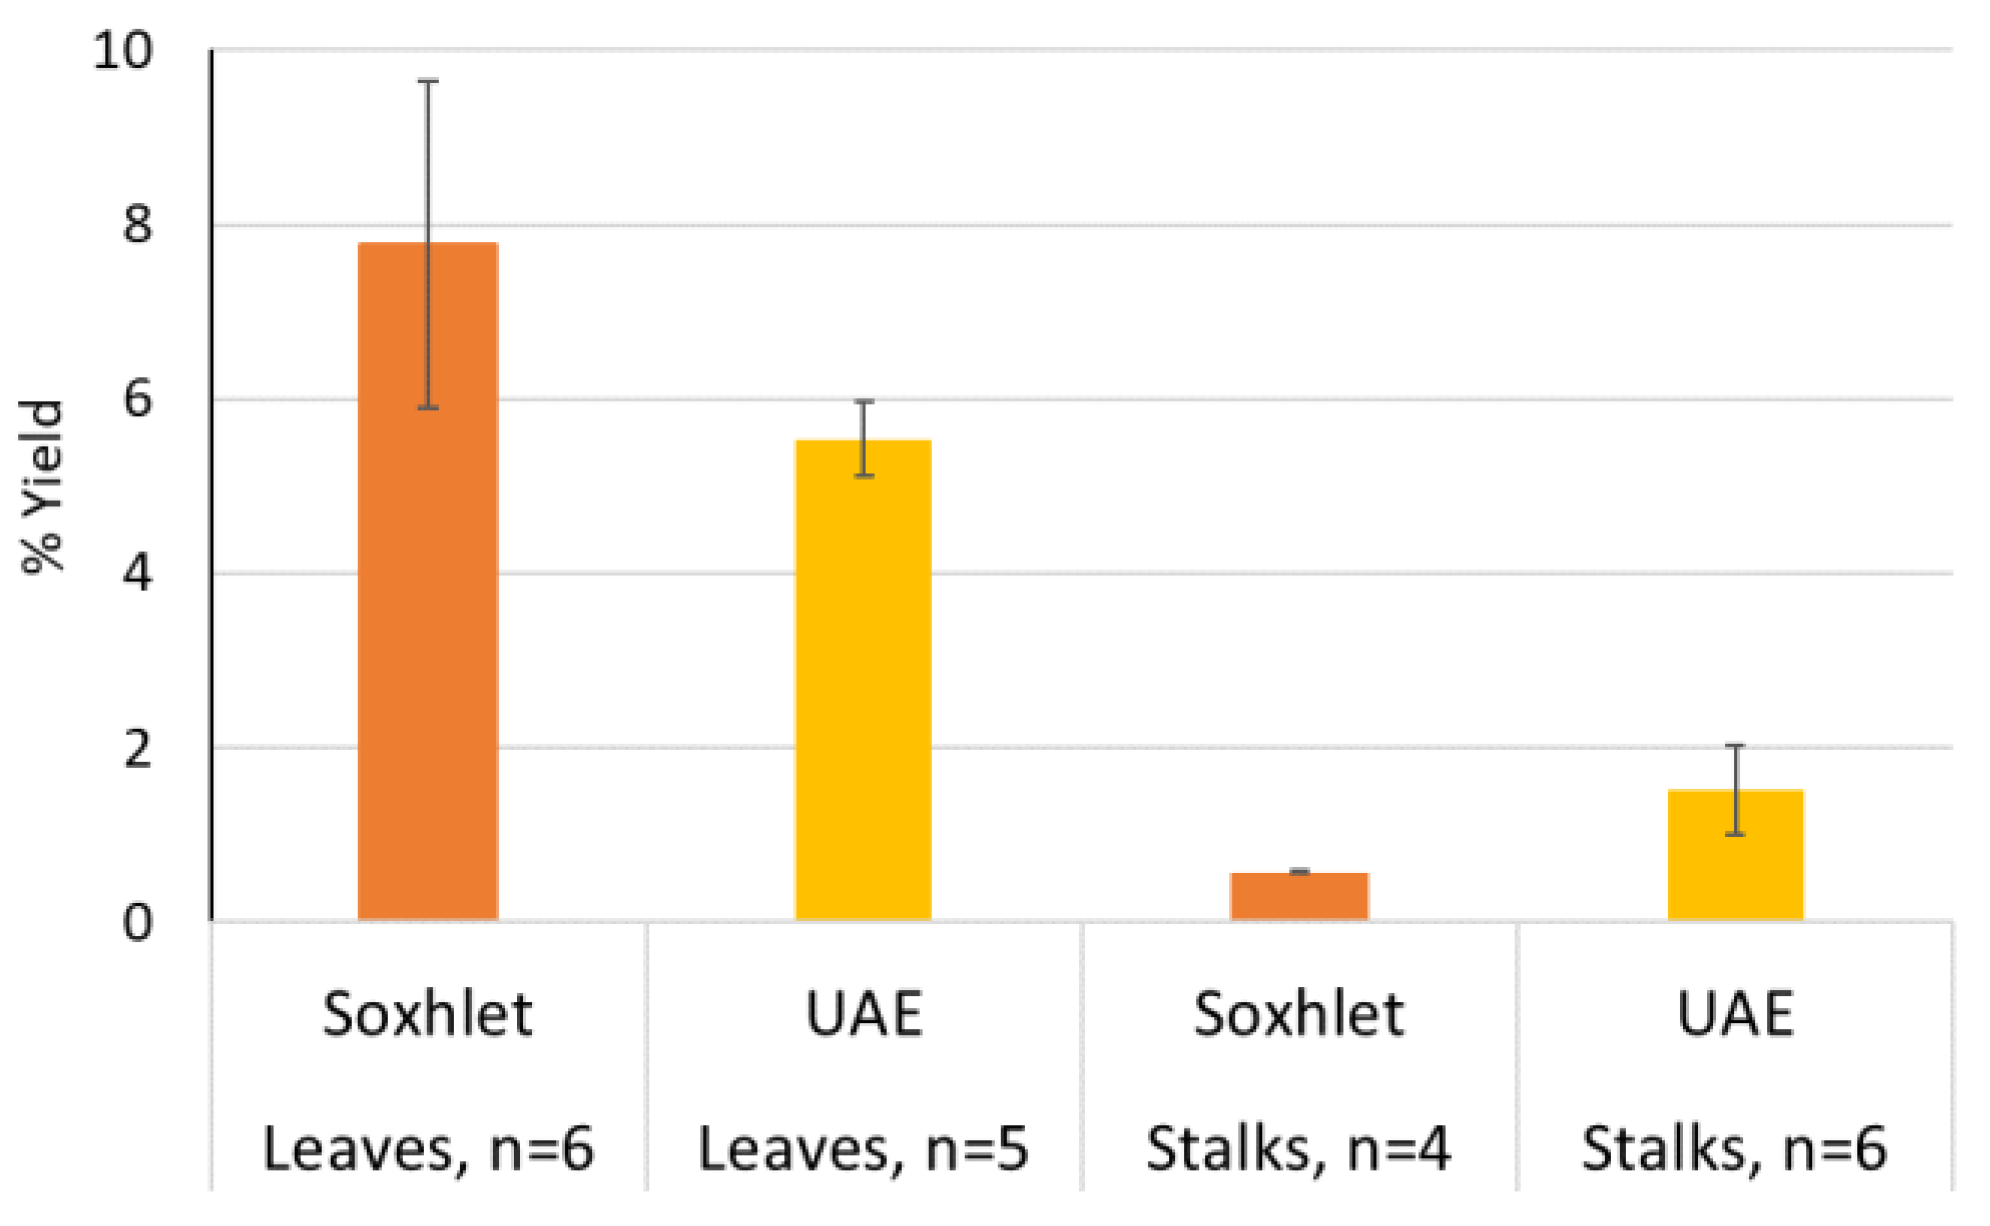
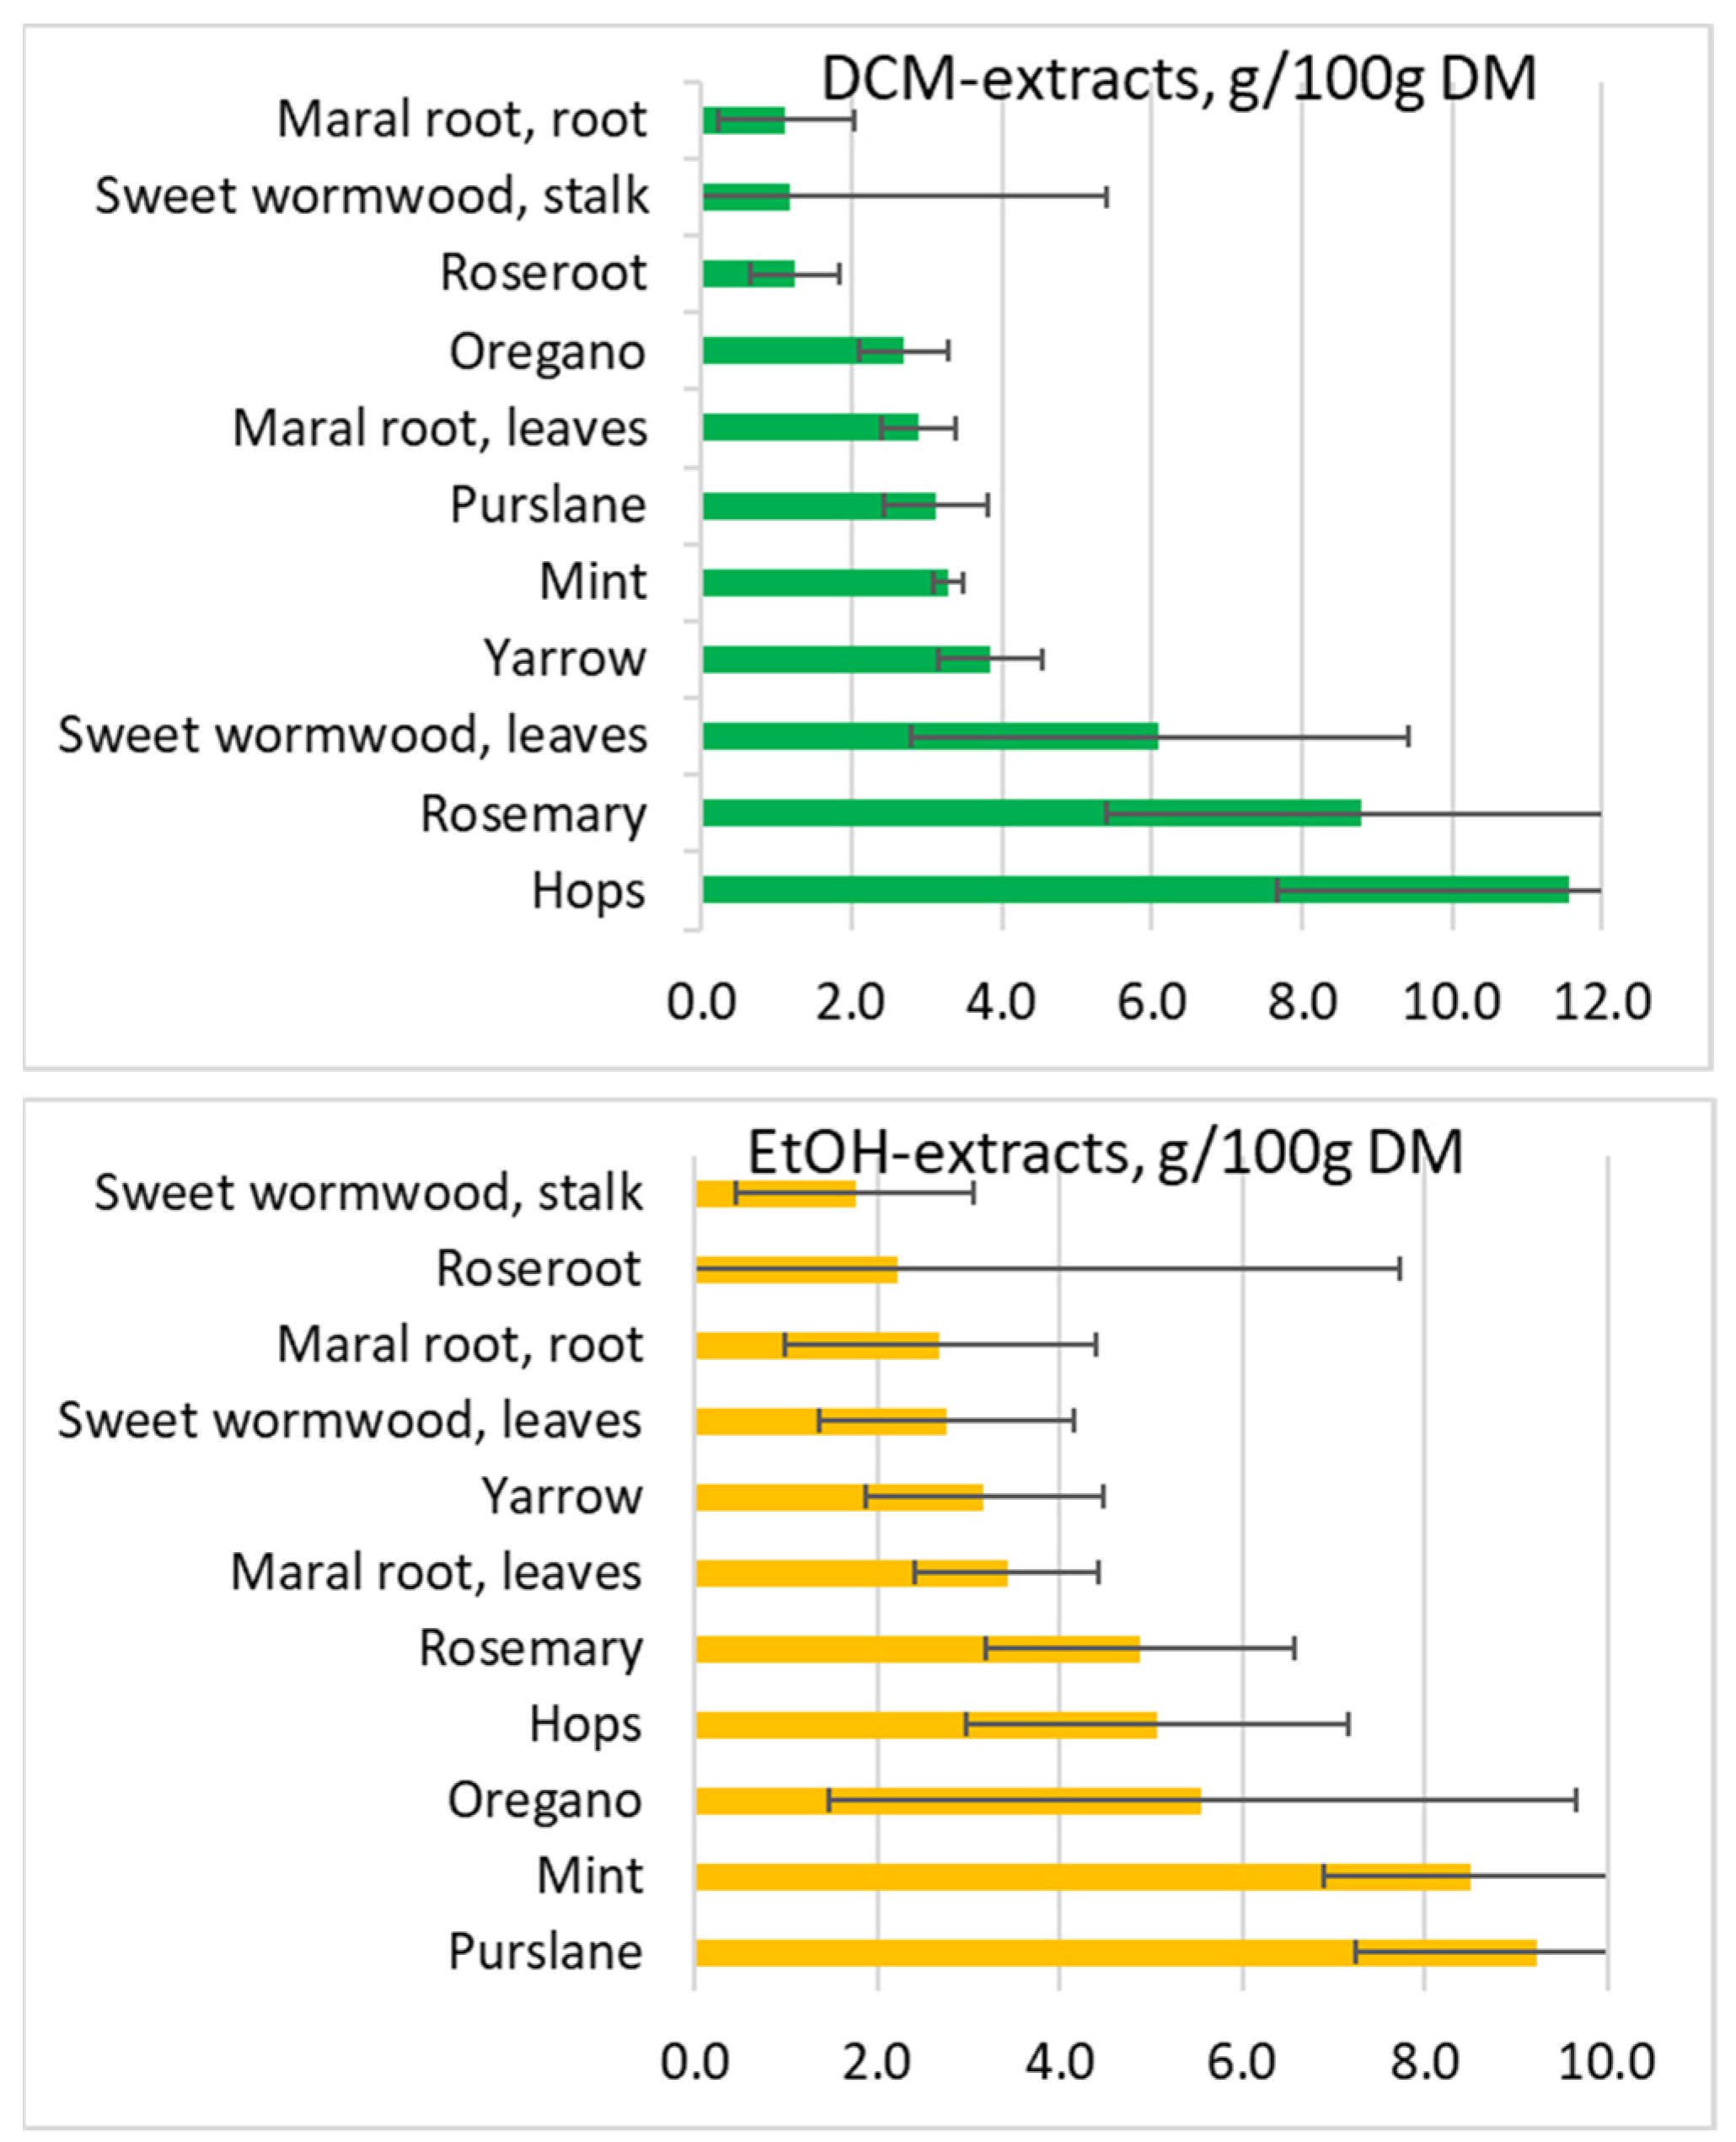
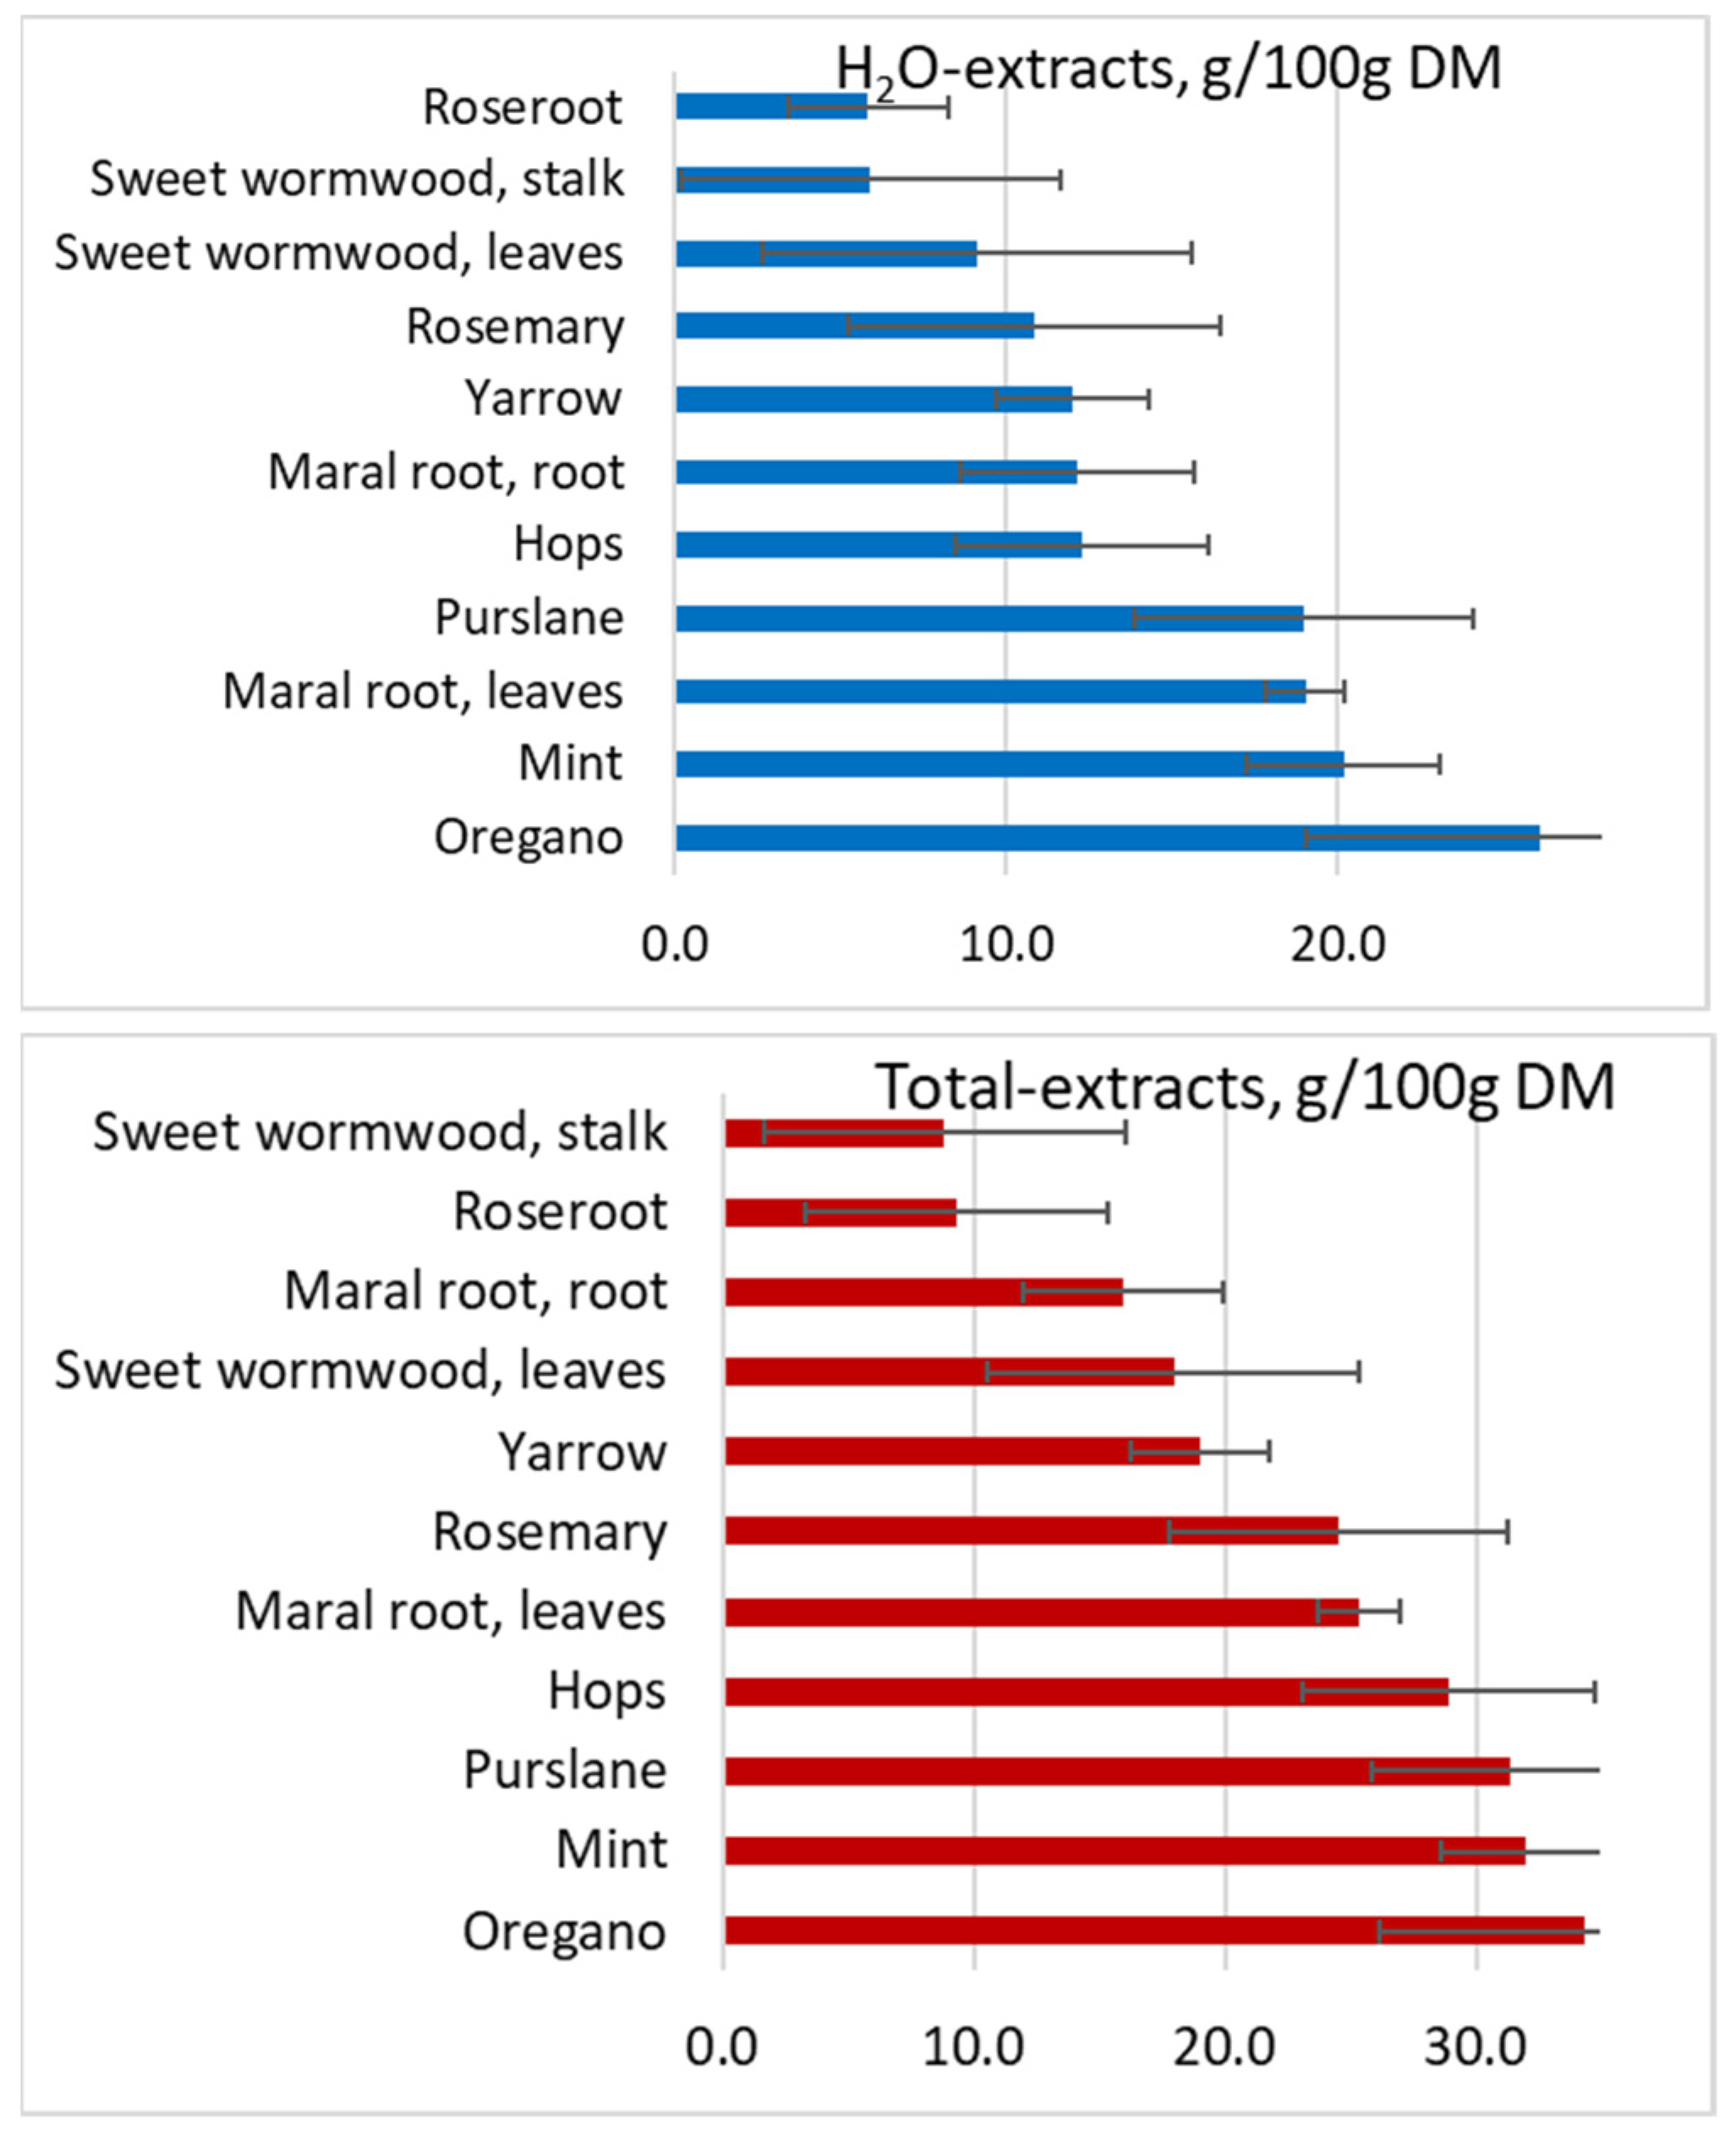
| Yields (%) | |||||
|---|---|---|---|---|---|
| n | DCM | EtOH | H2O | Total | |
| Hops (H. lupulus) | 12 | 11.6 ± 3.9 | 5.1 ± 2.1 | 12.3 ± 3.8 | 28.9 ± 4.6 |
| Maral root, leaves (L. carthamoides) | 5 | 2.9 ± 0.5 | 3.4 ± 1.0 | 19.0 ± 1.2 | 25.3 ± 0.9 |
| Maral root, root (L. carthamoides) | 5 | 1.1 ± 0.9 | 2.7 ± 1.7 | 12.1 ± 3.5 | 16.0 ± 2.3 |
| Mint (M. piperita) | 5 | 3.3 ± 0.2 | 8.5 ± 1.6 | 20.2 ± 2.9 | 32.0 ± 7.5 |
| Oregano (O. vulgare) | 30 | 2.7 ± 0.6 | 5.6 ± 4.1 | 26.1 ± 7.0 | 34.3 ± 11.5 |
| Purslane, (P. oleracea ssp. sativa) | 8 | 3.1 ± 0.7 | 9.2 ± 2.0 | 19.0 ± 5.1 | 31.3 ± 7.4 |
| Rosemary (R. officinalis) | 7 | 8.8 ± 3.4 | 4.9 ± 1.7 | 10.9 ± 5.6 | 24.5 ± 4.5 |
| Roseroot (R. rosea) | 7 | 1.3 ± 0.6 | 2.2 ± 5.5 | 5.8 ± 2.4 | 9.3 ± 3.9 |
| Sweet wormwood, leaves (A. annua) | 16 | 6.1 ± 3.3 | 2.8 ± 1.4 | 9.1 ± 6.5 | 18.0 ± 4.9 |
| Sweet wormwood, stalks (A. annua) | 16 | 1.2 ± 4.2 | 1.8 ± 1.3 | 5.9 ± 5.7 | 8.9 ± 4.6 |
| Yarrow (A. millefolium) | 10 | 3.8 ± 0.7 | 3.2 ± 1.3 | 12.0 ± 2.3 | 19.0 ± 4.4 |
| Radical Scavenging Capacities | Total Phenolics | |||||
|---|---|---|---|---|---|---|
| (µmol Trolox g−1 DM Extract) | (mg GAE g−1 DM Extract) | |||||
| n | DCM | EtOH | H2O | EtOH | H2O | |
| Hops | 4 | 922 ± 130 | 2045 ± 175 | 1157 ± 437 | 277 ± 49 | 122 ± 43 |
| Maral root, leaves | 1 | 161 ± 8 | 1070 ± 235 | 654 ± 46 | 89 ± 24 | 92 ± 4 |
| Maral root, root | 1 | 168 ± 41 | 673 ± 272 | 557 ± 35 | 61 ± 16 | 64 ± 1 |
| Mint | 5 | 306 ± 78 | 607 ± 299 | 1460 ± 462 | 90 ± 13 | 181 ± 52 |
| Oregano | 24 | 256 ± 79 | 1033 ± 420 | 2723 ± 399 | 238 ± 71 | 326 ± 75 |
| Purslane | 8 | 103 ± 56 | 487 ± 144 | 120 ± 28 | 31 ± 9 | 8 ± 4 |
| Rosemary | 7 | 945 ± 238 | 926 ± 292 | 812 ± 178 | 206 ± 114 | 124 ± 19 |
| Roseroot | 7 | 454 ± 90 | 1161 ± 318 | 1334 ± 468 | 256 ± 34 | 143 ± 45 |
| S. wormwood, leaves, June | 6 | 142 ± 32 | 399 ± 73 | 151 ± 42 | 46 ± 15 | 22 ± 7 |
| S. wormwood, leaves, September | 6 | 195 ± 51 | 1057 ± 230 | 307 ± 111 | 194 ± 64 | 61 ± 12 |
| S. wormwood, stalks, June | 6 | 206 ± 98 | 265 ± 49 | 66 ± 12 | 32 ± 15 | 11 ± 3 |
| S. wormwood, stalks, September | 6 | 571 ± 173 | 532 ± 215 | 89 ± 15 | 100 ± 26 | 22 ± 6 |
| Yarrow | 10 | 59 ± 27 | 896 ± 346 | 615 ± 107 | 117 ± 49 | 105 ± 19 |
| µmol TEAC g−1 DM Plant | |||
|---|---|---|---|
| DCM | EtOH | H2O | |
| Hops | 107 | 104 | 142 |
| Maral root, leaves | 5 | 37 | 124 |
| Maral root, root | 2 | 18 | 68 |
| Mint | 10 | 52 | 294 |
| Oregano | 7 | 57 | 710 |
| Purslane | 3 | 45 | 23 |
| Rosemary | 83 | 45 | 88 |
| Roseroot | 6 | 26 | 78 |
| S. wormwood, leaves | 12 | 29 | 28 |
| S. wormwood, stalks | 7 | 9 | 5 |
| Yarrow | 2 | 28 | 74 |
| Species | # | tR (min) | λmax (nm) | ESI-pos (m/z) | ESI-neg (m/z) | Putative Identification |
|---|---|---|---|---|---|---|
| Hops | 1 | 1.54 | 286, 324 | 163, 355 | 353 | chlorogenic acid |
| Humulus lupulus | 2 | 5.66 | 256, 265sh, 354 | 465 | 463 | quercetin 3-O-glucoside |
| 3 | 6.49 | 269, 348 | 449 | 447 | kaempferol 3-O-glucoside | |
| 4 | 14.60 | 240, 370 | 371 | 369 | xanthohumol B | |
| 5 | 15.36 | 248, 290, 366 | 341 | 339 | desmethylxanthohumol | |
| 6 | 16.97 | 244, 290sh, 370 | 299, 355 | 353 | xanthohumol C | |
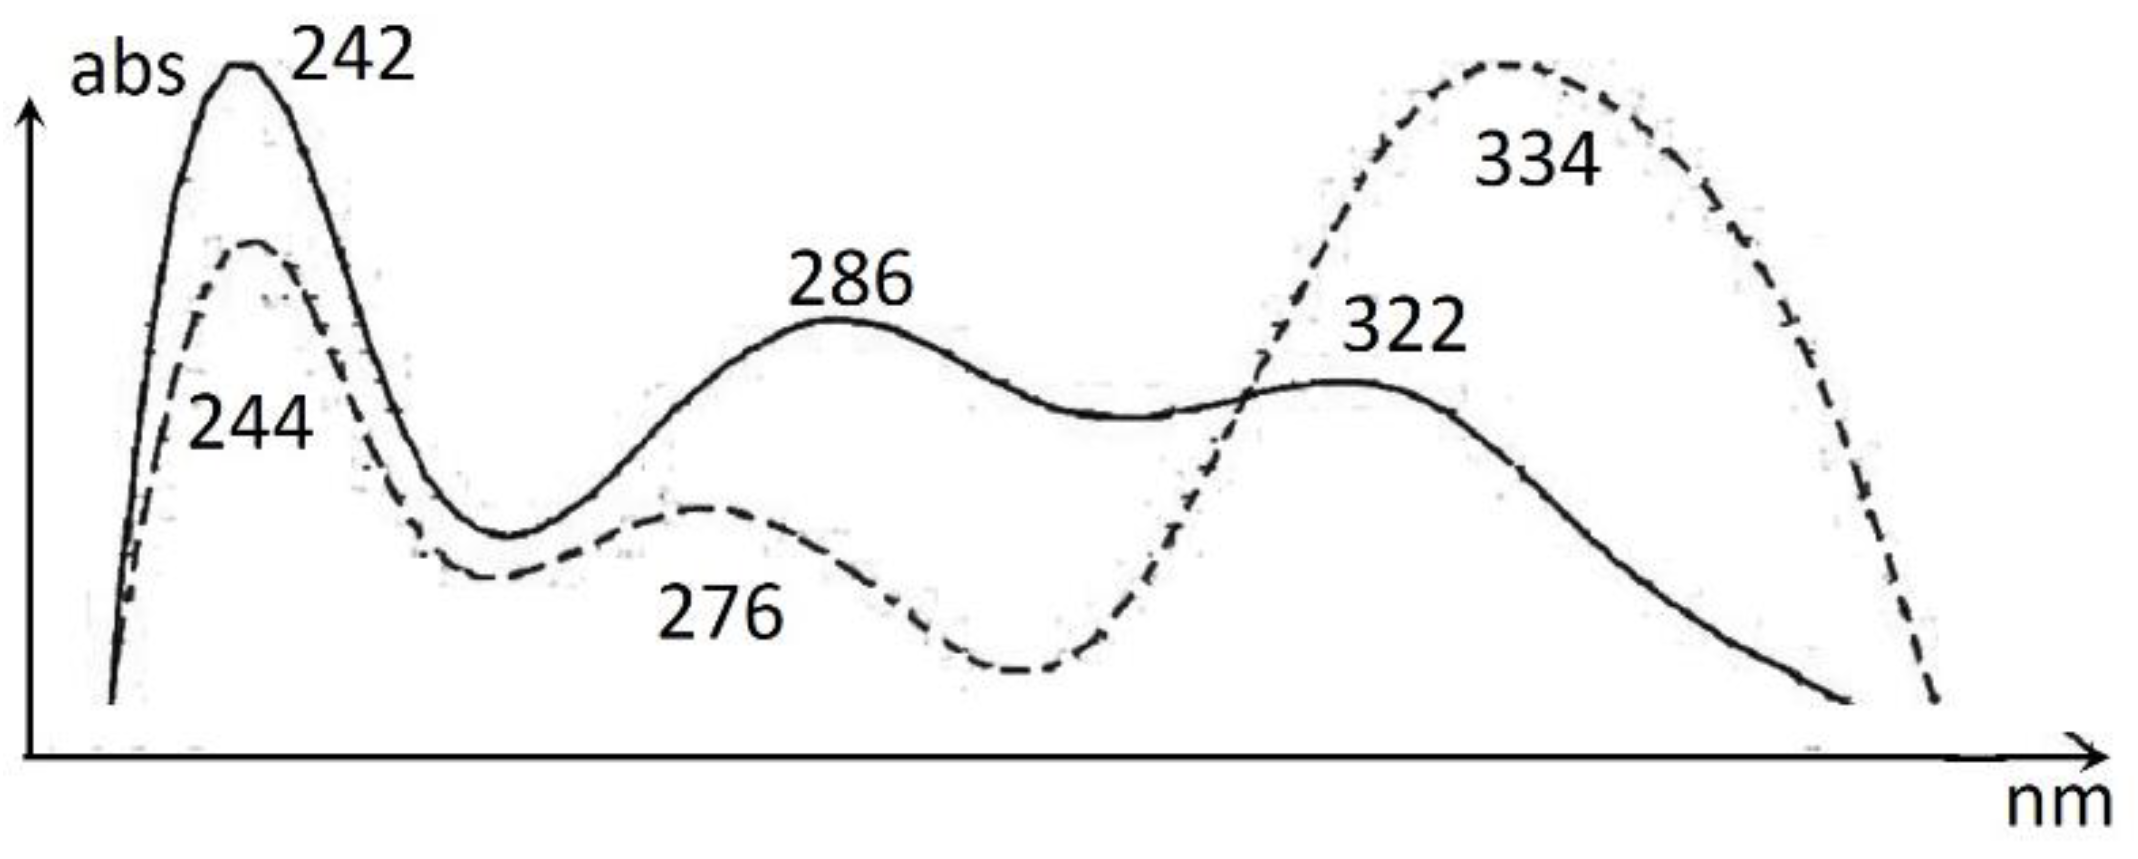
| 7 | 19.28 | 246, 284, 322, 360sh | 349 | 347 | cohumulone | |
| 8 | 20.10 | 242, 286, 322, 360sh | 363 | 361 | humulone | |
| 9 | 20.25 | 242, 290, 322, 360sh | 363 | 361 | adhumulone | |
| 10 | 22.48 | 244, 276, 334 | 401 | 399 | colupulone | |
| 11 | 23.18 | 244, 276, 334 | 415 | 413 | lupulone / adlupolone | |
| Maral root, leaves | 1 | 9.58 | 234, 300sh, 326 | 163, 355 | 353 | chlorogenic acid |
| Leuzea carthamoides | 2 | 16.47 | 238sh, 260, 270sh, 358 | 319, 481 | 479 | 6-hydroxyquercetin-O-hexoside |
| 3 | 19.63 | 236, 274, 346, 370sh | 303, 465 | 463 | 6-hydroxykaempferol-O-hexoside | |
| 4 | 20.07 | 258, 364 | 303, 495 | 493 | methoxyquercetin-hexoside | |
| 5 | 20.55 | 235sh, 258, 352 | 333, 495 | 493 | 6-methoxyquercetin-O-hexoside | |
| 6 | 23.14 | 238sh, 264, 346 | 317, 479 | 477 | 6-methoxykaempferol-O-hexoside | |
| Maral root, root | 1 | 9.55 | 234, 300sh, 326 | 163, 355 | 353 | chlorogenic acid |
| Leuzea carthamoides | 2 | 18.52 | 250, 352 | 317, 479 | 477 | isorhamnetin-O-hexoside |
| 3 | 21.14 | 234, 300sh, 326 | 163, 517 | 515 | di-caffeoyl quinic acid isomer | |
| 4 | 22.09 | 236, 300sh, 328 | 163 | di-caffeoyl quinic acid isomer | ||
| 5 | 23.75 | 236, 300sh, 326 | 163, 517 | 515 | di-caffeoyl quinic acid isomer | |
| 6 | 24.24 | 236, 300sh, 326 | 163 | 631 | caffeic acid derivative | |
| 7 | 28.60 | 236, 300sh, 326 | 163 | 793 | caffeic acid derivative | |
| Mint | 1 | 17.52 | 236, 282, 328sh | 289, 451, 597 | 595 | eriodictyol 7-O-rutinoside |
| Mentha piperita | 2 | 19.57 | 254, 266, 348 | 287, 449, 595 | 593 | luteolin 7-O-rutinoside |
| 3 | 20.15 | 254, 266, 346 | 287, 463 | 461 | luteolin 7-O-glucuronide | |
| 4 | 22.13 | 270sh, 284, 332 | 303, 465, 611 | 609 | quercetin 3-O-rutinoside | |
| 5 | 23.20 | 236, 295sh, 330 | 163, (361) | 359; 719 | rosmarinic acid | |
| Oregano | 1 | 18.05 | 264, 300sh | (123) | 153, 437, 875 | oreganol A |
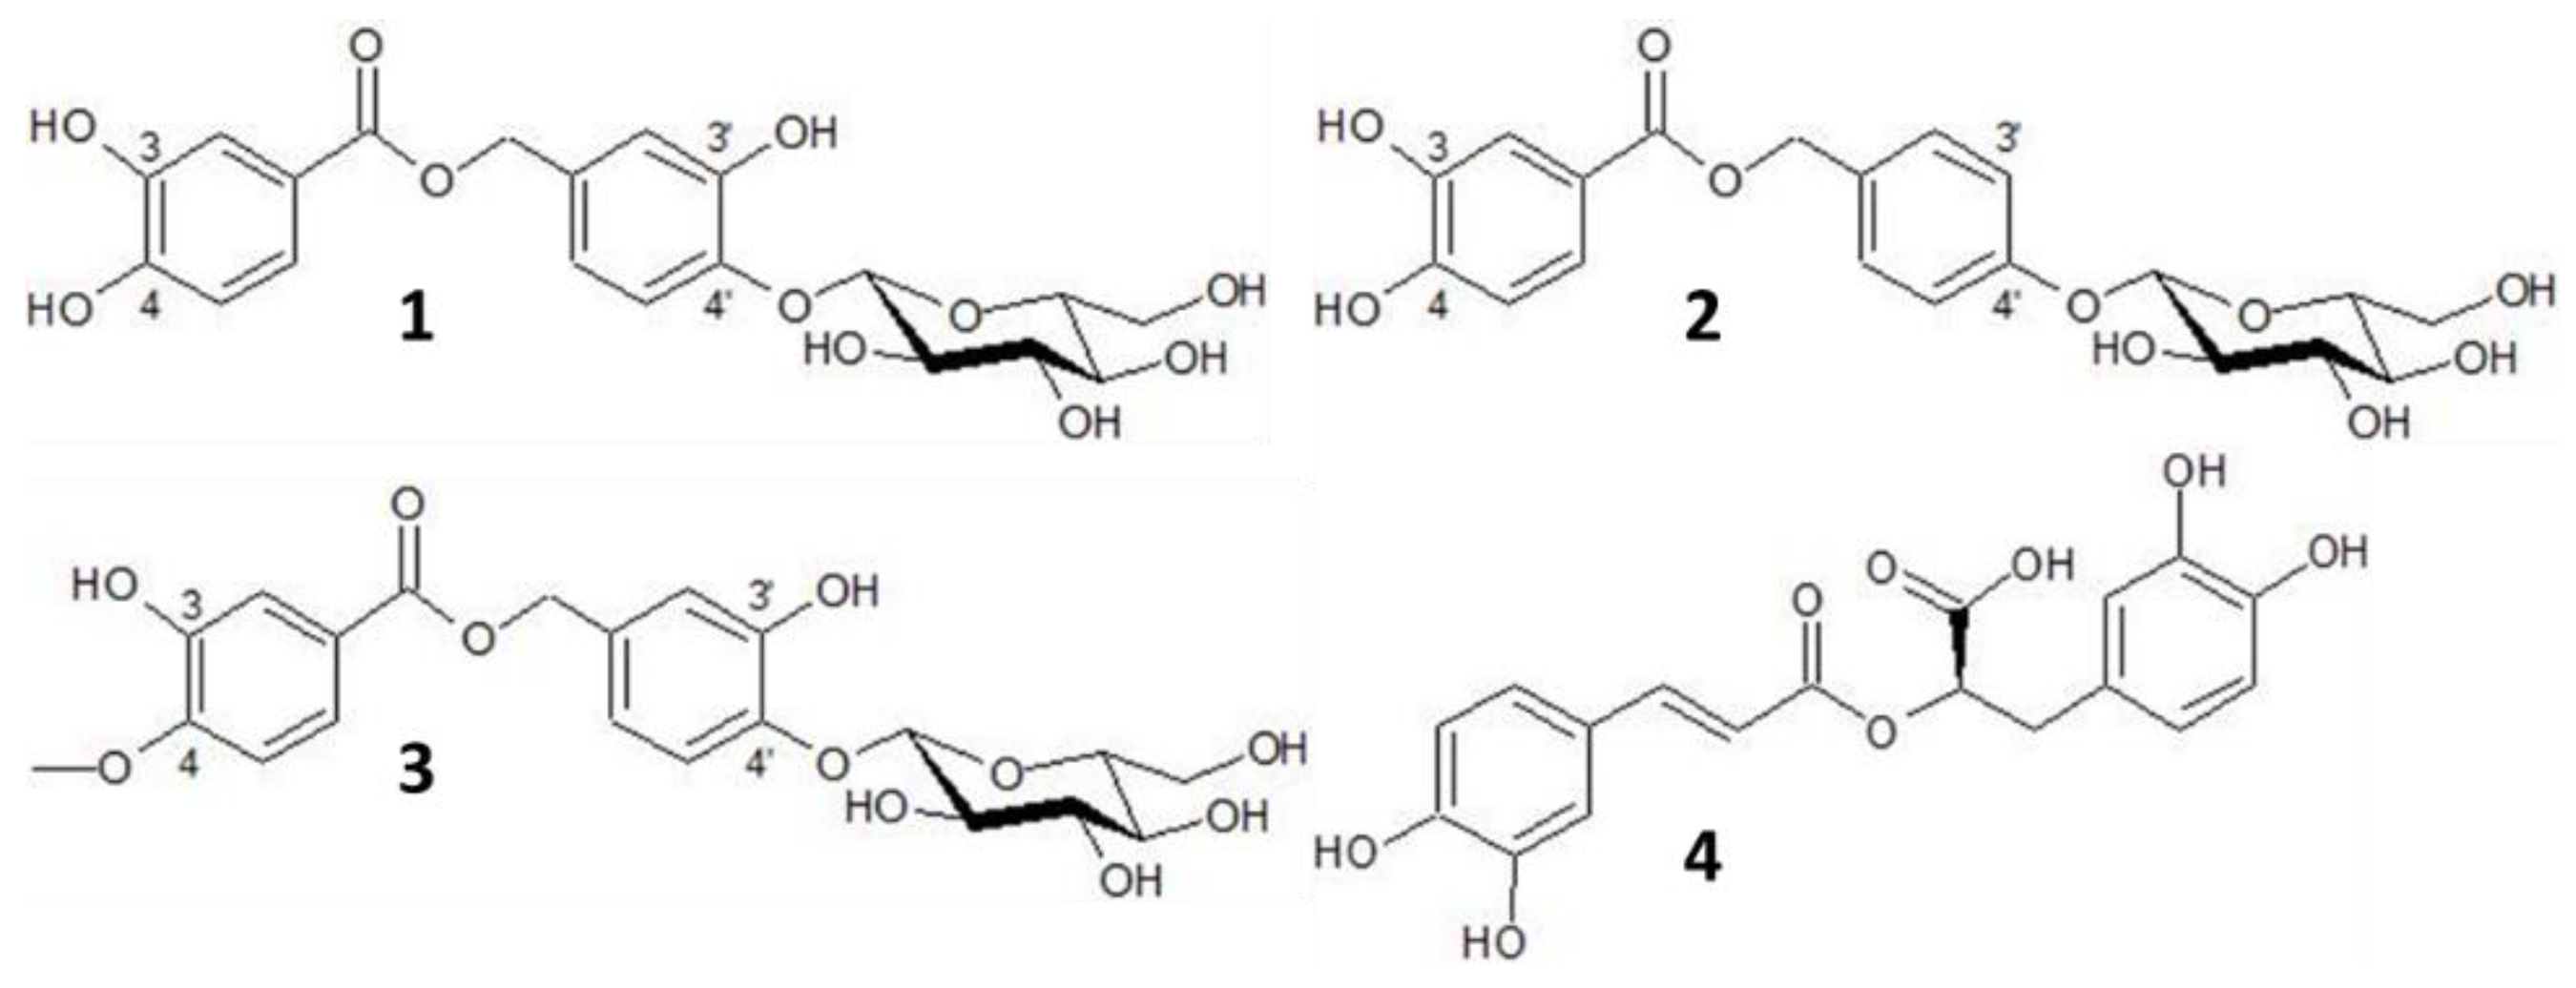
| Origanum vulgare | 2 | 21.72 | 258, 270sh | (123) | 421, 843 | 4′-O-β-d-glucopyranosyl-4′-hydroxybenzyl protocatechuate |
| 3 | 22.68 | 262, 300sh | (123) | 421, 451, 903 | oreganol B | |
| 4 | 23.25 | 290sh, 330 | (163, 361) | 359, 719 | rosmarinic acid | |
| Purslane | 1 | 15.90 | 290sh, 342 | 163, 197, 520 | 401, 518 | oleracein W |
| Portulaca oleracea | 2 | 18.57 | 300sh, 332 | 163, 183, 342, 504 | 502 | oleracein A |
| 3 | 23.15 | 266, 286, 296, 320sh | 183, 693 | 451, 691 | unknown | |
| 4 | 28.40 | 302sh, 334 | 227, 710 | 310, 708 | oleracein-derivative (FGIF) | |
| 5 | 33.08 | 300sh, 334 | 195, 275, 293, 351 | 327 | caffeic acid derivative | |
| Rosemary | 1 | 10.36 | 240, 295sh, 322 | 181 | 179 | caffeic acid |
| Rosmarinus officinalis | 2 | 20.11 | 254, 266, 338 | 183, 449 | 447 | luteolin-7-O-glucoside |
| 3 | 21.22 | 252, 272, 334 | 163, 183, 317, 479 | 477 | nepitrin | |
| 4 | 22.08 | 244, 298sh, 328 | 163, 355, 499 | 353, 515 | dicaffeoylquinic acid | |
| 5 | 23.29 | 238, 295sh, 328 | 163, 361 | 359, 719 | rosmarinic acid | |
| 6 | 30.10 | 248, 268, 340 | 317 | 315 | nepetin | |
| 7 | 34.40 | 252, 300sh, 336 | 163, 301 | 299, 313, 627 | unknown | |
| Roseroot | 1 | 16.61 | 236, 264 | 446 | 473 | rosavin (=cinnamyl-(6′-ara)-glc) |
| Rhodiola rosea | 2 | 26.23 | 236, 276, 330, 382 | 303, 449, 611 | 609, 645 | rhodiosin (=herbacetin 7-glc-rha) |
| 3 | 26.94 | 234, 276, 330, 382 | 303, 449 | 301, 447 | rhodionin (=herbacetin 7-rha) | |
| Sweet wormwood, leaves | 1 | 9.31 | 294, 330 | 163, 244, 355 | 353, 389, 399 | chlorogenic acid |
| Artemisia annua | 2 | 14.43 | 240, 300sh, 324 | 177, 369 | 367, 735 | feruloylquinic acid |
| 3 | 15.56 | 232, 296, 344 | 193, 215 | 191 | scopoletin | |
| 4 | 19.28 | 232, 276, 322 | 165 | 163 | unknown | |
| 5 | 22.15 | 242, 300sh, 328 | 163, 272, 499, 517 | 515 | dicaffeoylquinic acid | |
| 6 | 23.93 | 244, 300sh, 328 | 163, 272, 499, 517 | 515 | dicaffeoylquinic acid | |
| 7 | 35.12 | 258, 270sh, 350 | 361 | 359 | eupatin | |
| 8 | 36.70 | 256, 270sh, 348 | 375 | 373 | casticin/chrysoplenetin | |
| Sweet wormwood, stalks | 1 | 9.74 | 294, 330 | 193, 355 | 191, 353, 399 | chlorogenic acid |
| Artemisia annua | 2 | 14.57 | 240, 300sh, 324 | 177, 369 | 367, 735 | feruloylquinic acid |
| 3 | 15.70 | 234, 296sh, 344 | 193, 215 | 191 | scopoletin | |
| 4 | 22.17 | 244, 298sh, 328 | 163, 272, 499, 517 | 515 | dicaffeoylquinic acid | |
| 5 | 23.91 | 244, 300sh, 328 | 163, 272, 517 | 159, 515 | dicaffeoylquinic acid | |
| 6 | 26.38 | 242, 300sh, 326 | 163, 177, 513, 531 | 529 | caffeoyl-feruloylquinic acid | |
| Yarrow, flowers | 1 | 9.55 | 240, 300sh, 326 | 163, 355, 551 | 353, 707 | chlorogenic acid |
| Achillea millefolium | 2 | 20.07 | 254, 266sh, 348 | 287, 449 | 447 | luteolin-7-O-glucoside |
| 3 | 22.08 | 242, 300sh, 326 | 163, 517 | 515 | dicaffeoylquinic acid | |
| 4 | 22.96 | 236, 266, 334 | 271, 433 | 431 | apigenin-7-O-glucoside | |
| 5 | 23.87 | 244, 300sh, 328 | 163, 517 | 515 | dicaffeoylquinic acid | |
| 6 | 27.34 | 236, 266, 336 | 271, 519 | 269, 517 | apigenin 7-O-malonylglucoside | |
| 7 | 29.68 | 254, 266, 348 | 287 | 285 | luteolin | |
| 8 | 33.99 | 236, 266, 336 | 271 | 269 | apigenin |
| Extract | 1 | 2 | 3 | 4 | 5 | 6 | |
|---|---|---|---|---|---|---|---|
| Hops, cones | DCM | 18 ± 4.7, n = 4 | 22.3 ± 5.5, n = 4 | - | 8.5 ± 1.0, n = 4 | 8.5, n = 2 | 8.7 ± 0.6, n = 3 |
| EtOH | 8.5 ± 1.0, n = 4 | - | - | - | - | 10, n = 4 | |
| Maral root, leaves | DCM | - | 11, n = 1 | - | - | - | - |
| EtOH | 14, n = 1 | - | 8, n = 1 | - | - | - | |
| Maral root, root | DCM | - | 9.5, n = 2 | - | - | - | - |
| H2O | - | - | - | - | - | 8.5, n = 1 | |
| Oregano, leaves | EtOH | - | 8.8 ± 0.45, n = 5 | - | - | - | - |
| H2O | - | - | - | - | - | 9.2 ± 1.0, n = 13 | |
| Rosemary, leaves | DCM | 11.9 ± 0.8, n = 7 | 14.9 ± 1.4, n = 7 | 13.9 ± 1.1, n = 7 | 10.4 ± 4.4, n = 7 | 11 ± 2.0, n = 6 | 13.8 ± 2.5, n = 6 |
| EtOH | - | 10.8 ± 1.1, n = 5 | - | 8, n = 4 | - | 13 ± 1.6, n = 5 | |
| Roseroot, roots | H2O | - | - | 8, n = 5 | 9.3 ± 1.2, n = 3 | - | 9.5, n = 2 |
| Sweet wormwood, leaves June | DCM | - | 12.2 ± 2.8, n = 5 | - | - | - | - |
| EtOH | 9.3 ± 0.5, n = 4 | - | - | - | - | - | |
| Sweet wormwood, stalks June | DCM | - | - | 17.5 ± 2.6,n = 4 | 19.5 ± 1.7,n = 4 | - | - |
| Sweet wormwood, leaves September | DCM | - | 19.3 ± 1.0,n = 6 | - | - | - | - |
| Sweet wormwood, stalks September | DCM | 12.2 ± 1.0, n = 6 | 12 ± 2.0, n = 3 | 25, n = 6 | 25, n = 6 | 8, n = 5 | 9 ± 0.6, n = 6 |
| EtOH | - | - | - | 20, n = 6 | - | - | |
| Yarrow, flowers | DCM | - | 12.6 ± 3.9, n = 7 | - | - | - | - |
| EtOH | 11.7 ± 1.0, n = 10 | - | - | - | - | - |
| Species | Plant Family | Plant Parts Used in Experiment |
|---|---|---|
| Oregano (Origanum vulgare) | Lamiaceae | Leaves, harvested prior to flowering |
| Yarrow (Achillea Millefolium) | Asteraceae | Flowers |
| Peppermint (Mentha pipperita) | Lamiaceae | Leaves, harvested prior to flowering |
| Hops (Humulus lupulus) | Cannabaceae | Cones |
| Rooseroot (Rhodiola rosea) | Crassulaceae | Rhizome |
| Maral root (Leuzea carthamoides) | Asteraceae | Leaves and root |
| Sweet wormwood (Artemisia annua) | Asteraceae | Leaves (harvested prior to flowering), stalks |
| Purslane (Portulaca oleracea) | Portulacaceae | Leaves, harvested prior to flowering |
| Rosemary (Rosmarin officinales) | Lamiaceae | Leaves, harvested prior to flowering |
Publisher’s Note: MDPI stays neutral with regard to jurisdictional claims in published maps and institutional affiliations. |
© 2022 by the authors. Licensee MDPI, Basel, Switzerland. This article is an open access article distributed under the terms and conditions of the Creative Commons Attribution (CC BY) license (https://creativecommons.org/licenses/by/4.0/).
Share and Cite
Slimestad, R.; Johny, A.; Thomsen, M.G.; Karlsen, C.R.; Rosnes, J.T. Chemical Profiling and Biological Activity of Extracts from Nine Norwegian Medicinal and Aromatic Plants. Molecules 2022, 27, 7335. https://doi.org/10.3390/molecules27217335
Slimestad R, Johny A, Thomsen MG, Karlsen CR, Rosnes JT. Chemical Profiling and Biological Activity of Extracts from Nine Norwegian Medicinal and Aromatic Plants. Molecules. 2022; 27(21):7335. https://doi.org/10.3390/molecules27217335
Chicago/Turabian StyleSlimestad, Rune, Amritha Johny, Mette Goul Thomsen, Christian Renè Karlsen, and Jan Thomas Rosnes. 2022. "Chemical Profiling and Biological Activity of Extracts from Nine Norwegian Medicinal and Aromatic Plants" Molecules 27, no. 21: 7335. https://doi.org/10.3390/molecules27217335
APA StyleSlimestad, R., Johny, A., Thomsen, M. G., Karlsen, C. R., & Rosnes, J. T. (2022). Chemical Profiling and Biological Activity of Extracts from Nine Norwegian Medicinal and Aromatic Plants. Molecules, 27(21), 7335. https://doi.org/10.3390/molecules27217335