Abstract
Rice is the most important staple food crop feeding more than 50% of the world’s population. Rice blast is the most devastating fungal disease, caused by Magnaporthe oryzae (M. oryzae) which is widespread in rice growing fields causing a significant reduction in the yield. The present study was initiated to evaluate the effect of green synthesized silver nanoparticles (AgNPs) on the biochemical constituents of rice plants infected with blast. AgNPs were synthesized by using Azadirachta indica leaf extract and their characterization was performed using UV-visible spectroscopy, particle size analyser (PSA), scanning electron microscope (SEM), and X-ray diffraction (XRD) which confirmed the presence of crystalline, spherical shaped silver nanoparticles with an average size of 58.9 nm. After 45 days of sowing, artificial inoculation of rice blast disease was performed. After the onset of disease symptoms, the plants were treated with AgNPs with different concentrations. Application of nanoparticles elevated the activity of antioxidative enzymes such as superoxide dismutase, catalase, peroxidase, glutathione reductase, and phenylalanine ammonia-lyase compared to control plants, and total phenol and reducing sugars were also elevated. The outcome of this study showed that an increase in all biochemical constituents was recorded for A. indica silver nanoparticles-treated plants. The highest values were recorded in 30 ppm and 50 ppm AgNPs-treated plants, which showed the highest resistance towards the pathogen. Green synthesized AgNPs can be used in future for disease control in susceptible varieties of rice. The synthesized AgNPs using A. indica leaf extract have shown promising antibacterial activity when tested against 14 multidrug-resistant (MDR) bacteria comprising Gram-negative bacteria Escherichia coli (n = 6) and Klebsiella pneumoniae (n = 7) with a good zone of inhibition diameter, tested with the disc diffusion method. Based on these findings, it appears that A. indica AgNPs have promise as an antibacterial agent effective against MDR pathogens.
1. Introduction
The ‘green’ environment-friendly processes in agriculture and chemical technologies are becoming increasingly popular and are much needed because of worldwide problems associated with environmental concerns [1]. Silver is one of the most commercialized nanomaterials with five hundred tons of silver nanoparticles produced annually and estimated to increase in the next few years [2]. In recent years, noble metal nanoparticles have been the subject of focused research due to their unique, optical, electronic, mechanical, magnetic, and chemical properties that are significantly different from those of bulk materials [3]. Silver has been most extensively studied and used since ancient times to fight infections and prevent spoilage among the different antimicrobial agents. The antibacterial, antifungal, and antiviral properties of silver ions, silver compounds, and silver nanoparticles have been extensively studied. Silver is also found to be non-toxic to humans in minute concentrations. Microorganisms are unlikely to develop resistance against silver as compared to antibiotics as silver attacks a broad range of targets in the microbes [4]. Now, this technology is also being introduced in agriculture to control disease and pests in an effective way. Salve et al., synthesized nanoparticles using M. longifolia, evaluated for antimicrobial activity against human pathogenic microorganisms, anticancer activity, antioxidation, and anti-inflammatory activity [5]. For bovine mastitis, Taifa et al. developed a non-antibiotic, alternative, and economically viable treatment using copper nanoparticles [6].
Rice production is being continually threatened by diseases, insects, fungi, bacteria, viruses, and other stresses. Rice blast is one of the most destructive fungal diseases, which is widespread in rice-growing fields, causing a significant reduction in grain quality and yield. The blast causes huge losses ranging from 30% to 100% in all parts of the world where rice is being cultivated. Rice is a staple food for hundreds of millions of people around the world. Starvation is a very real possibility if crops fail for some reason, especially in poor and developing nations. Lesions form on the leaves, stems, peduncles, panicles, seeds, and even roots of rice plants when the fungus that causes rice blast infects them. This disease is considered to be one of the most critical plant diseases because of the severe damage it can do to crops [7]. Thus, it is paramount to find natural alternatives in the management and control of such crop diseases [8]. Azadirachta indica is a well-known pesticide and azadirachtin and salannin are the major components of neem oil with insecticidal properties. Hence, in the present study, an attempt was made to investigate the possible effects of A. indica AgNPs on plant growth and metabolism in rice crops infected with rice blast disease. Silver nanoparticles were synthesized through a green synthesis approach using A. indica leaves extract and characterized through scanning electron microscopy (SEM), particle size analyser (PSA), UV-visible spectroscope, and X-ray diffraction analyses. The study also included estimation of the biochemical parameters including total soluble sugar, total phenol contents, and the activities of antioxidant enzymes such as superoxide dismutase (SOD), catalase (CAT), peroxidase (POX), glutathione reductase (GR), and phytochemical precursor enzyme phenylalanine ammonia lyase (PAL) in AgNPs-treated plants.
2. Result and Discussion
2.1. Green Synthesis of Silver Nanoparticles from A. indica Leaf Extract
For the green synthesis of AgNPs, 2 mM of AgNO3 solution was prepared, and 10% of leaf extract was mixed in a 3:1 ratio respectively. Then the solution was kept in the dark at room temperature for about 24 h. The colour of the solution changed from brown to dark brown, which conformed to the synthesis of AgNPs.
2.2. Characterization of Green Synthesized AgNPs
The green synthesis of AgNPs using A. indica leaf extract was characterized by using various analytical techniques, such as UV-visible spectrophotometer (UV-Vis), particle size analyser (PSA), scanning electron microscope (SEM), and X-Ray diffraction. Details of the characterization AgNPs are explained in the following paragraphs.
2.2.1. UV-Visible Absorption Spectrum of Green Synthesized AgNPs
The addition of plant extract to the silver nitrate solution led to the change in colour from brown to dark brown indicating the formation of AgNPs due to the reduction of AgNO3 by the reducing agents present in the plant extract. Further confirmation of AgNP formation was obtained using a UV-visible spectrophotometer. Maximum absorbance of about 2.125 at 475 nm was observed (Figure 1).
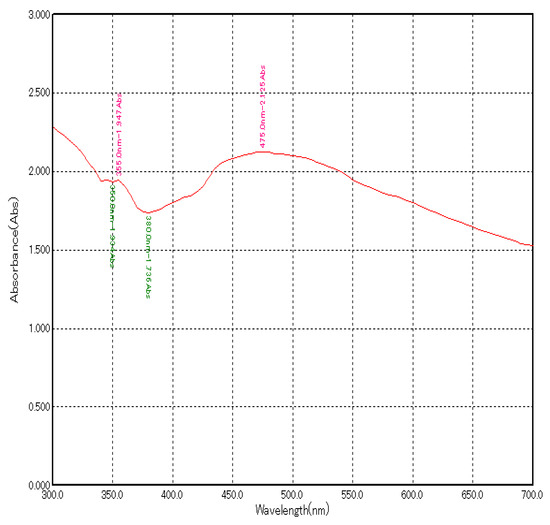
Figure 1.
UV–Visible absorption spectrum of green synthesized AgNPs using A. indica leaf extract.
2.2.2. Particle Size Distribution Study by Particle Size Analyser (PSA)
The mean diameter and particle size distribution of green silver nanoparticles synthesized using A. indica leaf extract were characterized using a particle size analyser (Nicomp NANOZ Z3000 PSS). The results of synthesized AgNPs have shown mean diameters of 80.3 nm and 58.9 nm before and after sonication, respectively, and the distribution of 90% AgNPs with a size smaller than 116.7 nm was recorded. These AgNPs were used to study the biochemical changes in rice plants infected with blast disease (Figure 2).
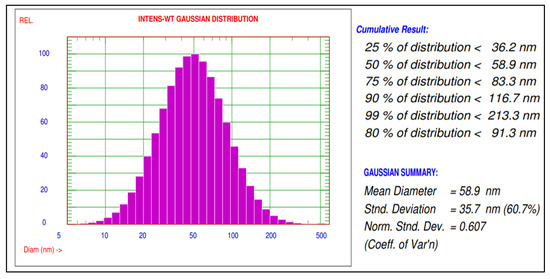
Figure 2.
Particle size distribution of green synthesized AgNPs using A. indica leaf extract.
2.2.3. SEM Micrographs of Green Synthesized AgNPs
Scanning electron microscopy imaging was carried out to view the morphology and size of the silver nanoparticles. The SEM micrograph obtained for AgNPs showed high-density nanoscale particles with crystalline and spherical shapes (Figure 3).
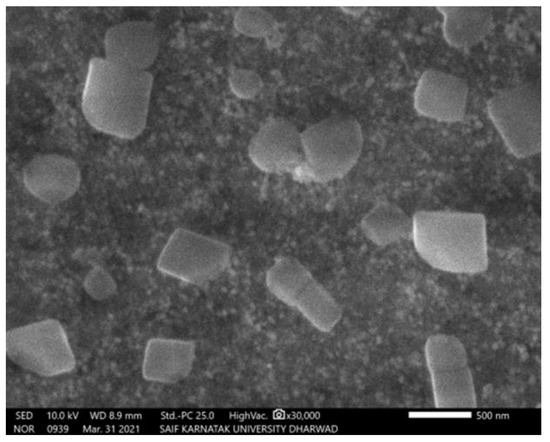
Figure 3.
SEM micrograph of green synthesized AgNPs using A. indica leaf.
2.2.4. XRD Spectrum Obtained for A. indica Leaf Extract-Mediated AgNPs
Characterization of AgNPs synthesized by using A. indica leaf extract was carried out using XRD. The results indicated the peak angle of 2θ at 32.27°, 38.13°, 44.35°, 54.85°, 57.39°, 64.49°, 76.86°, and 77.40°. The highest intensity counts were at the angle of 32.27°, followed by 64.49°, 77.40°, 44.35°, 32.27°, 76.86°, 54.85°, and 57.39° (Figure 4). When compared with JCPDS No. 87-0579 standard, the obtained XRD spectrum confirmed that the synthesized silver nanoparticles were in crystalline nature. The peaks can be assigned to the planes (122), (111), (200), (220), and (311) facets of silver crystals.
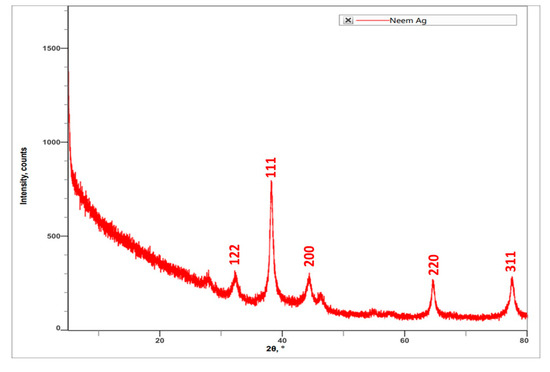
Figure 4.
XRD spectrum obtained for A. indica leaf extract-mediated synthesized AgNPs.
2.3. To Study the Impact of Silver Nanoparticles on Physiological and Biochemical Changes in Rice Infected with M. oryzae
2.3.1. Superoxide Dismutase (SOD)
The activity of Superoxide dismutase (Table 1 and Figure 5A) increased in silver nanoparticles-treated rice crops compared to that in the diseased and control groups.

Table 1.
Activity of Superoxide dismutase enzyme in different nanoparticle treatments of the rice plant infected with blast.
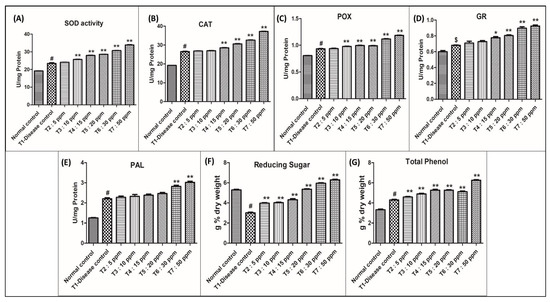
Figure 5.
Graphical presentation for the biochemical parameters analysed in the study. Control: Rice plants not infected with M. oryzae. T1–T7 Rice plants infected with M. oryzae. Data are shown as mean ± SE (n = 3) at p < 0.05. One-way ANOVA followed by Tukey’s post-hoc test to compare means. # p < 0.001, $ p < 0.05 compared to normal control group; * p < 0.01, ** p < 0.001 compared to disease control group.
When compared with control plants, superoxide dismutase activity increased by nearly 19.80% in the diseased plants (T1). All AgNPs-treated plants showed elevation in superoxide dismutase activity when compared with T1:0 ppm AgNPs. At 30 ppm: 30.69 U/mg protein (29%) and 50 ppm: 34.02 U/mg protein (43%), the nanoparticle-treated plants showed a significant elevation in enzyme activity and a reduction in disease severity. In T2, T3, T4, and T5 treatments the crop showed an elevation in enzyme activity but no significant reduction in disease severity. At 05 ppm: 1.26%, 10 ppm: 7.61%, 15 ppm: 17.11%, and 20 ppm: 20.18% elevation in enzyme activity was recorded.
2.3.2. Catalase (CAT)
The activity of catalase (Table 2 and Figure 5B) increased in silver nanoparticles-treated rice crop compared to that of diseased and control groups.
Table 2.
Activity of catalase enzyme in different nanoparticle treatments of the rice plant infected with blast.
When compared with control plants, catalase activity increased by nearly 27.90% in the diseased plants (T1). All AgNPs-treated plants showed elevation in catalase activity when compared with T1 (0 ppm AgNPs). At 30 ppm: 32.60 U/mg protein (22.42%) and 50 ppm: 37.20 U/mg protein (39.69%), the nanoparticle-treated plants showed significant elevation in enzyme activity and a reduction in disease severity. In T2, T3, T4, and T5 the crop showed elevation in enzyme activity but no significant reduction in disease severity at 05 ppm: 0.94%, 10 ppm: 1.46%, 15 ppm: 7.25%, and 20 ppm: 15.02% elevation in enzyme activity was recorded.
2.3.3. Peroxidase (POX)
The activity of peroxidase (Table 3 and Figure 5C) increased in the silver nanoparticles-treated rice crop compared to that of diseased and control groups.
Table 3.
Activity of peroxidase enzyme in different nanoparticle treatments of rice plant infected with blast.
When compared with control peroxidase activity increased by 13.93% in the diseased plants (T1). All AgNPs-treated plants showed elevation in peroxidase activity, when compared with T1 (0 ppm AgNPs). At 30 ppm: 1.11 U/mg protein (19.83%) and 50 ppm: 1.19 U/mg protein (39.69%), the nanoparticle-treated plant showed a significant elevation in enzyme activity and a reduction in disease severity. In T2, T3, T4, and T5 the crop showed an elevation in enzyme activity but no significant reduction in disease severity. At 05 ppm: 0.75%, 10 ppm: 4.93%, 15 ppm: 5.89%, 20 ppm: 6.32% elevation in enzyme activity was recorded.
2.3.4. Glutathione Reductase (GR)
The activity of glutathione reductase (Table 4 and Figure 5D) increased in the silver nanoparticles-treated rice crop compared to that of diseased and control groups.
Table 4.
Activity of glutathione reductase enzyme in different nanoparticle treatments of rice plant infected with blast.
When compared with the control, glutathione reductase activity increased by nearly 8.96% in the diseased plants (T1). All AgNPs-treated plants showed elevation in glutathione reductase activity compared with T1 (0 ppm AgNPs) at 30 ppm: 0.89 U/mg protein (28.18%) and 50 ppm: 0.92 U/mg protein (37.27), the nanoparticle-treated plant showed significant elevation in enzyme activity and a reduction in disease severity. In T2, T3, T4, and T5 the crop showed elevation in enzyme activity but no significant reduction in disease severity. At 05 ppm: 3.64%, 10 ppm: 7.27%, 15 ppm: 8.18%, 20 ppm: 11.82% elevation in enzyme activity was recorded.
2.3.5. Phenylalanine Ammonia-Lyase (PAL)
The activity of phenylalanine ammonia-lyase (Table 5 and Figure 5E) increased in silver nanoparticles-treated rice crop compared to that of diseased and control.
Table 5.
Activity of Phenylalanine ammonia-lyase enzyme in different nanoparticle treatments of the rice plant, infected with blast.
When compared with the control, phenylalanine ammonia-lyase activity increased by nearly 43.18% in the diseased plants T1. All AgNPs-treated plants showed elevation in phenylalanine ammonia-lyase activity in all different treatments. At 30 ppm: 2.82 U/mg protein (28.18%) and 50 ppm: 3.02 U/mg protein (37.27%), the nanoparticle-treated plant showed significant elevation in enzyme activity and a reduction in disease severity. In T2, T3, T4, and T5 the crop showed an elevation in enzyme activity but no significant reduction in disease severity. At 05 ppm: 3.64%, 10 ppm: 7.27%, 15 ppm: 8.81%, 20 ppm: 11.82% elevation in enzyme activity was recorded.
2.3.6. Reducing Sugar
Reducing sugar content (Table 6 and Figure 5F) in the leaves of AgNPs-treated rice infected with blast showed significant variation concerning concentration. Levels of reducing sugar in all AgNPs-treated plants were slightly increased when compared to the diseased rice plant (3.01 g% dry weight).
Table 6.
Estimation of reducing sugar in different nanoparticle treatments of rice plant infected with blast.
Among the treatments, plants treated with a higher concentration of silver nanoparticles (30 ppm: 5.35 and 50 ppm: 6.29 g% dry weight) showed a phenomenal increase in reducing sugar content compared to a low concentration (5 ppm: 3.96, 10 ppm: 4.02, 15 ppm: 4.31 and 20 ppm: 5.35 g% dry weight) and diseased (3.01 g% dry weight).
Disease-inoculated rice plant leaves recorded a reduction in reducing sugar content (3.01 g% dry weight) as compared to control leaves (5.29 g% dry weight).
2.3.7. Total Phenol
Total phenol content (Table 7 and Figure 5G) in the leaves of silver nanoparticle-treated rice infected with blast showed significant variation concerning concentration. Levels of total phenol in all nano-treated plants showed a slight increase when compared to the diseased rice plant (4.29 g% dry weight).
Table 7.
Estimation of total phenol in different nanoparticle treatments of rice plant, infected with blast.
Among the treatments, plants treated with a higher concentration of silver nanoparticles (30 ppm: 5.12, 50 ppm: 6.25 g% dry weight) showed a phenomenal increase in total phenol content compared to low concentrations (05 ppm: 4.58, 10 ppm: 4.89, 15 ppm: 5.23 and 20 ppm: 5.26 g% dry weight) and diseased T1 (4.29 g% dry weight).
Disease-inoculated rice plant leaves recorded total phenol content (3.32 g% dry weight) as compared to control leaves (4.29 g% dry weight). All the results of the biochemical analysis have been summarized in Figure 5.
2.3.8. Antibacterial Studies against MDRs
The AgNPs showed antibacterial activity against all the MDR pathogens included in this study. The results of disc diffusion assay are summarized in Table 8. The clear visible zone of inhibition exhibited by green synthesized AgNPs against the gram negative and gram positive MDR pathogens is depicted in Figure 6.
Table 8.
Diameter of zone of inhibition (mm) observed for green synthesized AgNPs against MDR pathogens.
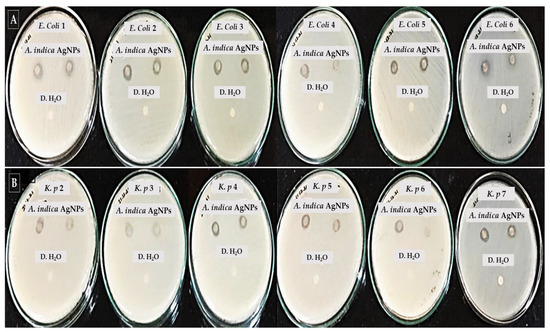
Figure 6.
Zone of inhibition produced by A. indica AgNPs against clinical MDR pathogens: (A): E. coli strains (B) K. pneumoniae (K. p) strains. The distilled water (D. H2O) served as a control and a 100 µg/mL concentration of A. indica AgNPs was used to assess the antimicrobial activity against the MDR pathogens.
Nanotechnology is an emerging field with a vast range of applications in science and technology. The phytosynthesis technique makes use of eco-friendly, non-toxic, and safe materials like bacteria, fungi, plants, and plant extracts as alternatives to chemical and physical methods [3,9]. Previous studies have shown changes in biochemical and physiological factors in plants caused by the application of AgNPs. In vitro studies have shown that silver nanoparticles have antimicrobial activity. The usage of nanoparticles in the agriculture field is limited. In this context, the present study aims to synthesize AgNPs by using the A. indica leaf extract and provide their characterization, and their effect on biochemical changes in rice plants infected with blast (M. oryzae). The results of the present study are discussed under the following headings:
2.4. Green Synthesis of AgNPs Using A. indicia and Their Characterization
The present study reveals the successful synthesis of AgNPs from the neem leaf aqueous extract and their characterization. The green synthesis of AgNPs using different plant parts has been well documented in the literature [9,10,11,12]. In this study, the A. indica leaf was selected for the synthesis of AgNPs, because the leaf extract can reduce the AgNO3 solution to AgNPs due to the amines and alkaloids present in the leaves which also act as capping agents [10].
Green synthesized AgNPs were characterized for mean size, distribution, shape, morphology, and topography. In this study, green synthesized AgNPs were initially identified by the change in colour from light brown to a blackish colour after incubation, indicating the formation of AgNPs. Previous studies have obtained similar changes from colourless to brown-grey upon the addition of plant extract to AgNO3 solution as AgNPs were formed [13,14].
Characterization of AgNPs was performed using a UV-spectrophotometer by surface plasmon resonance and it showed a peak at 475 nm with an absorbance of 2.125. In various studies, peaks between 450–500 nm confirmed of synthesis of AgNPs [15,16,17].
A particle size analyzer (PSA) indicated a mean diameter of 58.9 nm and size distribution of AgNPs about 90% of is less than 116.7 nm size. Mohammad et al. and Prabha et al. [9,17] also observed a mean diameter of AgNPs of about 11.4 and 110.8 nm as results in their studies.
SEM and XRD results confirmed the presence of silver nanoparticles. SEM micrographs showed the spherical shape of AgNPs and the presence of silver nanoparticles in crystalline structure through the XRD spectrum [18]. SEM micrographs revealed that phytosynthesised AgNPs using Catharanthus roseus leaf extract were bunch form in shape.
2.5. To Study the Impact of AgNPs on Physiological and Biochemical Changes in Rice Infected with M. oryzae
2.5.1. Superoxide Dismutase (SOD)
SOD catalyses the dismutation of superoxide radicals to hydrogen peroxide and oxygen and constitutes the most important enzyme in cellular defence because its activation directly modulates the amount of O2 and H2O2 [19]. SOD activity may reduce the risk of O2-radical formation. SODs are a group of metal-containing enzymes classified into three types according to their metal co-factor requirements viz., iron SOD (Fe-SOD) localized in the chloroplast, copper-zinc SOD (Cu/Zn-SOD) localized in the chloroplast, cytosol and the extracellular space and manganese SOD (Mn-SOD) is found mainly in mitochondria and peroxisomes [20].
In this study, biochemical changes in AgNPs-treated rice plants infected with blast disease were studied. The rice plant showed increased activity of SOD in all AgNPs-treated plants when compared with the control plants. As per the results obtained (Table 1), all the silver nanoparticle-treated rice plants showed an elevation in SOD. But only 30 ppm and 50 ppm silver nanoparticle-treated plants showed a reduction in blast disease severity along with an elevation in SOD activity.
Similar results were observed by Krishnaraj et al. (2012) [21] who studied the effect of AgNP application on B. monnieri biochemical activity. In their study, plants showed an elevation in SOD activity at 100 ppm AgNPs treatment. Similar results were obtained by Upadhyaya et al. (2017) [22] in their studies of zinc nanoparticles’ effect on rice seedlings.
2.5.2. Catalase (CAT)
The plant possesses several antioxidant enzymes that eliminate (ROS) reactive oxygen species. Catalase (CAT) enzymes have a defensive role against ROS. It is responsible for the removal of toxic H2O2 in the cells, thereby protecting the cells from getting damaged. Up to a certain level, ROS production under stress may work as a signal for triggering defence responses via transduction pathways [23,24]. A high amount of ROS production in the cell causes cell death.
In this study, biochemical changes in AgNPs-treated rice infected with blast disease were analysed. The rice plants showed elevation in the catalase activity in all AgNPs-treated plants when compared with the control. As per the results obtained (Table 2), all the AgNPs-treated rice crops showed elevation in catalase, but crops treated with a higher concentration of AgNPs (30 ppm and 50 ppm) showed a highly significant reduction in blast disease severity along with elevated CAT activity.
Similar results were obtained by Guptha et al., 2018 [25] in their study on rice seedlings where they reported an increase in CAT activity with an increase in the concentration of AgNPs treatment.
2.5.3. Peroxidase (POX)
POX is a heme-containing protein that preferably oxidizes aromatic electron donors such as guaiacol and pyrogallol at the expense of H2O2. POX catalyses the conversion of cinnamyl alcohol to lignin by oxidative polymerization [26]. Vascular plants possess several gene-encoding numbers of POXs, and there might be some distinct physiological functions for each class in protecting the cell membrane against oxidative damage [27].
In the present study, biochemical changes in AgNPs-treated rice plants infected with blast disease were studied. The rice plant showed elevation in the peroxidase activity in all AgNPs-treated plants compared with the control. As per the results obtained (Table 3), all the AgNPs-treated rice plants showed elevation in peroxidase, but at the concentration of 30 ppm and 50 ppm, showed a reduction in blast severity along with highly significant elevation in peroxidase activity. The present study indicates more resistance towards disease at 30 and 50 ppm AgNPs, but all treatments showed elevation in all plant biochemical constituents.
The current study results were in line with an earlier study [25], where the POX activity increased with the increase in the concentration of AgNPs applied to on rice. Some studies reported that POX showed antifungal activity against a variety of fungal species, including Mycophaerella arachidicola, Trichosporium vesiculosum, Coprinus comatus, Macrophomina phaseolina, Fusariumexo sporium, and Botrytis cenere [28,29]. Elevation of POX activity along with an increase in the concentration of AgNPs in tomato plants was also reported by Noori et al. (2020) [30].
2.5.4. Glutathione Reductase
Another important pathway involved in the control of ROS levels in the plant tissue is the glutathione/ascorbate cycle in which glutathione reductase (GR) plays a major role [31]. GR is a flavoprotein oxidoreductase that catalyses the reduction of glutathione disulphide (GSSG) to the sulphydryl form GSH. This enzyme employs NADPH as a reductant.
As per our results (Table 4), all AgNPs-treated rice plants showed elevation in GR activity, and a reduction in disease severity was observed only in 30 and 50 ppm AgNPs-treated plants. The rice plants showed elevation in the GR activity in all AgNPs-treated conditions when compared with the control condition.
In another study, a similar elevation in GR activity was observed in rice seedlings [25], where the activity increased with the increase in AgNPs concentration. A similar elevation in GR content was observed [32] in the study on silver nanoparticle-induced morphological, physiological, and biochemical changes in the wheat plant. Elevation in all antioxidative enzymes and phenol content was recorded.
2.5.5. Phenylalanine Ammonia-Lyase
Phenylalanine ammonia-lyase is the key enzyme in the plant phenylpropanoid pathway catalysing the synthesis of secondary metabolites from L-phenylalanine including lignin, flavonoid, and phytoalexins. PAL enzyme catalyses the nonoxidative deamination of L-phenylalanine to form trans-cinnamic acid and a free ammonium ion. The conversion of the amino acid phenylalanine to trans-cinnamic acid is the entry step for the channelling of carbon from primary metabolism into phenylpropanoid secondary metabolism in plants.
As per the results obtained (Table 5) among all the treatments T6: 30 ppm and T7: 50 ppm recorded the highest PAL activity. Whereas the lowest PAL activity was observed in the control rice plant. Blast-infected plants also showed a small elevation compared to the control plant in PAL activity. In the present study, biochemical changes in AgNPs-treated rice infected with blast disease were analysed.
As per the results obtained (Table 5) all the AgNPs-treated rice plants showed elevation in PAL activity. At T6: 30 ppm and T7: 50 ppm AgNPs-treated rice plants showed a reduction in blast severity and elevation in PAL activity. The present study indicates that the crop showed more resistance towards disease at T6: 30 ppm and T7: 50 ppm AgNPs treatments. Similar results have been reported in earlier studies in different plants [33,34].
2.5.6. Reducing Sugars
Sugars constitute the primary metabolite providing energy to the system and structural material for defence responses in plants, and act as signal molecules interacting with the plant immune system. Sugars cause oxidative burst at the early stages of any pathogen or pest infection, increasing the lignification of cell walls, stimulating the synthesis of flavonoids, and inducing certain pathogenesis-related proteins. Some sugars act as priming agents inducing higher plant resistance to pathogens, as reported [35].
In this study, the response of AgNPs applied to rice plants infected with blast was studied to correlate the role of reducing sugar content upon blast infection and NP application. As per the results obtained (Table 6), the control plant recorded the highest reducing sugar content, and the lowest reducing sugar content was observed in the blast-infected plant i.e., T1: 0 ppm AgNPs. Blast induced a decrease in sugar content. All other treatments showed elevation in reducing sugar content after the application of AgNPs.
Krishnaraj et al. (2012) [21] studied biologically synthesized AgNPs which exerted a slight stress on the growth and metabolism of B. monnieri. They also observed elevation in total sugar content after 5 mg/L concentration of AgNPs application.
2.5.7. Total Phenol
Phenols play an important role in the plant defence system against insects, plant pathogens, and cyclic reduction of ROS such as superoxide anion and hydroxide radicals, H2O2, and singlet oxygen [36]. Phenols inhibit disease development through different mechanisms, such as inhibition of extracellular fungal enzymes (cellulase, pectinase, laccase, and xylanase), fungal oxidative phosphorylation, nutrition deprivation, and antioxidant activity in the plant tissue [37,38].
In this study, as per the results obtained (Table 7) among control and infected rice plants, the control plants showed a low amount of total phenol content. AgNPs-treated rice plants showed elevation in total phenol content relative to the concentration of AgNPs applied.
Similar results were reported earlier [21], where the total phenol increased in Baco pamonnieri plant on the application of AgNPs.
3. Materials and Methods
3.1. Experimental Treatment Details
The different experimental groups used in the present study are shown in Table 9.
Table 9.
Details of the treatment groups used in the study.
3.2. Green Synthesis and Characterization of AgNPs Using A. indica Leaf Extract
Fresh leaves of A. indicia were collected and were thoroughly washed several times with tap water followed by distilled water to remove the dust particles and air-dried at room temperature for three days.
3.3. Preparation of the A. indica Aqueous Leaf Extract
The aqueous leaf extract was prepared following the protocol described by Shukla et al., 2009, with minor modifications [10]. Ten grams of fresh leaves were ground using a pestle and mortar in 100 mL of distilled water (10% aqueous plant extract), filtered through Whatman filter paper No. 1, and the filtrate was stored in a refrigerator at 4 °C until further use.
3.4. Preparation of AgNO3 Solution
Silver nitrate was procured from the Sisco Research Laboratories Pvt. Ltd. (SRL, Mumbai, India). An amount of 2 mM silver nitrate solution was used for the synthesis of AgNPs.
3.5. Green Synthesis of AgNPs Using A. indica Aqueous Leaf Extract
AgNO3 was used as a precursor for the green synthesis of AgNPs, and the leaf extract served as both a reducing and a capping agent. As mentioned by Roy et al. (2017), 10 mL of leaf extract and 30 mL of AgNO3 (2 mM) were thoroughly combined and kept for reaction in the dark for approximately 24 h [39,40,41].
3.6. Characterization of Green Synthesized AgNPs
The synthesized nanoparticles were characterized in terms of shape, size, and morphology using a UV-Visible spectrophotometer (UV-Vis), PSA, SEM, and XRD. ELICO UV1900 Double Beam Spectro-photometer with wavelength scan in the range of 190 nm to 1100 nm and bandwidth of 2 nm was used to analyse the spectra of AgNPs. Between 200 and 700 nm in wavelength, green AgNPs were scanned. A PSA (Particle Size Analyzer) was used to characterize green synthesized AgNPs in terms of mean diameter and distribution (Nicomp, Nicomp NANOZ Z3000 PSS USA). SEM (Scanning Electron Microscopy-Carl Zeiss-EVO-18-UK) was employed to analyse the topology of AgNPs. The structural properties of green synthesized AgNPs were evaluated using an X-ray diffractometer (Powder) (Model: SmartLab SE) with fully automated alignment controlled by a computer, SAXS capabilities, and an optional D/teXUltra high-speed, position-sensitive detector system with 2D: 2° to 150°.
3.7. Plant Sample
Rice (Oryza sativa L.) INTAN variety (blast-susceptible) was chosen to study the biochemical response of antioxidant enzymes. Rice was evaluated by pot culture experiments in a polyhouse. Forty-five days after sowing, the artificial inoculation of M. oryzae pure culture was performed by spraying to ensure the maximum disease pressure. After the onset of disease symptoms, the AgNP treatment was given as per the treatment details; then, leaf samples were collected after 72 h of treatment for determining the reducing sugar, total phenol, and antioxidant enzyme activities such as superoxide dismutase (SOD), catalase (CAT), glutathione reductase (GR), peroxidase (POX), and phenylalanine ammonia-lyase (PAL).
3.8. Extraction of Enzyme and Determination of Protein Content
Fresh leaf tissues after collection were processed immediately for enzyme extraction between 0 °C and 4 °C and used for the assay. In order to measure the enzyme activities, 0.5 g of leaf tissues were taken and ground into a fine powder with liquid nitrogen, and extracted with 2 mL of 0.05 M sodium phosphate buffer of pH 7.8 and pH 7.0 for SOD and CAT, respectively. POX was extracted in 0.1 M potassium phosphate buffer (pH 7.0). Grinding buffer for GR included 0.1 M Tris–HCl pH 7.8 and 2 mM dithiothreitol (DTT). PAL was extracted in 0.1 M Tris buffer (pH 8.5). Then, the homogenate was centrifuged at 14,000 rpm for 20 min at 4 °C and the supernatant was used as an enzyme source for assay. Protein content was estimated using Lowry’s method.
3.9. Biochemical Assays
Antioxidant enzyme assays including superoxide dismutase, catalase, peroxidase, glutathione reductase, phenylalanine ammonia-lyase, and estimation of reducing sugar and total phenols were carried out using standard biochemical procedures [42,43,44,45,46,47,48,49,50].
3.9.1. Superoxide Dismutase Activity
The activity of SOD (EC 1.15.1.1) was determined photochemically at 560 nm by the method of Beauchamp and Fridovich. An amount of 3 mL of reaction mixture contained 20 μL of SOD enzyme extract, p-nitrobluetetrazolium chloride (NBT (33 μM), L-methionine (10 mM), EDTA (0.66 μM)) in a 50 mM potassium phosphate buffer, pH 7.8 and riboflavin (3.3 μM). The reaction was initiated by adding riboflavin in a glass tube illuminated by a 15 W fluorescent lamp for 20 min at 25 °C. The increase in optical density of the blue formazan product formed by NBT photoreduction was recorded at 560 nm. A blank was used with all the above constituents but kept in the dark. One unit of SOD activity is defined as the amount of enzyme required to inhibit 50% of photo-reduction of NBT per minute, and specific activity is expressed as IUmg−1 protein.
3.9.2. Catalase Activity
Catalase (EC 1.11.1.6) activity was determined by the Beers and Sizers spectrophotometric method. The assay mixture comprised 2.98 mL of 16.65 mM hydrogen peroxide in 50 mM phosphate buffer, pH 7.0 and 20 μL of enzyme source was used to start the reaction. The decrease in optical density at 240 nm was recorded for 5 min against the substrate blank. One unit of catalase is defined as the amount of enzyme that transforms one μmole of hydrogen peroxide per minute at pH 7.0 at 25 °C, and specific activity was expressed as μmol min−1 mg−1 protein.
3.9.3. Peroxidase Activity
Peroxidase (EC 1.11.1.7) activity was spectrophotometrically assayed by the method of Chance and Maehly. The assay was initiated by the addition of 20 μL of the enzyme preparation to a reaction mixture comprising 2.88 mL of 100 mM potassium phosphate buffer, pH 7.0, 50 μL of 20 mM guaiacol, and 50 μL of 0.042% H2O2, and increase in optical density at 436 nm was monitored for 5 min. One POX unit is defined as the amount of enzyme which catalyses the production of one µmole of oxidized guaiacol per minute at 25 °C, and specific activity is expressed as μmole min−1 mg−1 protein.
3.9.4. Glutathione Reductase Activity
Glutathione reductase (EC 1.8.1.7) activity was assayed by the spectrophotometric method of Mavis and Stellwagen [46]. The assay mixture comprised 100 μL of 30 mM oxidized glutathione (GSSG), 1.5 mL of 0.1 M potassium phosphate buffer with 0.0034 M EDTA, pH 7.6, 0.35 mL of 0.8 mM reduced ß-nicotinamide adenine dinucleotide phosphate (NADPH) and 0.95 mL of water. The decrease in optical density at 340 nm on the addition of 100 μL of the enzyme to the reaction mixture was recorded for 5 min. One GR unit is defined as the amount of enzyme required to oxidise 1.0 micromole of NADPH per minute at pH 7.6 and 25 °C, and specific activity is represented as a micromole per min per mg protein.
3.9.5. Phenylalanine Ammonia Lyase Activity
Phenylalanine ammonia-lyase activity (EC.4.3.1.5.) was spectrophotometrically determined by the method of Paltonen and Karjalainen. The reaction mixture contained 50 μL of enzyme preparation and 2.5 mL of 0.2% L-phenylalanine in 0.1 M Tris buffer (pH 8.5) which was incubated for 1 h at 40 °C. The reaction was terminated by the addition of 0.5 mL of 0.2 M HCl, and the optical density was measured at 290 nm using substrate blank. One unit of PAL is defined as the amount of enzyme that forms 1 μmol of trans-cinnamate per minute from L-Phenylalanine, and the specific activity of PAL was expressed as μmol/min/mg protein.
3.9.6. Estimation of Total Phenols
One gram of powdered, dried leaf tissue was extracted with10 mL of hot 80% ethyl alcohol [49]. The colorimetric method of Bray and Thorpe was employed for the estimation of total phenols [50]. The total phenol content was represented as mg per gram dry weight.
3.9.7. Estimation of Reducing Sugars
One gram of powdered, dried leaf material was introduced in hot 80% ethyl alcohol for 15 min and then homogenized using a pestle and mortar. The obtained homogenate was filtered, and the leaf tissue was re-extracted two or three times. The filtrate was made up to a final volume of 10 mL with 80% ethanol. Reducing sugars were estimated by Nelson’s modification of Somogi’s method [47]. The reducing sugars were represented as mg per gram dry weight.
3.10. Bacterial Strains Used in This Study
We used 14 multi-drug resistant (MDR) bacteria comprising Gram-negative bacteria-Escherichia coli (n = 6) and Klebsiella pneumoniae (n = 7). These clinical strains were phenotypically and genotypically characterized in our previous study and found to possess a wide spectrum of beta-lactamase genes conferring antibiotic resistance [51,52]. ATCC 25922 E. coli was used as a quality control strain.
3.11. In Vitro Antibiotic Susceptibility Test of Green Synthesized AgNPs against MDR Bacteria
Disc Diffusion Method
The antibacterial activity of green synthesized AgNPs against the selected MDR bacterial (n = 13) strains was carried out using the Kirby–Bauer Disc Diffusion method [53]. The bacterial strains were grown until attaining the McFarland standard of O.D: 0.5. The inoculum was spread in Muller Hinton Agar (MHA) (Himedia, India) using sterile cotton swabs, and a sterile antimicrobial susceptibility disk was loaded on the plates with 10 μL of green synthesized AgNPs. The distilled water served as a control, and 100 µg/mL concentration of A. indica AgNPs was used to assess the antimicrobial activity against the MDR pathogens. The plates were incubated at 37 °C for 48 h and zone of inhibition was recorded.
3.12. Statistical Analysis
The data of the experiment will be analysed statistically by the following procedure described by Gomez and Gomez [54]. Data were analysed using GraphPad Prism version 6 (San Diego, CA, USA). The results are expressed as mean ± SD. The differences between various groups were calculated using a one-way analysis of variance (ANOVA) followed by the post-Tukey’s test. A p-value less than 0.05 was considered to be significant.
4. Conclusions
AgNPs synthesis was mediated by A. indica leaves extract and characterized using SEM, particle size analyser, UV-visible spectroscope, and X-ray diffraction analyses. The outcome of this study showed that an increase in all biochemical constituents such as reducing sugar, total phenol contents, and activities of antioxidant enzymes such as SOD, CAT, POX, GR, and phytochemical precursor enzyme PAL was observed in AgNPs-treated plants. The higher values were recorded in 30 ppm and 50 ppm AgNPs-treated plants and showed the highest resistance towards the pathogen. Green synthesized AgNPs can be used in future for disease control in susceptible varieties of rice and have shown promising antibacterial activity against hospital-borne MDR pathogenic strains of concern.
Author Contributions
Conceptualization, O.A., K.K.M., A.K.K.R. and S.M.; methodology, M.H.M., S.S.M. and H.N.; software, U.M.M.; validation, A.A.K., I.A.S. and P.R.S.; formal analysis, S.M.; investigation, K.K.M., A.K.K.R. and S.M.; resources, I.A.S. and M.H.M.; data curation, A.A.K.; writing—original draft preparation, S.S.M. and H.N.; writing—review and editing, I.A.S. and A.A.K.; supervision, S.S.M.; project administration, A.A.K., I.A.S. and P.R.S.; funding acquisition, O.A. All authors have read and agreed to the published version of the manuscript.
Funding
The authors are thankful to the Deanship of Scientific Research, Najran University, Najran, Saudi Arabia, for funding this research through grant research code NU/NRP/MRC/11/4.
Institutional Review Board Statement
Not applicable.
Informed Consent Statement
Not applicable.
Data Availability Statement
All the data has been presented in this article.
Acknowledgments
The authors are thankful to Najran University, Najran, KSA, UAS Dharwad, and Dayanand Sagar University, Bangalore India, for supporting the steps of this work.
Conflicts of Interest
The authors declare no conflict of interest.
Sample Availability
Samples of the compounds will be available from the authors.
References
- Thuesombat, P.; Hannongbua, S.; Akasit, S.; Chadchawan, S. Ecotoxicology and Environmental Safety Effect of Silver Nanoparticles on Rice (Oryza sativa L. Cv. KDML 105) Seed Germination and Seedling Growth. Ecotoxicol. Environ. Safety 2014, 104, 302–309. [Google Scholar] [CrossRef] [PubMed]
- Larue, C.; Castillo-Michel, H.; Sobanska, S.; Cécillon, L.; Bureau, S.; Barthès, V.; Ouerdane, L.; Carrière, M.; Sarret, G. Foliar exposure of the crop Lactuca sativa to silver nanoparticles: Evidence for internalization and changes in Ag speciation. J. Hazard. Mater. 2014, 264, 98–106. [Google Scholar] [CrossRef] [PubMed]
- Kuchekar, S.R.; Patil, M.P.; Gaikwad, V.B.; Han, S.H. Synthesis and Characterization of Silver Nanoparticles Using Azadirachtaindica (Neem) Leaf Extract. Int. J. Eng. 2017, 6, 47–55. [Google Scholar]
- Veerasamy, R.; Xin, T.Z.; Gunasagaran, S.; Xiang, T.F.W.; Yang, E.F.C.; Jeyakumar, N.; Dhanaraj, S.A. Biosynthesis of silver nanoparticles using mangosteen leaf extract and evaluation of their antimicrobial activities. J. Saudi Chem. Soc. 2011, 15, 113–120. [Google Scholar] [CrossRef]
- Salve, P.; Vinchurkar, A.; Raut, R.; Chondekar, R.; Lakkakula, J.; Roy, A.; Hossain, J.; Alghamdi, S.; Almehmadi, M.; Abdulaziz, O.; et al. An Evaluation of Antimicrobial, Anticancer, Anti-Inflammatory and Antioxidant Activities of Silver Nanoparticles Synthesized from Leaf Extract of Madhuca longifolia Utilizing Quantitative and Qualitative Methods. Molecules 2022, 27, 6404. [Google Scholar] [CrossRef] [PubMed]
- Taifa, S.; Muhee, A.; Bhat, R.A.; Nabi, S.U.; Roy, A.; Rather, G.A. Mallick Evaluation of Therapeutic Efficacy of Copper Nanoparticles in Staphylococcus aureus-Induced Rat Mastitis Model. J. Nanomater. 2022, 2022, 7124114. [Google Scholar] [CrossRef]
- Kanmani, N. Biosynthesis of Silver Nanoparticles and Their Evaluation of Antifungal Activity against Magnaporthe oryzae. J. Pharmacogn. Phytochem. 2018, 7, 1638–1648. [Google Scholar]
- Barage, S.; Lakkakula, J.; Sharma, A.; Roy, A.; Alghamdi, S.; Almehmadi, M.; Hossain, J.; Allahyani, M.; Abdulaziz, O. Nanomaterial in Food Packaging: A Comprehensive Review. J. Nanomater. 2022, 2022, 6053922. [Google Scholar] [CrossRef]
- Muhammad, D.R.A.; Gonzalez, C.G.; Doost, A.S.; Van de Walle, D.; Van der Meeren, P.; Dewettinck, K. Improvement of Antioxidant Activity and Physical Stability of Chocolate Beverage Using Colloidal Cinnamon Nanoparticles. Food Bioprocess Technol. 2019, 12, 976–989. [Google Scholar] [CrossRef]
- Shukla, V.K.; Pandey, S.; Pandey, A.C. Green Synthesis of Silver Nanoparticles Using Neem Leaf (Azadirachta indica) Extract. Int. Conf. Adv. Nanomater. Nanotechnol. 2009, 1276, 43–49. [Google Scholar] [CrossRef]
- Elumalai, E.K.; Prasad, T.N.V.K.V.; Venkata, K.; Nagajyothi, P.C.; David, E. Green Synthesis of Silver Nanoparticle Using Euphorbia Hirta L and Their Antifungal Activities. Arch. Appl. Sci. Res. 2010, 2, 76–81. [Google Scholar]
- Mahakham, W.; Sarmah, A.K.; Maensiri, S.; Theerakulpisut, P. Nanopriming technology for enhancing germination and starch metabolism of aged rice seeds using phytosynthesized silver nanoparticles. Sci. Rep. 2017, 7, 8263. [Google Scholar] [CrossRef] [PubMed]
- Ghozali, S.Z.; Vuanghao, L.; Ahmad, N.H. Biosynthesis and Characterization of Silver Nanoparticles Using Catharanthus roseus Leaf Extract and Its Proliferative Effects on Cancer Cell Lines. J. Nanomed. Nanotechnol. 2015, 6, 4–11. [Google Scholar]
- Bhusnure, O.G.; Kuthar, V.S.; Gholve, S.B.; Giram, P.S.; Shembekar, V.S.; Zingade, S.G.; Jadhav, P.P. Green Synthesis of Silver Nanoparticle Using Catharanthus roseus Extract for Pharmacological Activity. Int. J. Pharma Pharm. Res. 2017, 10, 77–88. [Google Scholar]
- Dubey, S.P.; Lahtinen, M.; Sillanpää, M. Tansy fruit mediated greener synthesis of silver and gold nanoparticles. Process Biochem. 2010, 45, 1065–1071. [Google Scholar] [CrossRef]
- Jagtap, U.; Bapat, V.A. Green Synthesis of Silver Nanoparticles Using Artocarpus heterophyllus Lam. Seed Extract and Its Antibacterial Activity. Ind. Crops Prod. 2013, 46, 132–137. [Google Scholar] [CrossRef]
- Prabha, S.; Durgalakshmi, D.; Subramani, K.; Aruna, P.; Ganesan, S. Enhanced Emission of Zinc Nitride Colloidal Nanoparticles with Organic Dyes for Optical Sensors and Imaging Application. ACS Appl. Mater. Interfaces 2020, 12, 19245–19257. [Google Scholar] [CrossRef]
- Kora, A.J.; Arunachalam, J. Biosynthesis of Silver Nanoparticles by the Seed Extract of Strychnos potatorum: A Natural Phytocoagulant. IET Nanobiotechnol. 2013, 7, 83–89. [Google Scholar] [CrossRef]
- Foyer, C.; Noctor, G. Oxidant and Antioxidant Signaling in Plants, a Reevaluation of the Concept of Oxidative Stress in a Physiological Context. Plant Cell Environ. 2005, 28, 1056–1071. [Google Scholar] [CrossRef]
- Alscher, R.G.; Erturk, N.; Heath, L.S. Role of superoxide dismutases (SODs) in controlling oxidative stress in plants. J. Exp. Bot. 2002, 53, 1331–1341. [Google Scholar] [CrossRef]
- Krishnaraj, C.; Jagan, E.G.; Ramachandran, R.; Abirami, S.M.; Mohan, N.; Kalaichelvan, P.T. Effect of Biologically Synthesized Silver Nanoparticles on Bacopa monnieri (Linn.) Wettst. Plant Growth Metabolism. Process Biochem. 2012, 47, 651–658. [Google Scholar] [CrossRef]
- Upadhyaya, H.; Begum, L.; Dey, B.; Nath, P.K.; Panda, S.K. Impact of Calcium Phosphate Nanoparticles on Rice Plant. J. Plant Sci. Phytopathol. 2017, 1, 001–010. [Google Scholar] [CrossRef]
- Cruz, C.M.H. Drought Stress and Reactive Oxygen Species: Production, Scavenging and Signaling. Plant Signal. Behav. 2008, 3, 156–165. [Google Scholar] [CrossRef] [PubMed]
- Miller, A.; Frey, G.; King, G.; Sunderman, C. A Handheld Electrostatic Precipitator for Sampling Airborne Particles and Nanoparticles. Aerosol Sci. Technol. 2010, 44, 417–427. [Google Scholar] [CrossRef]
- Gupta, S.D.; Agarwal, A.; Pradhan, S. Phytostimulatory effect of silver nanoparticles (AgNPs) on rice seedling growth: An insight from antioxidative enzyme activities and gene expression patterns. Ecotoxicol. Environ. Saf. 2018, 161, 624–633. [Google Scholar] [CrossRef] [PubMed]
- Lamport, D.T.A. Roles of Peroxidases in Cell Wall Genesis. In Molecular and Physiological Aspects of Plant Peroxidases; Greppin, H., Penel, C., Gasper, T., Eds.; University of Geneva Press: Geneva, Switzerland, 1986. [Google Scholar]
- Lüthje, S.; Meisrimler, C.-N.; Hopff, D.; Möller, B. Phylogeny, topology, structure and functions of membrane-bound class III peroxidases in vascular plants. Phytochemistry 2011, 72, 1124–1135. [Google Scholar] [CrossRef]
- Ye, X.; Ng, T. Isolation of a novel peroxidase from French bean legumes and first demonstration of antifungal activity of a non-milk peroxidase. Life Sci. 2002, 71, 1667–1680. [Google Scholar] [CrossRef]
- Ghosh, M. Antifungal Properties of Haem Peroxidase from Acorus calamus. Ann. Bot. 2006, 98, 1145–1153. [Google Scholar] [CrossRef]
- Noori, A.; Donnelly, T.; Colbert, J.; Cai, W.; Newman, L.A.; White, J.C. Exposure of Tomato (Lycopersicon esculentum) to Silver Nanoparticles and Silver Nitrate: Physiological and Molecular Response. Int. J. Phytoremediat. 2020, 22, 40–51. [Google Scholar] [CrossRef]
- Shigeoka, S.; Ishikawa, T.; Tamoi, M.; Miyagawa, Y.; Takeda, T.; Smith, L.M.; Boyko, E. Differtial Expression of Gene in Wheat Triticuma sevum controlled Resistance to the Russian Wheat Aphid, Diuaphis, Noxia (Mordviller). IOBC WPrS Bull. 2005, 28, 11–20. [Google Scholar]
- Yanik, F.; Vardar, F. Assessment of Silver Nanoparticle-Induced Morphological, Biochemical and Physiological Alterations in Wheat Roots. Ann. Bot. 2019, 9, 83–94. [Google Scholar]
- Lawton, M.A.; Lamb, C.L. Transcriptional Activation of Plant Defense Gene by Fungus Elicitor, Wonding, and Infection. Mol. Cell Bio. 1987, 7, 335–341. [Google Scholar]
- Dixon, R.A.; Dey, P.M.; Lamb, C.J. Phytoalexins: Enzymology and Molecular Biology. Adv. Enzymol. Relat. Areas Mol. Biol. 1983, 55, 1–136. [Google Scholar] [CrossRef]
- Morkunas, I.; Ratajczak, L. The Role of Suger signalling in Plant Defence Response against Fungal Pathogen. Acta Physiol. Plant 2014, 36, 1607–1619. [Google Scholar] [CrossRef]
- Maffei, M.E.; Mithöfer, A.; Boland, W. Insects feeding on plants: Rapid signals and responses preceding the induction of phytochemical release. Phytochemistry 2007, 68, 2946–2959. [Google Scholar] [CrossRef] [PubMed]
- MacRae, W.; Towers, G. Biological activities of lignans. Phytochemistry 1984, 23, 1207–1220. [Google Scholar] [CrossRef]
- Scalbert, A. Antimicrobial properties of tannins. Phytochemistry 1991, 30, 3875–3883. [Google Scholar] [CrossRef]
- Ahmed, T.; Shahid, M.; Noman, M.; Niazi, M.B.K.; Mahmood, F.; Manzoor, I.; Zhang, Y.; Li, B.; Yang, Y.; Yan, C.; et al. Silver Nanoparticles Synthesized by Using Bacillus cereus SZT1 Ameliorated the Damage of Bacterial Leaf Blight Pathogen in Rice. Pathogens 2020, 9, 160. [Google Scholar] [CrossRef]
- Roseline, T.A.; Sudhakar, M.P.; Kulanthaiyesu, A. Synthesis of Silver Nanoparticle Composites Using Calliblepharis fimbriata Aqueous Extract, Phytochemical Stimulation, and Controlling Bacterial Blight Disease in Rice. ACS Agric. Sci. Technol. 2021, 1, 702–718. [Google Scholar] [CrossRef]
- Roy, P.; Das, B.; Mohanthy, A.; Mohapatra, S. Green Synthesis of Silver Nanoparticles Using Azadirachta indica leaf Extract and Its Antimicrobial Study. Appl. Nanosci. 2017, 7, 843–850. [Google Scholar] [CrossRef]
- Tantray, J.A.; Mansoor, S.; Wani, R.F.C.; Nissa, N.U. Protein Estimation by Lowry’s Method. In Basic Life Science Methods; Elsevier: Amsterdam, The Netherlands, 2022; pp. 65–67. [Google Scholar]
- Peltonen, S.; Karjalainen, R. Phenylalanine Ammonia Lyase Activity in Barlay after Infection with BipolarisSorokiniana or Treatment with Its Purified Baralay. J. Phytopathol. 1995, 143, 239–245. [Google Scholar] [CrossRef]
- Beauchamp, C.; Fridovich, I. Superoxide dismutase: Improved assays and an assay applicable to acrylamide gels. Anal. Biochem. 1971, 44, 276–287. [Google Scholar] [CrossRef]
- Beers, R.F.; Sizer, I.W. A Spectrophotometric Method for Measuring the Breakdown of Hydrogen Peroxide by Catalase. J. Biol. Chem. 1952, 195, 133–140. [Google Scholar] [CrossRef]
- Mavis, R.D.; Stellwagen, E. The Role of Cations in Yeast Phosphofructokinase Catalysis. J. Biol. Chem. 1970, 245, 674–680. [Google Scholar] [CrossRef]
- Nelson, N. A photometric adaptation of the Somogyi method for the determination of glucose. J. Biol. Chem. 1944, 153, 375–380. [Google Scholar] [CrossRef]
- Folin, O.; Wu, H. A Revised Colorimetric Method for Determination of Uric Acid in Urine. J. Biol. Chem. 1919, 38, 459–460. [Google Scholar] [CrossRef]
- Ganesan, D.; Al-Sayed, E.; Albert, A.; Paul, E.; Singab, A.N.B.; Sadasivam, S.G.; Saso, L. Antioxidant activity of phenolic compounds from extracts of Eucalyptus globulus and Melaleuca styphelioides and their protective role on D-glucose-induced hyperglycemic stress and oxalate stress in NRK-49Fcells. Nat. Prod. Res. 2018, 32, 1274–1280. [Google Scholar] [CrossRef]
- Bray, H.G.; Thorpe, W.V. Analysis of Phenolic Compounds of Interest in Metabolism. Methods Biochem. Anal. 1954, 1, 27–52. [Google Scholar] [CrossRef]
- Mitra, S.D.; Sebastian, S.C.; Rekha, I.; Irshad, P.; Mudigonda, A.; Suresh, J.; Choudhary, S.; Tewari, R.; Ganaie, F.; Shome, B.R. Molecular detection of the New Delhi metallo-β-lactamase clinical variant with double mutation- V88L and M154L in Escherichia coli isolates from South India. Gene Rep. 2020, 21, 100880. [Google Scholar] [CrossRef]
- Tewari, R.; Ganaie, F.; Venugopal, N.; Mitra, S.; Shome, R.; Shome, B.R. Occurrence and characterization of genetic determinants of β-lactam-resistance in Escherichia coli clinical isolates. Infect. Genet. Evol. 2022, 100, 105257. [Google Scholar] [CrossRef]
- Bauer, M.A.W.; Kirby, M.W.M.M.; Sherris, M.J.C.; Turck, M.M. Antibiotic Susceptibility Testing by a Standardized Single Disk Method. Am. J. Clin. Pathol. 1966, 45, 493–496. [Google Scholar] [CrossRef] [PubMed]
- Gomez, K.A.; Gomez, A.A. Statistical Procedures for Agricultural Research, 2nd ed.; John Wiley & Sons: Nashville, TN, USA, 1984; ISBN 9780471870920. [Google Scholar]


Publisher’s Note: MDPI stays neutral with regard to jurisdictional claims in published maps and institutional affiliations. |
© 2022 by the authors. Licensee MDPI, Basel, Switzerland. This article is an open access article distributed under the terms and conditions of the Creative Commons Attribution (CC BY) license (https://creativecommons.org/licenses/by/4.0/).