


Photons for Photography: A First Diagnostic Approach to Polaroid Emulsion Transfer on Paper in Paolo Gioli’s Artworks


 , ,
, ,  ,
, 

Abstract
1. Introduction
2. Results and Discussion
2.1. Mock-Up
2.1.1. FORS
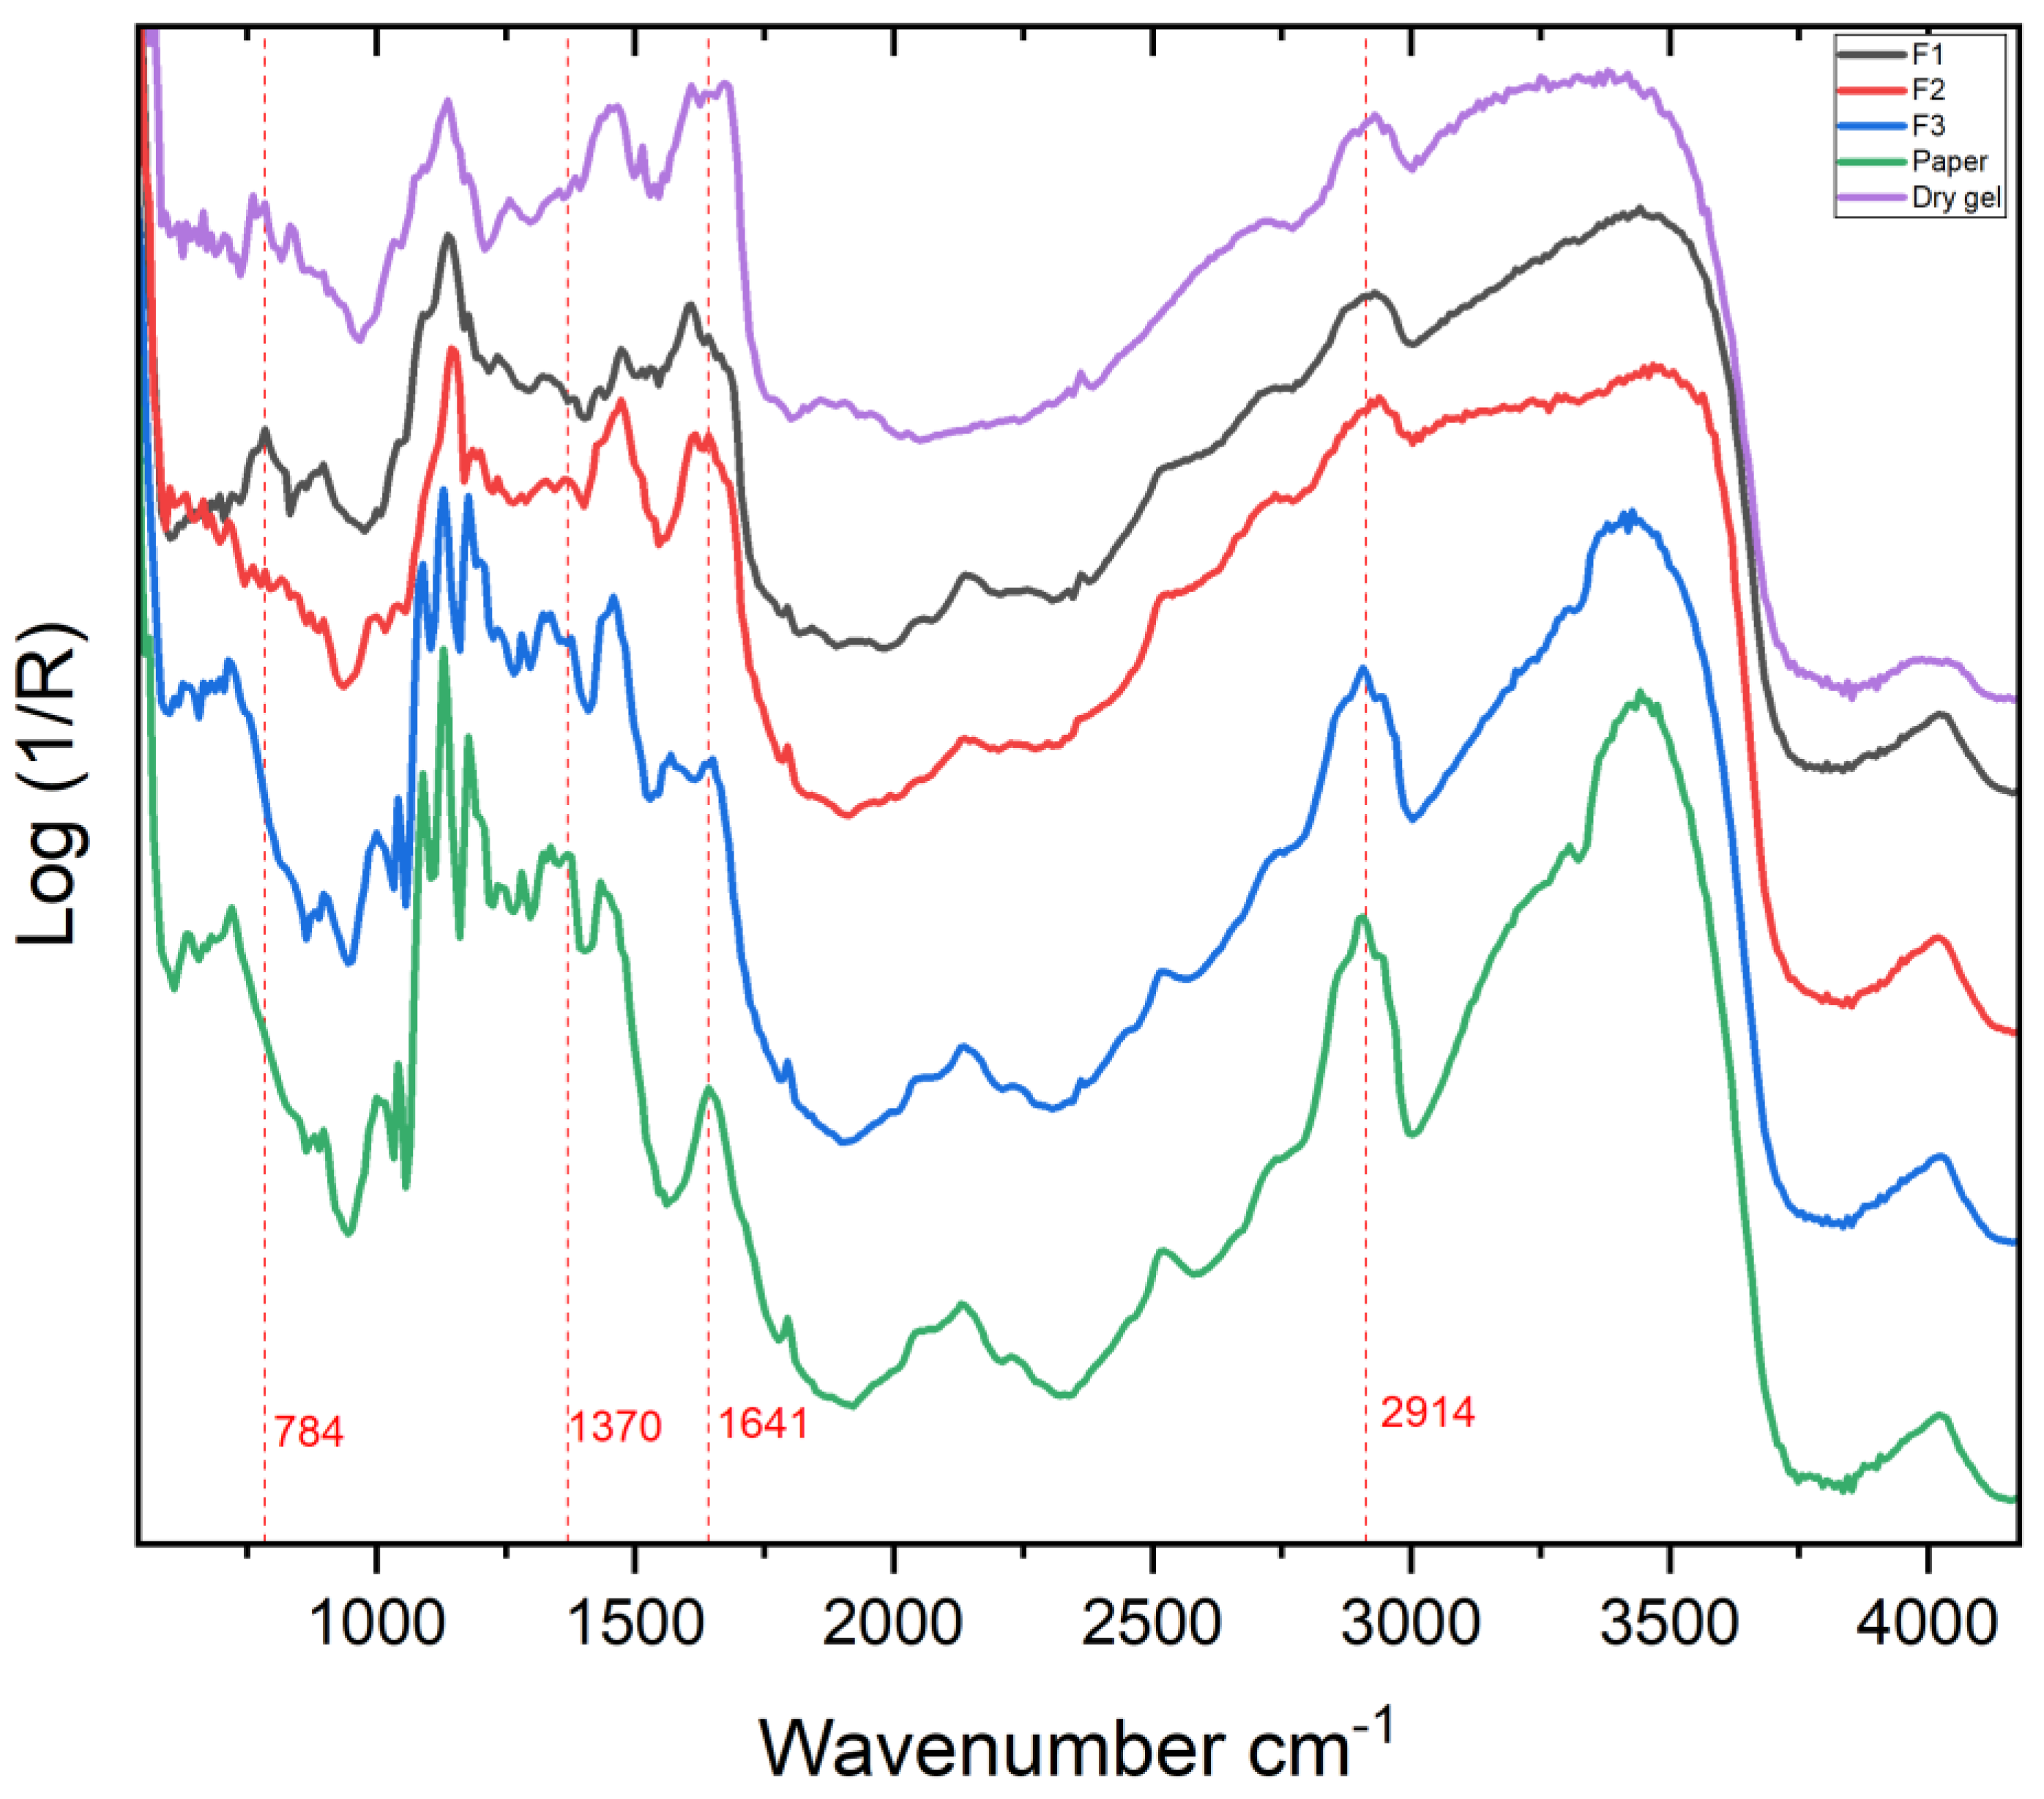
2.1.2. FTIR
2.2. Paolo Gioli’s Original Artwork
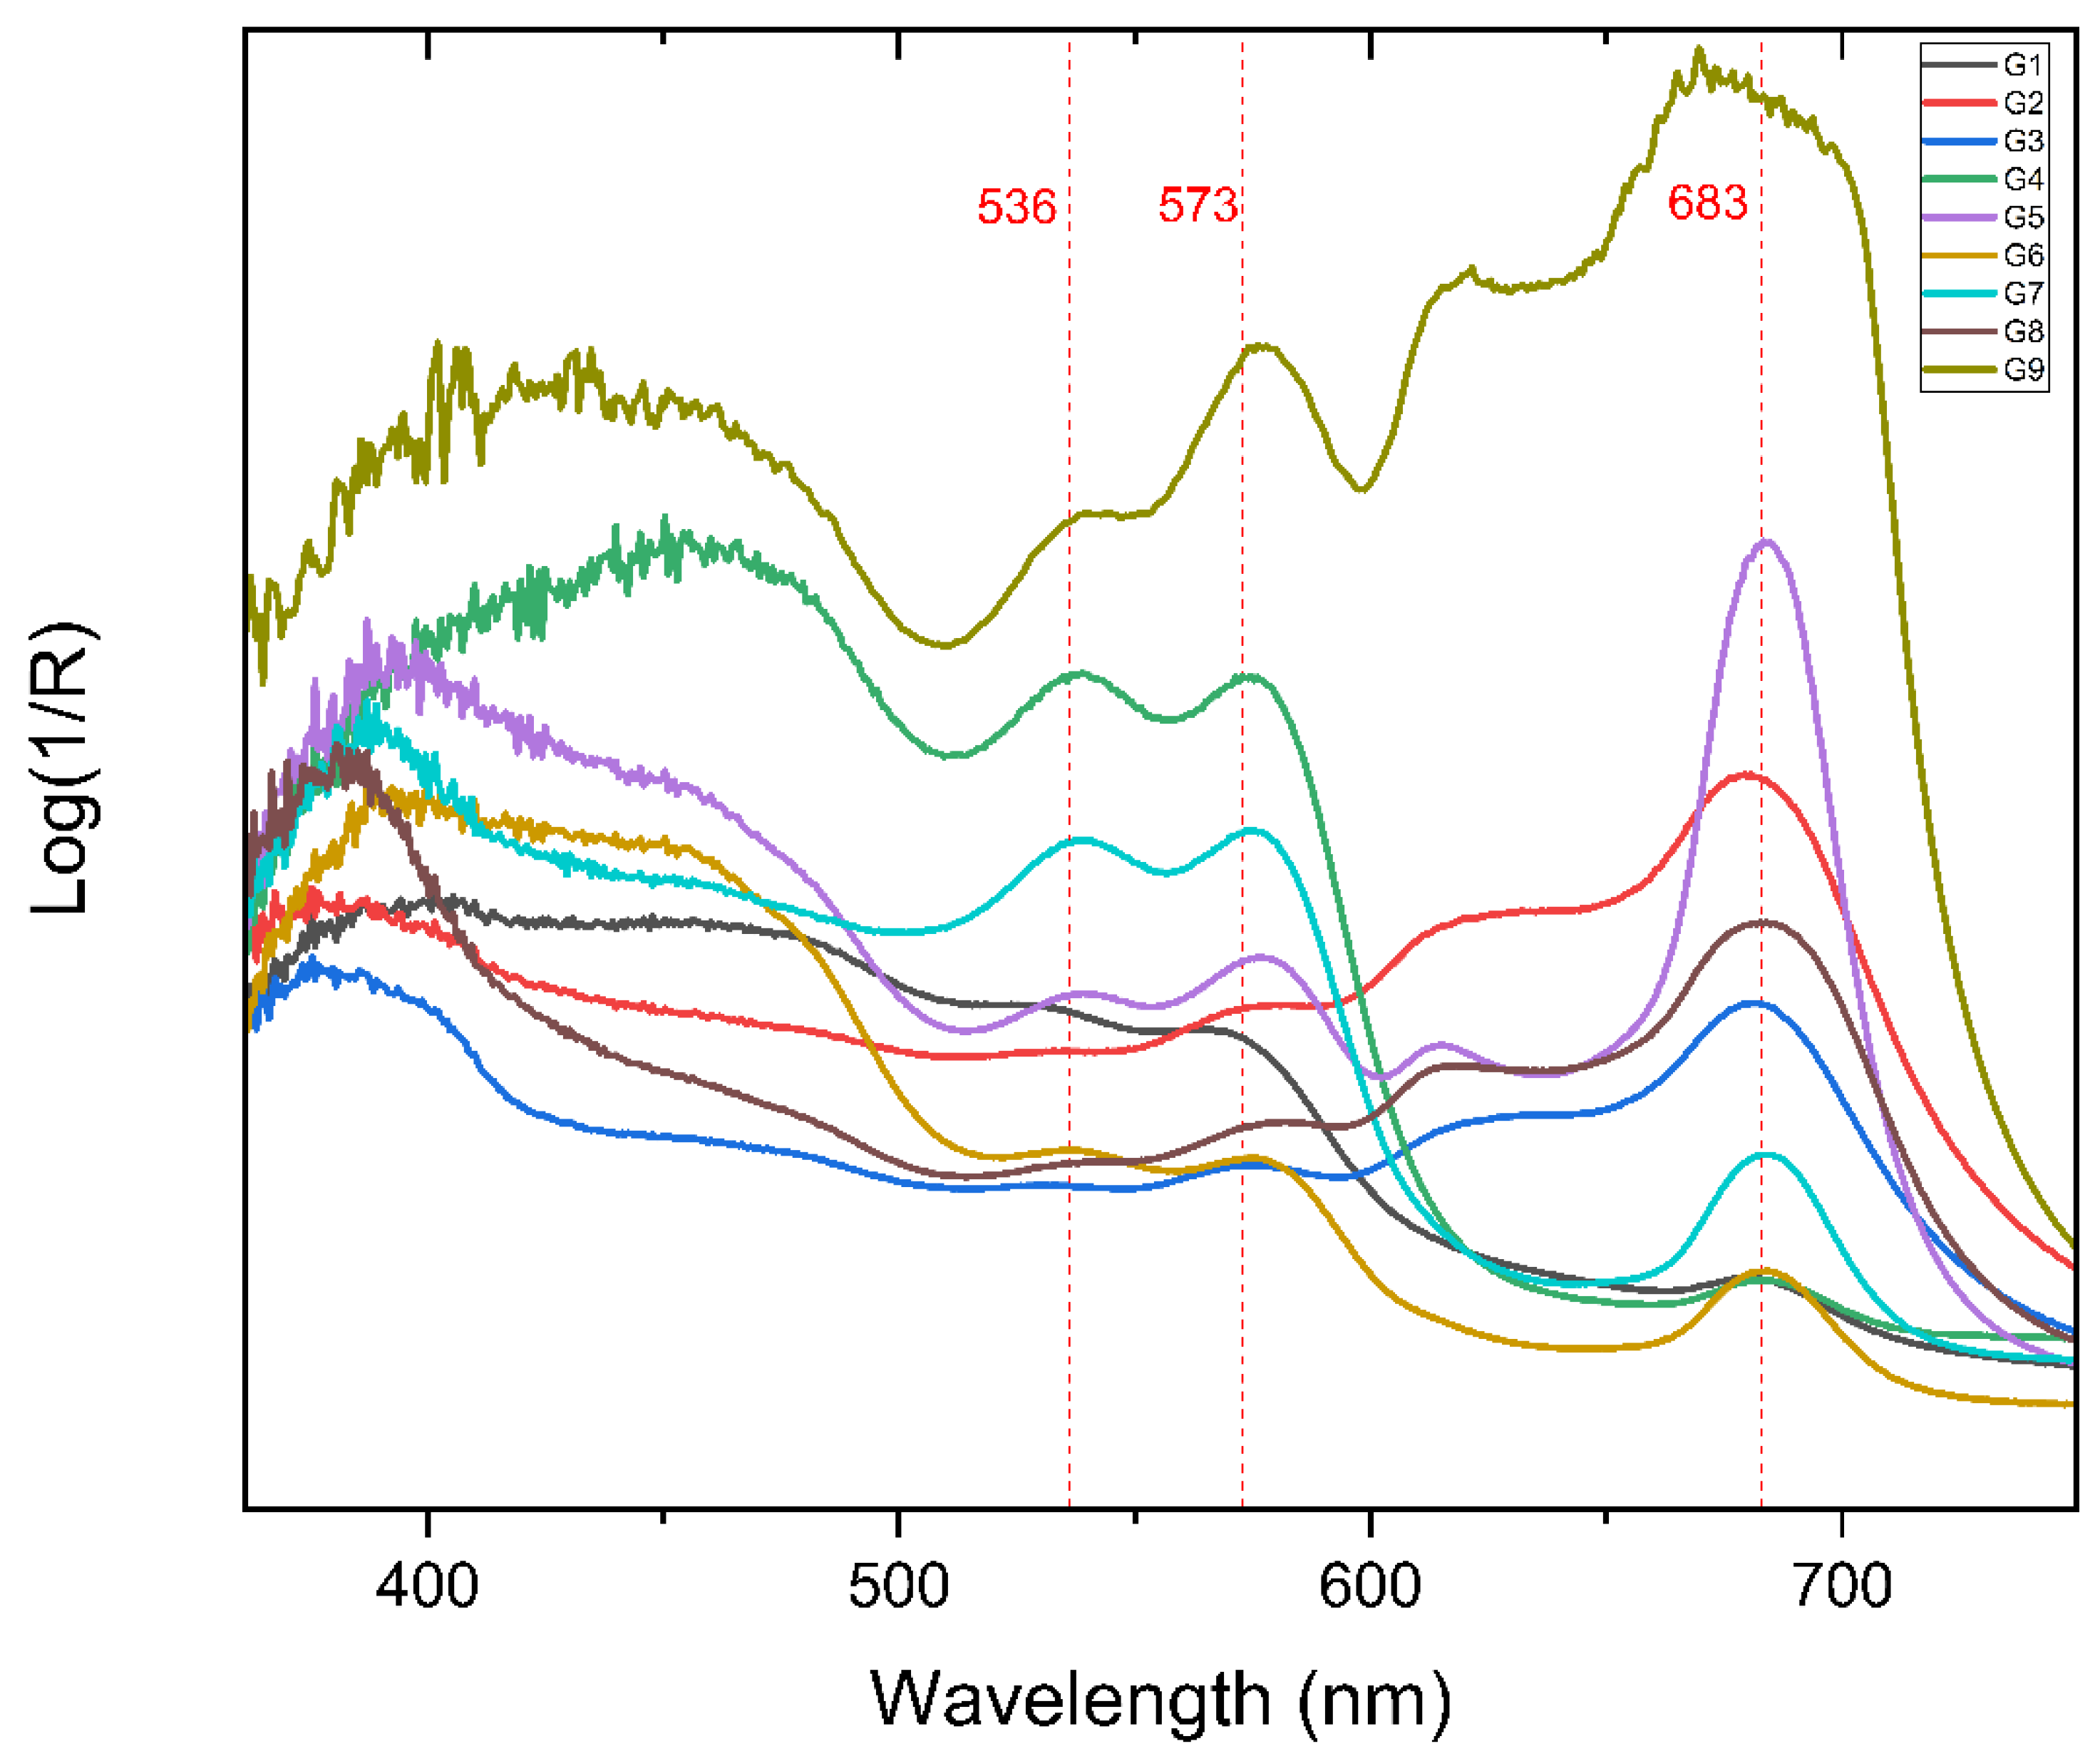
2.2.1. FORS
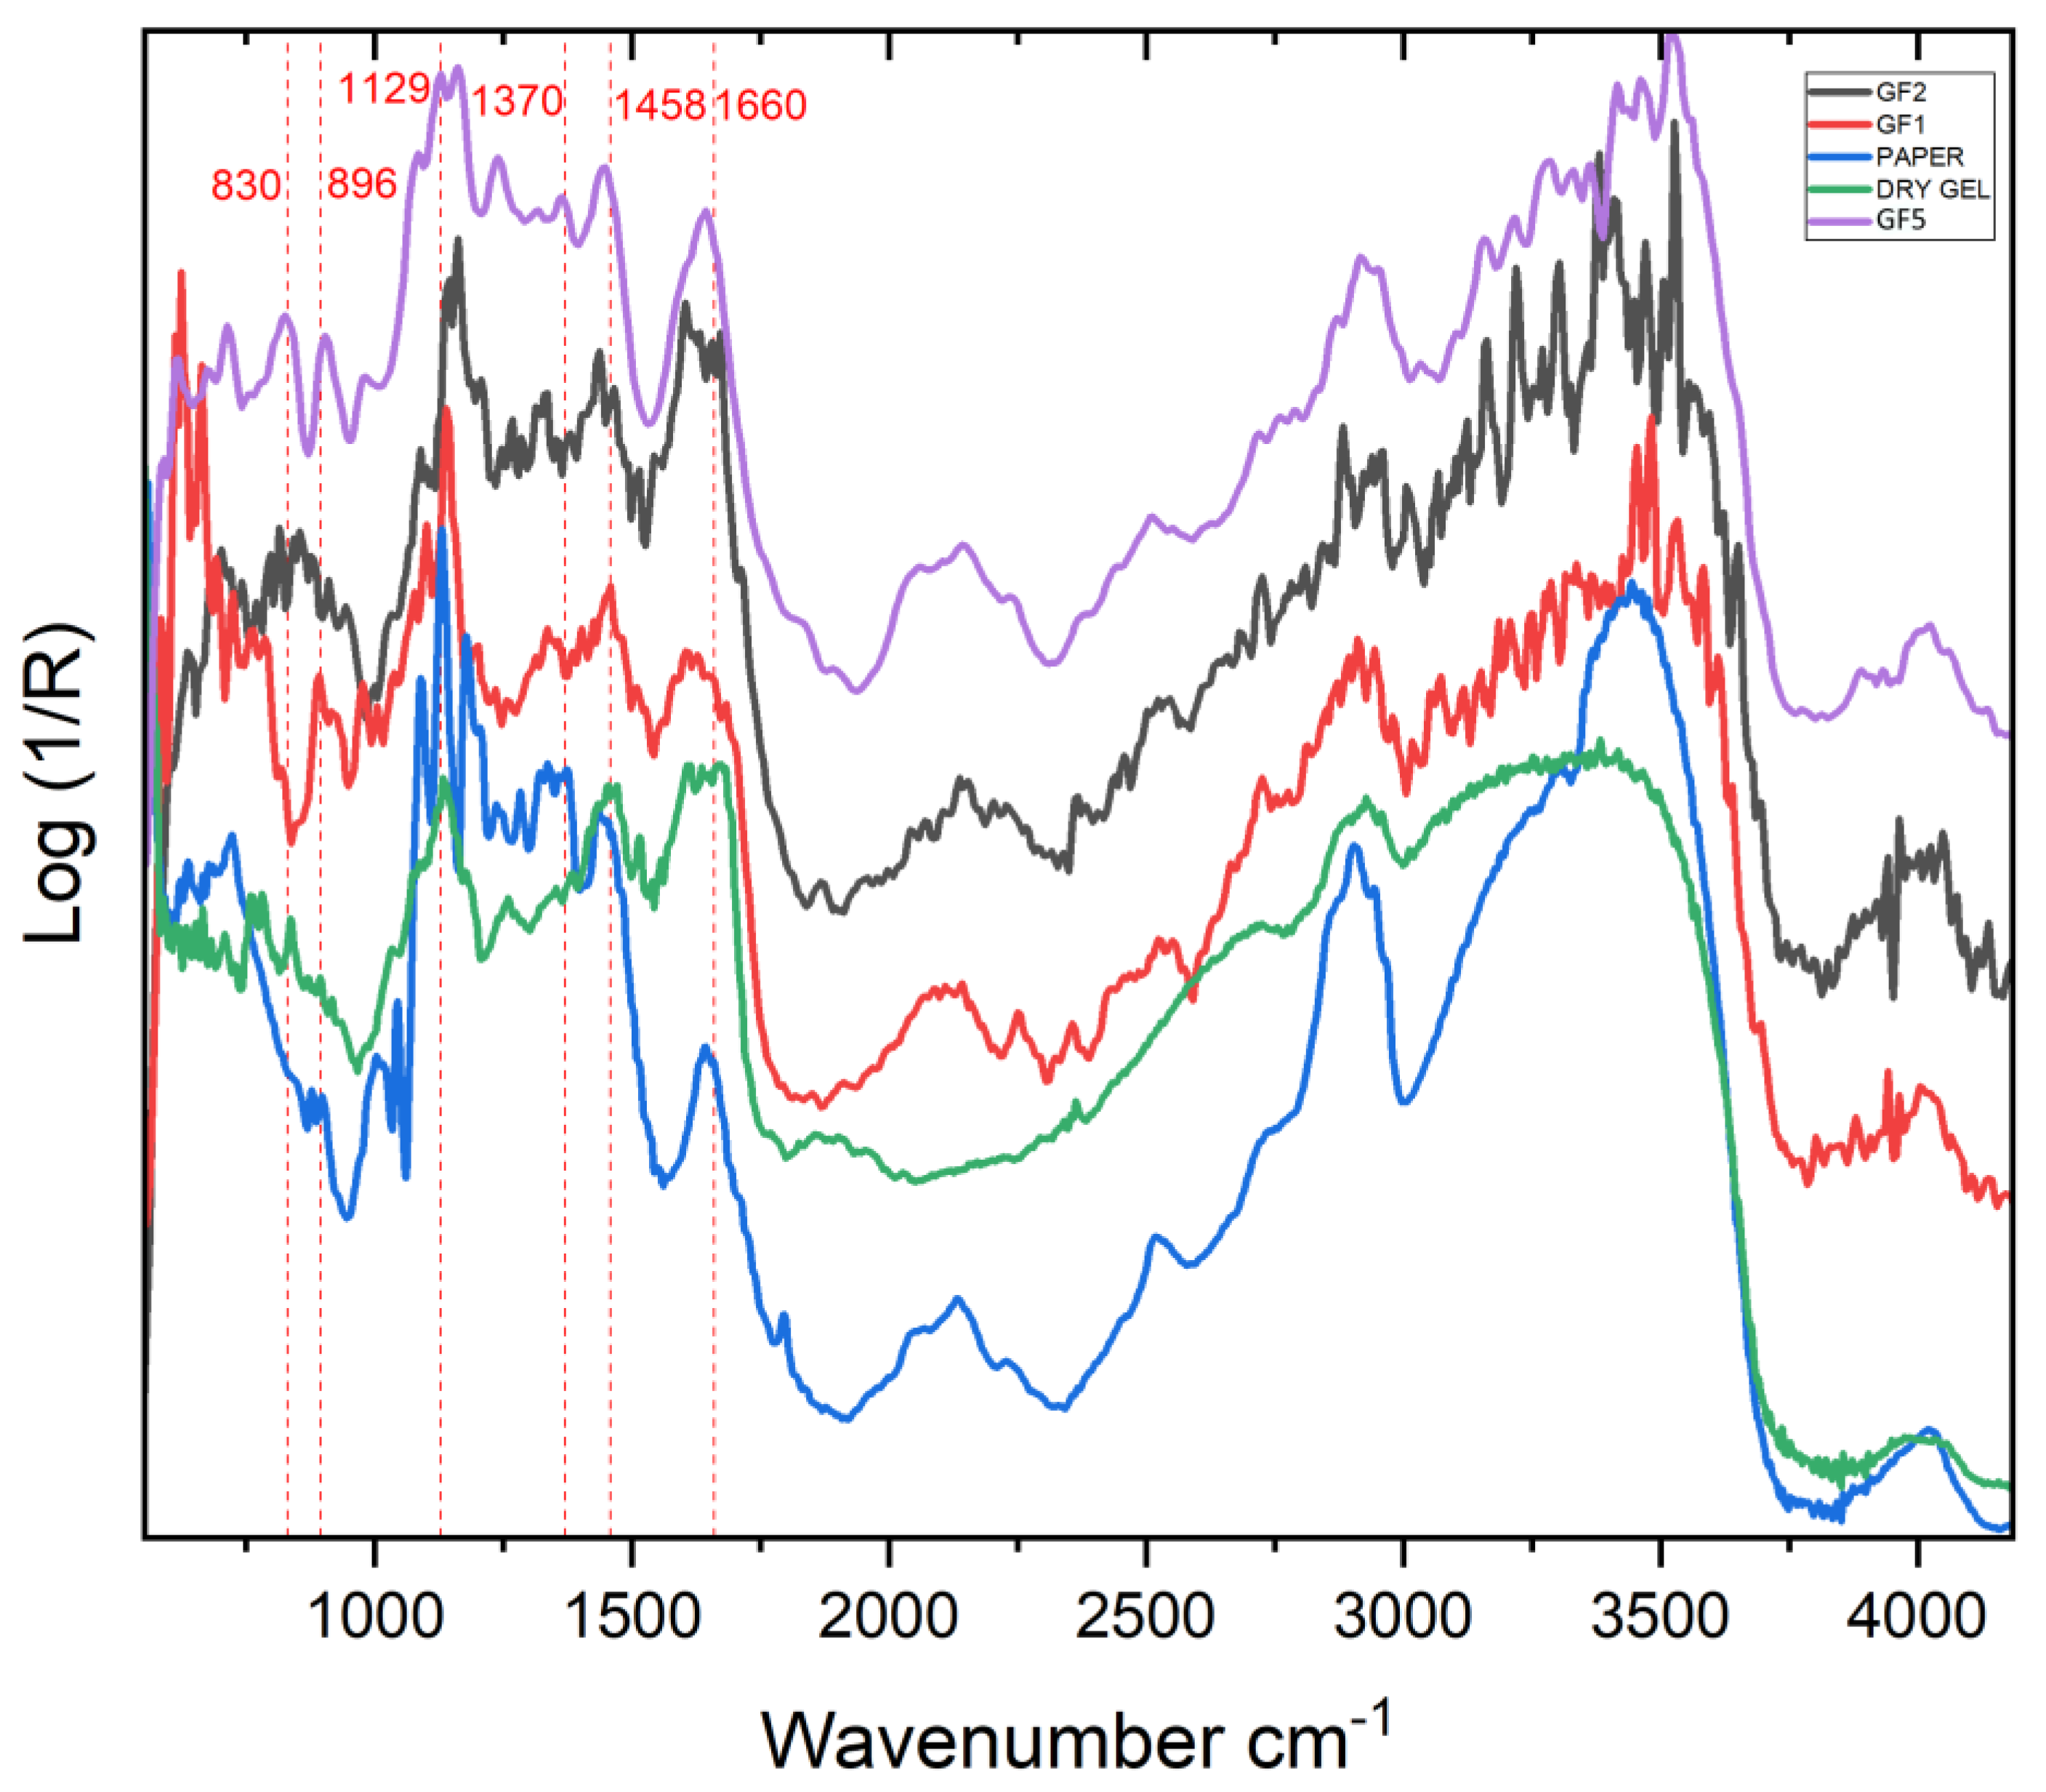
2.2.2. FTIR
3. Materials and Methods
3.1. Sample Preparation
3.2. The Spectroscopic Analysis
3.2.1. FORS
Analysis of the Mock-Up Polaroid Emulsion Transfer
Analysis of Paolo Gioli’s Original Artwork
3.2.2. Raman
3.2.3. FTIR
Analysis of the Mock-Up Sample
Analysis of Paolo Gioli’s Original Artwork
4. Conclusions
Supplementary Materials
Author Contributions
Funding
Institutional Review Board Statement
Informed Consent Statement
Acknowledgments
Conflicts of Interest
References
- Blacklow, L. New Dimensions in Photo Processes: A Step-by-Step Manual in Alternative Photography; Focal: Oxford, UK, 2007; ISBN 978-0-240-80789-8. [Google Scholar]
- Greenwald, R.B. 4-Hydropyrazole Developing Agents. US4102684, 20 September 1977. [Google Scholar]
- Bloom, S.M. Wayland, Boris Levy Image Receiving Elements. US43048US430483535, 8 December 1981. [Google Scholar]
- Fischer, M. Short Guide to Film Base Photographic Materials: Identification, Care, and Duplication. Northeast Doc. Conserv. Cent. 2007, 5, 112–117. [Google Scholar]
- Wilker, A. The Composition and Preservation of Instant Films; University of Texas at Austin: Austin, TX, USA, 2004. [Google Scholar]
- Attridge, G.G.; Pointer, M.R. Colour Science in Photography. J. Photogr. Sci. 1994, 42, 197–209. [Google Scholar] [CrossRef]
- Yeoung-Chan, K. The Synthesis of Green-Sensitizing Dye for Photographic Emulsion. J. Korean Appl. Sci. Technol. 1997, 14, 57–64. [Google Scholar]
- Yeoung-Chan, K.; Tai-Sung, K. The Synthesis of Sensitizing Dye for Photographic Emulsion. J. Korean Appl. Sci. Technol. 1995, 12, 5–11. [Google Scholar]
- Yeoung-Chan, K. The Synthesis of Red-Sensitizing Dye for Color Photography. J. Korean Appl. Sci. Technol. 2001, 18, 136–141. [Google Scholar]
- Witten, N.M. The Chemistry of Photography. Senior Theses, University of South Carolina-Columbia, Columbia, SC, USA, 2016. [Google Scholar]
- Van de Sande, C.C. Dye Diffusion Systems in Color Photography. Angew. Chem. Int. Ed. Engl. 1983, 22, 191–209. [Google Scholar] [CrossRef]
- Chalmers, A.N. A Colorimetric Comparison of Colour Reproductions. Color Res. Appl. 1979, 4, 217–224. [Google Scholar] [CrossRef]
- Sofen, S. Instant Imaging. In Proceedings of the IS&T’s 50th Annual Conference, Cambridge, MA, USA, 18–23 May 1997; Polaroid Corporation: Minnetonka, MN, USA, 1997. [Google Scholar]
- Bergthaller, P. Organic Sulfur Compounds in Silver Halide Photography. Sulfur Ceports 2006, 23, 1–45. [Google Scholar] [CrossRef]
- Fujita, S. Organic Chemistry of Photography; Springer Berlin Heidelberg: Berlin, Heidelberg, 2004; ISBN 978-3-642-05902-5. [Google Scholar]
- Venkataraman, K. The Chemistry of Synthetic Dyes; Academic Press: Cambridgem, MA, USA, 1971; Volume 4, p. 714. [Google Scholar]
- Simon, M.S. New Developments in Instant Photography. J. Chem. Educ. 1994, 71, 132. [Google Scholar] [CrossRef]
- Land, E.H. Photographic Product Comprising a Ruptuble Container Carrying a Photographic Processing Liquid. US2543181, 27 February 1951. [Google Scholar]
- Mervis, S.H.; Walworth, V.K. Photography, Instant. Kirk-Orthmer Encycl. Chem. Technol. 2001, 50. [Google Scholar] [CrossRef]
- Renner, E. Pinhole Photography: From Historic Technique to Digital Application, 4th ed.; Routledge: London, UK, 2012; ISBN 978-0-08-092789-3. [Google Scholar]
- Dupré, H.F. Online Book: Polaroid Image Transfers Tools and Techniques. Available online: https://www.21gradi.it/repository/POLAROID%20TRANSFER%20TECHNIC.pdf (accessed on 6 July 2022).
- Berg, W. Polaroid One-Step Color Photography. Naturwissenschaften 1977, 64, 1–7. [Google Scholar] [CrossRef]
- Rogers, H.G. Processes and Products for Forming Photographic Images in Color. US2983606, 9 May 1961. [Google Scholar]
- Idelson, M. SX-70: A Unique System of Dyes. Res. Lab. Polaroid Corp. Camb. Massachus 1982, 3, 191–201. [Google Scholar] [CrossRef]
- Guida, W.C.; Raber, D.J. The Chemistry of Color Photography. J. Chem. Educ. 1975, 52, 622. [Google Scholar] [CrossRef]
- Orraca, J. The Conservation of Photographic Materials. Int. Inst. Conserv. Hist. Artist. Works 1973, 13, 32–38. [Google Scholar] [CrossRef]
- Bloom, S.M.; Green, M.; Idelson, M.; Simon, M.S. The Dye Developer in the Polaroid Color Photographic Process. In The Chemistry of Synthetic Dyes. Elsevier: Amsterdam, The Netherlands, 1978; pp. 331–387. ISBN 978-0-12-717008-4. [Google Scholar]
- Haines, A. Conservation of Photographic Chemicals. J. Soc. Motion Pict. Eng. 1943, 41, 409–411. [Google Scholar] [CrossRef]
- Rempel, S. A Conservation Method for Nitrate Based Photographic Materials. Pap. Conserv. 1977, 2, 44–46. [Google Scholar] [CrossRef]
- Casoli, A.; Fornaciari, S. An Analytical Study on an Early Twentieth-Century Italian Photographs Collection by Means of Microscopic and Spectroscopic Techniques. Microchem. J. 2014, 116, 24–30. [Google Scholar] [CrossRef]
- Maillette de Buy Wenniger, T. The Quest towards a Non-Destructive Identification Method for Polaroid Integral Film Types. Master Thesis, University of Amsterdam, Amsterdam, The Netherlands, 2020. [Google Scholar]
- Silva, J.; Ferreira, J.L.; Laia, A.T.; Parola, A.J.; Lavédrine, B.; Ramos, A.M. New Approaches for Monitoring Dye Fading in Chromogenic Reversal Films: UV-Vis Spectrophotometry and Digitisation. In Proceedings of the ICOM-CC 18th Triennial Conference, Copenhagen, Denmark, 4–8 September 2017; p. 11. [Google Scholar]
- Pietro, G.D. Chapter 4 Examples of Using Advanced Analytical Techniques to Investigate the Degradation of Photographic Materials. In Physical Techniques in the Study of Art, Archaeology and Cultural Heritage; Elsevier: Amsterdam, The Netherlands, 2007; Volume 2, pp. 155–198. ISBN 978-0-444-52856-8. [Google Scholar]
- Ricci, C.; Bloxham, S.; Kazarian, S.G. ATR-FTIR Imaging of Albumen Photographic Prints. J. Cult. Herit. 2007, 8, 387–395. [Google Scholar] [CrossRef]
- Sclocchi, M.C.; Damiano, E.; Matè, D.; Colaizzi, P.; Pinzari, F. Fungal Biosorption of Silver Particles on 20th-Century Photographic Documents. Int. Biodeterior. Biodegrad. 2013, 84, 367–371. [Google Scholar] [CrossRef]
- Rampazzi, L.; Brunello, V.; Campione, F.P.; Corti, C.; Geminiani, L.; Recchia, S.; Luraschi, M. Non-Invasive Identification of Pigments in Japanese Coloured Photographs. Microchem. J. 2020, 157, 105017. [Google Scholar] [CrossRef]
- Simon, M.S. Opacification: Solving the Fundamental Problems. Dyes Pigment. 1989, 11, 1–12. [Google Scholar] [CrossRef]
- Trumpy, G. Photographic film and its interaction with light: Detection of Dust and Scratches for Image Restoration. Ph. D. Thesis, Universität Basel, Basel, Switzerland, 2013. [Google Scholar]
- Lavedrine, B. Photographs of the Past: Process and Preservation, Getty Publications, 2nd ed.; The Getty Conservation Institute: Los Angeles, CA, USA, 2007; ISBN 978-0-89236-957-7. [Google Scholar]
- Cattaneo, B.; Chelazzi, D.; Giorgi, R.; Serena, T.; Merlo, C.; Baglioni, P. Physico-Chemical Characterization and Conservation Issues of Photographs Dated between 1890 and 1910. J. Cult. Herit. 2008, 9, 277–284. [Google Scholar] [CrossRef]
- Van Roosmalen, P.M.B.; Biemond, J.; Lagendijk, R.L. Restoration and Storage of Film and Video Archive Material. Signal Process. Multimed. 1999, 1, 167–191. [Google Scholar]
- Bryan, F.R.; Runge, E.F. Sensitometric Properties of a Polaroid Emulsion as Applied to Spectroscopic Analysis. Appl. Spectrosc. 1961, 15, 16–18. [Google Scholar] [CrossRef]
- Ann Daffner, L.; McGlinchey, C. The Big Picture: Conservation Research Program for Contemporary Color Photographs. Stud. Conserv. 2004, 49, 109–113. [Google Scholar] [CrossRef]
- Fenech, A.; Strlič, M.; Cassar, M. The Past and the Future of Chromogenic Colour Photographs: Lifetime Modelling Using near-Infrared Spectroscopy & Enhancement Using Hypoxia. Appl. Phys. A 2012, 106, 411–417. [Google Scholar] [CrossRef]
- Land, E.H. A New One-Step Photographic Process. J. Opt. Soc. Am. 1947, 37, 61. [Google Scholar] [CrossRef]
- Rogers, D. The Chemistry of Photography, From Classical to Digital Technologies. In The Royal Society of Chemistry; RSC publishing: London, UK, 2007; ISBN 9780854042739. [Google Scholar]
- Mervis, S.H. Photography, Instant. In Kirk-Othmer Encyclopedia of Chemical Technology; Wiley-Interscience: Hoboken, NJ, USA, 2000. [Google Scholar]
- Theys, R.D.; Sosnovsky, G. Chemistry and Processes of Color Photography. Chem. Rev. 1997, 97, 83–132. [Google Scholar] [CrossRef]
- Idelson, Martin Chemistry of Metallized Dyes. J. Soc. Photogr. Sci. Technol 1984, 47, 421–431.
- Luísa, A.; Baddini, D.Q.; Luiz, J.; Paula, V.D.; Reiner, R.; Silva, L.; Paula, D.; Araújo, C.; Freitas, R.P. PLS-DA and Data Fusion of Visible Reflectance, XRF and FTIR Spectroscopy in the Classification of Mixed Historical Pigments. Spectrochim. Acta Part A Mol. Biomol. Spectrosc. 2022, 265, 120384. [Google Scholar] [CrossRef]
- Defeyt, C.; Pevenage, J.V.; Moens, L.; Strivay, D.; Vandenabeele, P. Spectrochimica Acta Part A: Molecular and Biomolecular Spectroscopy Micro-Raman Spectroscopy and Chemometrical Analysis for the Distinction of Copper Phthalocyanine Polymorphs in Paint Layers. Spectrochim. Acta. A. Mol. Biomol. Spectrosc. 2013, 115, 636–640. [Google Scholar] [CrossRef]
- Beaulieu-Houle, G.; Gilson, D.F.R.; Butler, I.S. Pressure-Tuning Micro-Raman Spectra of Artists’ Pigments: α- and β-Copper Phthalocyanine Polymorphs. Spectrochim. Acta. A. Mol. Biomol. Spectrosc. 2014, 117, 61–64. [Google Scholar] [CrossRef] [PubMed]
- Anghelone, M.; Jembrih-simbürger, D.; Schreiner, M. Identification of Copper Phthalocyanine Blue Polymorphs in Unaged and Aged Paint Systems by Means of Micro-Raman Spectroscopy and Random Forest. Spectrochim. Acta. A. Mol. Biomol. Spectrosc. 2015. [Google Scholar] [CrossRef] [PubMed]
- Aceto, M.; Agostino, A.; Fenoglio, G.; Idone, A.; Gulmini, M.; Picollo, M.; Ricciardi, P.; Delaney, J.K. Characterisation of Colourants on Illuminated Manuscripts by Portable Fibre Optic UV-Visible-NIR Reflectance Spectrophotometry. Anal. Methods 2014, 6, 1488–1500. [Google Scholar] [CrossRef]
- Albay, C.; Koç, M.; Altin, I.; Bayrak, R.; Deǧirmencioǧlu, I.; Sökmen, M. New Dye Sensitized Photocatalysts: Copper(II)-Phthalocyanine/TiO2 Nanocomposite for Water Remediation. J. Photochem. Photobiol. Chem. 2016, 324, 117–125. [Google Scholar] [CrossRef]
- Cheng, S.; Huang, A.; Wang, S.; Zhang, Q. Effect of Different Heat Treatment Temperatures on the Chemical Composition and Structure of Chinese Fir Wood. BioResources 2016, 11, 4006–4016. [Google Scholar] [CrossRef]
- Ostrovskii, D.; Kjøniksen, A.L.; Nyström, B.; Torell, L.M. Association and Thermal Gelation in Aqueous Mixtures of Ethyl(Hydroxyethyl)Cellulose and Ionic Surfactant: FTIR and Raman Study. Macromolecules 1999, 32, 1534–1540. [Google Scholar] [CrossRef]
- Hussain, G.; Ather, M.; Khan, M.U.A.; Saeed, A.; Saleem, R.; Shabir, G.; Channar, P.A. Synthesis and Characterization of Chromium (III), Iron (II), Copper (II) Complexes of 4-Amino-1-(p-Sulphophenyl)-3-Methyl-5-Pyrazolone Based Acid Dyes and Their Applications on Leather. Dyes Pigment. 2016, 130, 90–98. [Google Scholar] [CrossRef]
- Dupre, H.F. Polaroid Image Transfers: Tools and Techniques; Polaroid publishing: San Francisco, CA, USA, 2000. [Google Scholar]
- Socrates, G.; Socrates, G. Infrared and Raman Characteristic Group Frequencies: Tables and Charts, 3rd ed.; Wiley: Chichester, UK; New York, NY, USA, 2001; ISBN 978-0-471-85298-8. [Google Scholar]
- Larkin, P. Infrared and Raman Spectroscopy: Principles and Spectral Interpretation; Elsevier: Amsterdam, The Netherlands, 2011; ISBN 978-0-12-386984-5. [Google Scholar]
- Serafini, I.; Ciccola, A. Nanotechnologies and Nanomaterials. In Nanotechnologies and Nanomaterials for Diagnostic, Conservation and Restoration of Cultural Heritage. Elsevier: Amsterdam, The Netherlands, 2019; pp. 325–380. ISBN 978-0-12-813910-3. [Google Scholar]
- Calà, E.; Benzi, M.; Gosetti, F.; Zanin, A.; Gulmini, M.; Idone, A.; Serafini, I.; Ciccola, A.; Curini, R.; Whitworth, I.; et al. Towards the Identification of the Lichen Species in Historical Orchil Dyes by HPLC-MS/MS. Microchem. J. 2019, 150, 104140. [Google Scholar] [CrossRef]
- Persechino, S.; Toniolo, C.; Ciccola, A.; Serafini, I.; Tammaro, A.; Postorino, P.; Persechino, F.; Serafini, M. A New High-Throughput Method to Make a Quality Control on Tattoo Inks. Spectrochim. Acta. A Mol. Biomol. Spectrosc. 2019, 206, 547–551. [Google Scholar] [CrossRef]


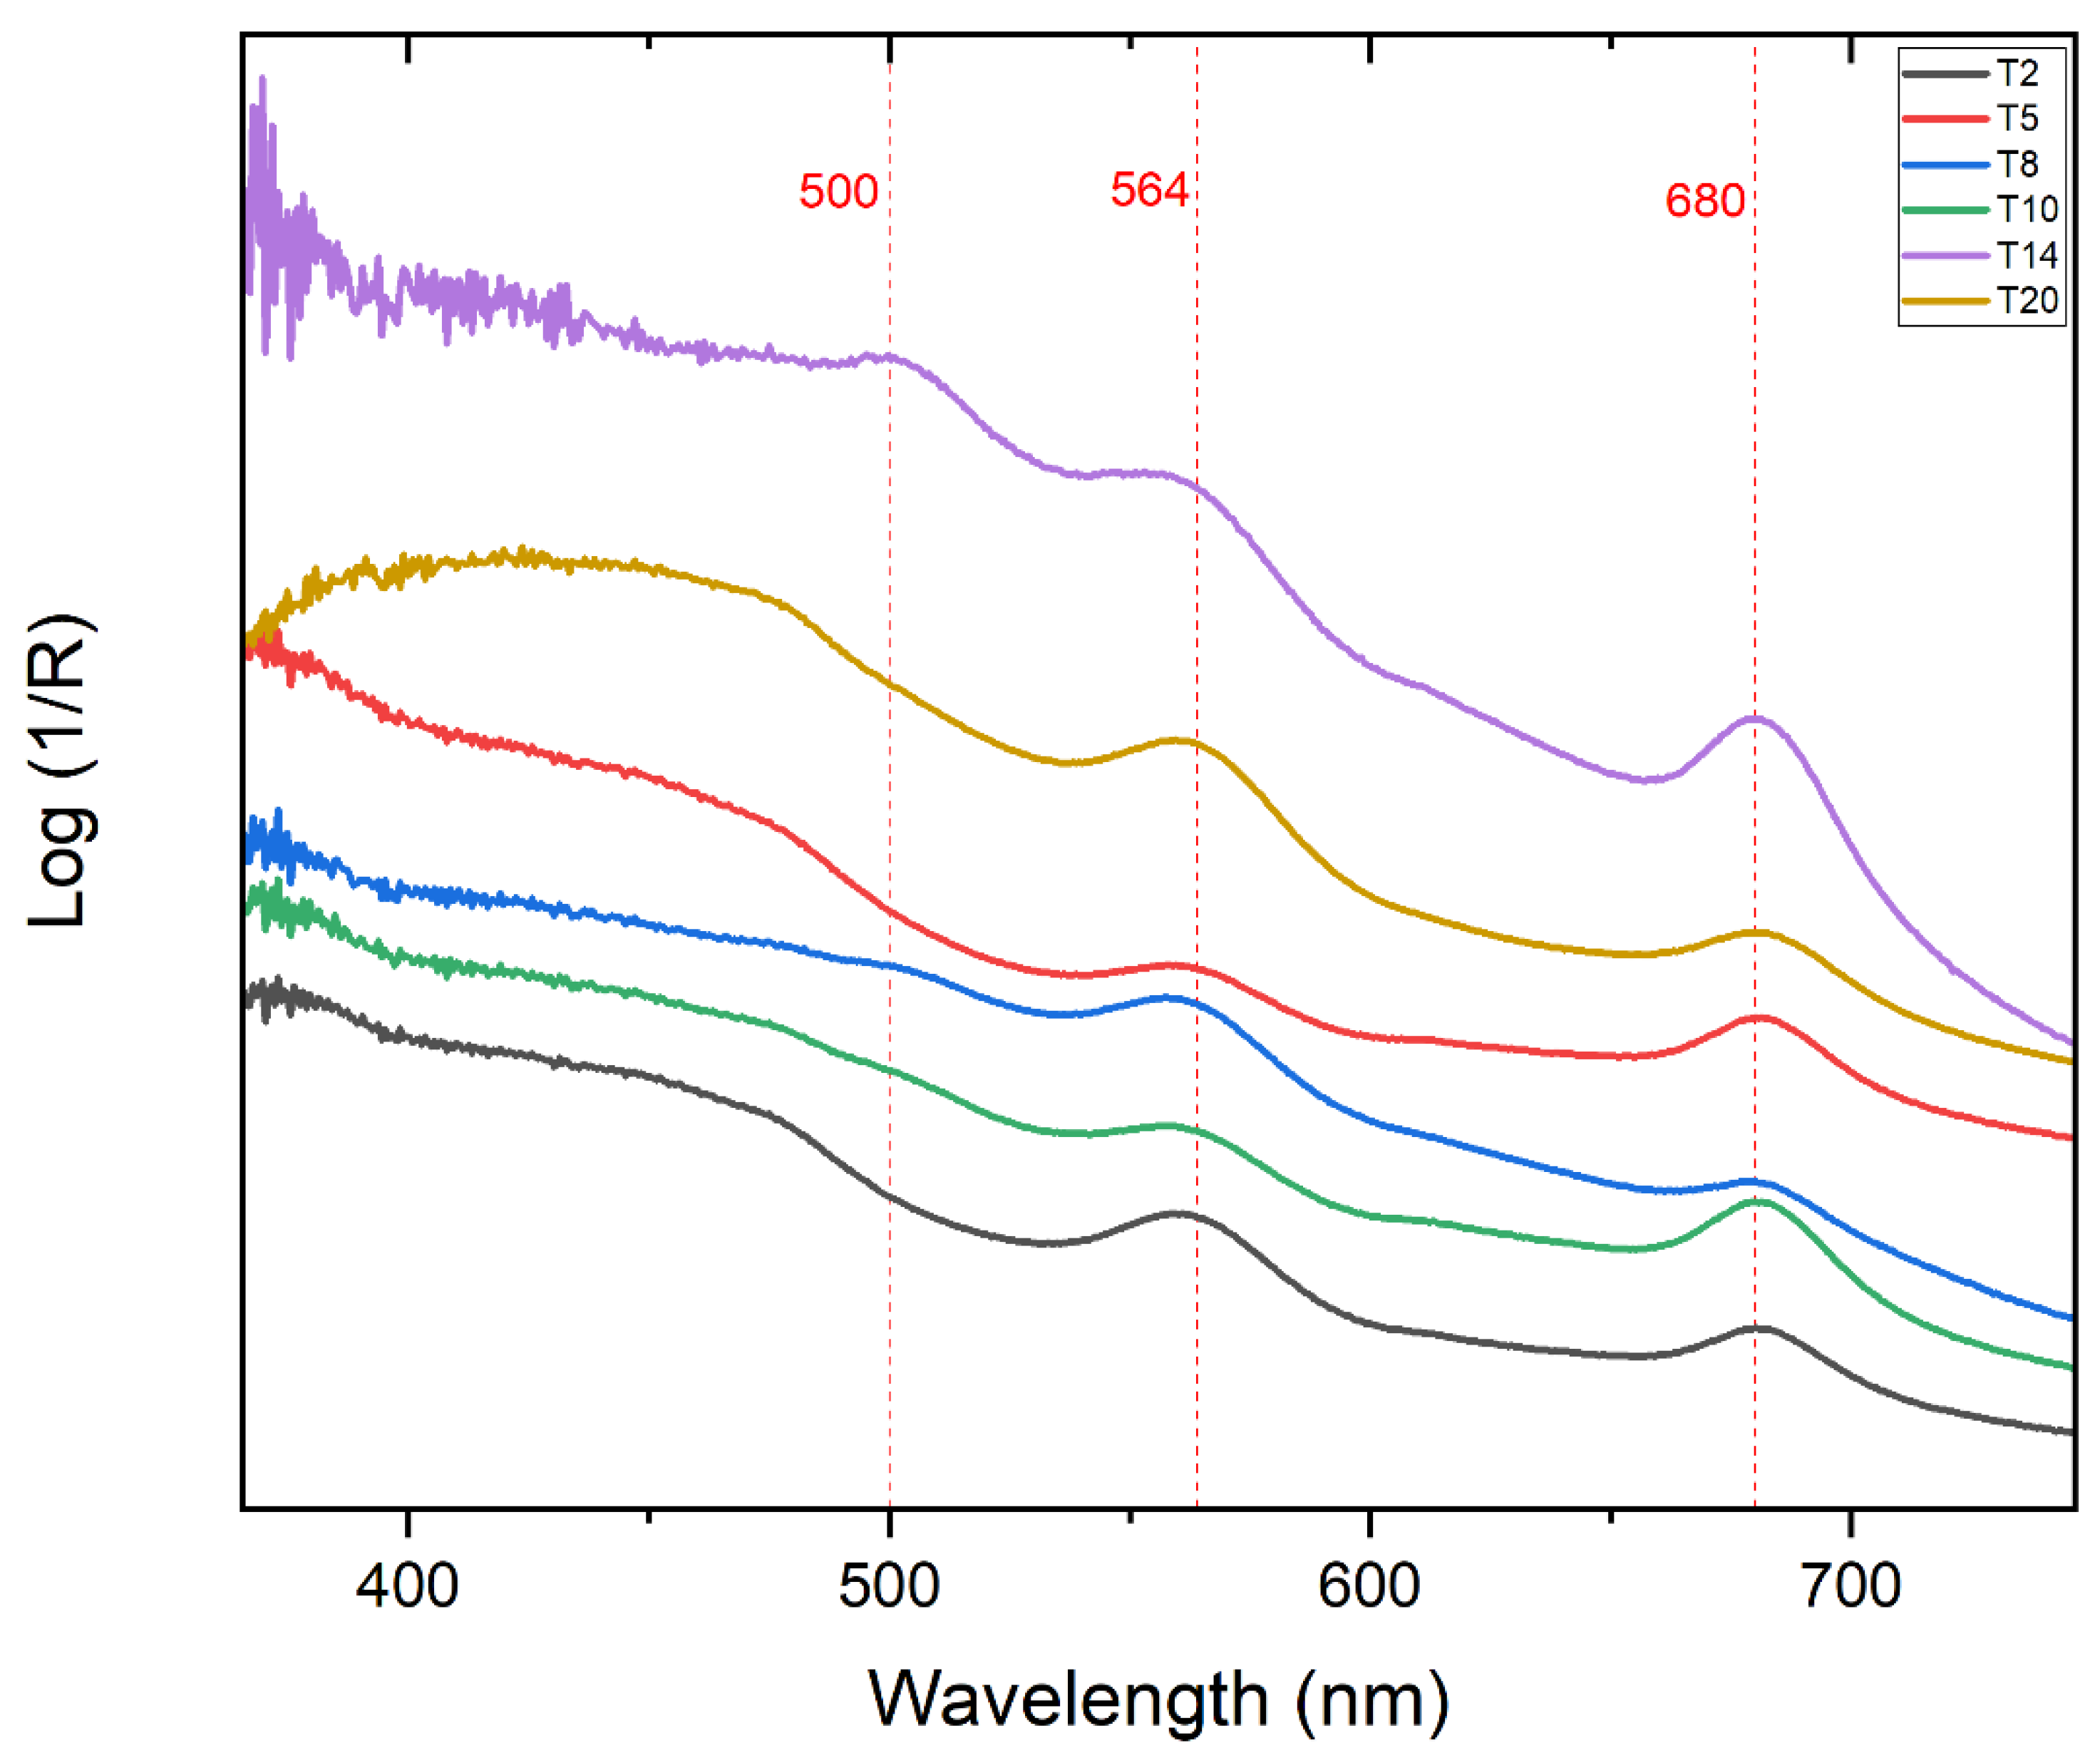
| Points | Absorbance Max (nm) |
|---|---|
| T1 | 560, 682 |
| T2 | 564, 685 |
| T3 | 564, 683 |
| T4 | 500, 561, 682 |
| T5 | 443, 564, 682 |
| T6 | 501, 564, 682 |
| T7 | 500, 564, 685 |
| T8 | 562, 682 |
| T9 | 505, 562, 682 |
| T10 | 560, 682 |
| T11 | 501, 565, 682 |
| T12 | 502, 563, 682 |
| T13 | 501, 560, 682 |
| T14 | 503, 564, 682 |
| T15 | 505, 564, 684 |
| T16 | 563, 684 |
| T17 | 564, 683 |
| T18 | 505, 564,683 |
| T19 | 562, 682 |
| T20 | 456, 564, 684 |
| Point | L* | a* | b* |
|---|---|---|---|
| T1 | 78.37 | 7.243 | 23.830 |
| T2 | 68.49 | 4.805 | 19.961 |
| T3 | 65.46 | 6.279 | 18.444 |
| T4 | 59.29 | 6.329 | 14.921 |
| T5 | 65.13 | 3.359 | 23.101 |
| T6 | 49.90 | 8.333 | 14.516 |
| T7 | 45.78 | 7.725 | 13.677 |
| T8 | 54.82 | 10.898 | 13.000 |
| T9 | 39.94 | 9.091 | 12.545 |
| T10 | 63.73 | 6.769 | 18.838 |
| T11 | 41.12 | 13.288 | 15.784 |
| T12 | 47.02 | 11.160 | 15.140 |
| T13 | 46.17 | 11.040 | 15.779 |
| T14 | 30.58 | 13.827 | 13.844 |
| T15 | 40.39 | 11.700 | 14.025 |
| T16 | 58.35 | 7.935 | 17.138 |
| T17 | 54.93 | 7.852 | 15.279 |
| T18 | 49.30 | 15.432 | 14.817 |
| T19 | 52.27 | 10.981 | 16.194 |
| T20 | 56.07 | 12.205 | 21.171 |
| Points | Absorbance Max (nm) |
|---|---|
| G1 | 450, 535, 569, 681 |
| G2 | 570, 620, 680 |
| G3 | 528, 570, 626, 680 |
| G4 | 450, 536, 573, 684 |
| G5 | 536, 573, 615, 684 |
| G6 | 536, 575, 683 |
| G7 | 536, 575, 683 |
| G8 | 580, 615, 683 |
| G9 | 577, 617, 677 |
| Acquisition Point | Wavenumber |
|---|---|
| GF1 | 724, 820, 893, 976, 1078, 1099, 1139, 1206, 1313, 1335, 1386, 1403, 1459, 1481, 1604, 1655, 2109, 2725, 2911, 3482, 4004, 5141 cm−1 |
| GF2 | 820, 904, 945, 1066, 1088, 1145, 1161, 1206, 1268, 1285, 1313, 1335, 1352, 1380, 1436, 1464, 1492, 1604, 1655, 1671, 2103, 2137, 2523, 2725, 2882, 3409, 4026, 4777, 5153 cm−1 |
| G5 | 713, 825, 903, 1083, 1127, 1162, 1240, 1318, 1364, 1448, 1644, 2103, 2143, 2513, 2720, 2866, 2916, 3522, 4021, 4766, 5203 cm−1 |
| Paper | 720, 877, 899, 1003, 1016, 1043, 1090, 1130, 1176, 1205, 1236, 1282, 1321, 1336, 1357, 1373, 1433, 1452, 1643, 1795, 2069, 2129, 2518, 2723, 2904, 3443, 4021, 4749, 5177 cm−1 |
Publisher’s Note: MDPI stays neutral with regard to jurisdictional claims in published maps and institutional affiliations. |
© 2022 by the authors. Licensee MDPI, Basel, Switzerland. This article is an open access article distributed under the terms and conditions of the Creative Commons Attribution (CC BY) license (https://creativecommons.org/licenses/by/4.0/).
Share and Cite
Alp, Z.; Ciccola, A.; Serafini, I.; Nucara, A.; Postorino, P.; Gentili, A.; Curini, R.; Favero, G. Photons for Photography: A First Diagnostic Approach to Polaroid Emulsion Transfer on Paper in Paolo Gioli’s Artworks. Molecules 2022, 27, 7023. https://doi.org/10.3390/molecules27207023
Alp Z, Ciccola A, Serafini I, Nucara A, Postorino P, Gentili A, Curini R, Favero G. Photons for Photography: A First Diagnostic Approach to Polaroid Emulsion Transfer on Paper in Paolo Gioli’s Artworks. Molecules. 2022; 27(20):7023. https://doi.org/10.3390/molecules27207023
Chicago/Turabian StyleAlp, Zeynep, Alessandro Ciccola, Ilaria Serafini, Alessandro Nucara, Paolo Postorino, Alessandra Gentili, Roberta Curini, and Gabriele Favero. 2022. "Photons for Photography: A First Diagnostic Approach to Polaroid Emulsion Transfer on Paper in Paolo Gioli’s Artworks" Molecules 27, no. 20: 7023. https://doi.org/10.3390/molecules27207023
APA StyleAlp, Z., Ciccola, A., Serafini, I., Nucara, A., Postorino, P., Gentili, A., Curini, R., & Favero, G. (2022). Photons for Photography: A First Diagnostic Approach to Polaroid Emulsion Transfer on Paper in Paolo Gioli’s Artworks. Molecules, 27(20), 7023. https://doi.org/10.3390/molecules27207023