Article

Low-Symmetry Phthalocyanines Bearing Carboxy-Groups: Synthesis, Spectroscopic and Quantum-Chemical Characterization

1
A. N. Frumkin Institute of Physical Chemistry and Electrochemistry, Russian Academy of Sciences, Leninsky pr., 31, Building 4, 119071 Moscow, Russia
2
Institute for Nanotechnology Innovation, Department of Chemistry, Rhodes University, Makhanda 6140, South Africa
3
N. S. Kurnakov Institute of General and Inorganic Chemistry, Russian Academy of Sciences, Leninsky pr., 31, 119991 Moscow, Russia
*
Authors to whom correspondence should be addressed.
Molecules 2022, 27(2), 524; https://doi.org/10.3390/molecules27020524
Submission received: 13 December 2021 / Revised: 11 January 2022 / Accepted: 12 January 2022 / Published: 14 January 2022
(This article belongs to the Special Issue Design and Synthesis of Macrocyclic Compounds)

Abstract

:
The synthesis and characterization of A3B-type phthalocyanines, ZnPc14, bearing bulky 2,6-diisopropylphenoxy-groups or chlorine atoms on isoindoline units “A” and either one or two carboxylic anchors on isoindoline unit “B” are reported. A comparison of molecular modelling with the conventional time dependent—density functional theory (TD-DFT) approach and its simplified sTD-DFT approximation provides further evidence that the latter method accurately reproduces the key trends in the spectral properties, providing colossal savings in computer time for quite large molecules. This demonstrates that it is a valuable tool for guiding the rational design of new phthalocyanines for practical applications.

1. Introduction

Phthalocyanines (Pcs) are macrocyclic ligands of particular interest because of their high stability, excellent photophysical properties and facile structural modification, which can readily be used to control the properties of corresponding materials and devices [1,2,3]. From this standpoint, low-symmetry Pcs are particularly interesting since combining various functional groups at the ligand periphery enables a rational modulation of their properties such as solubility, compatibility with nanomaterials, and nonlinear optical properties [4]. For example, low-symmetry Pcs bearing one or two carboxylic groups can act as the light-harvesting components of dye-sensitized solar cells (DSSCs) when these sensitizers are grafted on the surface of TiO2 or ZnO [5]. To control the aggregation and solubility of these Pcs, bulky groups can be introduced varying from relatively small tert-butyl groups [6] to perfluoro-tert-butyl substituents [7] and sterically demanding 2,6-disubstituted phenoxy-groups [8,9,10,11]. Moreover, carboxy-substituted Pcs can be conjugated with various nanomaterials, such as gold nanoparticles [12] or carbon nanotubes [13] to provide photoactive hybrid materials.
In addition to the control of aggregation, the substitution pattern should also help to align the frontier orbital energies of the sensitizer and the conduction band of metal oxides, so molecular modelling calculations can be used to guide further synthetic work in a rational manner [14] and improve device performance [15,16]. The accurate prediction of UV-visible absorption (UV-vis) spectra of low-symmetry Pc sensitizers is critical since photon absorption is the primary act in the sequence of physical processes that convert solar energy into electricity. Typically, this task is solved using the time dependent–density functional theory (TD-DFT) method [17,18,19,20], although the relatively high computational cost can limit its applicability in the context of large molecules with sterically demanding substituents. In this study, the synthesis of a series of zinc phthalocyaninates, ZnPc14, with bulky solubilizing diisopropylphenoxy-groups and either one or two carboxylic anchors is reported (Figure 1). Analyses of their UV-vis spectra using the classical TD-DFT approach and its simplified approximation (sTD-DFT) [21,22], demonstrate that the latter approach provides a spectacular speed-up of calculations by orders of magnitude, which is particularly useful in the theoretical treatment of large conjugated molecules such as phthalocyanines [22,23,24,25].

2. Results

Carboxy-substituted Pcs can be synthesized by a cross-condensation template reaction of phthalonitriles bearing bulky solubilizing groups and those functionalized either with hydroxymethyl or ester groups followed by chromatographic isolation of the low-symmetry target complexes. The CH2OH-substituted complexes can then be oxidized using iodoxybenzoic acid to form an aldehyde followed by oxidation to form a -COOH group by using NaClO2 in the presence of sulfamic acid [6,26,27]. Recently, direct oxidation of Zn[(tBu)3(CH2OH)Pc] to the corresponding carboxy-substituted complex was reported; the anaerobic reaction of the specified complex with KOH catalyzed by ZnO furnished the well-known TT1 dye [28]. Ester-substituted Pcs can be hydrolyzed to form target complexes bearing -COOH groups [8,9]. This method was selected for use in this study (Scheme 1).
Synthesis of A3B-Pcs was performed from the previously reported precursors–4,5-bis(2,6-diisopropylphenoxy)- or 4-chloro-5-(2,6-diisopropylphenoxy)-substituted phthalonitriles 1 and 2 for the A ring moieties, and methyl-3,4-dicyanobenzoate 3 or dimethyl-4,5-dicyanophthalate 4 on the B ring moieties. Condensation of the corresponding pairs of precursors in refluxing n-pentanol in the presence of Zn(OAc)2 and DBU afforded mixtures containing mainly the A4, A3B and A2B2 macrocyclic products. Because of transesterification, methyl groups were replaced by amyl residues, which decreased the overall polarity of the resulting complexes and hampered chromatographic separation of the A3B product from the A4 and A2B2 structures. Hydrolysis of ester bonds in ZnPcAm14 resulted in the formation of the acid groups of the target compounds, which can be readily separated, from traces of the relatively nonpolar A4 and the much more polar A2B2 derivatives. Control over the separation was achieved by thin-layer chromatography (TLC) and matrix-assisted laser desorption ionization-time-of-flight (MALDI-TOF) mass spectrometry. All complexes isolated were characterized by UV-vis and 1H NMR spectroscopy (See Supplementary Materials).
The UV-vis and magnetic circular dichroism (MCD) spectra of ZnPc14 (Figure 2) were measured in DMF to suppress their aggregation properties so the spectral properties of the monomeric complexes can be compared with those of ZnPc*, a fully symmetric A4 compound with sterically demanding substituents that was isolated as a byproduct during the synthesis of ZnPc1 and ZnPc2. The introduction of electron-withdrawing carboxy-groups and/or chlorine atoms has only a relatively minor effect on the Q-band wavelengths, resulting in a bathochromic shift of up to 7 nm relative to that of the symmetric ZnPc* reference compound.
The effect of introducing the peripheral substituents was analyzed through a comparison of the experimental spectral data with the TD-DFT and sTD-DFT calculations. In contrast to previous studies of substituted phthalocyanines where bulky alkoxy and aryloxy groups were truncated and replaced with methoxy groups to save computational time [22,23,24,25], in the present work, all calculations were performed for molecules with genuine diisopropylphenoxy substituents to further demonstrate the capabilities of the sTD-DFT approach in the context of a desktop computer.
The optical properties of porphyrinoid complexes, such as phthalocyanines, can be readily conceptualized through a consideration of the molecular orbitals (MOs) associated with the 16 atom 18 π-electron inner ligand perimeter that have an ML = 0, ±1, ±2, ±3, ±4, ±5, ±6, ±7, 8 sequence in ascending energy terms [29,30]. The highest occupied molecular orbital (HOMO) and lowest unoccupied molecular orbital (LUMO) have ML = ±4 and ±5 angular nodal patterns, respectively, resulting in Q and B bands with ΔML = ±1 and ±9 properties at lower and higher energy. Michl [30] introduced an a, s, -a and -s nomenclature for the MOs derived from the four frontier π-MOs of a C16H162− parent perimeter (Figure 3), depending on whether there are nodal planes (a/-a) and MO coefficients (s/-s) aligned with the y-axis, which enables the facile comparison of the electronic structures of cyclic polyenes of differing symmetry. In the context of phthalocyanines, the peripheral benzo ring substitution introduces a second frontier π-MO with a2u symmetry [29,31,32,33] that complicates the analysis of the electronic structures of phthalocyanines (Figure 4).
Spectral band deconvolution studies for a series of axially ligated ZnIIPc complexes by Nyokong and coworkers identified the presence of two intense overlapping Faraday A1 terms in the B band region [34] that were subsequently labelled as the B1 and B2 bands [4,35,36,37,38,39,40]. These bands can be assigned primarily to the 1a2u→-a/-s and 1b2u→-a/-s one-electron transitions on the basis of the molecular modelling at the B3LYP/6-31G(d) level of theory (Table 1 and Table 2). For this reason, the 1a2u MO (Figure 3) has previously been assumed to be the s MO of ZnPc in the context of Michl’s perimeter model [4,22,33,41].
The assignment of the higher energy ππ* transitions of ZnPc14 and ZnPc* in the B band region is problematic due to the complicated configurational interaction that is predicted, but broadly similar trends are predicted in the TD-DFT and sTD-DFT calculations (Figure 5, Table 1 and Table 2). An extra intense band is predicted in the 300−400 nm region in the sTD-DFT calculations for ZnPc14 and ZnPc* and in the TD-DFT calculations for ZnPc1, ZnPc2 and ZnPc* (Figure 5) due to the mesomeric effects of the oxygen lone pairs of the peripheral substituents on MOs that are localized primarily on the peripheral benzo rings. A marked destabilization is predicted for these MOs, which includes the 1a2u MO in the context of ZnPc* (Figure 4 and Figure 5, Table 1 and Table 2). It is hence reasonable to conclude that the 2a2u→-a/-s one-electron transitions are likely to dominate in the context of the main B band of ZnPc* as is predicted in the TD-DFT and sTD-DFT calculations (Figure 5, Table 1 and Table 2).
The predicted energy gaps between the MOs of ZnPc14 that are derived from the 1a1u and 2a2u MOs of the ZnPc parent complex are significantly smaller than is the case with ZnPc* (Figure 4), since it is only the MOs derived from the 1b1u and 1eg MOs of ZnPc that are significantly destabilized by the presence of six or three diisopropylphenoxy groups in this context. As a result, multiple bands involving large contributions from the 1a2u→-a/-s and 2a2u→-a/-s one-electron transitions are predicted in the B band region in both the TD-DFT and sTD-DFT calculations (Table 1 and Table 2). In contrast with the complexity of the calculated spectra of ZnPc14 and ZnPc* (Figure 5), only a relatively weak shoulder of absorbance is observed to the red of the main B band envelope in the experimental spectra (Figure 2). In a similar manner, only relatively minor differences are observed in the Faraday A1 and pseudo-A1 terms in the B band regions of the MCD spectra of ZnPc* and ZnPc14 (Figure 2). These are likely to be associated with the large orbital angular momentum generated by transitions between the s, -a and -s MOs with ML = ±4 and ±5 angular nodal properties that are largely localized on the inner ligand perimeter [30,38,39]. The MCD spectra in Figure 2 therefore provide direct spectroscopic evidence that the TD-DFT and sTDDFT calculations in Figure 5 do not provide an accurate description of the B band region. In contrast with the relatively consistent Faraday A1 and pseudo-A1 term band morphology that is observed in the B band region of the MCD spectra for ZnPc* and ZnPc14, substantial differences are predicted in the wavefunctions in the B band region in Table 1 and Table 2 and the simulated spectra in Figure 5. Extensive configurational interactions between a large number of ππ* excited states result in significant differences in the contributions from the 1a2u→-a/-s and 2a2u→-a/-s one-electron transitions which are highlighted in bold face in Table 1 and Table 2.

3. Discussion

The TD-DFT and sTD-DFT calculations (Figure 5, Table 1 and Table 2) generally reproduce trends observed in the experimental spectra in the Q band region (Figure 2 and Figure 5), which are often the most significant from the standpoint of applications such as DSSCs. The simplified approximation has the advantage of a spectacular speed-up in computation time, but the mesomeric interactions of the carboxylic acid moieties are somewhat problematic in the context of the sTD-DFT calculations. The partial replacement of the electron-donating diisopropylphenoxyl substituents of ZnPc* with electron-withdrawing carboxylic acid groups and chlorine atoms (Figure 1) results in a stabilization of the energies of the frontier orbitals of ZnPc14 (Figure 4). Lower molecular symmetry results in a lifting of the degeneracy of the -a and -s MOs. Larger ΔLUMO values (Michl’s terminology for the energy splitting of the -a and -s MOs [30]) are predicted for the dicarboxylic acid substituted ZnPc2 and ZnPc4 complexes, since there are large MO coefficients on the peripheral carbons of the B ring moiety of the -a MOs, but not on those of the -s MOs (Figure 3). The electron-withdrawing mesomeric interaction with the carboxylic acid groups is hence expected to stabilize the -a MOs relative to the -s MOs and result in separate x- and y-polarized Q00 bands.
Q band splittings of 29 and 59 nm are predicted for ZnPc2 in the TD-DFT and sTD-DFT calculations (Table 1 and Table 2), respectively, while smaller splittings of 23 and 45 nm are predicted for ZnPc4 which has both a chlorine atoms and an isopropylphenoxyl substituent on the A3 benzo ring moieties. These bands are not resolved in the experimental spectra although significant broadening is observed in the Q00 bands of ZnPc2 and ZnPc4 relative to that of ZnPc* (Figure 2). It is hence apparent that the extent of the Q band splitting associated with the mesomeric interactions with the carboxylic acid substituents is over-estimated in the sTD-DFT calculations of ZnPc14. This results in a significant under-estimation of the energies of the lower energy Q00 bands (Table 1). In contrast, there is a systematic over-estimation of the Q00 band energies in the TD-DFT calculations at the B3LYP/6-31G(d) level of theory (Table 2) as has been reported previously for calculations of this type for a wide range of different porphyrins and phthalocyanine-related structures [17,33,41,44,45].
Since the envisaged application for ZnPc14 is in DSSCs as photosensitizer dyes coating the TiO2 photoanode, a preliminary assessment of relevant parameters [46,47,48,49,50] was calculated on the basis of single point DFT calculations (Table 3) using the optimized geometries of the dyes at the B3LYP/SDD level of theory. Since the LUMO energies (Figure 6) are higher than that of the conduction band (CB) of TiO2 [46,50], injection of an electron into the TiO2 photoanode of the DSSC after photoexcitation should be feasible. Favorable open circuit voltage (Voc) values are predicted to lie in the 1.08−1.41 eV range for ZnPc14 (Table 3). Spontaneous Gibbs free energies are predicted for the electron injection (ΔGinj) and dye regeneration (ΔGregen) processes shown in Figure 6 that are required to complete the circuit of the DSSC [46,50]. Favorable light-harvesting efficiency (LHE) values were also derived for the maxima of the Q bands using the oscillator strength (f) values from Table 1. Since these parameters appear to be promising, laboratory studies with DSSCs are already in progress to further assess the suitability of ZnPc14 for this application.

4. Materials and Methods

4.1. Materials

The 4,5-bis(2,6-diisopropylphenoxy)phthalonitrile 1 [52], 4-chloro-5- (2,6-diisopropyl-phenoxy)phthalonitrile 2 [53], methyl-3,4-dicyanobenzoate 3 [54], and dimethyl-4,5-dicyanophthalate 4 [55,56] precursors were synthesized according to the previously reported procedures. Anhydrous zinc acetate was obtained by drying the corresponding dihydrate at 90 C in vacuo. 1,8-Diazabicyclo[5.4.0]undec-7-ene (DBU, Aldrich) was vacuum distilled over CaH2 and stored under argon. Chloroform (puris) was distilled over CaH2, n-pentanol (Aldrich) was distilled over Mg and stored under argon. Column chromatography was performed on silica (0.063–0.2 mm, Macherey-Nagel).

4.2. Methods

MALDI-TOF mass spectra were measured on a Bruker Daltonics Ultraflex mass spectrometer in positive ion mode with 2,5-dihydroxybenzoic acid (DHB) as a matrix. UV-visible absorption (UV-vis) spectra were recorded in CHCl3 on a Thermo Evolution 210 spectrometer in the 250–900 nm range. Rectangular quartz cuvettes with a 10 nm optical pathlength were used. NMR spectra were measured on a Bruker Avance-III spectrometer at a frequency of 600.13 MHz. Samples were prepared in CDCl3 (Cambridge Isotope Laboratories, Inc.), and filtered through a layer of alumina before use. Spectra were acquired at ambient temperatures. NMR spectra were referenced to the solvent signal (CHCl3, 7.26 ppm). Magnetic circular dichroism (MCD) spectra were recorded with a Chirascan plus spectrometer (Applied Photophysics, UK) equipped with a 1.0 tesla permanent magnet by using both parallel and antiparallel fields.

4.3. Computational Details

Geometry optimizations were carried out for unsubstituted ZnPc (ZnPc) as a model complex, and ZnPc* and ZnPc14 at the B3LYP/6-31G(d) level of theory by using the Gaussian 09 software package [57]. Conventional TD-DFT calculations were carried out at the CAM-B3LYP/SDD level of theory since the CAM-B3LYP functional contains a long-range correction, while sTD-DFT calculations [21,22] were performed with the ORCA 5.0 package [58] using B3LYP/6-31G(d) optimized geometries. The MO energies and angular nodal patterns of ZnPc, ZnPc* and ZnPc14 were calculated at the CAM-B3LYP/6-31G(d) level of theory [59,60,61]. The RIJCOSX approximation with auxiliary basis set def2/J was used to speed-up the sTD-DFT calculations [62,63]. Only the isomers shown for ZnPc14 in Figure 4 are analysed in this study, since the calculated spectra of the other possible isomers were found to be broadly similar to those reported.

4.4. Synthesis

Zinc 2-carboxy-9,10,16,17,23,24-hexakis(2,6-diisopropylphenoxy)phthalocyaninate (ZnPc1). A mixture of phthalonitrile 1 (300 mg, 0.6 mmol) and 3 (42 mg, 0.2 mmol), zinc acetate (76 mg, 0.4 mmol) and 1,8-diazabicyclo[5.4.0]undec-7-ene (DBU) (125 μL, 0.8 mmol) in n-pentanol (5 mL) was degassed and refluxed under argon overnight. Then, n-pentanol was evaporated, and the dark-green sticky residue was sonicated with 50 vol. % aqueous EtOH, the precipitate was filtered, and washed with 50 vol. % aqueous ethanol. The dark-green solid was washed off the filter with chloroform. After solvent evaporation, this mixture of products was separated by column chromatography on silica through a gradient elution by a mixture of chloroform with hexane (30 → 0 vol. %), then with methanol (0 → 9 vol. %). The target (pentoxycarbonyl)phthalocyanine ZnPcAm1 was eluted with a mixture containing 10 and 0 vol. % hexane, whereas some amounts of the hydrolysed product ZnPc1 were eluted with a mixture containing 1–5 vol. % methanol. These fractions were combined, and the solvents were evaporated to give a dark green powder, which was used for hydrolysis without further purification.
The resulting product was mixed with a saturated aqueous sodium hydroxide solution (3 mL), dry tetrahydrofuran (3 mL), and methanol (10 mL). The solution was degassed and then heated to 40 °C with vigorous stirring under argon for 1.5 h. The hydrolysis was monitored by thin-layer chromatography (TLC) [silica, hexane/acetone, 1:1 (v/v)]. During the hydrolysis reaction, the Rf of the reaction mixture decreased to zero providing evidence for the production of the sodium salt of the target compound. The reaction mixture was then diluted with water (50 mL), acidified with concentrated hydrochloric acid to pH 3 and extracted with chloroform (3 × 20 mL). Chloroform was evaporated from organic extracts, and the dark green residue was dried in vacuo. The ZnPc1 target complex was isolated by column chromatography on silica, eluting with dichloromethane + 0→6 vol. % methanol, followed by size-exclusion chromatography on Bio-Beads SX-1 (isocratic elution with a chloroform–methanol 2.5 vol. % mixture). Dark-green powder. Yield: 66 mg, 17%. ZnPcAm1: MALDI TOF, m/z calcd for C110H122N8O8Zn 1748.9, found 1748.5 [M+]. ZnPc1: MALDI TOF, m/z calcd for C105H112N8O8Zn 1678.8, found 1678.5 [M+]. UV-vis (DMF), λmax/nm (log ε) 261 (4.4), 288 (4.6), 359 (4.9), 612 (4.5), 678 (5.3). 1H NMR (600 MHz, Chloroform-d + 1/50 (v/v) pyridine-d5) δ 9.95 (s, 1H), 9.31 (d, J = 7.6 Hz, 1H), 8.84 (d, J = 6.9 Hz, 1H) (HʹPc, HʹʹPc, HʹʹʹPc), 8.40 (d, J = 19.2 Hz, 2H), 8.20 (d, J = 8.6 Hz, 2H), 8.16 (d, J = 4.9 Hz, 2H) (HPc), 7.56 (d, J = 7.8 Hz, 6H), 7.47 (d, J = 7.9 Hz, 10H), 7.38 (s, 2H) (m,p-HOAr), 3.46 (q, 12H, HiPr), 1.36–1.23 (m, 72H, HMe).
Zinc 2,3-dicarboxy-9,10,16,17,23,24-hexakis(2,6-diisopropylphenoxy)phthalocyaninate (ZnPc2). The complex was synthesized by mixing phthalonitrile 1 (300 mg, 0.6 mmol) and 4 (54 mg, 0.2 mmol), Zn(OAc)2 (76 mg, 0.4 mmol) and DBU (0.13 mg, 0.8 mmol) in n-pentanol (5 mL) using the above-described procedure for ZnPc1. Dark green powder. Yield: 53 mg, 14%. ZnPcAm2: (MALDI TOF): m/z calcd for C116H132N8O10Zn 1862.9, found 1862.8 [M+]. ZnPc2: MALDI TOF, m/z calcd for C106H112N8O10Zn 1722.8, found 1722.4 [M+]. UV-vis (DMF), λmax/nm (log ε) 289 (4.8), 360 (5.2), 615 (4.8), 682 (5.6). 1H NMR (300 MHz, Chloroform-d + 1/50 (v/v) pyridine-d5) δ 9.82 (s, 2H, HʹPc), 8.37 (s, 2H), 8.19 (s, 2H), 8.14 (s, 2H) (HPc), 7.63–7.52 (m, 6H), 7.49–7.43 (m, 12H) (m,p-HOAr), 3.46 (q, J = 6.1 Hz, 12H, HiPr), 1.28 (d, J = 21.7 Hz, 72H, HMe).
Zinc 2-carboxy-9(10),16(17),23(24)-trichloro-10(9),17(16),24(23)-tris(2,6-diisopropylphenoxy) phthalocyaninate (ZnPc3). The complex was synthesized starting from phthalonitriles 2 (300 mg, 0.9 mmol) and 3 (55 mg, 0.3 mmol), Zn(OAc)2 (110 mg, 0.6 mmol) and DBU (0.18 mg, 1.1 mmol) in n-pentanol (5 mL) using the above-described procedure for ZnPc1. Bluish-green powder. Yield: 56 mg, 15%. ZnPcAm3: MALDI TOF, m/z calcd for C74H71Cl3N8O5Zn 1324.3, found 1322.4 [M+]. ZnPc3: MALDI TOF m/z calcd for C69H61Cl3N8O5Zn 1252.3, found 1254.0 [M+], 1276.0 [M + Na − H]+, 1292.0 [M + K − H]+. UV-vis (DMF): λmax / nm (log ε): 283 (4.7), 357 (5.0), 612 (4.7), 679 (5.4). 1H NMR (600 MHz, Chloroform-d + 1/50 (v/v) pyridine-d5) δ 9.84 (s, 1H), 9.47 (m, J = 8.2 Hz, 1H), 9.20 (s, 1H) (HʹPc, HʹʹPc, HʹʹʹPc), 8.69 (s, 2H), 8.41 (s, 2H), 8.15 (s, 2H) (HaPc, HbPc), 7.57–7.53 (m, 3H), 7.49–7.43 (m, 6H) (m,p-HOAr), 3.34–3.24 (m, 6H, HiPr), 1.40–1.14 (m, 36H, HMe).
Zinc 2,3-dicarboxy-9(10),16(17),23(24)-trichloro-10(9),17(16),24(23)-tris(2,6-diisopropylphenoxy)phthalocyaninate (ZnPc4). The complex was synthesized starting from phthalonitriles 2 (300 mg, 0.9 mmol) and 4 (72 mg, 0.3 mmol), Zn(OAc)2 (110 mg, 0.6 mmol) and DBU (0.18 mg, 1.1 mmol) in n-pentanol (5 mL) using the above-described procedure for ZnPc1. Bluish-green powder. Yield: 74 mg, 19%. ZnPcAm4: MALDI TOF, m/z calcd for C80H81Cl3N8O7Zn 1437.5, found 1437.4 [M+]. ZnPc4: MALDI TOF, m/z calcd for C70H61Cl3N8O7Zn 1296.3, found 1297.6 [M + H+]. UV-vis (DMF): λmax / nm (log ε): 284 (4.6), 356 (4.9), 618 (4.6), 683 (5.1). 1H NMR (600 MHz, DMSO-d6) δ 9.66–9.54 (m, 2H, HʹPc), 8.02 (s, 3H, HaPc), 7.73 (d, J = 7.6 Hz, 3H), 7.63–7.56 (m, 6H) (m,p-HOAr), 7.31 (s, 3H, HbPc), 1.32 (s, 36H, HMe).
Zinc 2,3,9,10,16,17,23,24-octakis(2,6-di-isopropylphenoxy)phthalocyaninate (ZnPc*). This product was obtained as a by-product in the synthesis of ZnPc1 and ZnPc2 as a green powder. MALDI TOF: m/z calcd for C128H144N8O8Zn 1987.0, found 1986.7 [M+]. UV-vis (DMF), λmax/nm (log ε): 288 (4.8), 359 (5.0), 611 (4.6), 677 (5.4). 1H NMR (300 MHz, Chloroform-d + 1/50 (v/v) CD3OD) δ 8.16 (s, 8H, HPc), 7.60–7.51 (m, 8H, m-HOAr), 7.47 (d, J = 8.3 Hz, 16H, p-HOAr), 3.47 (q, J = 6.8 Hz, 16H, HiPr), 1.30 (s, 96H, HMe).

5. Conclusions

The rational design of novel phthalocyanine dyes for applications such as DSSCs is complicated by the challenging modelling calculations that are involved in the absence of access to a large computer cluster. This study demonstrates that the simplified sTD-DFT approach can rapidly provide useful information to predict or interpret the spectral trends observed in the Q band region of the UV-vis absorption spectra of π-extended chromophores such as ZnPc14 and ZnPc*. However, tt is noteworthy that the extent of the splitting of the Q band into x- and y-polarized components is over-estimated in the context of the lower symmetry ZnPc14 complexes. It is clear from this series of test calculations for ZnPc complexes with peripheral substituents that introduce large mesomeric and inductive interactions with the π-system of the Pc ligand that the predictions made in the higher energy B band region in both TD-DFT and sTD-DFT calculations need to be treated cautiously. No significant extra insight is likely to be provided by the significantly longer calculation times associated with the conventional TD-DFT approach.

Supplementary Materials

The following supporting information can be downloaded. Figures S1–S5—1H-NMR spectra of synthesized complexes; Figures S6–S10—MALDI-TOF mass-spectra of synthesized complexes; Figures S11–S15—UV-vis spectra of synthesized complexes; Tables S1–S5—Cartesian coordinates of computed structures.

Author Contributions

Conceptualization, A.G.M. and Y.G.G.; Funding acquisition, Y.G.G. and T.N.; Investigation, D.A.B., N.N. and A.G.M.; Project administration, Y.G.G. and T.N.; Resources, J.M., Y.G.G. and T.N.; Visualization, A.G.M. and J.M.; Writing—original draft, D.A.B., A.G.M. and J.M.; Writing—review and editing, A.G.M., J.M., Y.G.G. and T.N. All authors have read and agreed to the published version of the manuscript.

Funding

This research was funded by the Russian Foundation for Basic Research (grant 19-53-60001) and the National Research Foundation of South Africa (uid: 118908/62620).

Institutional Review Board Statement

Not applicable.

Informed Consent Statement

Not applicable.

Data Availability Statement

Data is contained within the article or Supplementary Materials.

Acknowledgments

NMR and MALDI-TOF measurements were performed using the equipment of CKP FMI IPCE RAS and IGIC RAS. Theoretical calculations with the Gaussian 09 software package were carried out at the Centre for High Performance Computing in Cape Town.

Conflicts of Interest

The authors declare no conflict of interest.
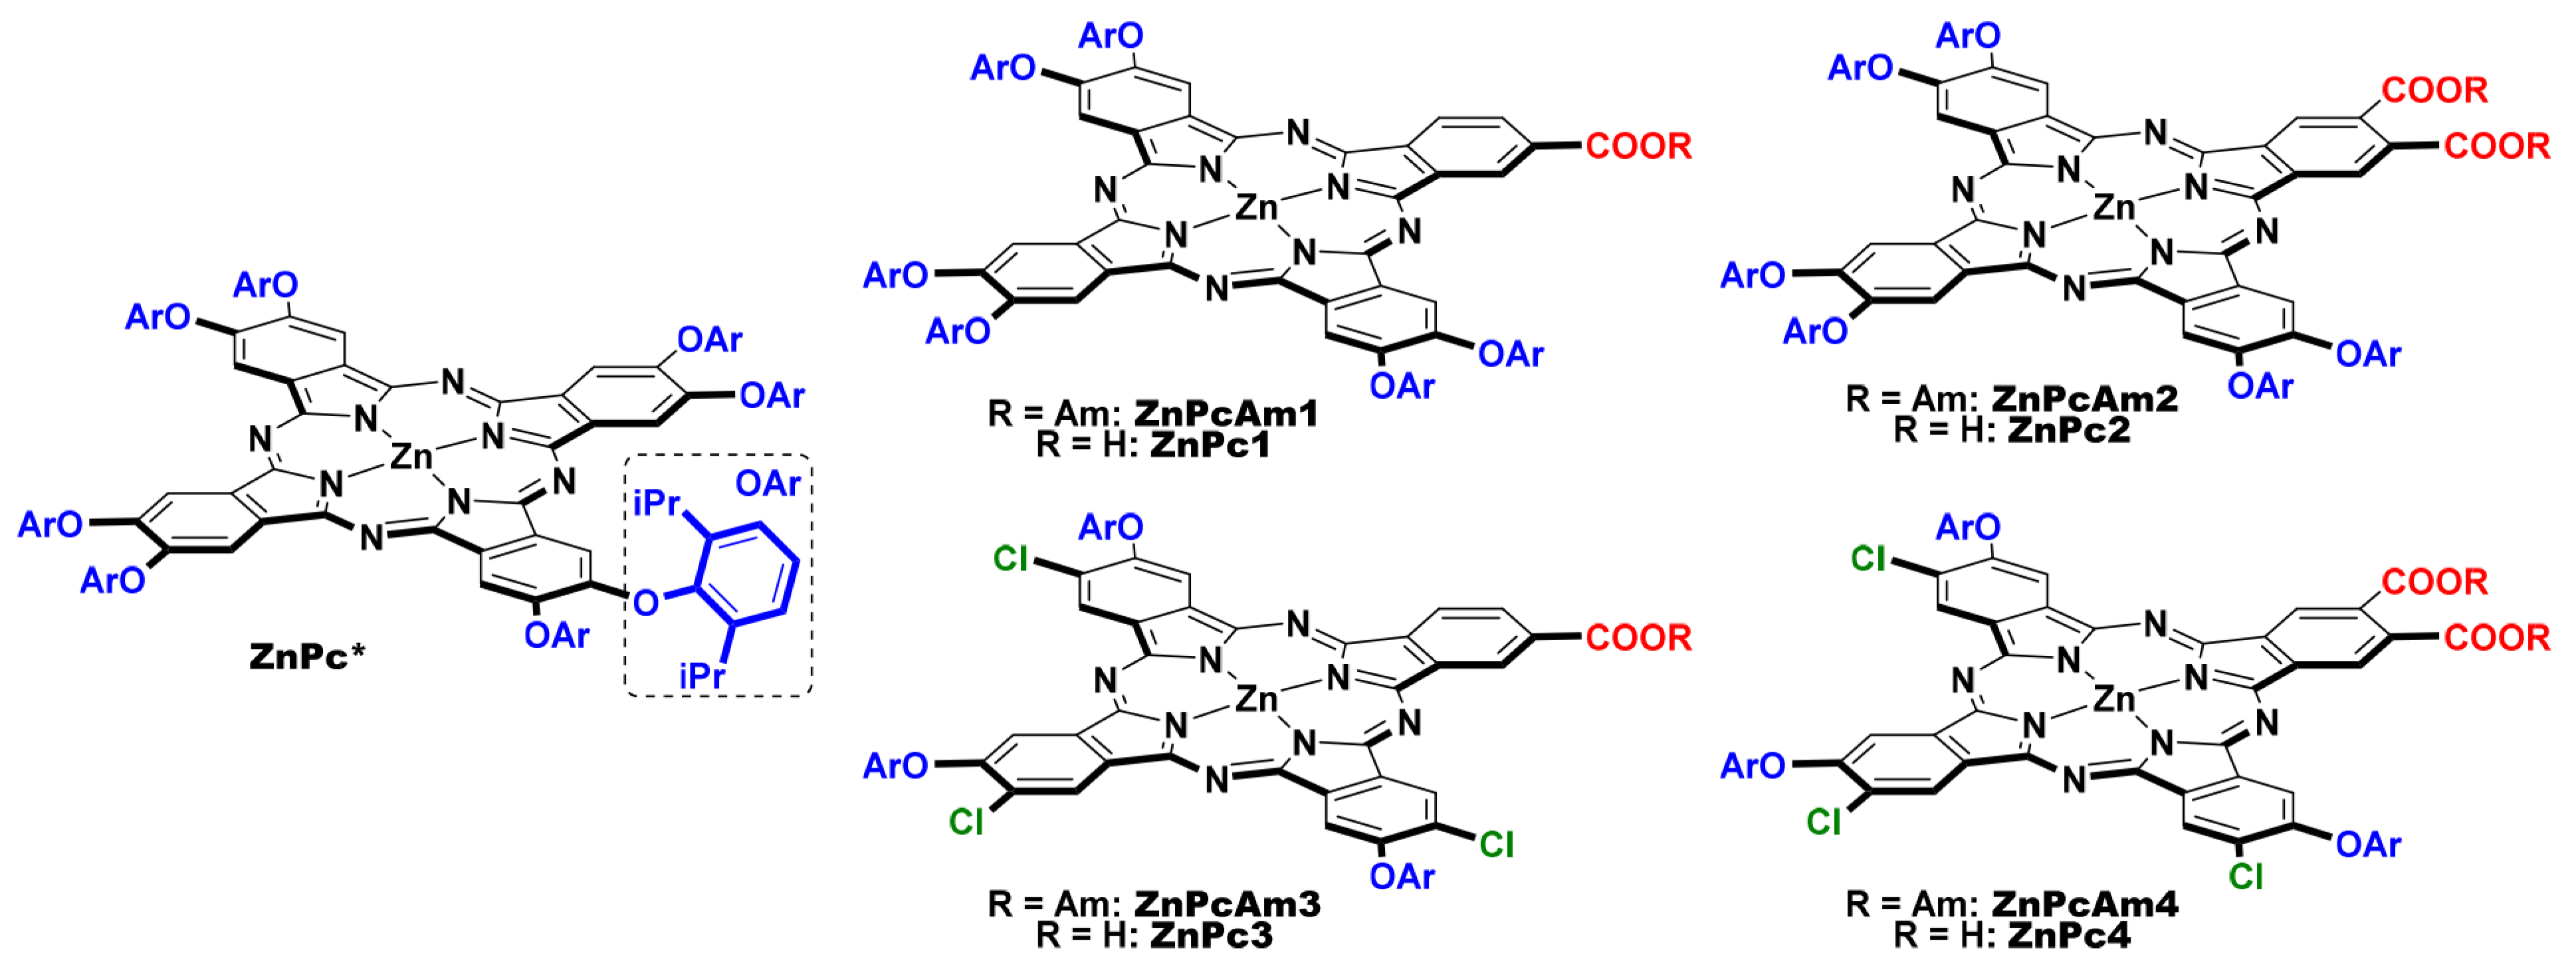
Sample Availability: Samples of ZnPc1−4 are available from the authors.

References

  1. Lukyanets, E.A.; Nemykin, V.N. The key role of peripheral substituents in the chemistry of phthalocyanines and their analogs. J. Porphyr. Phthalocyanines 2010, 14, 1–40. [Google Scholar] [CrossRef] [Green Version]
  2. Nyokong, T.; Ahsen, V. (Eds.) Photosensitizers in Medicine, Environment, and Security; Springer: Dordrecht, The Netherlands, 2012; ISBN 978-90-481-3870-8. [Google Scholar]
  3. Koifman, O.I.; Ageeva, T.A.; Beletskaya, I.P.; Averin, A.D.; Yakushev, A.A.; Tomilova, L.G.; Dubinina, T.V.; Tsivadze, A.Y.; Gorbunova, Y.G.; Martynov, A.G.; et al. Macroheterocyclic Compound-a Key Building Block in New Functional Materials and Molecular Devices. Macroheterocycles 2020, 13, 311–467. [Google Scholar] [CrossRef]
  4. Mack, J.; Kobayashi, N. Low symmetry phthalocyanines and their analogues. Chem. Rev. 2011, 111, 281–321. [Google Scholar] [CrossRef] [PubMed]
  5. Urbani, M.; Ragoussi, M.E.; Nazeeruddin, M.K.; Torres, T.; Khaja, M. Phthalocyanines for dye-sensitized solar cells. Coord. Chem. Rev. 2019, 381, 1–64. [Google Scholar] [CrossRef]
  6. Cid, J.J.; Yum, J.H.; Jang, S.R.; Nazeeruddin, M.K.; Martínez-Ferrero, E.; Palomares, E.; Ko, J.; Grätzel, M.; Torres, T. Molecular cosensitization for efficient panchromatic dye-sensitized solar cells. Angew. Chem. Int. Ed. 2007, 46, 8358–8362. [Google Scholar] [CrossRef]
  7. Tortelli, S.; Cavazzini, M.; Orlandi, S.; Pozzi, G.; Pecnikaj, I.; Caramori, S.; Boaretto, R. Property tuning in unsymmetrical alkoxy zinc phthalocyanines by introduction of perfluoro-tert-butoxy end groups. J. Fluor. Chem. 2016, 188, 110–116. [Google Scholar] [CrossRef]
  8. Ikeuchi, T.; Mori, S.; Kobayashi, N.; Kimura, M. Low-Symmetrical Zinc(II) Benzonaphthoporphyrazine Sensitizers for Light-Harvesting in Near-IR Region of Dye-Sensitized Solar Cells. Inorg. Chem. 2016, 55, 5014–5018. [Google Scholar] [CrossRef]
  9. Ikeuchi, T.; Nomoto, H.; Masaki, N.; Griffith, M.J.; Mori, S.; Kimura, M. Molecular engineering of zinc phthalocyanine sensitizers for efficient dye-sensitized solar cells. Chem. Commun. 2014, 50, 1941. [Google Scholar] [CrossRef]
  10. Kimura, M.; Nomoto, H.; Suzuki, H.; Ikeuchi, T.; Matsuzaki, H.; Murakami, T.N.; Furube, A.; Masaki, N.; Griffith, M.J.; Mori, S. Molecular Design Rule of Phthalocyanine Dyes for Highly Efficient Near-IR Performance in Dye-Sensitized Solar Cells. Chem.-A Eur. J. 2013, 19, 7496–7502. [Google Scholar] [CrossRef]
  11. Virkki, K.; Hakola, H.; Urbani, M.; Tejerina, L.; Ince, M.; Martínez-Díaz, M.V.; Torres, T.; Golovanova, V.; Golovanov, V.; Tkachenko, N.V. Photoinduced Electron Injection from Zinc Phthalocyanines into Zinc Oxide Nanorods: Aggregation Effects. J. Phys. Chem. C 2017, 121, 9594–9605. [Google Scholar] [CrossRef]
  12. Nombona, N.; Antunes, E.; Litwinski, C.; Nyokong, T. Synthesis and photophysical studies of phthalocyanine-gold nanoparticle conjugates. Dalton Trans. 2011, 40, 11876. [Google Scholar] [CrossRef]
  13. Ballesteros, B.; Campidelli, S.; de la Torre, G.; Ehli, C.; Guldi, D.M.; Prato, M.; Torres, T. Synthesis, characterization and photophysical properties of a SWNT-phthalocyanine hybrid. Chem. Commun. 2007, 2950. [Google Scholar] [CrossRef]
  14. Yang, L.; Guo, L.; Chen, Q.; Sun, H.; Liu, J.; Zhang, X.; Pan, X.; Dai, S. Theoretical design and screening of panchromatic phthalocyanine sensitizers derived from TT1 for dye-sensitized solar cells. J. Mol. Graph. Model. 2012, 34, 1–9. [Google Scholar] [CrossRef]
  15. Milan, R.; Selopal, G.S.; Cavazzini, M.; Orlandi, S.; Boaretto, R.; Caramori, S.; Concina, I.; Pozzi, G. Dye-sensitized solar cells based on a push-pull zinc phthalocyanine bearing diphenylamine donor groups: Computational predictions face experimental reality. Sci. Rep. 2017, 7, 1–10. [Google Scholar] [CrossRef] [PubMed] [Green Version]
  16. Milan, R.; Singh Selopal, G.; Cavazzini, M.; Orlandi, S.; Boaretto, R.; Caramori, S.; Concina, I.; Pozzi, G. Zinc phthalocyanines as light harvesters for SnO2-based solar cells: A case study. Sci. Rep. 2020, 10, 1–9. [Google Scholar] [CrossRef] [PubMed] [Green Version]
  17. Mack, J.; Bunya, M.; Shimizu, Y.; Uoyama, H.; Komobuchi, N.; Okujima, T.; Uno, H.; Ito, S.; Stillman, M.J.; Ono, N.; et al. Application of MCD spectroscopy and TD-DFT to nonplanar core-modified tetrabenzoporphyrins: Effect of reduced symmetry on nonplanar porphyrinoids. Chem. Eur. J. 2008, 14, 5001–5020. [Google Scholar] [CrossRef] [PubMed]
  18. Hoshi, T.; Kobayashi, N. Spectroscopic and structural properties of phthalocyanines deduced from their frontier molecular orbitals (MOs) and MO calculations. Coord. Chem. Rev. 2017, 345, 31–41. [Google Scholar] [CrossRef]
  19. Nemykin, V.N.; Hadt, R.G.; Belosludov, R.V.; Mizuseki, H.; Kawazoe, Y. Influence of Molecular Geometry, Exchange-Correlation Functional, and Solvent Effects in the Modeling of Vertical Excitation Energies in Phthalocyanines Using Time-Dependent Density Functional Theory (TDDFT) and Polarized Continuum Model TDDFT Methods: Ca. J. Phys. Chem. A 2007, 111, 12901–12913. [Google Scholar] [CrossRef] [PubMed] [Green Version]
  20. Belosludov, R.V.; Nevonen, D.; Rhoda, H.M.; Sabin, J.R.; Nemykin, V.N. Simultaneous Prediction of the Energies of Q x and Q y Bands and Intramolecular Charge-Transfer Transitions in Benzoannulated and Non-Peripherally Substituted Metal-Free Phthalocyanines and Their Analogues: No Standard TDDFT Silver Bullet Yet. J. Phys. Chem. A 2019, 123, 132–152. [Google Scholar] [CrossRef] [PubMed]
  21. Bannwarth, C.; Grimme, S. A simplified time-dependent density functional theory approach for electronic ultraviolet and circular dichroism spectra of very large molecules. Comput. Theor. Chem. 2014, 1040–1041, 45–53. [Google Scholar] [CrossRef]
  22. Martynov, A.G.; Mack, J.; May, A.K.; Nyokong, T.; Gorbunova, Y.G.; Tsivadze, A.Y. Methodological Survey of Simplified TD-DFT Methods for Fast and Accurate Interpretation of UV-Vis-NIR Spectra of Phthalocyanines. ACS Omega 2019, 4, 7265–7284. [Google Scholar] [CrossRef] [PubMed]
  23. Safonova, E.A.; Martynov, A.G.; Polovkova, M.A.; Ugolkova, E.A.; Minin, V.V.; Gorbunova, Y.G.; Tsivadze, A.Y. 5,8-Disubstituted crown-naphthalonitriles as a platform for highly soluble naphthalocyanines. Dye. Pigment. 2020, 180, 108484. [Google Scholar] [CrossRef]
  24. Yagodin, A.V.; Martynov, A.G.; Gorbunova, Y.G.; Tsivadze, A.Y. Synthesis, electronic structure and NH-tautomerism of novel mono- and dibenzoannelated phthalocyanines. Dye. Pigment. 2020, 181, 108564. [Google Scholar] [CrossRef]
  25. May, A.; Majumdar, P.; Martynov, A.G.; Lapkina, L.A.; Troyanov, S.I.; Gorbunova, Y.G.; Tsivadze, A.Y.; Mack, J.; Nyokong, T. Optical limiting properties, structure and simplified TD-DFT calculations of scandium tetra-15-crown-5 phthalocyaninates. J. Porphyr. Phthalocyanines 2020, 24, 589–601. [Google Scholar] [CrossRef]
  26. Tejerina, L.; Martínez-Díaz, M.V.; Torres, T. Convergent Strategy for the Regioselective Synthesis of Nonaggregated α-Triaryl-β-carboxy Zinc Phthalocyanines. Org. Lett. 2015, 17, 552–555. [Google Scholar] [CrossRef] [Green Version]
  27. Listorti, A.; López-Duarte, I.; Martínez-Díaz, M.V.; Torres, T.; DosSantos, T.; Barnes, P.R.F.; Durrant, J.R. Zn(ii) versus Ru(ii) phthalocyanine-sensitised solar cells. A comparison between singlet and triplet electron injectors. Energy Environ. Sci. 2010, 3, 1573–1579. [Google Scholar] [CrossRef]
  28. Aktas, E.; Jiménez-López, J.; Azizi, K.; Torres, T.; Palomares, E. Self-assembled Zn phthalocyanine as a robust p-type selective contact in perovskite solar cells. Nanoscale Horiz. 2020, 5, 1415–1419. [Google Scholar] [CrossRef]
  29. Gouterman, M. Optical Spectra and Electronic Structure of Porphyrins and Related Rings. In The Porphyrins; Dolphin, D., Ed.; Academic Press: New York, NY, USA, 1978; Volume III, pp. 1–165. [Google Scholar]
  30. Michl, J. Magnetic circular dichroism of aromatic molecules. Tetrahedron 1984, 40, 3845–3934. [Google Scholar] [CrossRef]
  31. Schaffer, A.M.; Gouterman, M.; Davidson, E.R. Porphyrins XXVIII. Extended Hückel calculations on metal phthalocyanines and tetrazaporphins. Theor. Chim. Acta 1973, 30, 9–30. [Google Scholar] [CrossRef]
  32. McHugh, A.J.; Gouterman, M.; Weiss, C. Porphyrins XXIV. Energy, oscillator strength, and Zeeman splitting calculations (SCMO-CI) for phthalocyanine, porphyrins, and related ring systems. Theor. Chim. Acta 1972, 24, 346–370. [Google Scholar] [CrossRef] [Green Version]
  33. Mack, J.; Wildervanck, M.; Nyokong, T. TD-DFT calculations and MCD spectroscopy of porphyrin and phthalocyanine analogues: Rational design of photosensitizers for PDT and NIR region sensor applications. Turk. J. Chem. 2014, 38, 1013–1026. [Google Scholar] [CrossRef]
  34. Nyokong, T.; Gasyna, Z.; Stillman, M.J. Analysis of the absorption and magnetic circular dichroism spectra of zinc phthalocyanine and the. pi.-cation-radical species [ZnPc(1−)].cntdot.+. Inorg. Chem. 1987, 26, 1087–1095. [Google Scholar] [CrossRef]
  35. Ough, E.; Nyokong, T.; Creber, K.A.M.; Stillman, M.J. Electrochemistry and Spectroscopy of Magnesium Phthalocyanine. Analysis of the Absorption and Magnetic Circular Dichroism Spectra. Inorg. Chem. 1988, 27, 2724–2732. [Google Scholar] [CrossRef]
  36. Stillman, M.J.; Nyokong, T. Absorption and Magnetic Circular Dichroism Spectral Properties of Phthalocyanines. Part 1: Complexes of the Dianion, Pc(-2). In Phthalocyanines: Properties and Applications 1; Leznoff, C.C., Lever, A.B.P., Eds.; VCH: Weinheim, Germany, 1989; pp. 133–289. [Google Scholar]
  37. Mack, J.; Stillman, M.J. Electronic Structures of Metal Phthalocyanine and Porphyrin Complexes from Analysis of the UV–Visible Absorption and Magnetic Circular Dichroism Spectra and Molecular Orbital Calculations. In The Porphyrin Handbook; Kadish, K.M., Smith, K.M., Guilard, R., Eds.; Academic Press: New York, NY, USA, 2003; pp. 43–116. [Google Scholar]
  38. Mack, J.; Stillman, M.J.; Kobayashi, N. Application of MCD spectroscopy to porphyrinoids. Coord. Chem. Rev. 2007, 251, 429–453. [Google Scholar] [CrossRef]
  39. Kobayashi, N.; Nakai, K. Applications of magnetic circular dichroism spectroscopy to porphyrins and phthalocyanines. Chem. Commun. 2007, 4077. [Google Scholar] [CrossRef]
  40. Isago, H. Optical Spectra of Phthalocyanines and Related Compounds A Guide for Beginners; Springer: Berlin/Heidelberg, Germany, 2015; ISBN 978-4-431-55101-0. [Google Scholar]
  41. Mack, J.; Asano, Y.; Kobayashi, N.; Stillman, M.J. Application of MCD spectroscopy and TD-DFT to a highly non-planar porphyrinoid ring system. New insights on red-shifted porphyrinoid spectral bands. J. Am. Chem. Soc. 2005, 127, 17697–17711. [Google Scholar] [CrossRef] [PubMed]
  42. Chemcraft-Graphical Software for Visualization of Quantum Chemistry Computations. Available online: https://www.chemcraftprog.com (accessed on 12 December 2021).
  43. Chemissian 4.65 Program (by L. Skripnikov). Available online: https://www.chemissian.com/ (accessed on 12 December 2021).
  44. Mack, J. Expanded, Contracted, and Isomeric Porphyrins: Theoretical Aspects. Chem. Rev. 2017, 117, 3444–3478. [Google Scholar] [CrossRef]
  45. Lu, H.; Mack, J.; Yang, Y.; Shen, Z. Structural modification strategies for the rational design of red/NIR region BODIPYs. Chem. Soc. Rev. 2014, 43, 4778–4823. [Google Scholar] [CrossRef] [PubMed] [Green Version]
  46. Yasseen, F.A.; Al-Temimei, F.A. Electronic structures and photovoltaic properties of a novel phthalocyanine and titanium dioxide phthalocyanine for dye sensitized-solar cells. GSC Adv. Res. Rev. 2021, 6, 107–115. [Google Scholar] [CrossRef]
  47. Xiang, Y.; Zhang, J.; Zheng, S. Designing Potential Donor Materials Based on DRCN5T with Halogen Substitutions: A DFT/TDDFT Study. Int. J. Mol. Sci. 2021, 22, 13498. [Google Scholar] [CrossRef]
  48. Scharber, M.C.; Mühlbacher, D.; Koppe, M.; Denk, P.; Waldauf, C.; Heeger, A.J.; Brabec, C.J. Design Rules for Donors in Bulk-Heterojunction Solar Cells—Towards 10% Energy-Conversion Efficiency. Adv. Mater. 2006, 18, 789–794. [Google Scholar] [CrossRef]
  49. Bourass, M.; Benjelloun, A.T.; Benzakour, M.; Mcharfi, M.; Hamidi, M.; Bouzzine, S.M.; Bouachrine, M. DFT and TD-DFT calculation of new thienopyrazine-based small molecules for organic solar cells. Chem. Cent. J. 2016, 10, 67. [Google Scholar] [CrossRef] [PubMed] [Green Version]
  50. Lu, X.; Wei, S.; Wu, C.-M.; Li, S.; Guo, W. Can Polypyridyl Cu(I)-based Complexes Provide Promising Sensitizers for Dye-Sensitized Solar Cells? A Theoretical Insight into Cu(I) versus Ru(II) Sensitizers. J. Phys. Chem. C 2011, 115, 3753–3761. [Google Scholar] [CrossRef]
  51. Juma, J.M.; Vuai, S.A.H.; Babu, N.S. TD-DFT Investigations on Optoelectronic Properties of Fluorescein Dye Derivatives in Dye-Sensitized Solar Cells (DSSCs). Int. J. Photoenergy 2019, 2019, 1–8. [Google Scholar] [CrossRef]
  52. Toriumi, N.; Muranaka, A.; Hirano, K.; Yoshida, K.; Hashizume, D.; Uchiyama, M. 18π-Electron Tautomeric Benziphthalocyanine: A Functional Near-Infrared Dye with Tunable Aromaticity. Angew. Chem. Int. Ed. 2014, 53, 7814–7818. [Google Scholar] [CrossRef]
  53. Anderson, D.R.; Solntsev, P.V.; Rhoda, H.M.; Nemykin, V.N. How big is big? Separation by conventional methods, X-ray and electronic structures of positional isomers of bis- tert -butylisocyano adduct of 2(3),9(10),16(17),23(24)-tetrachloro-3(2),10(9),17(16),24(23)-tetra(2,6-di- iso -propylphenoxy)-phthalocyaninat. J. Porphyr. Phthalocyanines 2016, 20, 337–351. [Google Scholar] [CrossRef]
  54. Pozzi, G.; Quici, S.; Raffo, M.C.; Bignozzi, C.A.; Caramori, S.; Orlandi, M. Fluorous molecules for dye-sensitized solar cells: Synthesis and photoelectrochemistry of unsymmetrical zinc phthalocyanine sensitizers with bulky fluorophilic donor groups. J. Phys. Chem. C 2011, 115, 3777–3788. [Google Scholar] [CrossRef]
  55. Shimizu, M.; Tamagawa, T. Design and Characterization of 4,5-Bis(diarylamino)phthalic Acid Diesters as a New Class of Fluorophores Exhibiting Efficient Blue Emission in the Solid State. Eur. J. Org. Chem. 2015, 2015, 291–295. [Google Scholar] [CrossRef]
  56. Tylleman, B.; Gómez-Aspe, R.; Gbabode, G.; Geerts, Y.H.; Sergeyev, S. Ester-functionalized phthalonitriles and zinc phthalocyanines via palladium-catalyzed cyanation of 4,5-dichlorophthalates. Tetrahedron 2008, 64, 4155–4161. [Google Scholar] [CrossRef]
  57. Frisch, M.J.; Trucks, G.W.; Schlegel, H.B.; Scuseria, G.E.; Robb, M.A.; Cheeseman, J.R.; Montgomery, J.A., Jr.; Vreven, T.; Kudin, K.N.; Burant, J.C.; et al. Gaussian 03, Revision E.01; Gaussian Inc.: Wallingford, CT, USA, 2004. [Google Scholar]
  58. Neese, F. Software update: The ORCA program system, version 4.0. Wiley Interdiscip. Rev. Comput. Mol. Sci. 2018, 8, e1327. [Google Scholar] [CrossRef]
  59. Yanai, T.; Tew, D.P.; Handy, N.C. A new hybrid exchange–correlation functional using the Coulomb-attenuating method (CAM-B3LYP). Chem. Phys. Lett. 2004, 393, 51–57. [Google Scholar] [CrossRef] [Green Version]
  60. Hehre, W.J.; Ditchfield, R.; Pople, J.A. Self—Consistent Molecular Orbital Methods. XII. Further Extensions of Gaussian—Type Basis Sets for Use in Molecular Orbital Studies of Organic Molecules. J. Chem. Phys. 1972, 56, 2257. [Google Scholar] [CrossRef]
  61. Rassolov, V.A.; Pople, J.A.; Ratner, M.A.; Windus, T.L. 6-31G * basis set for atoms K through Zn. J. Chem. Phys. 1998, 109, 1223–1229. [Google Scholar] [CrossRef]
  62. Izsák, R.; Neese, F. An overlap fitted chain of spheres exchange method. J. Chem. Phys. 2011, 135, 144105. [Google Scholar] [CrossRef] [PubMed]
  63. Weigend, F. Accurate Coulomb-fitting basis sets for H to Rn. Phys. Chem. Chem. Phys. 2006, 8, 1057–1065. [Google Scholar] [CrossRef] [PubMed]
Figure 1. The structures of symmetrical reference complex ZnPc* and A3B-type zinc phthalocyaninates ZnPc14 synthesized in this work. The amyl esters ZnPcAm14 were obtained as intermediates in the synthesis of the corresponding ZnPc14.
Molecules 27 00524 g001
Scheme 1. Synthesis of zinc phthalocyaninates ZnPc14: i.—Zn(OAc)2, 1,8-diazabicyclo[5.4.0]undec-7-ene, n-pentanol; ii.—NaOH, H2O, tetrahydrofuran, MeOH.
Molecules 27 00524 sch001
Figure 2. UV-visible absorption and magnetic circular dichroism (MCD) spectra of the zinc phthalocyaninates in dimethylformamide. MCD spectra were measured for solutions with a fixed Q00 band absorbance of 1.4.
Molecules 27 00524 g002
Figure 3. Nodal structure and energies (eV) of frontier orbitals in ZnPc* and ZnPc14 according to CAM-B3LYP/6-31G(d) calculations.
Molecules 27 00524 g003
Figure 4. Molecular orbital (MO) energies of ZnPc, ZnPc* and ZnPc14. The a, s (2a2u), -a and -s MOs are highlighted in red with circles used to denote the a and -a MOs, while green is used to highlight MOs derived from the 1a2u MO of ZnPc. The occupied MOs are highlighted with small squares. MOs localized on the sterically demanding -OR substituents are highlighted in light blue, while amber is used for π-MOs localized on the peripheral benzo rings that are destabilized. Red diamonds are used to highlight the highest occupied molecular orbital−lowest unoccupied molecular orbital (HOMO−LUMO) gap values and are plotted against a secondary axis. σ-MOs associated with the aza-nitrogen lone pairs are offset to the right.
Molecules 27 00524 g004
Figure 5. Calculated spectra for ZnPc, ZnPc* and ZnPc14 derived from conventional TD-DFT (LEFT) and sTDDFT (RIGHT) calculations at the CAM-B3LYP/6-31G(d) level of theory. Q and B bands are highlighted with large red diamonds, while smaller amber, light blue, black, gray and green diamonds are used for bands arising primarily from transitions between destabilized π-MOs localized on the peripheral benzo rings into the -a/-s MOs, between the a MO into higher energy π* MOs, between σ-MOs associated with the aza-nitrogen lone pairs into the -a/-s MOs, from MOs localized on the sterically demanding -OR substituents into the -a/-s MOs, and between other π MOs of the Pc ligands into the -a/-s MOs, respectively. Simulated spectra are derived from the Chemcraft [42] and Chemissian [43] programs, respectively, with a fixed bandwidth in each case of 2000 cm−1.
Molecules 27 00524 g005
Figure 6. HOMO and LUMO energies for the B3LYP optimized geometries of ZnPc, ZnPc* and ZnPc14 at the B3LYP/SDD level of theory are plotted as black horizontal lines. Circles are used to highlight the HOMO in each case. Red lines are used to highlight the conduction band (CB) and valence band (VB) of TiO2, while a blue line is used for the redox potential of the I/I3 electrolyte [46,50]. Black, red and blue arrows are used to highlight the photoexcitation of the dye, injection of an electron into the TiO2 CB, and regeneration of the dye, respectively, in the context of ZnPc*.
Molecules 27 00524 g006
Table 1. The calculated gas-phase UV-vis absorption spectra for the B3LYP geometries calculated for the Q and B bands by the conventional TD-DFT method at the CAM-B3LYP/6-31G(d) level of theory.
λχαλχ, νμ
(eV)
fcalcQ Band
Wavefunctions a
λχαλχ, νμ
(eV)
fcalcWavefunctions of the Most Intense Bands Predicted in the B Band Region a
ZnPc607 (2.04)
607 (2.04)
0.48
0.48
94% a-a;
94% a -s;
313 (3.96)0.0270% H−2 (1b2u)Bz-a; 20% 2a2u-a; …
313 (3.96)0.0270% H−2 (1b2u)Bz-s; 20% 2a2u-s; …
295 (4.21)1.0774% 1a2uBz-a/-s; 9% 2a2u-a/-s; 7% a-a/-s;
ZnPc*622 (1.99)
622 (1.99)
0.56
0.56
92% a-a;
92% a -s;
366 (3.39)0.0473% H−1 (1b2u)Bz-a; …
366 (3.39)0.0487% H−2 (1b2u)Bz-a; …
332 (3.74)0.9575% 1a2uBz-a;18% H−2 (1b2u)Bz-a; …
332 (3.74)0.9572% 1a2uBz-s;21% H−2 (1b2u)Bz-s; …
295 (4.20)0.666% 2a2u-s; 10% H−25 (1b1u) → -a; …
295 (4.20)0.666% 2a2u-a; 10% H−25 (1b1u) → -s; …
ZnPc1626 (1.98)
613 (2.02)
0.53
0.58
93% a-s;
92% a -a;
372 (3.33)0.0883% H−1Bz-s;
346 (3.58)0.5483% H−1Bz-a;
342 (3.63)0.1673% H−2Bz-a;
333 (3.72)0.3457% H−3Bz-s; 19% aL+2 (1b1u*);
327 (3.79)0.1169% aL+2 (1b1u*); 20% H−3Bz-s;
311 (3.88)0.1763% aL+3 (1b2u*); 14% 1a2uBz-a/-s;
304 (4.08)0.351% 1a2uBz-a/-s; 14% a → L+3 (1b2u*); …
299 (4.15)0.4938% 2a2u-a;15% H−17 (2eg)-a/-s; 8% 1a2uBz-a/-s;
298 (4.17)0.5827% 2a2u-a/-s; 18% H−18 (1b1u) → -a/-s; 11% 1a2uBz -s;
286 (4.33)0.1335% H−18 (1b1u)-a; 14% H−17 (2eg)-a/-s; 11% 1a2uBz-s;
ZnPc2636 (1.95)
607 (2.04)
0.57
0.56
94% a-a;
93% a -s;
378 (3.28)0.0967% H−2Bz-a/-s; 19% H−1Bz-s;
357 (3.47)0.488% H−1Bz-a/-s;
348 (3.56)0.1785% H−2Bz-a/-s;
345 (3.62)0.1576% aL+3 (1b2u*); 10% H−3Bz-s;
331 (3.74)0.3260% H−3Bz-s; 20% aL+3 (1b2u*);
306 (4.05)0.7134% 1a2uBz-a; 31% H−16 (2eg) → -a/-s; …
303 (4.09)0.5940% H−17 (1b1u) → -a/-s; 19% 1a2uBz -s;
288 (4.30)0.2238% 1a2uBz-a/-s; 17% H−17 (1b1u) → -a/-s; 7% 2a2u -a/-s;
286 (4.34)0.1344% 1a2uBz-a/-s;
ZnPc3624 (1.99)
616 (2.01)
0.53
0.61
93% a-s;
92% a -a;
350 (3.54)0.0649% H−1Bz-s; 25% H−2Bz-a/-s;
326 (3.80)0.5134% H−1Bz-a; 19% H−3Bz-a; 12% H−2Bz-a;
315 (3.93)0.4879% H−3Bz-s;
309 (4.01)0.538% 1a2uBz-a; 26% a → L+3 (1b2u*); …
303 (4.09)0.1453% aL+3 (1b2u*); 26% 1a2uBz-a/-s;
298 (4.16)0.731% 1a2uBz-a/-s; 20% 2a2u-a/-s; 10% H−12 (1b1u*) → -a; …
297 (4.19)0.4546% 2a2u-a/-s;12% H−12 (1b1u*)-a/-s; 11% 1a2uBz-a/-s;
ZnPc4635 (1.95)
612 (2.03)
0.61
0.58
94% a-s;
94% a -a;
353 (3.51)0.0840% H−2Bz-s; 30% H−1Bz-s; …
337 (3.67)0.0772% aL+2 (1b1u*);
332 (3.74)0.4880% H−1Bz-a; …
328 (3.78)0.165% H−2Bz-a; …
316 (3.93)0.1781% aL+3 (1b2u*);
314 (3.95)0.4680% H−3Bz-s; …
302 (4.11)0.6433% H−10 (2eg) → -a; 31% 1a2uBz -a;
299 (4.14)0.5621% 2a2u-a/-s; 19% 1a2uBz-s; 13% H−10 (2eg) → -a/-s; 12% H−12 (1b1u) → -a/-s; …
298 (4.16)0.2425% 2a2u-a/-s;16% H−12 (1b1u)-a/-s; 13% 1a2uBz-s;
a—The wavefunctions based on the eigenvectors predicted in conventional TD-DFT calculations. One-electron transitions associated with the a, -a and -s MOs and the two frontier MOs derived from the 1a2u and 2a2u MOs of ZnPc that could potentially be viewed as the s MO are highlighted in bold. Only contributions > 10% to transitions with f > 0.10 and λ > 285 nm are consistently included. Bz as a superscript denotes an MO that is mainly localized on the peripheral benzo rings. Italics are used for other bands in the B band region (285−400 nm) that are not assigned to the main electronic B transitions in Figure 5. Where appropriate, the ZnPc MO from which the MO is derived is provided in parentheses.
Table 2. The calculated gas-phase UV-vis absorption spectra for the B3LYP geometries calculated for the Q and B bands by the sTD-DFT method at the CAM-B3LYP/6-31G(d) level of theory.
λχαλχ, νμ
(eV)
fcalcQ Band Wavefunctions aλχαλχ, νμ
(eV)
fcalcWavefunctions of the Most Intense Bands
Predicted in the B Band Region a
ZnPc676 (1.84)
675 (1.84)
0.57
0.57
97% a-a/-s;
97% a-s/-a;
325 (3.81)0.2874% H−2 (1b2u)-a; 14% s-a; …
325 (3.81)0.2874% H−2 (1b2u)-s; 14% s-s; …
308 (4.03)1.1679% 1a2uBz-a; 9% H−2 (1b2u) → -a; …
308 (4.03)1.1674% 1a2uBz-s; 9% H−2 (1b2u) → -s; …
ZnPc*689 (1.80)
688 (1.80)
0.59
0.59
95% a-a/-s;
95% a-s/-a;
364 (3.41)0.6370% 1a2uBz-a/-s; H−2 (1b2u) → -a; …
364 (3.41)0.6471% 1a2uBz-a/-s; 9% H−2 (1b2u) → -s; …
363 (3.41)0.1858% H−18 (1b2gN)-s; 18% 1a2uBz-s; 13% H−1OAr-s; …
363 (3.41)0.1261% H−18 (1b2gN)-s; 14% H−14OAr-s; 13% 1a2uBz-s;
307 (4.04)0.8562% 2a2u-a; 16% H−25 (1b1u) → -s; …
307 (4.04)0.8561% 2a2u-s; 16% H−25 (1b1u) → -a; …
ZnPc1703 (1.76)
673 (1.84)
0.6
0.59
97% a-a;
96% a-s;
382 (3.25)0.4280% H−1Bz-a;
377 (3.29)0.1782% H−2Bz-a/-s;
365 (3.39)0.3975% H−3Bz-s;
320 (3.88)0.1657% 1a2uBz-a; 9% 2a2u-a; 15% a → L+3 (1b2u*); …
312 (3.98)0.826% H−18 (1b1u) → -a; 25% 1a2uBz-s;
310 (4.00)0.5158% 2a2u-a;12% H−18 (1b1u)-s; …
304 (4.08)0.1631% H−17 (2eg)-a; 27% aL+4 (1a2u*); …
303 (4.09)0.1545% H−17 (2eg)-s; 24% aL+4 (1a2u*); …
301 (4.12)0.1640% H−17 (2eg)-a/-s; 37% aL+4 (1a2u*); …
300 (4.14)0.1333% 1a2uBz-s;29% H−18 (1b1u)-a; …
292 (4.25)0.1340% H−20 (2eg)-a; 30% 2a2u-s;
ZnPc2723 (1.72)
663 (1.87)
0.64
0.57
97% a-a;
97% a-s;
395 (3.14)0.3586% H−1Bz-a/-s;
384 (3.23)0.1484% H−2Bz-a/-s;
369 (3.36)0.2752% aL+2 (1b1u*); 38% H−3Bz-s;
361 (3.43)0.1745% H−3Bz-s; 36% aL+2 (1b1u*);
324 (3.82)0.2757% H−16 (2eg)-a; …
317 (3.91)0.5351% H−11 (1b1u)-a; 51% H−10OAr-a; 9% 1a2uBz-s;
314 (3.95)0.642% 1a2uBz-a; 14% 2a2u-a; 10% H−21 (2eg) → -a; …
307 (4.04)0.1554% H−4OAr-a/-s; 18% 1a2uBz-s;
302 (4.11)0.3840% 2a2u-s; 10% H−4OAr -s;
296 (4.18)0.120% H−4OAr-s; 15% H−10OAr-a; 12% H-17 (1b1u)-s; …
ZnPc3703 (1.76)
685 (1.81)
0.6
0.62
97% a-s;
97% a-a;
358 (3.46)0.1342% H−1Bz-a; 23% H−2Bz-a; 20% aL+2 (1b1u*);
355 (3.49)0.4835% H−3Bz-a; 21% H−1Bz-a; 19% H−2Bz-a;
344 (3.61)0.3875% H−3Bz-s; 15% aL+2 (1b1u*);
325 (3.81)0.1176% aL+3 (1b2u*);7% 1a2uBz-a;
320 (3.88)0.1649% 1a2uBz-a; 16% 2a2u-a; 15% a → L+3 (1b2u*); …
312 (3.97)0.6936% 1a2uBz-s; 23% a → L+4 (1a2u*); 14% H−12 (1b1u) → -a;
310 (4.00)0.3633% aL+4 (1a2u*); 26% 2a2u -a; 10% 1a2uBz -s;
309 (4.01)0.4930% aL+4 (1a2u*); 21% 2a2u-a;
302 (4.11)0.1639% H−2OAr-a; 12% 1a2uBz-s;12% H−8OAr-a; …
ZnPc4723 (1.71)
678 (1.83)
0.64
0.6
97% a-s;
97% a-a;
364 (3.41)0.1635% H−1Bz-a; 27% a → L+2 (1b1u*); 10% H−3Bz -a;
361 (3.44)0.4231% H−2Bz-a; 21% a → L+2 (1b1u*); 15% H−1Bz -a;
341 (3.63)0.484% H−3Bz-s;
318 (3.90)0.1447% H−10 (2eg)-a; 16% H−4OAr-a; …
314 (3.95)0.6223% H−12 (1b1u) → -a; 14% 2a2u → -a; 10% H−7OAr → -a; …
312 (3.97)0.2328% H4OAr-s; 15% 1a2uBz-a;14% 2a2u-a;
310 (3.99)0.4117% H−4OAr-a; 12% H−5OAr-s; 10% 1a2uBz-s;
305 (4.06)0.3548% H−7OAr → -a; 27% 2a2u-s;
304 (4.08)0.0930% 1a2uBz-s;29% H−6OAr-a; 19% H−14 (2eg)-a;
299 (4.15)0.0723% H−12 (1b1u)-a; 14% 2a2u-a;
297 (4.18)0.0829% H−6OAr-s; 18% 2a2u-a;12% 1a2uBz-s;
a—The wavefunctions based on the eigenvectors predicted by sTD-DFT. One-electron transitions associated with the a, -a and -s MOs and the two frontier MOs derived from the 1a2u and 2a2u MOs of ZnPc that could potentially be viewed as the s MO are highlighted in bold. Only contributions > 10% to transitions with f > 0.10 and λ > 285 nm are consistently included. Bz, OAr and N as superscripts denote an MO that is mainly localized on the peripheral benzo rings, the peripheral OAr substituents and the aza-nitrogen lone pairs, respectively. Italics are used for other bands in the B band region (285−400 nm) that are not assigned to the main electronic B transitions in Figure 5. Where appropriate, the ZnPc MO from which the MO is derived is provided in parentheses.
Table 3. Dye-sensitized solar cell (DSSC)-related parameters [46,47,48,49,50] for the B3LYP optimized geometries of ZnPc, ZnPc* and ZnPc14 at the B3LYP/SDD level of theory.
HOMO
(eV)
LUMO
(eV)
Band gap
(eV)
E00 a
(eV)
EOXdye b
(eV)
EOXdye* c
(eV)
Voc d
(eV)
ΔGinj e
(eV)
ΔGregen f
(eV)
f gLHE h
ZnPc−5.31−3.052.261.865.313.461.01−0.54−0.510.480.67
ZnPc1−5.38−3.192.191.845.383.551.08−0.45−0.580.560.72
ZnPc2−5.55−3.422.131.835.553.721.25−0.28−0.750.560.72
ZnPc3−5.70−3.502.191.835.703.861.40−0.14−0.900.560.73
ZnPc4−5.71−3.582.141.825.713.891.41−0.11−0.910.570.73
ZnPc*−5.08−2.842.241.845.083.240.78−0.76−0.280.600.75
a The experimental Q band energy (E00) from Figure 2. b The oxidation potential of the dye (EOXdye) is derived from the HOMO energy. c The oxidation potential of the photoexcited dye (EOXdye*) is derived from the equation: EOXdye* = EOXdye − E00 [46,51]. d The open circuit voltage (Voc) values are calculated using the equation: Voc = │EHOMO (Donor)│ − │ELUMO (Acceptor)│ − 0.3 [46,47,48,49,51]. |EHOMO (Donor)| and │ELUMO (Acceptor)│ are derived from EOXdye and the energy of the conduction band of TiO2 (ECB) of −4.00 eV [46,50]. e The Gibbs free energy for injection of an electron from the dye into the TiO2 photoanode (ΔGinj) was calculated by using the equation: ΔGinj = EOXdye* − ECB [46,51]. f The I/I3 redox potential of the electrolyte is assumed to be −4.80 eV so the oxidation potential energy (EOXelectrolyte) is 4.80 eV [46,50] in the calculation of the Gibbs free energy for dye regeneration (ΔGregen) using the equation: ΔGregen = EOXelectrolyte − EOXdye [46]. g Average oscillator strength values for the Q transitions are derived from Table 1. h The light harvesting efficiency (LHE) at the Q band maxima was calculated using the equation: LHE = 1 − 10−f [46,50,51].
Publisher’s Note: MDPI stays neutral with regard to jurisdictional claims in published maps and institutional affiliations.

