Article

Stimulation of Lignan Production in Schisandra rubriflora In Vitro Cultures by Elicitation

1
Chair and Department of Pharmaceutical Botany, Faculty of Pharmacy, Medical College, Jagiellonian University, ul. Medyczna 9, 30-688 Kraków, Poland
2
The Franciszek Górski Institute of Plant Physiology, Polish Academy of Sciences, ul. Niezapominajek 21, 30-239 Kraków, Poland
*
Author to whom correspondence should be addressed.
Molecules 2022, 27(19), 6681; https://doi.org/10.3390/molecules27196681
Submission received: 22 August 2022 / Revised: 27 September 2022 / Accepted: 5 October 2022 / Published: 7 October 2022
(This article belongs to the Special Issue Plant Metabolites: Accumulation, Profiling and Bioactivity)

Abstract

:
The study investigated the effect of elicitation with: chitosan (CH) (200 mg/L), yeast extract (YeE) (3000 mg/L), ethephon (ETH) (25 µM/L), and methyl jasmonate (MeJA) (50 µM/L), on lignan accumulation in agitated and bioreactor (Plantform temporary immersion systems) microshoot cultures of female (F) and male (M) Schisandra rubriflora Rehd. et Wils. (Schisandraceae) lines. The elicitors were supplemented on the 10th day of culture. Biomasses were collected at 24 h and 48 h, and 4, 6, and 8 days after the addition of each elicitor. The 24 compounds from the dibenzocyclooctadiene, aryltetralin, dibenzylbutane, and tetrahydrofuran lignans and neolignans were determined qualitatively and quantitatively in biomass extracts using the UHPLC–MS/MS method. The highest total contents [mg/100 g DW] of lignans were: for CH-95.00 (F, day 6) and 323.30 (M, 48 h); for YeE 104.30 (F, day 8) and 353.17 (M, day 4); for ETH 124.50 (F, 48 h) and 334.90 (M, day 4); and for MeJA 89.70 (F, 48 h) and 368.50 (M, 24 h). In the biomass extracts of M cultures grown in bioreactors, the highest total lignan content was obtained after MeJA elicitation (153.20 mg/100 g DW). The maximum total lignan contents in the biomass extracts from agitated and bioreactor cultures were 3.29 and 1.13 times higher, respectively, than in the extracts from the non-elicited cultures. The poor understanding of the chemical composition and the lack of studies in the field of plant biotechnology of S. rubriflora emphasize the innovativeness of the research.

1. Introduction

The Schisandraceae family includes twenty-seven species of the genus Schisandra. In modern phytotherapy, only one of them is most often used—Schisandra chinensis (Turcz.) Baill.—Chinese magnolia vine. Knowledge of the medicinal and cosmetic properties and alimentary value of the raw material—Schisandrae chinensis fructus, came from traditional Chinese medicine (TCM) [1,2]. The European monograph, the raw material appeared for the first time in 2008 in the European Pharmacopoeia 6th [3]. The raw material is also known in North America [4]. It also has a monograph in the International Pharmacopoeia published by WHO [5]. S. chinensis fruit extract shows inter alia, hepatoprotective, adaptogenic, anti-inflammatory, antibacterial and antioxidant activities [2,6,7]. Knowledge about the phytochemical composition and medicinal or alimentary properties of other species of the Schisandra genus, compared to S. chinensis, is very poor [8].
The subject of this study is the endemic, dioecious species of the genus Schisandra that occurs naturally only in the western part of the Sichuan province (south-western part of China)-Schisandra rubriflora Rehd. et Wils. (Schisandra chinensis). It’s a species known in TCM; mainly used as a tonic and sedative. It is also recommended in the treatment of hepatitis, chronic gastroenteritis, and neurasthenia [8,9,10].
The dioecious and low resistance to frost of S. rubriflora make the species mainly cultivated as ornamental plants in some regions of world (incl. Europe and north America) [8].
S. rubriflora does not have an official pharmacopoeial monograph. In the scientific literature, there are individual articles by teams from China on the development of the chemical composition and research on the biological activity of S. rubriflora leaves, shoots and fruits. Phytochemical studies focus on the main group of metabolites characteristic of the Schisandra genus-dibenzocyclooctadiene lignans [11,12,13,14]. The study of therapeutic properties concerns the antiviral activity (anti-HIV-1) [15], and the influence on the level of glutamine-pyruvate transaminase (GPT) [16].
Our previous research focused on S. rubriflora phytochemical and biotechnological research. The phytochemical composition of leaves, stems and fruits was developed in terms of polyphenolic compounds-phenolic acids and flavonoids, as well as a lignan profile taking into account the sex of individuals [11,17,18]. Moreover, the biological activity of the extracts was determined as anti-inflammatory and antioxidant [17,18]. In addition, the initiation and optimization with regard to optimal plant growth regulators’ (PGRs) composition and the duration of the growth period of S. rubriflora in vitro microshoot agar cultures were performed [17].
As part of this study, the cultures were adapted to agitated mode of growth as well as to maintain them in specific Plantform bioreactors (Swedish-made temporary immersion systems). The subject of the research was the further biotechnological optimization of the conditions for S. rubriflora in vitro cultivation based on testing various elicitation methods. Nowadays elicitation is a very useful tool of biotechnological studies aimed at boosting the production of secondary metabolites under in vitro conditions.
Elicitation is one of the most effective and currently widely used biotechnological tools for increased biosynthesis and accumulation of secondary metabolites of high biological value in in vitro cultures of various plant species [19,20,21].
Through this study, the biotic-chitosan (CH) and yeast extract (YeE), as well as abiotic elicitors methyl jasmonate (JaMe) and ethephon (ETH) were tested. The elicitors were applied on the 10th day of cultivation, and the harvesting of culture biomass was after 24 h, 48 h, and 4, 6, and 8 days.
The aim of the work was to intensify the production of lignans in the biomass of S. rubriflora microshoot cultures. The research included the female (F) and male (M) culture lines. The analyzes of the UHPLC–MS/MS method included four groups of lignans: dibenzocyclooctadiene, as well as aryltetralin, dibenzylbutane, tetrahydrofuran and dihydrobenzofuran neolignans.

2. Results and Discussion

2.1. Influence of Elicitation in Agitated Cultures

2.1.1. The Biomass Appearance after Elicitation

Control, non-elicited cultures of S. rubriflora lines F and M showed good viability and a light green color after all tested growth periods (Figure 1). Progressive browning of biomass was observed in S. rubriflora cultures of lines F and M after supplementation with CH, ETH and MeJA substrates 6 days after the addition of elicitors. After YeE supplementation, progressive turbidity of the medium and gradual browning of microshoots were immediately observed (Figure 1). Similar effects of elicitors were observed in experiments conducted on shoot cultures of, e.g., S. chinensis [22], Nasturtium officinale [23] and Eryngium planum [24].

2.1.2. Influence of Elicitation on Biomass Growth

In this study, the effect of the application of all elicitors on the biomass growth of agitated microshoot cultures of F and M lines of S. rubriflora was found. The highest biomass growth for line M was found 24 h after the addition of YeE. It caused the highest biomass gain, 2.06 times higher than the control. For line F, the highest biomass increase was found at 8 days after MeJA addition. It caused the highest biomass gain, 2.39 times higher biomass gain compared to the control (Table 1).
At 24 h after the addition of the elicitor, the biomass gains of elicited cultures, except for MeJA elicitation for lines M, were higher than those of the control cultures. The highest biomass gain of lines M at 24 h was recorded for YeE elicitation (max. Gi = 41.76), it was 2.06 times higher compared to the control. At 24 h after addition, elicitors did not affect the biomass gains of lines F except for YeE elicitation (max. Gi = 23.35). This gain was 1.28 times higher compared to the control (Table 1).
At 48 h after the addition of the elicitor, higher biomass gains were recorded for lines M except for those elicited with ETH and MeJA. The highest biomass gain of lines M was found for CH elicitation at 48 h (max. Gi = 37.57), it was 1.43 times higher compared to the control. The elicitors at 48 h after their addition also affected the biomass gain of the female lines except for MeJA elicitation. A high value of Gi coefficient was also found after ETH elicitation (max. Gi = 27.47). This gain was 1.94 times higher compared to the control (Table 1).
Supplementation with elicitors had a negative effect on the biomass gains of the experimental cultures harvested after 4 days. Only after CH elicitation for the biomass of line F, the Gi value (26.67) was 1.07 times higher compared to the control (Table 1).
For microshoots of agitated cultures of lines M 6 days after the addition of elicitors, only CH and MeJA showed a slight increase in Gi values compared to the control. The highest increase in biomass of line M was found after CH elicitation (max. Gi = 52.63), it was 1.16 times higher compared to the control (Table 1). For line F, only two elicitors, CH and YeE, affected biomass growth after 6 days of addition. The highest Gi value was found after YeE elicitation (max. Gi = 30.00). This increase was 1.32 times higher compared to the control (Table 1).
After 8 days of elicitation application for line M cultures, only CH and MeJA were found to have a higher Gi value compared to the control cultures. The highest biomass gain for lines M was found for MeJA elicitation (max. Gi = 69.26), this was 1.5 times higher than for the control. On the other hand, for line F, the highest Gi value was found after MeJA elicitation (Gi = 42.99). This gain was 2.39 times higher compared to the control (Table 1).
The notable Gi values in the same time points are diverse. That is caused by the type of elicitor and the duration time of elicitor treatment. The elicitor addition often caused a decrease in in vitro culture biomass growth while the production of secondary metabolites increase. Such a fact is well known in plant biotechnology studies and has been described before, e.g., after CH elicitation in Hypericum perforatum root cultures [25], MeJA elicitation in Fagonia indica adventitious root cultures [26], YeE elicitation in Panax ginseng cell culture [27], or Aspergillus flavus fungus elicitation in Catharanthus roseus callus cultures [28].
Analysis of the literature allows a direct comparison of data on the effect of elicitation with two elicitors: YeE and CH on the value of the Gi index for in vitro cultures of S. chinensis species, and the experiment carried out in the present work. The highest recorded Gi index values for YeE elicitation of S. chinensis species were observed after YeE addition at a concentration of 1000 mg/L. The Gi value ranged from 33.37 to 42.89, where the value for the control sample was 40.74. The other, higher concentrations of YeE, 3000 mg/L and 5000 mg/L, caused a decrease in biomass growth especially when YeE was supplemented on the first day of culture [22]. In the course of our experiment, a decrease in the biomass growth of in vitro cultures of S. rubriflora was found 4 days after the addition of YeE at a concentration of 3000 mg/L. For line M it was also observable on day 6 and day 8 of culture. Line M of S. rubriflora was found to be much more sensitive to YeE compared to line F. Elicitation of S. chinensis with CH at concentrations in the range of 25–200 mg/L did not adversely affect microshoots growth. The Gi index was comparable to control cultures. The highest Gi value was found for CH supplementation at concentrations of 50 and 100 mg/L on the first day of culture. It was 57.39 and 56.87, respectively; where the Gi value for the control sample was 40.00 [22]. In the course of our experiment for in vitro cultures of S. rubriflora, the increase in CH elicited biomass for cultures of line F occurred only at 48 h after elicitor addition, it was the highest at day 8 after elicitor addition, while cultures of line M showed the highest increase at 24 h after elicitor addition (Table 1).

2.1.3. The Influence of Elicitation on Lignan Production

The study proved the significant effect of the applied elicitation on the accumulation of lignans in cultures of lines F and M of S. rubriflora. In biomass extracts, 22 compounds from four groups of lignans were qualitatively and quantitatively determined: dibenzocyclooctadiene lignans (schisantherin A and B, schisandrin, schisandrin C, gomisin A, D, G, J, N, O, 6-O-benzoylgomisin O, schisandrin A, rubrisandrin A, epigomisin O, schisanhenol, interiotherin C, angeloylgomisin H and O), aryltetralin lignans (wulignan A1), dibenzylbutane lignans (pregomisin, mesodihydroguaiaretic acid), and tetrahydrofuran lignans (fragransin A2). In addition, 2 compounds from the dihydrobenzofuran group of neolignans (licarin A and B) were also found in the analyzed extracts.
The study confirmed the effect of the elicitation schemes used on the accumulation of metabolites in the microshoot culture biomass extracts analyzed, while only trace amounts were found in the culture media (<5 mg/L).
Detailed results of quantitative analyses in the control sample and depending on the elicitation scheme used and on the time of tissue harvesting are presented in Supplementary Data (Tables S1–S5).
The highest obtained contents of the analyzed compounds in the course of the whole experiment were as follows: wulignan A1 (max. 0.36 mg/100 g DW; CH, line F, 6 days, 2.37 times higher compared to the control), rubrisandrin A (max. 0.19 mg/100 g DW; YeE; line M, 6 days, 3.82 times higher compared to the control), interiotherin C (max. 0.36 mg/100 g DW; CH; line F, 6 days, 7.16 times higher compared to the control), schisandrin (max. 71,98 mg/100 g DW; MeJA, line M, 24 h, 3.13 times higher compared to the control), gomisin D (max. 28.80 mg/100 g DW; MeJA, line M, 24 h, 4.44 times higher compared to the control), gomisin J (max. 15.71 mg/100 g DW; MeJA, line M, 24 h, 4.78 times higher compared to the control), gomisin A (max. 91.53 mg/100 g DW; MeJA, line M, 24 h, 3.31 times higher compared to the control), gomisin G (max. 6.93 mg/100 g DW; MeJA, line M, 24 h, 3.91 times higher compared to the control), licarin B (max. 0.41 mg/100 g DW, ETH, line F, 48 h, 3.33 times higher compared to the control), epigomisin O (max. 1.54 mg/100 g DW; ETH, line F, 48 h, 2.40 times higher compared to the control), gomisin O (max. 4.80 mg/100 g DW; MeJA, line F, 48 h, 1.38 times higher compared to the control), mesodihydroguaiaretic acid (max. 0.23 mg/100 g DW; MeJA, line M, 8 days, 4.62 times higher compared to the control), schisantherin A (max. 5.42 mg/100 g DW; ETH, line F, 48 h, 1.99 times higher compared to the control), schisantherin B (max. 16.66 mg/100 g DW; MeJA, line M, 24 h, 5.03 times higher compared to the control), licarin A (max. 37.54 mg/100 g DW; YeE, line F, 8 days, 3.23 times higher compared to the control), schisanhenol (max. 10.11 mg/100 g DW; ETH, line F, 48 h, 1.79 times higher compared to the control), deoxyschisandrin (max. 94.86 mg/100 g DW; YeE, line M, 4 days, 1.65 times higher compared to the control), gomisin N (max. 28.07 mg/100 g DW; MeJA, line M, 24 h, 4.14 times higher compared to the control), 6-O-benzoylgomisin O (max. 1.40 mg/100 g DW; ETH, line F, 48 h, 2.64 times higher compared to the control), and schisandrin C (max. 5.24 mg/100 g DW; YeE, line M, 24 h, 3.64 times higher compared to the control) (Tables S1–S5 and Table 2, Table 3, Table 4, Table 5 and Table 6).
Total content of lignans was highest for line M elicited with MeJA, and was 368.50 mg/100 g DW, 3.29 times higher than in the control sample (Tables S1–S5 and Table 2, Table 3, Table 4, Table 5 and Table 6).
The obtained results were compared with elicitation in in vitro cultures of well-established in phytotherapy S. chinensis which affected the production of dibenzocyclooctadiene lignans [22]. Cultures of S. chinensis were maintained on MS medium containing 3 mg/L BA and 1 mg/L NAA. Cultures were treated with elicitors at 10 and 20 days of culture. The elicitors tested were cadmium chloride (CdCl2), YeE, CH, MeJA and the permeabilizing agent dimethyl sulphoxide (DMSO). The duration of culture was 30 days. In the biomass extracts of the experimental cultures, the content of dibenzocyclooctadiene lignans was determined by DAD-HPLC. The total content of lignans obtained in cultures elicited with CdCl2 was twice as high as in non-elicited control samples. The content of secondary metabolites after the use of this elicitor was about 730 mg/100 g DW. Elicitation with CH increased lignan production by 1.35 times (500 mg/100 g DW). The use of YeE led to a 1.8-fold increase in the content of the tested compounds. The identified lignans differed from those determined in in vitro cultures of S. rubriflora species during the present experiment. In the S. chinensis species, only lignans from the dibenzocyclooctadiene lignan group were determined: schisandrin, gomisin A, gomisin G, schisantherin A, schisantherin B, Schisanhenol, deoxyschizandrin, γ-schisandrin, schisandrin C, angeloylgomisin H and Q, schisandrin B, benzoylgomisin P and schisantherin D. Only the effect of elicitation on the compounds found in both species, i.e., dibenzocyclooctadiene lignans, was evaluated comparatively in this study (compounds from the other labeled lignan groups in S. rubriflora were not considered): schisandrin, gomisin A, G, schisantherin A, B, schisanhenol, deoxychizandrin and the total content of these compounds (Table 7). Schisandrin, gomisin A and G, and schisantherin B showed higher content multiplicity relative to the control due to elicitation in S. rubriflora species (3.13, 3.31, 3.91, 5.03 times higher for MeJA, respectively, 50 µM, 24 h,) than in S. chinensis species (2.28, 2.80 times more for CdCl2, respectively, 1000 µM, 10 days, 3.03 times more for YeE, 3000 mg/L, day 10; 2.61 times more for YeE, 1000 mg/L, 20 days). The content of these compounds was lower in elicited cultures of S. rubriflora species. Schisantherin A, schisanhenol, deoxyschizandrin showed lower multiplicity of content relative to control upon elicitation in S. rubriflora species (1.99, 1.79 times more, respectively, ETH, 25 µM, 48 h, 1.65 times more, YeE, 3000 mg/L, 4 days) in cultures of S. rubriflora species than in those for S. chinensis (3.11 times more, YeE, 3000 mg/L, day 0; 4.44 times more, CdCl2, 1000 µM, 10 days; 1.95 times more, YeE, 5000 mg/L, days 10). The contents of schisantherin A and schisanhenol were lower in S. rubriflora cultures than in S. chinensis. The only compound that showed a higher content in S. rubriflora cultures was deoxyschizandrin (max. 94.86 mg/100 g DW). The total content of lignans was higher in S. chinensis cultures (max. 730.60 mg/100 g DW) than in S. rubriflora (max. 368.50 mg/100 g DW), while the multiplicity relative to the control was higher in S. rubriflora cultures (3.29 times higher) (Table 7).
Studies on the effect of elicitation on the production of specific compounds from the lignan group are a rather difficult subject of research, and that is probably why they are not a frequent object of study. Studies on a popular compound with anticancer activity-podophyllotoxin are of greatest interest. Kasparova et al. conducted a study on the effect of MeJA elicitation on podophyllotoxin accumulation in suspension cultures of Juniperus virginiana. Cultures were elicited on day 14 of culture and harvested at 6, 24, 48 and 168 h after the addition of the elicitor. The highest maximum podophyllotoxin content was determined at 168 h after the addition of 5 mmol/L MeJA (max. 0.68 mg/g DW) and was about 2.83 times higher than the control sample [29]. Anbazhagan et al. conducted a study on the effect of MeJA elicitation on podophyllotoxin accumulation in suspension and adventitious root cultures of Podophyllum peltatum species. Day “0” (inoculation) was the day of addition of the elicitor 20 μM MeJA. Cultures were harvested 5 weeks after elicitor addition. Podophyllotoxin content in suspension cultures was 4.1 times higher than in the control samples (max. 0.3625 mg/g DW), and in adventitious root cultures was 1.62 times higher than in the control samples (max. 0.588 mg/g DW) [30]. Bhattacharyya et al. conducted a study on the effect of MeJA elicitor on podophyllotoxin accumulation in Podophyllum hexandrum species. Elicitor; 100 µM MeJA, was added on day 3 of culture. Cultures were harvested after 9 days. Podophyllotoxin content was 80 µg/g DW and was 8 times higher than in the control samples [31].
Sasheva et al. conducted a study on the effect of MeJA elicitation on podophyllotoxin accumulation in Linum thracicum species. MeJA was used at concentrations of 50 and 100 µM and added on day 7 of culture. Cultures were harvested 24 h and 72 h after the addition of the elicitor. Cultures were grown on MS media differing in sucrose content. The highest content of podophyllotoxin was 1.6 mg/g DW, which was 1.14 times higher than in the control sample and was obtained in biomass cultured on medium with 20 g/L sucrose. The researchers found no significant effect of elicitation on the production of podophyllotoxin [32].
Waqar et al. studied the effect of CH elicitation on the accumulation of specific lignans and neolignans: secoisolariciresinol diglucoside, lariciresinol diglucoside, dehydrodiconiferyl alcohol glucoside and guaiacylglycerol-β-coniferyl alcohol ether glucoside in suspension cultures of Linum usitatissimum. Cultures were elicited with CH at a concentration of 10 mg/L on day 10 of culture. The duration of culture was 30 days. Material was harvested at 8, 24 and 48h. Maximum enhancements of 7.3-fold (28 mg/g DW) occurred for lariciresinol diglucoside, 3.5-fold (58.85 mg/g DW) in dehydrodiconiferyl alcohol glucoside and while the least enhancement of 2-fold (18.42 mg/g DW) for secoisolariciresinol diglucoside was observed in CH treated cell cultures than to controls [33]. Nadeem et al. also studied the effect of elicitation, but with a different elicitor, YeE, on the accumulation of lignans and neolignans in suspension cultures of L. usitatissinum species. YeE was added to the medium on day “0” (inoculation) at concentrations of 10, 50, 100, 200, 500 and 1000 mg/L. YeE at a concentration of 200 mg/L caused the highest increase in the accumulation of the compounds: secoisolariciresinol diglucoside (3.36-fold, max. 10.1 mg/g DW), lariciresinol diglucoside (1.3-fold, 11.0 mg/g DW) and dehydrodiconiferyl alcohol glucoside (4.26-fold, max. 21.3 mg/g DW) [34].
Wawrosch et al. studied the effects of elicitation with AgNO3, MeJA and YeE on the accumulation of specific furan-type lignans: leoligin and 5-methoxy-leoligin in hairy root cultures of Leontopodium nivale. Elicitors were added to 3-week-old cultures at concentrations of: 15, 30 and 60 µM AgNO3, 50, 100, 200, 300 µM MeJA and 1, 2, 5 g/L YeE. The duration of culture was 4 weeks. The highest content of leoligin was recorded after elicitation with 100 µM MeJA (max. 0.05 in %), it was 8.33 times higher than that of the control sample. The content of 5-methoxy-leoligin was highest after supplementation with 15 µM AgNO3 (max. 0.026 in %), and was 6.5 times higher than that of the control sample [35].
Schmitt and Petersen examined the effect of MeJA elicitation on the accumulation of tetrahydrofuran lignans, pinoresinol and matairesinol, in Forsythia × intermedia suspension cultures. MeJA was added on day “0” at a concentration of 100 µM. Cultures were harvested every other day from the addition of the elicitor. Pinoresinol content increased 3-fold (max. 0.8 mg/g DW) and matairesinol content increased 7-fold (max. 2.7 mg/g DW) relative to the control sample [36].
Sanchez-Sampedro et al. conducted an experiment proving the effect of elicitation with YeE, SA, CH and chitin on the synthesis of flavonolignan: silymarin in suspension cultures of Silybum marianum. SA, CH and chitin did not stimulate silymarin production even at higher concentrations. YeE caused intense browning and significant loss of cell viability after 48 h (at concentrations of 100 and 200 μg/mL). A slight increase in silymarin content was observed following YeE supplementation. MeJA at a concentration of 10 µM/mL was ineffective, but at a concentration of 100 µM/mL caused significant accumulation of silymarin in cells. MeJA alone or in combination with YeE gave the best results. Three-day cultures were treated for 48 h with 50 g/mL YeE, 100 μM MeJA or both elicitors simultaneously. Silymarin content for control samples was max 2.01 mg/g DW. The combination of MeJA and YeE yielded nearly 600% higher accumulation of silymarin in biomass [37].

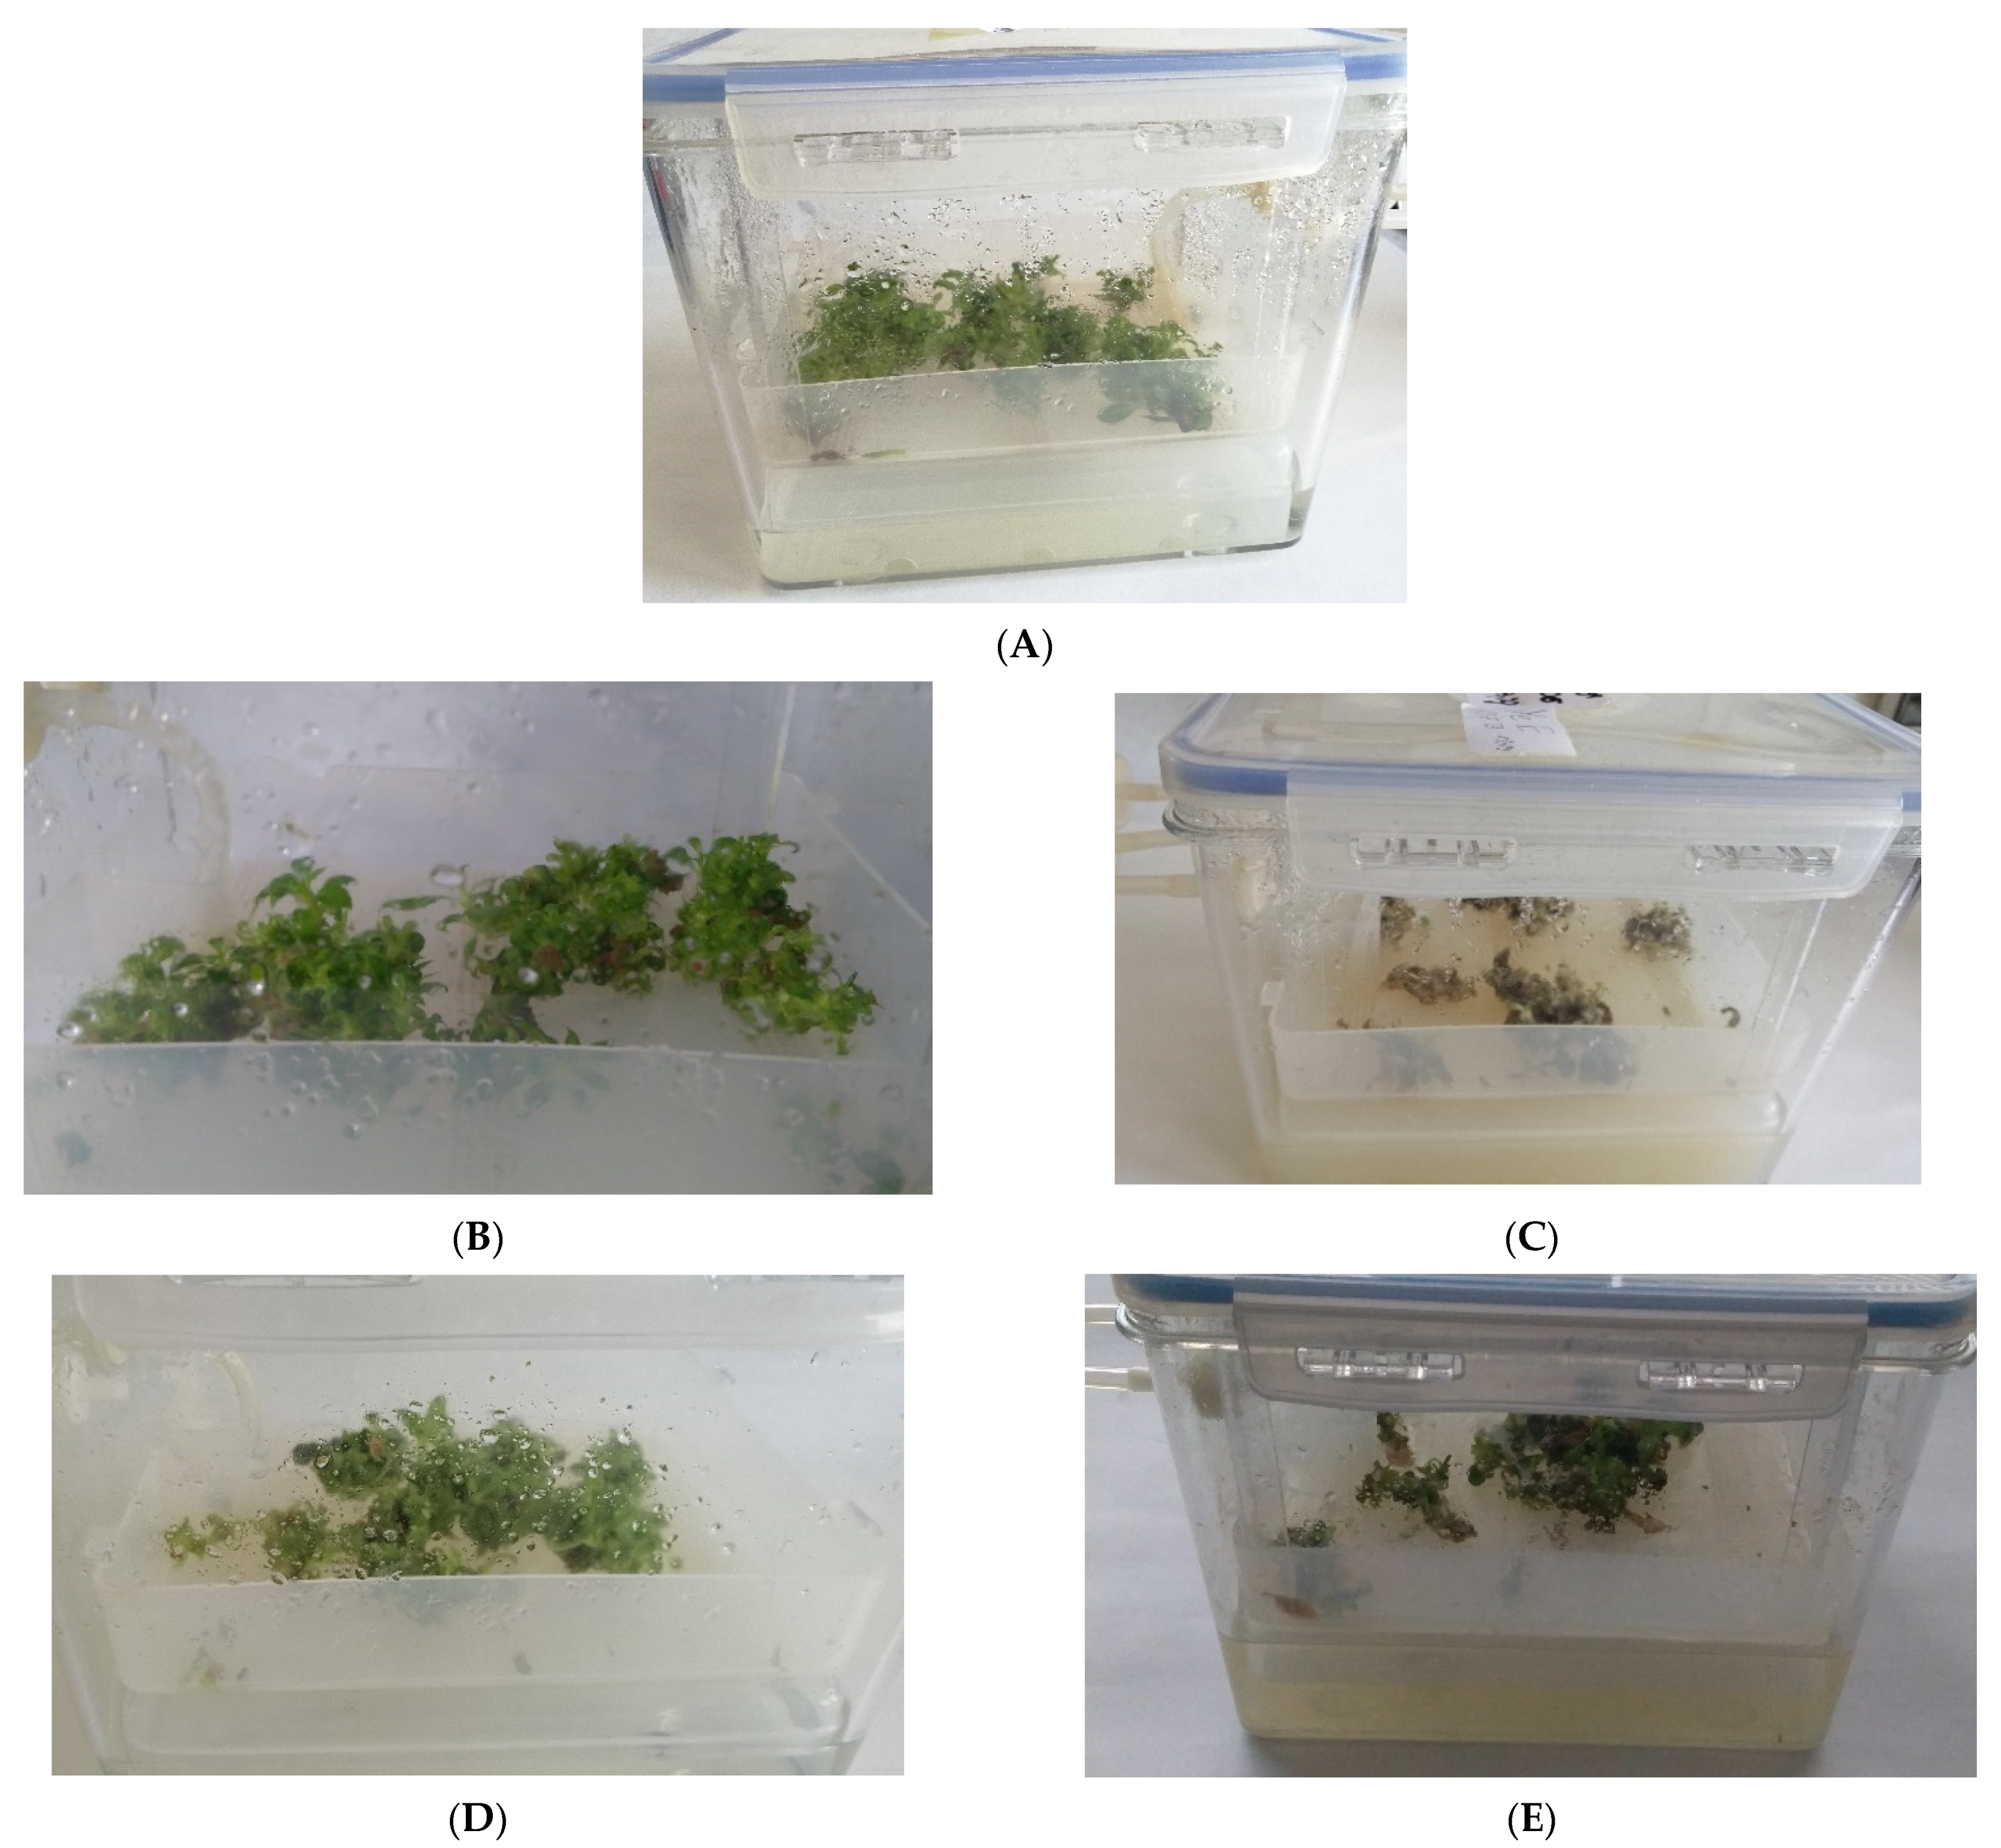
2.2. Influence of Elicitation in Cultures Maintained in Plant form TIS

2.2.1. The Biomass Appearance and Growth after Elicitation

Experimental cultures of S. rubriflora line M grown in Plantform bioreactors were characterized by good growth and light green color of microshoots (Figure 2). The elicitor concentrations used for the bioreactor experiments and the days of biomass harvesting from its supplementation were selected based on the best results obtained in agitated culture experiments. The collection of samples supplemented with each elicitor was as follows: MeJA at 24 h, CH at 48 h, YeE at day 4, ETH at day 4, control at day 4. The effect of the elicitors used on the appearance of microshoots was observed only in the case of YeE and MeJA elicitation, where the tissue was slightly browned after elicitor supplementation (Figure 2).
Biomass gains of the control sample in Plantform bioreactors were Gi = 42.31. Dry biomass gains for elicited samples were as follows: CH; Gi = 37.21, YeE; Gi = 22.22, ETH; Gi = 52.07, and MeJA; Gi = 29.72 (Figure 3).

2.2.2. The Influence of Elicitation on Lignan Production

The presence of compounds, the same as in extracts from agitated cultures, was confirmed qualitatively in the biomass extracts of control and elicited bioreactor cultures: dibenzocyclooctadiene lignans (schisantherin A and B, schisandrin, schisandrin C, gomisin A, D, G, J, N, O, 6-O-benzoylgomisin O, schisandrin A, rubrisandrin A, epigomisin O, schisanhenol, interiotherin C, angeloylgomisin H and O), aryltetralin lignans (wulignan A1), dibenzylbutane lignans (pregomisin, mesodihydroguaiaretic acid) and tetrahydrofuran lignan (fragransin A2), and compounds from the group of dihydrobenzofuran neolignans (licarin A and B).
The contents of individual compounds ranged from trace amounts <0.05 mg/100 g DW to 41.01 mg/100 g DW (gomisin A, MeJA, 24 h). The highest contents of the individual compounds analyzed in the course of the entire experiment were as follows: schisandrin (max. 37.60 mg/100 g DW; MeJA, 1.25 times higher than the control sample), gomisin A (max. 41.01 mg/100 g DW; MeJA, 1.03 times higher than the control sample), and deoxyschisandrin (max. 35.00 mg/100 g DW; MeJA, 1.06 times higher than the control sample) (Table 8).
Total lignan contents ranged from 114.80 mg/100 g DW (ETH, 4 days) to 153.20 mg/100 g DW (MeJA, 24h) (Table 8). The maximum total lignan content obtained was 1.13 times higher than for the control sample.
Trace amounts of lignans were found in culture media (<0.05 mg/100 g DW).
In general, for cultures grown in Plantform bioreactors, the most effective elicitor for which the highest individual and total lignan contents were obtained, was MeJA.
The accumulation of active compounds in plant cultures grown in bioreactors is less frequently studied due to the fact that for these experiments a much larger amount of plant tissue is required to initiate the experiment, as well as the availability of special bioreactor-like structures being limited [38]. Studies on the effect of YeE elicitation on dibenzocyclooctadiene lignan production in S. chinensis microshoot cultures maintained in Plantform bioreactors have been studied by us before [22]. Results proved that the supplementation with 1000 mg/L YeE on the 20th day of the growth cycle was the optimal. Through this elicitation scheme the total content of the estimated dibenzocyclooctadiene lignans was equal to 831.60 mg/100 g DW. The dominant dibenzocyclooctadiene lignans were schisandrin-186.8 mg/100 g DW, angeoyl/tigloyl-gomisin Q–183.4 mg/100 g DW and deoxyschisandrin–100.00 mg/100 g DW. In the cultures of S. rubriflora we tested, maintained in Plantform bioreactors, different lignans were proven to be dominant and their amounts were of lower order (Table 8).
The effect of elicitation treatments on the production of other lignan groups in the biomass of plant in vitro cultures grown in bioreactors is a new and little-exploited research direction [38]. Dougué Kentsop et al. recently tested production of arylnaphthalene lignan-justicidin B, in L. lewisii adventitious and hairy-roots cultures maintained in the stirred tank bioreactor. Both of the culture types were grown in the bioreactor for 3 weeks and then elicited with 100 μM MeJA and grown for a further one week. The justicidin B content in both cultures after treatment with MeJA doubled in comparison to the control and was to equal 99.2 and 132.6 mg/g DW, respectively [39].

2.3. Biotechnological Evaluation of Elicitation Results

The compounds obtained in the course of the experiment were analyzed, and their highest contents were extracted taking into account the elicitation conditions. The collected data were compared in relation to the multiplicity of the content increase in relation to the control and compared with the results of the analysis of the material obtained from the parent plants (Table 9).
For a number of compounds: rubrisandrin A, interiotherin C, schisandrin, gomisin D, J, N and A, schisantherin A, licarin A, and schisandrin C, their contents in extracts from in vitro cultures were higher than in extracts from fruits of parent plant. This is important, as the fruit is widely recognized as Schisandra’s raw material. Our study also proved higher values for individual compounds in extracts from in vitro cultures compared to the extracts from leaves and stems of parent plant material (Table 9). In this context, the results obtained have a potential applied nature.
Total lignan content was highest for the line M elicited with MeJA and was 368.50 mg/100 g DW and was 3.29 times higher than that of the control-non-elicited cultures. The content was 1.3 times higher than in the shoots, but 2.6-times lower than in the leaves and 2.1-times lower than in the fruit of the parent plant (Table 9).

3. Materials and Methods

3.1. Plant Material and Microshoot Culture Initiation

Plant material for in vitro culture initiation was obtained as part of cooperation with Clematis–Źródło Dobrych Pnączy (Pruszków, Poland) [40]. Moreover, the fruits, leaves and stems of the parent plant material were obtained from this arboretum. Plant species were identified by Dr. Szczepan Marczyński and Dr. Agnieszka Szopa. For these purposes the leaf buds of about 10 years old female (F) (100 individuals) and male (M) (50 individuals) S. rubriflora (Franch.) Rehd. et Wils specimens were collected in May 2018. Leaf buds were defatted with 70% ethanol (30 s) and then sterilized for 7 min with 0.1% HgCl2 (mercuric chloride II). Sterile buds were rinsed three times with sterile redistilled water and transferred to agar medium according to Murashige and Skoog (1962) (MS) [41] containing 1 mg/L BA (6-benzyladenine) and 0.5 mg/L NAA (1-naphtaleneacetic acid).
Agar (Duchefa Biochemie, 7.2 g/L) microshoot cultures of the male (M) and female (F) lines of S. rubriflora were run in Magenta TM B-cap dishes (product no. V8630-Sigma-Aldrich®, diameter: 60 mm, height: 70 mm, capacity: 100 mL), which each contained 30 mL of MS medium (pH 5.7–5.8). These microshoots were used to initiate experimental cultures.

3.2. Experimental Agitated Cultures

Experimental microshoot cultures were obtained by passaging 0.75 g of inoculum (initial fresh weight of microshoots) per 1 vessel (150 mL Erlenmayer flasks) containing 50 mL of standard liquid MS medium (without agar) supplemented with 1 mg/L BA and 1 mg/L IBA (indole-3-acetic acid). Agitated cultures were grown under constant artificial light (light-emitting diode (LED) white light, 90 ± 2 μmol m−2 s−1) at 24 ± 2 °C for 10 days. The addition of the individual elicitor (5 flasks per series; 3 culture series were carried out) followed on day 10 (Figure 1). Biomass harvesting occurred at: 24 h, 48 h, and the 4th day, 6th day, and 8th day after the addition of the elicitor. At the same time, control samples were run and harvested at appropriate intervals (not elicitor treated).
The culture media contained the following concentrations of elicitors: 200 mg/L of chitosan (CH; Sigma-Aldrich, St. Louis, MO, USA), 3000 mg/L of yeast extract (YeE; Sigma-Aldrich, St. Louis, MO, USA), 25 µM/L of ethephon (ETH; Sigma-Aldrich, St. Louis, MO, USA) and 50 µM/L of methyl jasmonate (MeJA; Sigma-Aldrich, St. Louis, MO, USA). The solutions of CH, ETH and MeJA were filter-sterilized using a 0.22 µm syringe filter (Millex®GP; Merck Millipore, Burlington, MA, USA), and the solution of YeE was autoclaved (at 121 °C, at a pressure of 0.1 MPa for 20 min) and added to the culture medium to obtain proper a concentration in the medium.
Stock solutions of each elicitor were prepared for the experiments. A concentrated solution of MeJA in which the concentration of MeJA was 0.00449 g/mL was prepared and added to flasks with experimental cultures to obtain a concentration of 50 µM/L. A concentrated solution of ETH in which the concentration of ETH was 3.6 mg/L was prepared and added to flasks with experimental cultures to obtain a concentration of 25 µM/L. A concentrated solution of CH in which the concentration of CH was 200 mg/L was prepared and added to flasks with experimental cultures to obtain a concentration of 50 µM/L. A concentrated solution of YeE was prepared according to the method of Peltonen et al. [42] in which the 30 mg/mL concentration of YeE was added to flasks with experimental cultures to obtain a concentration of 3 g/L.

3.3. Experimental Plantform TIS Cultures

Bioreactor cultures were conducted in commercial Plantform bioreactors-temporary immersion system-TIS (PlantForm company, Hjärup, Sweden). Experiments were conducted on microshoots of the M line of S. rubriflora. Nine grams of microshoots were inoculated per single bioreactor and 500 mL of MS medium with 1 mg/L BA and 1 mg/L IBA was used. Cultures were grown in constant artificial (light-emitting diode (LED) white light, 90 ± 2 μmol m−2 s−1), at 24 ± 2 °C, for 10 days. The flooding cycle of the bioreactors was set at 5 min every 90 min. The elicitor was added on the 10th day of culture. Elicitors were supplemented to the culture media at the same concentrations per volume of medium as were used in the agitated cultures. The choice of harvesting time for cultures conducted in bioreactors was dictated by the best results obtained at the agitated culture stage. Cultures were harvested depending on the elicitor used: MeJA after 24 h, CH after 48 h, YeE and ETH on day 4. There were 3 bioreactors for each elicitor. Three culture series were carried out.

3.4. Biomass Gains

Biomass gains of control samples, elicited samples and samples run in Plantform bioreactors for in vitro cultures of S. rubriflora lines F and M were measured. Biomass was separated from the culture medium and washed several times with redistilled water. To determine dry weight-DW (dry weight) gains, biomass was frozen at −20˚C, then freeze-dried (freeze dryer, Labconco Corporation, Kansas City, MO, USA) and weighed again. To determine biomass gains, growth index values for dry biomass-Gi (growth index) were calculated for F and M lines according to the formula [43]: Gi = Dwn Dwo Dwn × 100 , where Gi-growth index at time “n”; DWn-dry weight at time “n”; DWo-dry weight of inoculum.

3.5. Chromatographic Analysis of Lignans

Methanol extracts of biomass from the experimental cultures were prepared. Dry plant material was pulverized in a mixing ball mill (MM400, Retch, Haan, Germany) and dry biomass was weighed: 0.1 g from in vitro cultures of lines F and M. The material was then extracted with methanol (purity for HPLC analysis from: Merck)-2 mL. The extraction process was carried out twice in an ultrasonic bath (POLSONIC Palczynski Sp.J., Warsaw, Poland, Sonic 2 model) for 30 min. The obtained extracts were centrifuged for 5 min (4000 rpm) in a centrifuge (MPW Med. Instruments, model Centrifuge MPW-223E). The centrifuged extracts were filtered using sterilizing syringe strainers (Millex®GP, Millipore, pore diameter: 0.22 μm, Filter Unit) into appropriate vials for HPLC chromatographic analyses (Witko Sp.z.o.o.).
Lignans were determined by ultra-high performance liquid chromatography coupled to a tandem mass spectrometer (UHPLC–MS/MS) technique. The apparatus consisted of a UHPLC Infinity 1260 (Agilent, Wolbrom, Germany) and a 6410 MG/100 G DWQ LC/MS tandem quadrupole mass spectrometer (Agilent, Santa Clara, CA, USA). Samples in a volume of 2 µL were injected onto an analytical column (KinetexTM C18: 150 × 4.6 mm, 2.7 µm). The analytes were eluted in a gradient of 50% water in methanol (A) and 100% methanol (B) with the addition of 0.1% formic acid in both phases, from 20% to 65% solvent B for 22 min, at a mobile phase flow rate of 0.5 mL/min at 60 °C acc. to [11,18]. In addition, a DAD spectrophotometric detector was connected in the chromatographic system, and the tested compounds were monitored at a wavelength (λ) of 225 nm. For targeted profiling of lignans, a tandem quadrupole mass analyzer with electrospray ionization (ESI) was used in the positive atomic mass-to-charge ratio (m/z) ion monitoring mode. In order to obtain the greatest possible confidence in the identity of the compounds under study and the greatest possible sensitivity of the determination, the MRM (multiple reaction monitoring) technique was used, which involves selecting a single parent ion characteristic of the substance under study and then monitoring the progeny ions formed after collision with inert gas particles in a collision chamber. Standard lignan substances were purchased from ChemFaces Biochemical Co., Ltd. (Wuhan, China).

3.6. Statistical Analysis

Quantitative results are expressed in mg/100 g DW (dry weight) as the mean ± SD (standard deviation) of three replicates (n = 3). The influence of elicitor treatment was evaluated by one-way ANOVA. Differences between means were calculated using Duncan’s multiple range test (p < 0.05) using the statistical package STATISTICA 13.0 (Stat-Soft, Inc., Tulsa, OK, USA).

4. Conclusions

The present study is the first such complex biotechnological study aimed at wide elicitation protocol elaboration using biotic elicitors-chitosan (CH) and yeast extract (YeE), as well as abiotic elicitors-methyl jasmonate (JaMe) and ethephon (ETH), for boosting the production of unique compounds from lignan groups. These metabolites are characteristic of S. rubriflora endemic Chinese species. Through our study we proved, for the first time, possibilities for increasing their production in biomass cultures under in vitro conditions (in independence on environmental factors). Our study also described for the first time the influence of elicitation on lignan compounds’ production in the S. rubriflora Platform TIS bioreactors grown microshoot cultures. An important aspect of the research performed was also to compare the biosynthetic capabilities of the F and M lines, and thus the sexes on lignan production.
The results revealed a high competitiveness of S. rubriflora in vitro cultures in relation to soil grown plants. Our results showed new perspectives of potential in vitro cultures utilization as an alternative for a rare, hard-to-find plant material that is difficult to produce on an industrial scale.

Supplementary Materials

The following supporting information can be downloaded at: https://www.mdpi.com/article/10.3390/molecules27196681/s1, Table S1: The lignan production (mg/100 g DW ± SD) in experimental F and M lines of S. rubriflora microshoot cultures-control; traces = <0.05 mg/100 g DW. Table S2: The lignan production (mg/100 g DW ± SD) in experimental F and M lines of S. rubriflora microshoot cultures after elicitation with chitosan; traces = <0.05 mg/100 g DW. Table S3: The lignan production (mg/100 g DW ± SD) in experimental F and M lines of S. rubriflora microshoot cultures after elicitation with yeast extract; traces = <0.05 mg/100 g DW. Table S4: The lignan production (mg/100 g DW ± SD) in experimental F and M lines of S. rubriflora microshoot cultures after elicitation with ethephon; traces = <0.05 mg/100 g DW. Table S5: The lignan production (mg/100 g DW ± SD) in experimental F and M lines of S. rubriflora microshoot cultures after elicitation with methyl jasmonate; traces = <0.05 mg/100 g DW.

Author Contributions

Conceptualization, A.S; methodology, A.S., M.D.; formal analysis, A.S.; investigation, A.S., M.D., K.J., P.K. and O.S..; data curation, A.S. and M.D.; writing—original draft preparation, A.S.; writing—review and editing, A.S., M.D. and H.E.; visualization, A.S., M.D. and O.S.; supervision, A.S.; project administration, A.S.; funding acquisition, A.S. All authors have read and agreed to the published version of the manuscript.

Funding

This study was funded by National Science Centre, Poland; grant number 2016/23/D/NZ7/01316.

Institutional Review Board Statement

Not applicable.

Informed Consent Statement

Not applicable.

Data Availability Statement

Not applicable.

Conflicts of Interest

The authors declare no conflict of interest.

References

  1. Saunders, R.M. Monograph of Schisandra (Schisandraceae); American Society of Plant Taxonomists: Ann Arbor, MI, USA, 2000; Volume 58, pp. 1–146. [Google Scholar]
  2. Szopa, A.; Ekiert, R.; Ekiert, H. Current knowledge of Schisandra chinensis (Turcz.) Baill. (Chinese magnolia vine) as a medicinal plant species: A review on the bioactive components, pharmacological properties, analytical and biotechnological studies. Phytochem. Rev. 2017, 16, 195–218. [Google Scholar] [CrossRef] [PubMed] [Green Version]
  3. European Directorate for the Quality of Medicines. Schisandrae chinensis fructus. European Pharmacopoeia 9.0.; European Directorate for the Quality of Medicines: Strasburg, France, 2008. [Google Scholar]
  4. Upton, R. American Herbal Pharmacopoeia: Botanical Pharmacognosy—Microscopic Characterization of Botanical Medicines; American Herbal Pharmacopoeia/CRC Press: Boca Raton, FL, USA, 2016; ISBN 1420073281. [Google Scholar]
  5. WHO. Fructus Schisandrae. In WHO Monographs on Selected Medicinal Plants; World Health Organization: Geneva, Switzerland, 2007; Volume 3. [Google Scholar]
  6. Hancke, J.L.; Burgos, R.A.; Ahumada, F. Schisandra chinensis (Turcz.) Baill. Fitoterapia 1999, 70, 451–471. [Google Scholar] [CrossRef]
  7. Nowak, A.; Zakłos-Szyda, M.; Błasiak, J.; Nowak, A.; Zhang, Z.; Zhang, B. Potential of Schisandra chinensis (Turcz.) Baill. in human health and nutrition: A review of current knowledge and therapeutic perspectives. Nutrients 2019, 11, 333. [Google Scholar] [CrossRef] [PubMed] [Green Version]
  8. Szopa, A.; Barnaś, M.; Ekiert, H. Phytochemical studies and biological activity of three Chinese Schisandra species (Schisandra sphenanthera, Schisandra henryi and Schisandra rubriflora): Current findings and future applications. Phytochem. Rev. 2019, 18, 109–128. [Google Scholar] [CrossRef] [Green Version]
  9. Xiao, W.L.; Wang, R.R.; Zhao, W.; Tian, R.R.; Shang, S.Z.; Yang, L.M.; Yang, J.H.; Pu, J.X.; Zheng, Y.T.; Sun, H.D. Anti-HIV-1 activity of lignans from the fruits of Schisandra rubriflora. Arch. Pharm. Res. 2010, 33, 697–701. [Google Scholar] [CrossRef]
  10. Xiao, W.; Yang, S.-Y.; Yang, L.-M.; Yang, G.; Wang, R.; Zhang, H.; Zhao, W.; Pu, J.-X.; Lu, Y.; Zheng, Y.-T.; et al. Chemical constituents from the leaves and stems of Schisandra rubriflora. J. Nat. Prod. 2010, 73, 221–225. [Google Scholar] [CrossRef]
  11. Szopa, A.; Dziurka, M.; Warzecha, A.; Kubica, P.; Klimek-Szczykutowicz, M.; Ekiert, H. Targeted Lignan Profiling and Anti-Inflammatory Properties of Schisandra rubriflora and Schisandra chinensis Extracts. Molecules 2018, 23, 3103. [Google Scholar] [CrossRef] [Green Version]
  12. Wang, H.J.; Chen, Y.Y. Studies of lignans from Schisandra rubriflora Rhed et Wils. Acta Pharm. Sin. 1985, 20, 832–841. [Google Scholar]
  13. Chen, C.Y.; Liu, S.Y.; Yan, Y.; Yin, L.; Di, P.; Liu, H.M.; Liu, H.Z. Candidate genes involved in the biosynthesis of lignan in Schisandra chinensis fruit based on transcriptome and metabolomes analysis. Chin. J. Nat. Med. 2020, 18, 684–695. [Google Scholar] [CrossRef]
  14. Sahoo, D.K.; Stork, J.; Debolt, S.; Maiti, I.B. Manipulating cellulose biosynthesis by expression of mutant Arabidopsis proM24:CESA3ixr1-2 gene in transgenic tobacco. Plant Biotechnol. J. 2013, 11, 362–372. [Google Scholar] [CrossRef] [PubMed]
  15. Chen, M.; Kilgore, N.; Lee, K.H.; Chen, D.F. Rubrisandrins A and B, lignans and related anti-HIV compounds from Schisandra rubriflora. J. Nat. Prod. 2006, 69, 1697–1701. [Google Scholar] [CrossRef] [PubMed]
  16. Lu, H.; Liu, G.T. Anti-oxidant activity of dibenzocyclooctene lignans isolated from Schisandraceae. Planta Med. 1992, 58, 311–313. [Google Scholar] [CrossRef] [PubMed]
  17. Szopa, A.; Dziurka, M.; Granica, S.; Klimek-Szczykutowicz, M.; Kubica, P.; Warzecha, A.; Jafernik, K.; Ekiert, H. Schisandra rubriflora Plant Material and In Vitro Microshoot Cultures as Rich Sources of Natural Phenolic Antioxidants. Antioxidants 2020, 9, 488. [Google Scholar] [CrossRef]
  18. Sobstyl, E.; Szopa, A.; Dziurka, M.; Ekiert, H.; Nikolaichuk, H.; Choma, I.M. Schisandra rubriflora Fruit and Leaves as Promising New Materials of High Biological Potential: Lignan Profiling and Effect-Directed Analysis. Molecules 2022, 27, 2116. [Google Scholar] [CrossRef]
  19. Verpoorte, R.; Contin, A.; Memelink, J. Biotechnology for the production of plant secondary metabolites. Phytochem. Rev. 2002, 1, 13–25. [Google Scholar] [CrossRef]
  20. Ramirez-Estrada, K.; Vidal-Limon, H.; Hidalgo, D.; Moyano, E.; Golenioswki, M.; Cusidó, R.M.; Palazon, J. Elicitation, an effective strategy for the biotechnological production of pioactive high-added value compounds in plant cell factories. Molecules 2016, 21, 182. [Google Scholar] [CrossRef] [PubMed] [Green Version]
  21. Dias, M.I.; Sousa, M.J.; Alves, R.C.; Ferreira, I.C.F.R. Exploring plant tissue culture to improve the production of phenolic compounds: A review. Ind. Crops Prod. 2016, 82, 9–22. [Google Scholar] [CrossRef] [Green Version]
  22. Szopa, A.; Kokotkiewicz, A.; Król, A.; Luczkiewicz, M.; Ekiert, H. Improved production of dibenzocyclooctadiene lignans in the elicited microshoot cultures of Schisandra chinensis (Chinese magnolia vine). Appl. Microbiol. Biotechnol. 2018, 102, 945–959. [Google Scholar] [CrossRef] [PubMed] [Green Version]
  23. Klimek-Szczykutowicz, M.; Dziurka, M.; Blažević, I.; Đulović, A.; Apola, A.; Ekiert, H.; Szopa, A. Impacts of elicitors on metabolite production and on antioxidant potential and tyrosinase inhibition in watercress microshoot cultures. Appl. Microbiol. Biotechnol. 2022, 106, 619–633. [Google Scholar] [CrossRef]
  24. Kikowska, M.; Kedziora, I.; Krawczyk, A.; Thiem, B. Methyl jasmonate, yeast extract and sucrose stimulate phenolic acids accumulation in Eryngium planum L. shoot cultures. Acta Biochim. Pol. 2015, 62, 197–200. [Google Scholar] [CrossRef] [Green Version]
  25. Brasili, E.; Praticò, G.; Marini, F.; Valletta, A.; Capuani, G.; Sciubba, F.; Miccheli, A.; Pasqua, G. A non-targeted metabolomics approach to evaluate the effects of biomass growth and chitosan elicitation on primary and secondary metabolism of Hypericum perforatum in vitro roots. Metabolomics 2014, 10, 1186–1196. [Google Scholar] [CrossRef]
  26. Khan, T.; Abbasi, B.H.; Khan, M.A.; Azeem, M. Production of biomass and useful compounds through elicitation in adventitious root cultures of Fagonia indica. Ind. Crops Prod. 2017, 108, 451–457. [Google Scholar] [CrossRef]
  27. Denbow, M.L.; Eckersley, R.; Welsh, A.W.; Taylor, M.J.; Carter, R.C.; Cosgrove, D.O.; Fisk, N.M. Effects of elicitation on the production of saponin in cell culture of Panax ginseng. Plant Cell Rep. 2001, 20, 674–677. [Google Scholar] [CrossRef]
  28. Tonk, D.; Mujib, A.; Maqsood, M.; Ali, M.; Zafar, N. Aspergillus flavus fungus elicitation improves vincristine and vinblastine yield by augmenting callus biomass growth in Catharanthus roseus. Plant Cell. Tissue Organ Cult. 2016, 126, 291–303. [Google Scholar] [CrossRef]
  29. Kašparová, M.; Pilařová, P.; Tumová, L.; Siatka, T. Effect of precursor and phytohormones on podophyllotoxin production in Juniperus virginiana suspension cultures. Nat. Prod. Commun. 2018, 13, 1527–1529. [Google Scholar] [CrossRef] [Green Version]
  30. Anbazhagan, V.R.; Ahn, C.H.; Harada, E.; Kim, Y.S.; Choi, Y.E. Podophyllotoxin production via cell and adventitious root cultures of Podophyllum peltatum. Vitr. Cell. Dev. Biol.-Plant 2008, 44, 494–501. [Google Scholar] [CrossRef]
  31. Bhattacharyya, D.; Sinha, R.; Ghanta, S.; Chakraborty, A.; Hazra, S. Proteins differentially expressed in elicited cell suspension culture of Podophyllum hexandrum with enhanced podophyllotoxin content. Proteome Sci. 2012, 10, 34. [Google Scholar] [CrossRef] [Green Version]
  32. Sasheva, P.; Ionkova, I.; Stoilova, N. Methyl jasmonate induces enhanced podophyllotoxin production in cell cultures of thracian flax (Linum thracicum ssp. thracicum). Nat. Prod. Commun. 2015, 10, 1225–1228. [Google Scholar] [CrossRef] [Green Version]
  33. Ahmad, W.; Zahir, A.; Nadeem, M.; Garros, L.; Drouet, S.; Renouard, S.; Doussot, J.; Giglioli-Guivarc’h, N.; Hano, C.; Abbasi, B.H. Enhanced production of lignans and neolignans in chitosan-treated flax (Linum usitatissimum L.) cell cultures. Process Biochem. 2019, 79, 155–165. [Google Scholar] [CrossRef]
  34. Nadeem, M.; Abbasi, B.H.; Garros, L.; Drouet, S.; Zahir, A.; Ahmad, W.; Giglioli-Guivarc’h, N.; Hano, C. Yeast-extract improved biosynthesis of lignans and neolignans in cell suspension cultures of Linum usitatissimum L. Plant Cell. Tissue Organ Cult. 2018, 135, 347–355. [Google Scholar] [CrossRef]
  35. Wawrosch, C.; Schwaiger, S.; Stuppner, H.; Kopp, B. Lignan formation in hairy root cultures of Edelweiss (Leontopodium nivale ssp. alpinum (Cass.) Greuter). Fitoterapia 2014, 97, 219–223. [Google Scholar] [CrossRef] [PubMed]
  36. Schmitt, J.; Petersen, M. Pinoresinol and matairesinol accumulation in a Forsythia × intermedia cell suspension culture. Plant Cell. Tissue Organ Cult. 2002, 68, 91–98. [Google Scholar] [CrossRef]
  37. Sánchez-Sampedro, M.A.; Fernández-Tárrago, J.; Corchete, P. Yeast extract and methyl jasmonate-induced silymarin production in cell cultures of Silybum marianum (L.) Gaertn. J. Biotechnol. 2005, 119, 60–69. [Google Scholar] [CrossRef]
  38. Krol, A.; Kokotkiewicz, A.; Szopa, A.; Ekiert, H.M.; Luczkiewicz, M. Bioreactor-Grown Shoot Cultures for the Secondary Metabolite Production. In Plant Cell and Tissue Differentiation and Secondary Metabolites. Reference Series in Phytochemistry; Ramawar, K.G., Ekiert, H.M., Goyal, S., Eds.; Springer: Cham, Switzerland, 2021; pp. 187–247. [Google Scholar]
  39. Dougué Kentsop, R.; Consonni, R.; Alfieri, M.; Laura, M.; Ottolina, G.; Mascheretti, I.; Mattana, M. Linum lewisii Adventitious and Hairy-Roots Cultures as Lignan Plant Factories. Antioxidants 2022, 11, 1526. [Google Scholar] [CrossRef]
  40. Available online: http://www.clematis.com.pl/pl/ (accessed on 1 July 2022).
  41. Murashige, T.; Skoog, F. A revised medium for rapid growth and bio assays with tobacco tissue cultures. Physiol. Plant. 1962, 15, 473–497. [Google Scholar] [CrossRef]
  42. Peltonen, S.; Mannonen, L.; Karjalainen, R. Elicitor-induced changes of phenylalanine ammonia-lyase activity in barley cell suspension cultures. Plant Cell. Tissue Organ Cult. 1997, 50, 185–193. [Google Scholar] [CrossRef]
  43. Grzegorczyk, I.; Wysokińska, H. Liquid shoot culture of Salvia officinalis L. for micropropagation and production of antioxidant compounds; effect of triacontanol. Acta Soc. Bot. Pol. 2008, 77, 99–104. [Google Scholar] [CrossRef]
Figure 1. Examples of S. rubriflora agitated microshoot F and M lines appearance–control and after elicitor treatment.
Molecules 27 06681 g001
Figure 2. Biomass appearance of control and elicited in vitro cultures of S. rubriflora line M grown in Plantform bioreactors: (A)—control, (B)—CH, (C)—YeE, (D)—ETH, (E)—MeJA.
Molecules 27 06681 g002
Figure 3. Biomass gains of control and elicited in vitro cultures of S. rubriflora grown in Plantform bioreactors. Data expressed as the mean value ± SD (n = 3). Different superscript letters (a–c) within a row indicate significant differences between means (Duncan’s multiple range test; p < 0.05).
Molecules 27 06681 g003
Table 1. Comparison of biomass gains (Gi ± SD) of F and M lines of S. rubriflora agitated cultures depending on harvesting time and the elicitor used. Data expressed as the mean value ± SD (n = 3). Different superscript letters (a–c) within a row indicate significant differences between means (Duncan’s multiple range test; p < 0.05).
Time of
Harvesting
ControlElicitor
CHYeEETHMeJA
FMFMFMFMFM
24 h18.30 b ± 8.2020.24 b ± 1.4312.93 bc ± 11.5038.01 a ± 0.0623.35 b ± 7.5641.76 a ± 9.618.03 c ± 3.0731.36 ab ± 0.379.88 c ± 12.316.04 c ± 6.88
48 h14.19 ab ± 4.1326.20 a ± 19.5218.02 ab ± 4.5737.57 a ± 17.6015.78 ab ± 2.4833.82 a ± 11.4927.47 a ± 7.538.3 b ± 2.439.31 b ± 2.0410.87 b ± 12.08
4 days24.96 b ± 2.5351.12 a ± 0.4826.67 b ± 1.8949.49 a ± 14.3119.53 b ± 19.8440.85 a ±13.3214.29 c ± 7.4520.52 b ± 0.6012.56 c ± 11.5918.07 b ± 15.34
6 days22.76 b ± 7.9945.37 a ± 9.2426.69 b ± 1.9752.63 a ± 6.5930.00 b ± 7.0734.07 ab ± 13.9621.87 b ± 6.9316.04 c ± 6.5312.73 bc ± 15.4349.3 a ± 9.54
8 days17.95 b ± 23.2345.98 b ± 11.8932.27 b ± 10.9757.95 a ± 6.2531.51 b ± 10.4927.37 b ± 16.7824.95 b ± 9.6127.77 b ± 8.6442.99 b ± 7.7869.26 a ± 1.64
Table 2. Accumulation of lignans (mg/100 g DW) in agitated cultures of S. rubriflora lines F and M 24 h after addition of elicitor. Data expressed as the mean value ± SD (n = 3). Different superscript letters (a–f) within a row indicate significant differences between means (Duncan’s multiple range test; p < 0.05).
LignanControlElicitor
CHYeEETHMeJA
FMFMFMFMFM
Wulignan A10.10 a ± 0.010.02 b ± 0.0020.11 a ± 0.0030.05 b ± 0.010.05 b ± 0.002tracestracestraces0.07 b ± 0.01traces
Rubrisandrin Atraces *0.06 ± 0.01tracestracestracestracestracestracestracestraces
Interiotherin Ctracestraces0.11 a ± 0.0030.05 b ± 0.01tracestracestracestracestracestraces
Schisandrin 13.90 d ± 0.8223.00 c ± 2.4611.64 d ± 0.3634.26 b ± 3.7911.09 d ± 0.4960.19 a ± 5.656.20 e ± 0.6060.64 a ± 6.507.95 f ± 0.9471.98 a ± 11.33
Gomisin D1.08 e ± 0.066.48 d ± 0.690.55 f ± 0.0211.02 c ± 1.221.19 e ± 0.0521.45 ab ± 2.050.16 f ± 0.0220.48 b ± 2.200.23 f ± 0.0328.80 a ± 4.53
Gomisin J0.37 d ± 0.023.28 c ± 0.350.24 d ± 0.017.17 b ± 0.790.54 d ± 0.0213.67 a ± 1.16traces10.00 b ± 1.070.09 e ± 0.0115.71 a ± 2.47
Gomisin A4.60 e ± 0.2727.66 d ± 2.963.00 e ± 0.0951.10 c ± 5.656.03 e ± 0.2777.84 b ± 7.380.74 f ± 0.0774.62 b ± 8.001.32 f ± 0.1691.53 a ± 14.40
Gomisin G3.40 b ± 0.201.78 d ± 0.193.33 b ± 0.103.39 b ± 0.382.65 c ± 0.126.19 a ± 0.571.92 d ± 0.194.94 a ± 0.532.56 c ± 0.306.93 a ± 1.09
Licarin B0.15 a ± 0.010.06 c ± 0.010.10 b ± 0.0030.07 c ± 0.010.12 b ± 0.010.07 c ± 0.010.11 b ± 0.010.07 c ± 0.010.12 b ± 0.010.12 b ± 0.02
Epigomisin O0.60 a ± 0.040.07 f ± 0.010.43 b ± 0.010.13 e ± 0.010.35 c ± 0.020.27 c ± 0.030.24 c ± 0.020.21 d ± 0.020.35 c ± 0.040.29 c ± 0.05
Gomisin O2.49 a ± 0.150.28 f ± 0.032.59 a ± 0.080.63 e ± 0.12.32 a ± 0.101.44 b ± 0.131.34 b ± 0.131.16 b ± 0.122.26 a ± 0.271.82 b ± 0.27
Mesodihydroguaiaretic acidtracestraces0.07 b ± 0.0020.06 b ± 0.01traces0.14 a ± 0.01traces0.12 a ± 0.01traces0.13 a ± 0.02
Schisantherin A2.90 a ± 0.170.14 e ± 0.012.38 b ± 0.070.16 e ± 0.022.07 b ± 0.090.53 ± 0.041.29 c ± 0.130.32 d ± 0.042.05 b ± 0.240.46 d ± 0.07
Schisantherin B1.84 d ± 0.113.31 c ± 0.351.32 d ± 0.046.69 b ± 0.741.51 d ± 0.0711.81 a ± 1.100.64 e± 0.0612.74 a ± 1.370.80 e ± 0.0916.66 a ± 2.62
Licarin A9.94 b ±0.591.65 e ± 0.1812.30 a ± 0.385.81 c ± 0.645.19 c± 0.233.54 d ± 0.342.76 d ± 0.272.86 d ± 0.319.71 b ± 1.151.81 e ± 0.29
Schisanhenol 5.94 a ± 0.351.50 d ± 0.166.06 a ± 0.192.19 c ± 0.244.03 b ± 0.184.02 b ±0.382.35 c ± 0.234.09 b ± 0.443.59 b ± 0.434.74 b ± 0.75
Deoxyschisandrin11.79 d ± 0.7034.21 c ± 3.668.69 e ± 0.2753.87 b ± 5.9610.25 d ± 0.4585.16 a ± 7.913.58 e ± 0.3591.53 a ± 9.824.57 e ± 0.5493.04 a ± 14.64
Fragransin Atracestracestracestracestracestracestracestracestracestraces
Pregomisintracestracestracestracestracestracestracestracestracestraces
Gomisin N2.95 d ± 0.176.78 c ± 0.732.15 d ± 0.0713.88 b ± 1.532.56 d ± 0.1123.79 a ± 2.140.92 e ± 0.0922.00 a ± 2.361.68 d ± 0.2028.07 a ± 4.42
6-O-Benzylgomisin O0.51 b ± 0.030.29 c ± 0.030.42 b ± 0.010.58 b ± 0.060.41 b ± 0.021.21 a ± 0.110.21 c ± 0.021.01 a ± 0.110.32 c ± 0.041.22 a ± 0.19
Schisandrin C0.19 d ± 0.011.44 c ± 0.15traces2.98 b ± 0.330.19 d ± 0.015.24 a ± 0.47traces3.54 b ± 0.380.06 d ± 0.015.17 a ± 0.81
Total content62.80 d ± 3.72112.10 c ± 11.9855.50 e ± 1.32194.10 b ± 1.4650.60 e ± 2.22316.65 a ± 29.4622.60 g ± 2.19310.40 a ± 33.2837.80 f ± 4.47368.50 a ± 57.98
* traces < 0.05 mg/100 g DW.
Table 3. Accumulation of lignans (mg/100 g DW) in agitated cultures of S. rubriflora lines F and M 48 h after addition of elicitor. Data expressed as the mean value ± SD (n = 3). Different superscript letters (a–f) within a row indicate significant differences between means (Duncan’s multiple range test; p < 0.05).
LignanControlElicitor
CHYeEETHMeJA
FMFMFMFMFM
Wulignan A10.10 a ± 0.01traces *0.10 a ± 0.010.10 a ± 0.01tracestraces0.07 a ± 0.01traces0.06 a ± 0.003traces
Rubrisandrin Atracestracestracestracestracestracestracestracestracestraces
Interiotherin Ctracestraces0.10 a ± 0.010.10 a ± 0.01tracestracestracestracestracestraces
Schisandrin 16.67 e ± 1.9240.74 b ± 4.6411.20 f ± 1.1261.85 a ± 6.289.83 f ± 1.1156.37 a ± 4.5029.61 c ± 3.9243.15 b ± 3.8422.21 d ± 1.2434.25 c ± 3.07
Gomisin D1.47 e ± 0.1712.72 b ± 1.451.09 e ± 0.1124.47 a ± 2.480.36 f ± 0.0420.04 a ± 1.603.84 d ± 0.5115.51 b ± 1.381.97 e ± 0.118.30 c ± 0.74
Gomisin J0.65 e ± 0.087.66 b ± 0.870.44 e ± 0.0411.58 a ± 1.180.14 f ± 0.0210.17 a ± 0.811.84 d ± 0.247.66 b ± 0.680.73 e ± 0.045.16 c ± 0.46
Gomisin A5.66 d ± 0.6546.22 b ± 5.263.84 e ± 0.3881.59 a ± 8.281.38 f ± 0.1666.50 a ± 5.3115.90 c ± 2.1154.04 b ± 4.817.42 d ± 0.4241.11 b ± 3.68
Gomisin G3.45 b ± 0.403.16 bc ± 0.363.42 b ± 0.345.94 a ± 0.603.06 bc ± 0.344.26 b ± 0.346.53 a ± 0.873.84 c ± 0.346.04 a ± 0.341.92 d ± 0.17
Licarin B0.12 c ± 0.010.11 c ± 0.010.14 c ± 0.010.14 c ± 0.010.15 c ± 0.020.14 c ± 0.010.41 a ± 0.060.24 b ± 0.020.21 b ± 0.010.08 d ± 0.01
Epigomisin O0.64 b ± 0.070.17 cd ± 0.020.59 b ± 0.060.24 c ± 0.030.43 b ± 0.050.22 c ± 0.021.54 a ± 0.200.27 c ± 0.021.00 a ± 0.060.12 d ± 0.01
Gomisin O3.48 b ± 0.400.78 e ± 0.093.10 b ± 0.311.43 d ± 0.152.82 c ± 0.321.23 d ± 0.104.47 a ± 0.591.18 d ± 0.114.80 a ± 0.270.60 e ± 0.05
Mesodihydroguaiaretic acidtraces0.07 c ± 0.010.09 bc ± 0.010.09 bc ± 0.010.05 cd ± 0.010.11 b ± 0.010.16 a ± 0.020.08 c ± 0.010.11 b ± 0.010.07 c ± 0.01
Schisantherin A2.72 c ± 0.310.27 e ± 0.032.29 c ± 0.230.33 de ± 0.032.25 c ± 0.250.39 d ± 0.035.42 a ± 0.720.51 d ± 0.054.19 b ± 0.230.18 e ± 0.02
Schisantherin B2.06 d ± 0.247.78 b ± 0.891.54 e ± 0.1512.57 a ± 1.281.21 e ± 0.1410.65 a ± 0.854.73 c ± 0.639.45 a ± 0.842.82 d ± 0.165.35 c ± 0.48
Licarin A12.94 a ± 1.492.53 d ± 0.2914.85 a ± 1.4810.50 ab ± 1.077.48 b ± 0.843.58 c ± 0.296.81 b ± 0.902.95 d ± 0.268.68 b ± 0.494.19 c ± 0.38
Schisanhenol 5.65 c ± 0.653.52 d ± 0.405.74 c ± 0.574.14 d ± 0.425.60 c ± 0.634.02 d ± 0.3210.11 a ± 1.343.24 de ± 0.297.97 b ± 0.452.28 e ± 0.20
Deoxyschisandrin15.06 d ± 1.7367.13 ab ± 7.649.05 e ± 0.9082.87 a ± 8.417.40 e ± 0.8377.42 a ± 6.1823.55 c ± 3.1273.33 a ± 6.5315.86 d ± 0.8953.01 b ± 4.75
Fragransin Atracestracestracestracestracestracestracestracestracestraces
Pregomisintracestracestracestracestracestracestracestracestracestraces
Gomisin N3.00 d ± 0.3514.14 b ± 1.612.26 e ± 0.2320.49 a ± 2.081.86 e ± 0.2118.56 a ± 1.487.57 c ± 1.0017.89 a ± 1.594.55 d ± 0.2512.04 b ± 1.08
6-O-benzylgomisin O0.53 c ± 0.060.74 b ± 0.080.44 c ± 0.040.79 b ± 0.080.44 c ± 0.050.89 b ± 0.071.40 a ± 0.190.89 b ± 0.080.82 b ± 0.050.40 c ± 0.04
Schisandrin C0.23 d ± 0.032.74 b ± 0.310.16 d ± 0.024.16 a ± 0.42traces3.58 a ± 0.290.52 d ± 0.072.86 b ± 0.260.24 d ± 0.011.88 c ± 0.17
Total content74.50 c ± 8.56210.60 ab ± 23.9860.30 c ± 6.03323.30 a ± 32.8144.60 d ± 5.01278.19 a ± 22.22124.50 b ± 16.50237.10 a ± 21.1189.70 c ± 5.01171.00 b ± 15.31
* traces < 0.05 mg/100 g DW.
Table 4. Accumulation of lignans (mg/100 g DW) in agitated cultures of S. rubriflora lines F and M 4 days after addition of elicitor. Data expressed as the mean value ± SD (n = 3). Different superscript letters (a–f) within a row indicate significant differences between means (Duncan’s multiple range test; p < 0.05).
LignanControlElicitor
CHYeEETHMeJA
FMFMFMFMFM
Wulignan A10.16 a ± 0.020.05 c ± 0.010.16 a ± 0.020.08 c ± 0.010.11 b ± 0.01traces *tracestraces0.12 b ± 0.010.06 c ± 0.01
Rubrisandrin Atracestracestracestracestraces0.14 ± 0.01tracestracestracestraces
Interiotherin Ctracestraces0.16 a ± 0.020.08 b ± 0.01tracestracestracestracestracestraces
Schisandrin 11.17 d ± 1.1946.47 b ± 4.945.82 e ± 0.6243.38 b ± 3.2510.43 d ± 0.6370.80 a ± 5.7114.90 d ± 0.9557.02 ab ± 2.459.14 de ± 0.8035.16 c ± 3.30
Gomisin D1.69 d ± 0.1817.45 b ± 1.850.69 e ± 0.0715.02 b ± 1.131.97 d ± 0.1225.86 a ± 2.130.89 e ± 0.0622.50 a ± 0.970.45 e ± 0.0410.59 c ± 0.99
Gomisin J0.56 d ± 0.066.72 bc ± 0.710.29 f ± 0.038.84 b ± 0.660.78 d ± 0.0514.11 a ± 1.190.57 d ± 0.0414.59 a ± 0.630.26 f ± 0.025.00 c ± 0.470
Gomisin A6.15 c ± 0.6555.88 b ± 5.942.92 d ± 0.3156.64 b ± 4.258.05 c ± 0.4985.79 a ± 6.965.78 c ± 0.3782.32 a ± 3.542.59 d ± 0.2344.74 b ± 4.20
Gomisin G2.59 c ± 0.284.31 b ± 0.461.95 d ± 0.213.75 b ± 0.282.59 c ± 0.166.53 a ± 0.554.93 b ± 0.316.76 a ± 0.292.79 c ± 0.252.71 c ± 0.25
Licarin B0.16 a ± 0.020.05 c ± 0.010.05 c ± 0.01traces0.07 b ± 0.0040.15 a ± 0.010.17 a ± 0.010.10 b ± 0.0040.09 b ± 0.010.09 b ± 0.01
Epigomisin O0.38 b ± 0.040.19 c ± 0.020.23 bc ± 0.030.14 c ± 0.010.28 b ± 0.020.27 b ± 0.020.93 a ± 0.060.26 b ± 0.010.26 b ± 0.020.12 c ± 0.01
Gomisin O1.84 b ± 0.200.84 c ± 0.091.42 b ± 0.150.76 c ± 0.061.58 b ± 0.101.47 b ± 0.123.73 a ± 0.241.51 b ± 0.071.34 bc ± 0.120.55 c ± 0.05
Meso-dihydroguaiaretic acidtraces0.07 b ± 0.01traces0.09 b ± 0.010.06 b ± 0.0030.15 a ± 0.010.06 b ± 0.0040.13 a ± 0.010.06 b ± 0.010.07 b ± 0.01
Schisantherin A1.80 b ± 0.190.25 c ± 0.031.43 b ± 0.150.16 e ± 0.011.78 b ± 0.110.47 c ± 0.043.10 a ± 0.200.58 c ± 0.031.66 b ± 0.150.15 e ± 0.01
Schisantherin B1.50 c ± 0.167.46 b ± 0.790.88 d ± 0.097.50 b ± 0.561.61 c ± 0.1013.34 a ± 1.102.16 c ± 0.1415.17 a ± 0.650.89 d ± 0.086.43 b ± 0.60
Licarin A14.58 c ± 1.554.30 e ± 0.4620.41 b ± 2.1510.12 d ± 0.7616.32 c ± 0.993.46 e ± 0.263.10 e ± 0.206.14 de ± 0.2630.83 a ± 2.073.88 e ± 0.36
Schisanhenol 4.17 b ± 0.442.87 d ± 0.313.32 c ± 0.352.82 d ± 0.213.94 c ± 0.244.67 b ± 0.386.32 a ± 0.404.43 b ± 0.192.94 d ± 0.262.11 d ± 0.20
Deoxyschisandrin11.17 c ± 1.1957.36 b ± 6.096.61 d ± 0.7058.91 b ± 4.4211.45 c ± 0.7094.86 a ± 7.5611.58 c ± 0.7491.58 a ± 3.936.49 d ± 0.5755.33 b ± 5.19
Fragransin Atracestracestracestracestracestracestracestracestracestraces
Pregomisintracestracestracestracestracestracestracestracestracestraces
Gomisin N2.08 d ± 0.2213.07 b ± 1.391.53 de ± 0.1613.65 b ± 1.022.46 d ± 0.1524.89 a ± 2.053.48 c ± 0.2225.71 a ±0.011.63 de ± 0.1412.52 b ± 1.17
6-O-Benzylgomisin O0.37 c ± 0.040.63 b ± 0.070.28 c ± 0.030.56 b ± 0.040.35 c ± 0.021.12 a ± 0.090.82 a ± 0.051.21 a ± 0.050.34 c ± 0.030.52 b ± 0.05
Schisandrin C0.23 c ± 0.032.50 b ± 0.270.12 ce ± 0.012.77 b ± 0.210.30 c ± 0.025.05 a ± 0.420.19 c ± 0.014.81 a ± 0.210.07 e ± 0.011.94 b ± 0.18
Total content60.70 c ± 6.44220.50 b ± 23.4348.20 d ± 5.09225.20 b ± 6.8864.10 c ± 3.90353.17 a ± 28.6262.80 c ± 4.00334.90 a ± 14.3961.90 c ± 4.80182.00 b ± 17.07
* traces < 0.05 mg/100 g DW.
Table 5. Accumulation of lignans (mg/100 g DW) in agitated cultures of S. rubriflora lines F and M 6 days after addition of elicitor. Data expressed as the mean value ± SD (n = 3). Different superscript letters (a–f) within a row indicate significant differences between means (Duncan’s multiple range test; p < 0.05).
LignanControlElicitor
CHYeEETHMeJA
FMFMFMFMFM
Wulignan A10.15 b ± 0.020.06 c ± 0.010.36 a ± 0.040.11 b ± 0.010.26 a ± 0.02traces *tracestraces0.11 b ± 0.01traces
Rubrisandrin Atracestracestracestracestraces0.19 ± 0.01tracestracestracestraces
Interiotherin Ctracestraces0.36 a ± 0.040.11 b ± 0.01tracestracestracestracestracestraces
Schisandrin 16.52 c ± 2.1136.64 b ± 4.8916.20 c ± 1.6946.50 a ± 3.2514.74 c ± 0.8857.94 a ± 4.1313.74 c ± 0.8425.62 bc ± 1.9814.84 c ± 1.4228.92 b ± 1.23
Gomisin D1.45 e ± 0.1911.97 b ± 1.601.48 e ± 0.1515.18 b ± 1.062.84 d ± 0.1720.12 a ± 1.441.49 e ± 0.097.04 c ± 0.540.59 f ± 0.0611.42 b ± 0.49
Gomisin J0.37 e ± 0.053.19 bc ± 0.430.60 e ± 0.068.18 a ± 0.571.47 d ± 0.0912.37 a ± 0.880.64 e ± 0.042.69 c ± 0.210.30 e ± 0.034.76 b ± 0.20
Gomisin A5.06 e ± 0.6542.04 b ± 5.615.62 e ± 0.5953.51 a ± 3.7411.32 d ± 0.6868.37 a ± 4.877.04 de ± 0.4230.24 c ± 2.333.24 f ± 0.3138.78 b ± 1.65
Gomisin G3.99 a ± 0.512.83 b ± 0.383.13 b ± 0.333.81 a ± 0.273.06 b ± 0.184.74 a ± 0.343.43 b ± 0.211.50 c ± 0.123.97 a ± 0.383.03 b ± 0.13
Licarin B0.26 a ± 0.030.18 b ± 0.020.11 c ± 0.010.15 b ± 0.01traces0.06 c ± 0.0040.22 a ± 0.010.11 c ± 0.010.28 a ± 0.03traces
Epigomisin O0.61 a ± 0.080.15 c ± 0.020.57 a ± 0.060.17 c ± 0.010.36 b ± 0.020.20 c ± 0.010.55 a ± 0.030.08 d ± 0.010.49 a ± 0.050.10 d ± 0.004
Gomisin O2.88 a ± 0.370.55 e ± 0.072.78 a ± 0.300.88 ce ± 0.062.301 b ± 0.141.10 c ± 0.083.04 a ± 0.190.38 e ± 0.032.64 a ± 0.250.62 e ± 0.03
Meso-dihydroguaiaretic acidtracestraces0.08 ± 0.010.10 ± 0.010.07 ab ± 0.0040.11 a ± 0.010.06 b ± 0.004traces0.08 a ± 0.010.06 b ± 0.003
Schisantherin A2.89 a ± 0.370.20 c ± 0.032.33 b ± 0.240.35 c ± 0.032.21 b ± 0.130.31 c ± 0.022.42 a ± 0.150.10 c ± 0.012.77 a ± 0.270.14 c ± 0.01
Schisantherin B1.99 c ± 0.255.35 b ± 0.711.85 c ± 0.1910.04 a ± 0.702.12 c ± 0.1310.69 a ± 0.762.09 c ± 0.134.23 b ± 0.331.57 d ± 0.155.60 b ± 0.24
Licarin A22.54 b ± 2.874.83 d ± 0.6434.71 a ± 3.6211.52 c ± 0.8135.38 a ± 2.113.27 d ± 0.235.48 d ± 0.333.56 d ± 0.289.64 c ± 0.931.80 e ± 0.08
Schisanhenol 6.84 a ± 0.872.35 c ± 0.316.94 a ± 0.723.43 b ± 0.245.53 a ± 0.334.08 b ± 0.295.74 a ± 0.351.74 c ± 0.135.95 a ± 0.571.80 c ± 0.08
Deoxyschisandrin15.20 c ± 1.9449.24 b ± 6.5714.50 c ± 1.5177.72 a ± 5.4417.40 c ± 1.0480.44 a ± 5.7314.19 c ± 0.8639.93 b ± 3.0813.13 c ± 1.2643.25 b ± 1.84
Fragransin Atracestracestracestracestracestracestracestracestracestraces
Pregomisintracestracestracestracestracestracestracestracestracestraces
Gomisin N2.53 d ± 0.329.49 b ± 1.273.08 d ± 0.3218.82 a ± 1.323.88 d ± 0.2320.49 a ± 1.463.21 d ± 0.207.60 c ± 0.592.90 d ± 0.2810.24 b ± 0.44
6-O-Benzylgomisin O0.56 b ± 0.070.40 b ± 0.050.49 b ± 0.050.71 ab ± 0.050.48 b ± 0.031.12 a ± 0.080.51 b ± 0.030.29 c ± 0.020.57 b ± 0.060.40 bc ± 0.02
Schisandrin C0.20 e ± 0.011.99 b ± 0.270.19 e ± 0.023.17 a ± 0.220.52 de ± 0.033.93 a ± 0.280.24 e ± 0.021.10 c ± 0.090.10 f ± 0.011.67 b ± 0.07
Total content84.10 cd ± 10.72171.60 b ± 22.9095.00 c ± 9.95254.40 a ± 17.81103.90 c ± 6.20289.57 a ± 20.6364.10 d ± 3.90126.30 b ± 9.7463.20 d ± 6.07152.70 b ± 6.50
* traces < 0.05 mg/100 g DW.
Table 6. Accumulation of lignans (mg/100 g DW) in agitated cultures of S. rubriflora lines F and M 8 days after addition of elicitor. Data expressed as the mean value ± SD (n = 3). Different superscript letters (a–f) within a row indicate significant differences between means (Duncan’s multiple range test; p < 0.05).
LignanControlElicitor
CHYeEETHMeJA
FMFMFMFMFM
Wulignan A10.09 b ± 0.010.05 b ± 0.0030.31 a ± 0.020.08 b ± 0.010.31 a ± 0.04traces *tracestracestraces0.05 ± 0.01
Rubrisandrin Atracestracestracestracestraces0.15 ± 0.01tracestracestracestraces
Interiotherin Ctracestracestracestracestracestracestracestracestracestraces
Schisandrin 11.69 d ± 1.0231.38 b ± 1.958.27 d ± 0.6737.83 b ± 2.3917.49 c ± 2.0247.87 a ± 3.6814.52 cd ± 1.0529.40 b ± 2.1410.22 d ± 0.9256.95 a ± 5.09
Gomisin D1.38 d ± 0.1210.00 b ± 0.620.57 e ± 0.0512.26 b ± 0.781.66 d ± 0.217.35 a ± 1.331.11 d ± 0.086.91 c ± 0.500.77 e ± 0.0718.53 a ± 1.66
Gomisin J0.36 d ± 0.033.52 c ± 0.220.22 e ± 0.025.79 b ± 0.370.63 d ± 0.088.90 a ± 0.690.44 d ± 0.032.97 c ± 0.220.35 d ± 0.079.23 a ± 0.83
Gomisin A4.77 d ± 0.4237.39 c ± 2.331.77 f ± 0.1545.03 b ± 2.845.41 d ± 0.6558.65 a ± 4.515.86 d ± 0.4237.00 c ± 2.693.72 e ± 0.3369.87 a ± 6.24
Gomisin G3.35 b ± 0.292.46 c ± 0.152.71 c ± 0.222.66 c ± 0.174.08 a ± 0.494.25 a ± 0.334.31 a ± 0.312.07 d ± 0.153.02 b ± 0.274.52 a ± 0.40
Licarin B0.14 c ± 0.010.14 c ± 0.010.09 d ± 0.010.13 c ± 0.010.16 b ± 0.020.07 d ± 0.010.15 bc ± 0.010.14 c ± 0.010.19 a ± 0.020.10 d ± 0.01
Epigomisin O0.52 b ± 0.050.18 d ± 0.010.33 c ± 0.030.12 e ± 0.010.69 a ± 0.080.19 d ± 0.020.54 b ± 0.040.11 e ± 0.010.39 c ± 0.040.19 d ± 0.02
Gomisin O2.68 b ± 0.230.76 d ± 0.051.84 c ± 0.150.61 de ± 0.043.36 a ± 0.410.83 d ± 0.062.70 b ± 0.190.55 e ± 0.042.37 b ± 0.210.93 d ± 0.08
Mesodihydroguaiaretic acidtracestraces0.07 c ± 0.010.07 c ± 0.010.09 b ± 0.010.07 c ± 0.010.06 c ± 0.004tracestraces0.23 a ± 0.02
Schisantherin A2.64 a ± 0.230.29 e ± 0.021.38 c ± 0.110.19 f ± 0.012.49 b ± 0.270.22 e ± 0.023.01 a ± 0.220.18 f ± 0.012.11 b ± 0.190.42 d ± 0.04
Schisantherin B1.84 d ± 0.165.09 c ± 0.321.00 e ± 0.087.45 bc ± 0.472.18 d ± 0.269.02 b ± 0.691.89 d ± 0.144.98 c ± 0.361.28 e ± 0.1210.21 a ± 0.91
Licarin A11.61 b ± 1.016.06 c ± 0.3831.81 a ± 2.608.97 bc ± 0.5637.54 a ± 4.512.68 e ± 0.215.39 d ± 0.392.84 e ± 0.215.04 d ± 0.454.04 d ± 0.36
Schisanhenol 5.36 b ± 0.472.15 d ± 0.154.79 b ± 0.392.48 d ± 0.167.52 a ± 0.883.31 cd ± 0.254.44 c ± 0.322.03 d ± 0.155.12 b ± 0.463.30 cd ± 0.30
Deoxyschisandrin12.53d ± 1.0944.70 c ± 2.807.39 e ± 0.6059.76 bc ± 3.7616.14 d ± 1.9069.68 a ± 5.3410.53 d ±0.7649.35 c ± 3.6010.08 de ±0.9180.06 a ± 7.15
Fragransin Atracestracestracestracestracestracestracestracestracestraces
Pregomisintracestracestracestracestracestracestracestracestracestraces
Gomisin N2.82 ef ± 0.259.14 c ± 0.571.55 ± 0.1313.85 b ± 0.883.67 e ± 0.4317.52 a ± 1.343.11 e ± 0.2210.33 bc ± 0.752.05 f ± 0.1819.55 a ± 1.75
6-O-benzylgomisin O0.54 b ± 0.050.43 e ± 0.030.33 f ± 0.030.49 be ± 0.030.64 b ± 0.080.85 a ± 0.070.54 b ± 0.040.42 e ± 0.030.38 e ± 0.030.83 a ± 0.07
Schisandrin C0.24 e ± 0.021.72 bc ± 0.110.08 f ± 0.012.43 b ± 0.150.24 e ± 0.033.44 a ± 0.270.17 e ± 0.011.47 c ± 0.110.15 e ± 0.013.08 a ± 0.28
Total content62.70 e ± 5.45155.77 c ± 9.7164.55 e ± 5.24200.21 b ± 12.62104.29 d ± 12.35245.13 a ± 18.8358.80 e ± 4.23150.80 c ± 10.9747.33 f ± 4.2647.30 f ± 25.21
* traces < 0.05 mg/100 g DW.
Table 7. Comparison of dibenzocyclooctadiene lignans content and elicitation conditions in microshoot, agitated in vitro cultures of S. rubriflora and S. chinensis species [22].
Dibenzocyclooctadiene LignansS. rubrifloraS. chinensis
Maximal Content
(mg/100 g DW)
Elicitation ConditionsThe Fold Increase in Content Compared to the ControlMaximal Content
(mg/100 g DW)
Elicitation ConditionsThe Fold Increase in Content Compared to the Control
Schisandrin 71.98 ± 11.33MeJA, 50 µM, 24 h3.13×183.60 ± 9.10CdCl2, 1000 µM, 10 days2.28×
Gomisin A91.53 ± 14.40MeJA, 50 µM, 24 h3.31×115.90 ± 17.00CdCl2, 1000 µM, 10 days2.20×
Gomisin G6.93 ± 1.09MeJA, 50 µM, 24 h3.91×11.80 ± 1.30YeE, 3000 mg/L, days 03.03×
Schisantherin A5.42 ± 0.72ETH, 25 µM, 48 h1.99×5.60 ± 0.10YeE, 3000 mg/L, days 03.11×
Schisantherin B16.66 ± 2.62MeJA, 50 µM, 24 h5.03×28.20 ± 0.5YeE, 1000 mg/L, 20 days2.61×
Schisanhenol 10.11 ± 1.34ETH, 25 µM, 48 h1.79×11.10 ± 0.70CdCl2, 1000 µM, 10 days4.44×
Deoxyschisandrin94.86 ± 7.56YeE, 3000 mg/L, 4 days1.65×67.4 ± 5.10YeE, 5000 mg/L, days 01.95×
Total content368.50 ± 57.98MeJA, 50 µM, 24h3.29×730.60 ± 53.80CdCl2, 1000 µM, 10 days2.0×
Table 8. Content (mg/100 g DW ± SD) of lignans in extracts from S. rubriflora microshoot cultures grown in Plantform bioreactors; control and elicited. Data expressed as the mean value ± SD (n = 3). Different superscript letters (a–c) within a row indicate significant differences between means (Duncan’s multiple range test; p < 0.05).
LignanControlElicitor
CHYeEETHMeJA
Wulignan A1traces *tracestracestracestraces
Rubrisandrin Atracestraces0.08 ± 0.01tracestraces
Interiotherin Ctracestracestracestracestraces
Schisandrin 30.10 a ± 2.9028.7 a ± 4.5030.00 a ± 4.0025.00 b ± 1.437.6 a ± 4.00
Gomisin D10.7 a ± 1.009.60 ab ± 1.509.8 a ± 1.309.00 b ± 0.5011.30 a ± 1.20
Gomisin J3.45 b ± 0.332.86 bc ± 0.453.07 b ± 0.412.77 c ± 0.154.40 a ± 0.47
Gomisin A39.98 a ± 3.8034.00 ab ± 5.3035.06 ab ± 4.6031.42 b ± 1.8041.01 a ± 4.40
Gomisin G3.16 a ± 0.302.48 b ± 0.402.62 ab ± 0.302.36 b ± 0.103.33 a ± 0.40
Licarin Btracestracestracestracestraces
Epigomisin O0.10 a ± 0.010.10 a ± 0.010.09 ab ± 0.010.08 b ± 0.010.11 a ± 0.01
Gomisin O0.40 a ± 0.040.34 b ± 0.050.35 b ± 0.050.30 c ± 0.020.42 a ± 0.04
Mesodihydroguaiaretic acidtracestracestracestracestraces
Schisantherin A0.08 b ± 0.010.08 b ± 0.010.08 b ± 0.0130.00 a ± 0.060.09 b ± 0.01
Schisantherin B4.50 a ± 0.404.40 ab ± 0.704.30 ab ± 0.603.60 b ± 0.204.60 a ± 0.50
Licarin A0.58 b ± 0.060.85 a ± 0.130.51 b ± 0.070.38 c ± 0.020.47 b ± 0.05
Schisanhenol 1.30 a ± 0.101.30 a ± 0.201.30 a ± 0.201.10 a ± 0.101.30 a ± 0.10
Deoxyschisandrin33.00 a ± 3.0035.00 a ± 6.0037.00 a ± 5.0029.00 b ± 2.0035.00 a ± 4.00
Fragransin Atracestracestracestracestraces
Pregomisintracestracestracestracestraces
Gomisin N7.30 a ± 0.707.50 a ± 1.207.90 a ± 1.105.9 b ± 0.307.80 a ± 0.80
6-O-Benzylgomisin O0.70 ab ± 0.100.80 a ± 0.100.80 a ± 0.100.6 b ± 0.010.80 a ± 0.10
Schisandrin C4.60 a ± 0.404.20 ab ± 0.704.40 a ± 0.603.60 b ± 0.205.10 a ± 0.50
Total content136.00 ab ± 3.06132.40 b ± 21.25137.80 ab ± 18.36114.80 c ± 6.87153.20 a ± 16.58
* traces < 0.05 mg/100 g DW.
Table 9. Comparison of maximum lignan contents (mg/100 g DW) obtained from elicitation experiments on microshoot cultures of lines F and M with their contents in the fruits, leaves and shoots of the parent plant S. rubriflora [11].
LignansIn Vitro Cultures After Elicitor TreatmentParent Plant
Maximal ContentElicitation ConditionsThe Fold Increase in Content Compared to the ControlFruitsLeavesStems
Wulignan A10.36 ± 0.04CH 50 µM, 6 days, line F2.37×19.390.04 (F)0.03 (F)
Rubrisandrin A0.19 ± 0.01YeE 3000 mg/L, 6 days, line F3.82×0.070.06 (F)0.1 (F)
Interiotherin C0.36 ± 0.04CH 50 µM, 6 days, line F7.16×traces *tracestraces
Schisandrin 71.98 ± 11.33MeJA 50 µM, 24h, line M3.13×6.575.69 (M)2.25 (M)
Gomisin D28.80 ± 4.53MeJA 50 µM, 24h, line M4.44×3.52116.51 (M)20.26 (M)
Gomisin J15.71 ± 2.47MeJA 50 µM, 24h, line M4.78×5.40.76 (M)0.36 (M)
Gomisin A91.53 ± 14.40MeJA 50 µM, 24h, line M3.31×0.754.20 (M)1.65 (M)
Gomisin G6.93 ± 1.09MeJA 50 µM, 24h, line M3.91×66.398.23 (M)3.67 (M)
Licarin B0.41 ± 0.06ETH 25 µM, 48h, line F3.33×1.980.41 (F)0.19 (F)
Epigomisin O1.54 ± 0.20ETH 25 µM, 48h, line F2.40×7.4610.62 (F)4.91 (F)
Gomisin O4.47 ± 0.59ETH 25 µM, 48h, line F1.38×103.6422.9 (F)12.07 (F)
Mesodihydroguaiaretic acid0.23 ± 0.02MeJA 50 µM, 8 days, line M4.62×1.030.32 (M)0.16 (M)
Schisantherin A30.00 ± 0.06ETH 25 µM, 4 days, line M bioreactor Plantform4.35×27.19226.8 (M)84.35 (M)
Schisantherin B16.66 ± 2.62MeJA 50 µM, 24 h, line M5.03×118.07104.28 (M)169.04 (M)
Licarin A37.54 ± 4.51YeE 3000 mg/L, 8 days, line F3.23×0.410.73 (F)0.33 (F)
Schisanhenol 10.11 ± 1.34ETH 25 µM, 48 h, line F1.79×268.022.05 (F)1.13 (F)
Deoxyschisandrin94.86 ± 7.56YeE 3000 mg/L, 4 days, line M1.65×104.320.38 (M)0.5 (M)
Gomisin N28.07 ± 4.42MeJA 50 µM, 24 h, line M4.14×19.22.21 (M)1.08 (M)
6-O-Benzylgomisin O1.40 ± 0.19ETH 25 µM, 48 h, line F2.64×35.28134.51 (F)72.38 (F)
Schisandrin C5.24 ± 0.47YeE 3000 mg/L, 24 h, line M3.64×4.960.19 (M)0.09 (M)
Total content368.50 ± 57.98MeJA 50 µM, 24h, line M3.29×793.67 (M)928.72 (M)283.54 (M)
* traces < 0.05 mg/100 g DW.
Publisher’s Note: MDPI stays neutral with regard to jurisdictional claims in published maps and institutional affiliations.

