Article

Optimized Sample Preparation and Microscale Separation Methods for High-Sensitivity Analysis of Hydrophilic Peptides

1
MS Proteomics Research Group, Research Centre for Natural Sciences, Magyar Tudósok Körútja 2, H-1117 Budapest, Hungary
2
Doctoral School of Pharmaceutical Sciences, Semmelweis University, Üllői út 26, H-1085 Budapest, Hungary
3
Department of Inorganic and Analytical Chemistry, Budapest University of Technology and Economics, Szt. Gellért tér 4, H-1111 Budapest, Hungary
4
Hevesy György PhD School of Chemistry, Eötvös Loránd University, Pázmány Péter Sétány 1/A, H-1117 Budapest, Hungary
*
Author to whom correspondence should be addressed.
These authors contributed equally to this work.
Molecules 2022, 27(19), 6645; https://doi.org/10.3390/molecules27196645
Submission received: 15 August 2022 / Revised: 29 September 2022 / Accepted: 4 October 2022 / Published: 6 October 2022
(This article belongs to the Special Issue Advanced Applications of Mass Spectrometry for Proteomics Analysis)

Abstract

:
The optimization of solid-phase extraction (SPE) purification and chromatographic separation is usually neglected during proteomics studies. However, the effects on detection performance are not negligible, especially when working with highly glycosylated samples. We performed a comparative study of different SPE setups, including an in-house optimized method and reversed-phase chromatographic gradients for the analysis of highly glycosylated plasma fractions as a model sample for glycopeptide analysis. The in-house-developed SPE method outperformed the graphite-based and hydrophilic interaction liquid chromatography (HILIC) purification methods in detection performance, recovery, and repeatability. During optimization of the chromatography, peak distribution was maximized to increase the peptide detection rate. As a result, we present sample purification and chromatographic separation methods optimized for the analysis of hydrophilic samples, the most important of which is heavily N-glycosylated protein mixtures.

Graphical Abstract

1. Introduction

Shotgun proteomics has evolved to be the main technique for deciphering the deep proteome of human and non-human samples. Its clinical importance is unquestionable, especially in the discovery stage of diseases. The analysis of protein glycosylation has emerged to be a substantial part of proteomics-related studies, especially site-specific characterization via the mass spectrometry measurement of tryptic glycopeptides. However, methods are usually optimized for general proteomics workflows or highly carbohydrate-specific applications. Protein glycosylation analysis is challenging due to the structural variability and the highly hydrophilic nature of the sample. Because of the large difference in molecular characteristics, integrating the analysis of samples containing highly glycosylated proteins (thus adding a hydrophilic character) into workflows optimized for general proteomics screening results in sub-optimal analytical performance. This necessitates the constant development of methods for highly glycosylated samples, with secondary considerations of the sample origin as well.
Several different chromatographic techniques have been described for (glyco)proteomics. Reversed-phase (RP) chromatography using C18-based packed-bed stationary phase is the most common [1], mainly due to its robustness and easy accessibility as compared to other phases with more specific uses. The state-of-the-art high-performance nanoflow high performance liquid chromatography (nanoHPLC) methods build on the use of 15–50 cm long capillary columns operating with 1–4 h long gradients [2]. The main aims during chromatographic method development for (glyco)proteomics are to maximize peak capacity, the number of detected peptides and proteins, and the sequence coverage of each protein simultaneously [3,4,5]. This can be achieved by careful optimization to maximize the distribution of peaks along the entire elution window. Solid-phase extraction (SPE) purification is inevitable before analysis to eliminate matrix effects and increase the lifespan of the separation column. Similarly, to chromatographic separation, SPE is mainly operated with C18-based resins. However, there is a larger variety of available stationary phases on the market. The importance of a sample-type-dependent optimization is not negligible for this step. Temperature, solvent composition during loading and elution, and the type and concentration of ion pairing agents at loading can basically determine the recovery and peptide detection performance [6,7,8]. In cases where the methods are not well optimized for a given sample type, a significant detection loss can be expected, mainly due to insufficient retention during SPE purification and trapping, ion suppression caused by co-elution, and retention time shifts during the first half of the elution window.
For the SPE purification of glycopeptides, mainly C18-based [9] resins are used. However, when enrichment is employed at the glycopeptide level, this step is usually skipped, as during the process most of the unwanted matrix components are washed away. For glycopeptide enrichment, hydrophilic interaction liquid chromatography (HILIC) is the most widely used technique. HILIC is a useful tool for the comprehensive characterization of glycoproteins and their glycan isomers [10,11]. Moreover, the potential of the HILIC columns for the isomeric separation of fucosylated and sialylated glycoforms has already been demonstrated [12]. It can provide good separation based on the structure of the glycan side chains. However, it might not be ideal for the separation of the non-glycosylated peptides in the mixture. For these reasons, as an SPE method, HILIC is primarily used for the enrichment of glycans or glycopeptides [13], an example being the cotton-HILIC enrichment of glycans [14,15].
An alternative chromatographic mode in glycopeptide analysis is porous graphitized carbon (PGC) stationary phases, both for purification and separation of hydrophilic peptides. PGC has a unique retention mechanism comprising a combination of hydrophobic interactions, polar interactions of polarizable or polarized groups, and electronic interactions. The use of PGC allows for simplicity, good resolution, repeatability, and recovery. However, these properties are limited when investigating strongly polar components, due to the strong interactions compromising proper elution. Thus, graphite columns are the first choice when short, polar peptides need to be separated [16], up to the point of isomeric separation of different N-glycopeptides [17]. Taking these into consideration, the graphite-based methods might complement well RP SPE purification methods, where the most hydrophilic portion of the sample could be lost due to improper binding.
Here we present a detailed comparison of SPE methods for the purification of strongly hydrophilic peptide samples with fractionated plasma as a model sample. Two C18-based protocols, two different graphite phases, and a self-packed cotton-HILIC phase were compared in terms of detection and quantitation performance and selectivity. Next, we developed an RP-HPLC gradient maximizing the separation performance of hydrophilic species, thus increasing the detection and quantitation performance of the shotgun glycoproteomic workflow.

2. Results and Discussion

2.1. Sample Cleanup in the SPE System

The goal of this Section of the study was to compare our in-house optimized C
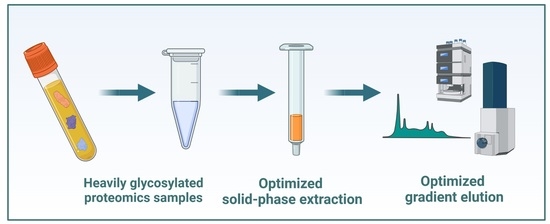
18 protocol (for a detailed protocol, see Section 3.3) developed for the purification of hydrophilic peptide samples to a number of other SPE methods. The C18 method bears differences in several aspects from the reference method: (i) the cartridge and the buffers (except the elution buffer) were cooled to 4 °C instead of room temperature, (ii) the ion pairing reagent for loading and wash was changed to heptafluorobutyric acid (HFBA) instead of trifluoroacetic acid (TFA), and (iii) a third elution step was added with formic acid (FA) instead of TFA to reduce ion pairing effects (Figure 1a).
The evaluation of performance was tested on fractionated plasma samples and was based on multiple characteristics, both qualitative, and quantitative. The tested SPE methods were as follows: C18 (C18 sorbent with in-house optimized method for hydrophilic species), TopTip (graphite sorbent), Pierce (graphite sorbent), and Cotton (cotton sorbent with HILIC characteristics). Moreover, two combined methods were tested where the flow-through of the C18 cleanup was further purified with the respective graphite resin (C18 + TopTip and C18 + Pierce). For a visual demonstration of the combined methods, see Figure 1b. As a reference method, the C18 sorbent using the manufacturer’s protocol was chosen. Each method was carried out in triplicate using 1 µg of fractionated plasma (for exact protocols, see Section 3.3).
First, the performance of the seven SPE methods was compared using qualitative measures: the number of proteins, peptides, glycopeptides, and glycosylation sites detected. These are shown in Figure 2.
The performance of the different SPE methods was markedly different. The C18 method showed the best performance regarding peptide detection, with more than 800 peptides detected on average (Figure 2a). The other C18-based methods were slightly worse (between 700 and 750 peptides detected), while the Pierce, TopTip, and Cotton methods performed significantly worse (less than 500, 600, and 700, detections respectively). These differences, however, were much smaller at the protein detection level, where the difference between the best and worst methods was only 25% (C18 and Pierce methods) compared to 43% for peptides. The C18 showed better performance than the Cotton and both graphite-based (Pierce, TopTip) sorbents (Figure 2b); on average, 41–49 proteins were detected with other sorbents, while this was 55 for the C18 method. It also showed a ca. 10% detection gain as compared to the reference method with the same sorbent. These small differences in protein detection are attributed to the relatively low complexity of the samples.
Next, we combined the C18 method with the graphite-based setups to see if an additional gain could be achieved by purifying the flow-through and combining the two elution fractions (Figure 1b). Both combined methods showed inferior performance to the C18 and reference methods. One possible explanation for this is that solvent evaporation is carried out twice using the combined method, thus decreasing peptide recovery after purification (Figure 2a). Note that 20–30% sample loss is expected during solvent evaporation with a heated vacuum centrifuge (unpublished data). However, this loss is strongly influenced by the organic solvent content, the volume, and thus the time of evaporation. Higher organic solvent content results in a larger interaction surface for non-specific binding with the tube walls, higher organic solvent content elevates the possibility of droplets escaping the tube, and longer times facilitate degradation of peptides and permanent interactions with tube walls. In our method, we evaporated solvents after the first step, and then the elution fraction of the second step was pipetted in the same Eppendorf tube and a second evaporation took place. Thus, two evaporation steps were performed for both parts of each sample in the combined methods, in contrast to the reference or the C18 methods, where only one drying down/reconstitution step is performed between the purification and the measurement. The increase in sample loss caused by the evaporation is balanced by the gain attributable to the second purification step. In the presented combinations, the evaporation sample loss was larger than the gain from the second purification, thus decreasing the number of detected peptides and proteins.
Although the graphite-based SPE methods performed worst for the clean-up of non-glycosylated species, they were among the best for glycopeptides (Figure 2c). The TopTip method was significantly better than any other method (on average over 45 glycopeptides were detected), while the Pierce and the C18 methods also showed good performance (38 and 39 detections, respectively). The Cotton method performed the worst (60% fewer detections than the TopTip method), contrary to our expectations based on its frequent use as a glycopeptide enrichment method. The number of detected glycosylation sites was highly similar for all methods except for the Cotton method, which is presumably due to the low reproducibility of the method (indicated by the high standard deviation in Figure 2c).
The assessment of possible differences in selectivity between the different SPE methods was carried out by the comparison of detected glycosylation sites; glycan types for glycopeptides; and peptide length, hydrophobicity (Grand Average of Hydropathy, GRAVY scores), and isoelectric point distributions for peptides.
Regarding glycopeptides, no differences in selectivity could be detected. The glycan types detected were mostly bi-, tri-, and tetra-antennary complex types for each method, and all of them contained both non-sialylated and highly-sialylated variants, which suggests no major differences in selectivity towards glycans (Table A1).
Similarly, peptide hydrophobicity (described by the GRAVY score) and isoelectric point distributions did not reveal significant differences in selectivity towards peptide backbones (Figure A1). GRAVY score and isoelectric point distributions showed excellent correlation between all methods (mean correlation coefficient of 0.995 and 0.998, respectively). However, peptide length distributions were different between the C18-containing sorbents and the Pierce, TopTip, and Cotton methods (Figure 3).
The shift in the peptide length distribution towards smaller peptides for the Pierce, TopTip, and (to a lesser extent) the Cotton methods (Figure 3), combined with the lower peptide detection numbers (Figure 2a), suggests that these methods are selective towards shorter peptides, and a significant number of larger peptides were lost. For the graphite-based sorbents, this is in line with their retention characteristics and suggests that the retention is dominated by polar interactions in this solvent system. This hypothesis is supported by the fact that peptide length distributions were heavily affected, while GRAVY score (average hydrophobicity normalized to peptide length) distributions were not (Figure A1).
Overall selectivity differences between the methods were addressed by comparing all the detected peptides on Venn diagrams. When comparing the C18 method with the TopTip and Cotton methods, we could conclude that only a minor selectivity difference could be observed. More than 70% of all peptides could be detected using the C18 method, but more than 30% could not be detected while using either TopTip or Cotton (Figure A2a). On the other hand, the unique detections with the TopTip and Cotton methods were around 10% of all peptides, which is comparable to the variability attributed to the data-dependent acquisition mode. Furthermore, there was no significant additional selectivity gain by using another type of stationary phase combined with the C18 method (Figure A2b).
Next, the performance of the different SPE methods was compared from a quantitative aspect. For this comparison, MaxQuant LFQ (Label-Free Quantitation) intensity values were used, and recovery values were calculated for each method relative to the reference method for proteins quantified in all the samples (28 in total). The recovery value and LFQ intensity relative standard deviation (RSD) distributions are presented in Figure 4.
The recovery value distributions (Figure 4a) show great variation between the different methods. For the C18-containing methods, most recovery values were between 0.8 and 1.2. However, for the graphite sorbents and the Cotton method, they showed a much wider distribution, which suggests uncontrolled binding and elution performance for the different peptides. The RSD values also varied greatly (Figure 4b) between the different methods. The C18-containing methods clearly showed superior repeatability compared to other methods, with the majority of RSD values under 0.1. Overall, the quantitative comparison suggests that there are differences in selectivity between the different methods (especially between the C18-containing and the other three methods) and that C18-based methods are more suitable for comparative proteomics due to their excellent repeatability.
In summary, the in-house optimized C18 method outperformed all other methods for the cleanup of heavily glycosylated samples in terms of peptide and protein detection and quantitation. This method has proven excellent utility in the analysis of other sample types as well in our laboratory, such as FFPE tissues [18], cell lines, and extracellular vesicles (unpublished data). The graphite-based methods showed slightly different selectivity than the C18-based methods, and the TopTip method was best for the detection of glycopeptides. On the other hand, the combined (C18 and graphite) methods showed similar behavior to the one-step C18 method, which implies that the addition of different retention mechanisms did not improve performance. Finally, the Cotton method showed poor overall performance except for good repeatability for quantitation. The performance of the different SPE methods is summarized in Table 1.

2.2. Reversed-Phase Gradient Separation

During the gradient development, we compared the performance of five different gradients. The gradient programs for the distinct gradients are summarized in Section 3.4. As the initial slope was presumed to have a crucial effect on the separation of the hydrophilic region, we designed methods from 0.21 to 0.51% acetonitrile/min initial slopes (Table 2).
The most important factor influencing the repeatability and detection performance of the chromatographic method is the distribution of peaks throughout the elution window. It depends on both the initial and average slope of the gradient. The 2step 4-20-40 method provided perfect peak distribution in the whole elution window (Figure 5b). The peak distributions using the other two lower-slope methods (Lin 4–27 and 2step 4-25-40) were also close to ideal. However, the higher initial slopes (0.256 and 0.280, respectively) caused the decrease of retention times generally, thus generating a time window scarce in peaks (95–110 min, Figure 5a,c). This difference is well-reflected in the detection rate; more peptides were detected using the 2step 4-20-40 method after 90 min, especially in the 110–120 min region, than with the other two above-mentioned ones. This effect is even more remarkable when looking at the two gradients with a larger average slope (Figure 5d,e). The shallow first gradient step in the 3step 4-15-35-50 method resulted in ideal peak distribution in the first 60 min, but the high second slope caused a stacked peak distribution between 70 and 80 min and a region scarce in peaks between 85 and 110 min. Finally, using a large linear slope in the Lin 4–50 method resulted in the elution of most of the peptides in the first 70 min in a visibly stacked manner, causing a region lacking peaks after 70 min. This unfavorable peak distribution resulted in the lack of detected peptides after 90 min and 78 min, respectively. The ion suppression caused by the stacked peak distribution made peptide detection less effective between 70 and 80 min for the 3step 4-15-35-50 method and between 50 and 80 min for the Lin 4–50 method.
The number of detected peptides ranges from 896 to 971 with the use of the different gradients (Table 3). Generally, gradients with a lower overall average slope (Lin 4–27, 2step 4-20-40, and 2step 4-25-40) resulted in better peptide detection numbers due to the near-optimal distribution of peaks through the elution window.
Peptide and glycopeptide detections up until 90 min are in good correlation with the effect of the average slope until that point. The three shallower gradients (2step 4-20-40, Lin 4–27, and 2step 4-25-40 in increasing order of slope) showed a decreasing trend with increasing slope due to co-elution and ion suppression of some components. The two higher-slope gradients resulted in higher detection rates that are almost identical since they had the same average slope, and almost all the components eluted in 90 min in both cases. Note that in the case of the shallower gradients, on average 102–169 peptides and up to 21 glycopeptides were detected in the last part of the elution window, while practically no additional detection happened in that Section when using the higher-slope gradients. Similar trends could also be observed when analyzing the detection rates until 60 min.
Surprisingly, the differences in peptide and glycopeptide detection were not reflected in protein and glycosite detection. The methods with a higher average slope allowed for slightly fewer detected proteins and slightly more glycosites, but the differences were not significant (Table 3).
Selectivity and quantitation performance can also be affected by the distribution of peaks in the different (hydrophilic and hydrophobic) regions of the chromatogram. However, these differences are inherently smaller than those seen with different sorbents for SPE. Small differences were observed with regard to the peptide length and GRAVY score distribution of peptides. Regarding quantitation, a gain of only 3% in the average peak areas was observed when using the optimal gradient as compared to the 3step 4-15-35-50 method. Additional information is provided in Appendix A.
In summary, gradients with shallower starting conditions resulted in better peak distribution not only in the first part but throughout the whole elution window. The 2step 4-20-40 method provided the best peak distribution and quantitation performance as well as repeatability in all the investigated means of measure (Table 4).

3. Materials and Methods

3.1. Materials

All chemicals used were HPLC-MS grade. Acetonitrile (ACN), water, acetone, formic acid (FA), ammonium-bicarbonate, and heptafluorobutyric acid (HFBA) were purchased from Merck (Darmstadt, Germany). Trifluoroacetic acid (TFA), dithiothreitol, and iodoacetamide were obtained from Thermo Scientific (Unicam, Budapest, Hungary). Methanol was purchased from VWR International (Debrecen, Hungary) and RapiGest was obtained from Waters (Budapest, Hungary).

3.2. Sample Preparation

Depleted and pooled human plasma samples were fractionated as described before [19]. In brief, a Poros R2 column was used, with a column temperature of 65 °C and a flow rate of 1 mL/min. The gradient started with 20% B and continued for 0.7 min, followed by a 15 min long gradient from 20 to 70% solvent B. Solvent A was water containing 0.07% (v/v) trifluoroacetic acid and solvent B was acetonitrile containing 0.07% (v/v) trifluoroacetic acid. The fraction between 2.0 and 2.5 mL was collected manually as a heavily glycosylated fraction. These fractions from five pooled human plasma samples were pooled for each set of experiments and then dried down with SpeedVac (miVac Duo Concentrator, Genevac Ltd., Ipswich, Suffolk, UK).
Digestion was carried out as described before [20,21]. The sample was dissolved in 10 μL of 8 M urea in 50 mM ammonium bicarbonate. DTT was added at a final concentration of 5 mM and incubated at 37 °C for 30 min. Alkylation was performed in the dark at room temperature for 30 min in the presence of 10 mM IAA. Samples were diluted 10-fold with 50 mM ammonium bicarbonate and 1 μL of a 10 ng/μL Trypsin/Lys-C mix (Promega, Madison, WI, USA) was added and incubated at 37 °C for 80 min. Next, 1 μL of 40 ng/μL Trypsin (Promega, Madison, WI, USA) was added and the samples were incubated for another 2 h. Digestion was quenched by the addition of 1 μL of formic acid. Samples were separated into aliquots containing 1 μg of protein, then dried down and stored at -20 °C until further use.

3.3. Solid-Phase Extraction Cleanup

Sample cleanup was performed with spin tip SPE systems using centrifugation at 2500× g for 1 min. The sample loading, wash, and elution conditions used for the SPE optimization are summarized in Table 5. For the gradient optimization part, C18 SPE cleanup was used. After cleanup, all the samples were dried down and stored at −20 °C until reconstitution for measurement.
When applying the combined methods C18+Pierce and C18+TopTip, the flow-through of the C18 method at sample loading and wash were collected, dried down, and loaded to a Pierce or a TopTip phase, respectively. The elution fractions were added to the dried elution fraction of the C18 cleanup and dried down once again together. Therefore, the sample was subjected to solvent evaporation twice: the sample loading and wash fraction of the C18 step before the second loading to the graphite phase and after the elution from it, while the elution fraction of the C18 step was added after the elution and then after the addition of the elution fraction of the second (graphite) step.

3.4. Reversed-Phase Chromatographic Separation

Samples were dissolved in injection solvent (98% H2O, 2% ACN, and 0.1% FA) and were subjected to nanoLC-MS/MS analysis using a Dionex Ultimate 3000 RSLC nanoHPLC (Dionex, Sunnyvale, CA, USA). Trapping was performed on an Acclaim PepMap100 C18 (5 µm, 100 µm × 20 mm, Thermo Fisher Scientific, Waltham, MA, USA) trap column with 0.1% TFA + 0.01% HFBA (H2O) as the transport liquid. Peptides were separated on an Acquity M-Class BEH130 C18 analytical column (1.7 µm, 75 µm × 250 mm Waters, Milford, MA, USA) using the gradients listed in Table 6. Solvent A was 0.1% FA in H2O, Solvent B was 0.1% FA in ACN, the flow rate was 300 nL min−1, and the column temperature was 48 °C. The method 4-25-40 was used for the separation during the SPE optimization phase with 600 ng injected amounts.

3.5. Mass Spectrometry Analysis

The nanoHPLC was coupled to a Bruker Maxis II QTOF (Bruker Daltonik GmbH, Bremen, Germany) via the CaptiveSpray nanoBooster ionization source (0.1% FA in ACN as booster liquid). Spectra were collected using a fixed cycle time of 2.5 sec and the following scan speeds: MS spectra at 3 Hz, while CID was performed on multiply charged precursors at 16 Hz for abundant ones and at 4 Hz for low-abundance ones. Internal calibration was performed by infusing sodium formate and data were automatically recalibrated using the Compass Data Analysis (v4.3; Bruker Daltonik GmbH, Bremen, Germany) software.

3.6. Data Analysis

Protein, peptide, and glycopeptide detection was performed using Byonic [22] (version 4.2.10) on a SwissProt Homo Sapiens database, with the maximum number of missed cleavages set at 2. Carbamidomethylation was set as a fixed modification, and methionine oxidation, acetylation, and deamidation were set as variable modifications. Protein FDR was controlled at 1%. For glycopeptide detection, the “N-glycan 182 no multiple fucose” built-in database was used. Protein quantitation was performed using MaxQuant [23] (version 1.6.17.0) on a SwissProt Homo Sapiens database with the maximum number of missed cleavages set at 2. Carbamidomethylation was set as a fixed modification, and methionine oxidation, acetylation, and deamidation were set as variable modifications. At all levels, FDR was controlled at 1%. ‘Match between runs’ was used with a 2 min window. Further important software settings are included in Table A2 and Table A3, respectively. The isoelectric points were calculated using the IPC—Isoelectric Point Calculator by Kozlowsky [24], and GRAVY scores [25] were calculated in Microsoft Excel. The data were then processed in Microsoft Excel, which was then used for all further calculations. Data visualization was performed using Microsoft Excel and PowerPoint. The graphical abstract and Figure 1 were created with Biorender.com.

4. Conclusions

In mass spectrometry-based proteomics, the effect of the sample cleanup and chromatographic separation is frequently overlooked. However, a significant gain in performance can be attributed to carefully optimized methods. We presented optimized methods for both the SPE cleanup and the chromatographic separation of highly glycosylated samples using fractionated human plasma as a model.
We compared seven different SPE methods, from which the in-house optimized C18 cleanup method showed excellent performance regarding protein and peptide detection and quantitation, as well as similar performance to the best-performing TopTip graphite phase for glycopeptide detection. This method has already been applied to several samples from various origins and extents of glycosylation and provided excellent results. The possible performance gain from the use of combined C18 and graphite phases was also tested. However, the optimized C18 method was found superior.
Using a well-optimized gradient, up to 8.4% gain was observed in the peptide detection numbers compared to a standard linear gradient. The good distribution of peaks in the first half of the elution window was particularly useful. These differences were not reflected in glycosite and protein detection, and selectivity is only moderately influenced by the selection of the gradient. However, the performance of quantitation is also affected to a minor extent. Using the developed method (2step 4-20-40), the detection and quantitation numbers are optimal along with experiencing the smallest standard deviations.

Author Contributions

Conceptualization, G.T.; methodology, S.S., M.B., K.D.F., F.B. and B.A.M.; investigation, G.T., M.B. and B.A.M.; resources, L.T. and L.D.; data curation, S.S. and G.T.; writing—original draft preparation, G.T. and S.S.; writing—review and editing, G.T., S.S., M.B., B.A.M., F.B., K.D.F., L.T. and L.D.; visualization, S.S.; supervision, L.T. and L.D.; project administration, L.T. and L.D.; funding acquisition, L.T. and L.D. All authors have read and agreed to the published version of the manuscript.

Funding

Project no. 2018–1.2.1-NKP-2018–00005 has been implemented with the support provided by the National Research, Development, and Innovation Fund of Hungary, financed under the 2018–1.2.1-NKP funding scheme. Project no. FK 131603 has been implemented with the support provided by the National Research, Development, and Innovation Fund of Hungary, financed under the NRDI FK_19 funding scheme. On behalf of Project “Proteomikai BigData értékelése” we thank for the usage of ELKH Cloud (https://science-cloud.hu/) that significantly helped us achieve the results published in this paper.

Institutional Review Board Statement

Ethical review and approval were waived for this study since a mixture of plasma protein fractions was investigated and no patient data was involved in the study.

Informed Consent Statement

Patient consent was waived due to the fact that a mixture of plasma protein fractions was investigated and no patient data was involved in the study.

Data Availability Statement

Experimental data has been submitted to the MassIVE data repository (https://massive.ucsd.edu/ProteoSAFe/static/massive.jsp, accessed on 15 August 2022) with the ID: MSV000090135.

Acknowledgments

Lilla Turiák is grateful for the support of the János Bolyai Research Scholarship of the Hungarian Academy of Sciences.

Conflicts of Interest

The authors declare no conflict of interest. The funders had no role in the design of the study; in the collection, analyses, or interpretation of data; in the writing of the manuscript; or in the decision to publish the results.

Sample Availability

Samples used in the study are available from the authors upon request.

Appendix A

Characterization of selectivity of the tested SPE methods.
Figure A1. (a) GRAVY score distribution of peptides detected with each SPE method. (b) Isoelectric point distributions of peptides detected with each SPE method.
Molecules 27 06645 g0a1
Figure A2. (a) Peptide detection overlap for the C18, TopTip, and Cotton methods. (b) Peptide detection overlap for the C18 and the two combined methods.
Molecules 27 06645 g0a2
Table A1. The different glycans detected (attached to the glycopeptide backbone) with each SPE method. N: N-acetyl hexosamine, H: hexose, F: fucose, S: sialic acid.
Glycan TypeReferenceC18PierceTopTipC18 + PierceC18 + TopTipCotton
Non-complex type-N3H4S1-N2F1--N3H4S1
N3H6 N3H4S1
Bi-antennary complex typeN4H5N4H5N4H5N4H5N4H5N4H5N4H5
N4H5F1S1N4H5F1N4H5F1N4H5F1N4H5F1S1N4H5F1S1N4H5F1S1
N4H5F1S2N4H5F1S1N4H5F1S1N4H5F1S1N4H5F1S2N4H5F1S2N4H5F1S2
N4H5S1N4H5F1S2N4H5F1S2N4H5F1S2N4H5S1N4H5S1N4H5S1
N4H5S2N4H5S1N4H5S1N4H5S1N4H5S2N4H5S2N4H5S2
N4H5S2N4H5S2N4H5S2N4H6F1S1 N4H6F1S1
N4H6F1
N4H6F1S1
Tri-antennary complex typeN5H4S2N5H3F1S1N5H5S2N5H5F1S1N5H4S1N5H6F1S2N5H4S2
N5H6F1S2N5H4S1N5H6F1S1N5H6N5H5S1N5H6F1S3N5H6F1S3
N5H6S2N5H4S2N5H6F1S2N5H6F1N5H6F1S2N5H6S1N5H6S2
N5H6S3N5H5F1N5H6F1S3N5H6F1S1N5H6S1N5H6S2N5H6S3
N5H5F1S1N5H6S1N5H6F1S2N5H6S2N5H6S3
N5H5F1S2N5H6S2N5H6F1S3N5H6S3
N5H6F1S2N5H6S3N5H6S1
N5H6F1S3 N5H6S2
N5H6S1 N5H6S3
N5H6S2
N5H6S3
Tetra-antennary (or larger) complex typeN6H7F1S4N6H7S1N6H7F1S2N6H6F1N6H7F1S2N6H7F1S2N6H7F1S3
N6H7S1N6H7S2N6H7F1S3N6H6F1S1N6H7F1S3N6H7F1S3N6H7F1S4
N6H7S2N6H7S3N6H7S1N6H7N6H7S1N6H7F1S4N6H7S1
N6H7S3N6H7S4N6H7S2N6H7F1S1N6H7S2N6H7S1N6H7S2
N6H7S4N7H8F1S2N6H7S3N6H7F1S2N6H7S3N6H7S2N6H7S4
N6H7S4N6H7F1S3N6H7S4N6H7S3
N7H8S1N6H7S1N7H4F1N6H7S4
N9H6N6H7S2
N6H7S3
N6H7S4
N7H8F1S3
The distribution of peaks in different (hydrophilic and hydrophobic) regions of the chromatogram can also affect selectivity; however, these differences are inherently smaller than those seen with different sorbents for SPE. Regarding the length of the detected peptides, all gradients showed practically the same distribution. The 3step 4-15-35-50 method showed a minor difference from the others: there was a 3.3–4.1% higher relative frequency of peptides consisting of a maximum of 15 amino acids (Figure A3a). The same, but more remarkable, differences are reflected in the GRAVY score distributions as well. Using the 3step 4-15-35-50 method, the relative frequency of the hydrophilic peptides (GRAVY < −0.5) was 7–10%, mainly making up for a loss in moderately hydrophobic (GRAVY −0.5–0.5) peptides (Figure A3b). These facts represent a loss in the detection of the longer (thus more hydrophobic) peptides due to the co-elution in the higher retention time regions. The used gradient, however, did not affect the isoelectric point distribution of the detected peptides (Figure A3c).
Figure A3. Detection selectivity with the presented gradients. (a) Peptide length distribution, (b) GRAVY score distribution, and (c) Isoelectric point distribution. Note that the last bar in panel (b) denotes a different range than all the other increments.
Molecules 27 06645 g0a3
Next, we addressed the quantitative performance of the gradients. Inefficient peak distribution causes co-elution of the components, thus resulting in uncontrolled ion suppression of the peptides. We considered the average LFQ values of all the quantified proteins as a suitable measure for this. As is seen in Figure A4, the differences are moderate among the different gradients; however, the results are in correlation with the peak distribution. The largest average LFQ values and smaller standard deviations were obtained using the 2step 4-20-40 method, while the smallest LFQ values corresponded to the 3step 4-15-35-50 method. Contrary to our expectations, the smallest repeatability was obtained using the Lin 4–27 method.
Figure A4. Average LFQ values of quantified proteins by using the presented gradient methods.
Molecules 27 06645 g0a4
Table A2. Most important parameters of the Byonic database search.
RuleValue
Maximum number of missed cleavages2
Precursor tolerance10.0 ppm
Fragment tolerancefrag:qtof_hcd 20.0 ppm
Protein FDR cutoff1%
Common modifications max1
Rare modifications max1
Fixed modifications:Carbamidomethyl (C)
Variable modifications:Deamidation (NQ); Oxidation (M); Acetylation (N-term)
Glycan database:Mammalian 182 no multiple fucose
Product versionPMI-Byonic-Com: v4.2.10
Table A3. Most important parameters of the MaxQuant database search.
ParameterValue
Version1.6.17.0
PSM FDR0.01
Protein FDR0.01
Min. peptide length7
Peptides used for protein quantificationRazor
Match between runsTRUE
Matching time window [min]2
Alignment time window [min]20
Max. peptide mass [Da]4600
Razor protein FDRTRUE
MS/MS tol. (TOF)40 ppm
Fixed modificationsCarbamidomethyl (C)
Variable modificationsDeamidation (NQ); Oxidation (M); Acetylation (N-term)

References

  1. Mitulović, G.; Mechtler, K. HPLC techniques for proteomics analysis—A short overview of latest developments. Brief. Funct. Genom. 2006, 5, 249–260. [Google Scholar] [CrossRef] [PubMed] [Green Version]
  2. Dammalli, M.; Dey, G.; Kumar, M.; Madugundu, A.K.; Gopalakrishnan, L.; Gowrishankar, B.S.; Mahadevan, A.; Shankar, S.K.; Prasad, T.S.K. Proteomics of the Human Olfactory Tract. OMICS A J. Integr. Biol. 2018, 22, 77–87. [Google Scholar] [CrossRef] [PubMed]
  3. Zhou, F.; Lu, Y.; Ficarro, S.B.; Webber, J.T.; Marto, J.A. Nanoflow Low Pressure High Peak Capacity Single Dimension LC-MS/MS Platform for High-Throughput, In-Depth Analysis of Mammalian Proteomes. Anal. Chem. 2012, 84, 5133–5139. [Google Scholar] [CrossRef] [PubMed] [Green Version]
  4. Guiochon, G. The limits of the separation power of unidimensional column liquid chromatography. J. Chromatogr. A 2006, 1126, 6–49. [Google Scholar] [CrossRef] [PubMed]
  5. Köcher, T.; Swart, R.; Mechtler, K. Ultra-High-Pressure RPLC Hyphenated to an LTQ-Orbitrap Velos Reveals a Linear Relation between Peak Capacity and Number of Identified Peptides. Anal. Chem. 2011, 83, 2699–2704. [Google Scholar] [CrossRef]
  6. Shibue, M.; Mant, C.T.; Hodges, R.S. Effect of anionic ion-pairing reagent concentration (1–60mM) on reversed-phase liquid chromatography elution behaviour of peptides. J. Chromatogr. A 2005, 1080, 58–67. [Google Scholar] [CrossRef] [Green Version]
  7. Ogata, K.; Ishihama, Y. CoolTip: Low-Temperature Solid-Phase Extraction Microcolumn for Capturing Hydrophilic Peptides and Phosphopeptides. Mol. Cell. Proteom. 2021, 20, 100170. [Google Scholar] [CrossRef]
  8. Schmelter, C.; Funke, S.; Treml, J.; Beschnitt, A.; Perumal, N.; Manicam, C.; Pfeiffer, N.; Grus, F. Comparison of Two Solid-Phase Extraction (SPE) Methods for the Identification and Quantification of Porcine Retinal Protein Markers by LC-MS/MS. Int. J. Mol. Sci. 2018, 19, 3847. [Google Scholar] [CrossRef] [Green Version]
  9. Kim, B.J.; Dallas, D.C. Systematic examination of protein extraction, proteolytic glycopeptide enrichment and MS/MS fragmentation techniques for site-specific profiling of human milk N-glycoproteins. Talanta 2021, 224, 121811. [Google Scholar] [CrossRef]
  10. Zacharias, L.G.; Hartmann, A.K.; Song, E.; Zhao, J.; Zhu, R.; Mirzaei, P.; Mechref, Y. HILIC and ERLIC Enrichment of Glycopeptides Derived from Breast and Brain Cancer Cells. J. Proteome Res. 2016, 15, 3624–3634. [Google Scholar] [CrossRef]
  11. Huang, Y.; Nie, Y.; Boyes, B.; Orlando, R. Resolving Isomeric Glycopeptide Glycoforms with Hydrophilic Interaction Chromatography (HILIC). J. Biomol. Tech. 2016, 27, 98–104. [Google Scholar] [CrossRef] [PubMed] [Green Version]
  12. Molnarova, K.; Kozlík, P. Comparison of Different HILIC Stationary Phases in the Separation of Hemopexin and Immunoglobulin G Glycopeptides and Their Isomers. Molecules 2020, 25, 4655. [Google Scholar] [CrossRef] [PubMed]
  13. Qing, G.; Yan, J.; He, X.; Li, X.; Liang, X. Recent advances in hydrophilic interaction liquid interaction chromatography materials for glycopeptide enrichment and glycan separation. Trends Anal. Chem. 2020, 124, 115570. [Google Scholar] [CrossRef]
  14. Selman, M.H.J.; Hemayatkar, M.; Deelder, A.M.; Wuhrer, M. Cotton HILIC SPE Microtips for Microscale Purification and Enrichment of Glycans and Glycopeptides. Anal. Chem. 2011, 83, 2492–2499. [Google Scholar] [CrossRef] [PubMed]
  15. Dedvisitsakul, P.; Jacobsen, S.; Svensson, B.; Bunkenborg, J.; Finnie, C.; Hägglund, P. Glycopeptide Enrichment Using a Combination of ZIC-HILIC and Cotton Wool for Exploring the Glycoproteome of Wheat Flour Albumins. J. Proteome Res. 2014, 13, 2696–2703. [Google Scholar] [CrossRef]
  16. Piovesana, S.; Montone, C.M.; Cavaliere, C.; Crescenzi, C.; La Barbera, G.; Laganà, A.; Capriotti, A.L. Sensitive untargeted identification of short hydrophilic peptides by high performance liquid chromatography on porous graphitic carbon coupled to high resolution mass spectrometry. J. Chromatogr. A 2019, 1590, 73–79. [Google Scholar] [CrossRef]
  17. Zhu, R.; Huang, Y.; Zhao, J.; Zhong, J.; Mechref, Y. Isomeric Separation of N-Glycopeptides Derived from Glycoproteins by Porous Graphitic Carbon (PGC) LC-MS/MS. Anal. Chem. 2020, 92, 9556–9565. [Google Scholar] [CrossRef]
  18. Sugár, S.; Bugyi, F.; Tóth, G.; Pápay, J.; Kovalszky, I.; Tornóczky, T.; Drahos, L.; Turiák, L. Proteomic Analysis of Lung Cancer Types—A Pilot Study. Cancers 2022, 14, 2629. [Google Scholar] [CrossRef]
  19. Tóth, E.; Ozohanics, O.; Bobály, B.; Gömöry, Á.; Jekő, A.; Drahos, L.; Vékey, K. HPLC enrichment/isolation of proteins for post-translational modification studies from complex mixtures. J. Pharm. Biomed. Anal. 2014, 98, 393–400. [Google Scholar] [CrossRef] [Green Version]
  20. Turiák, L.; Ozohanics, O.; Marino, F.; Drahos, L.; Vékey, K. Digestion protocol for small protein amounts for nano-HPLC-MS(MS) analysis. J. Proteom. 2011, 74, 942–947. [Google Scholar] [CrossRef]
  21. Turiák, L.; Ozohanics, O.; Tóth, G.; Ács, A.; Révész, Á.; Vékey, K.; Telekes, A.; Drahos, L. High sensitivity proteomics of prostate cancer tissue microarrays to discriminate between healthy and cancerous tissue. J. Proteom. 2019, 197, 82–91. [Google Scholar] [CrossRef] [PubMed]
  22. Bern, M.; Kil, Y.J.; Becker, C. Byonic: Advanced Peptide and Protein Identification Software. Curr. Protoc. Bioinform. 2012, 40, 1–14. [Google Scholar] [CrossRef] [PubMed] [Green Version]
  23. Tyanova, S.; Temu, T.; Cox, J. The MaxQuant computational platform for mass spectrometry-based shotgun proteomics. Nat. Protoc. 2016, 11, 2301–2319. [Google Scholar] [CrossRef] [PubMed]
  24. Kozlowski, L.P. IPC—Isoelectric Point Calculator. Biol. Direct 2016, 11, 55. [Google Scholar] [CrossRef] [PubMed] [Green Version]
  25. Kyte, J.; Doolittle, R.F. A simple method for displaying the hydropathic character of a protein. J. Mol. Biol. 1982, 157, 105–132. [Google Scholar] [CrossRef]
Figure 1. (a) Demonstration of differences between the C18 and reference methods. (b) Workflow for the combined C18 + graphite methods.
Molecules 27 06645 g001
Figure 2. The number of peptides (a), proteins (b), and glycopeptides and glycosylation sites (c) detected with each SPE clean up method. Samples were measured in triplicate; error bars represent standard deviation.
Molecules 27 06645 g002
Figure 3. Peptide length distributions of detected peptides for the SPE cleanup methods.
Molecules 27 06645 g003
Figure 4. (a) Protein recovery value distributions relative to the reference method; (b) Protein LFQ intensity RSD value distributions for the six SPE methods.
Molecules 27 06645 g004
Figure 5. Representative chromatograms and the peptide detection rate (dotted line) obtained with the five different gradients. The gradient slopes are overlaid in the background (without a corresponding scale). (a) Lin 4–27; (b) 2step 4-20-40; (c) 2step 4-25-40; (d) 3step 4-15-35-50; and (e) Lin 4–50.
Molecules 27 06645 g005
Table 1. Summary of the performance of the different SPE methods discussed. (+++ means best, -- means worst performance characteristics, relative to the other methods).
Purification MethodReferenceC18PierceTopTipC18 + PierceC18 + TopTipCotton
Peptide detection+++++---+++++
Protein detection+++++---+++
Glycopeptide detection-+++++++-+--
Glycosite detection++++++++++++++++++--
Quantitation +++--+++++-
Repeatability ++--++++++++
Selectivity for shorter peptides----++++++----+
Overall performance+++++-+++++--
Table 2. The steepness of the gradients between the various steps and the average slope for the whole elution window. ACN: acetonitrile.
Gradient ProgramLin 4–272step 4-20-402step 4-25-403step 4-15-35-50Lin 4–50
Step 1 (%ACN/min)0.2560.2130.2800.2250.511
Step 2 (%ACN/min)-1.331.002.00-
Step 3 (%ACN/min)---0.485-
Average slope (%ACN/min)0.2560.4000.4000.5110.511
Table 3. Summary of detection values for different species for the compared gradient programs.
GradientLin 4–272step 4-20-402step 4-25-403step 4-15-35-50Lin 4–50
Peptide detections920 ± 13971 ± 21937 ± 16890 ± 21896 ± 16
Glycopeptide detections46 ± 244 ± 149 ± 740 ± 244 ± 3
Glycosite detections15 ± 016 ± 115 ± 217 ± 317 ± 1
Peptide detections under 90 min810 ± 8869 ± 20768 ± 17877 ± 20879 ± 8
Glycopeptide detections under 90 min43 ± 238 ± 128 ± 540 ± 244 ± 3
Peptide detections under 60 min574 ± 1610 ± 18523 ± 19537 ± 13765 ± 5
Glycopeptide detections under 60 min8 ± 27 ± 23 ± 26 ± 337 ± 3
Protein detections120 ± 6126 ± 3122 ± 7124 ± 6126 ± 4
Average peptide/protein8 ± 08 ± 08 ± 07 ± 07 ± 0
Table 4. Overall evaluation of the gradient programs presented. (+++ means best, --- means worst performance characteristics, relative to the other methods).
PropertyLin 4–272step 4-20-402step 4-25-403step 4-15-35-50Lin 4–50
Peak distribution+++++++-----
Peptide detection++++++--
Protein detection+++++++++++++
Glycopeptide detection+++++++-++
Repeatability++++++++++++
Selectivity shorter peptides
Quantitation-++++---+
Overall performance++++++---
Table 5. Stationary phases and solvent systems used for finding the optimal SPE method for cleanup.
ProtocolReferenceC18PierceTopTipCotton
Stationary phase typeC18C18graphitegraphiteself-packed cotton
Activation200 µL 50% MeOH, twice200 µL 50% MeOH, twice100 µL 80% ACN 0.1% TFA, twice100 µL 80% ACN 0.1% TFA, twice50 μL 60% ACN
Equilibration I200 µL 0.5% TFA 5% ACN, twice200 µL 0.5% TFA 5% ACN, twice100 µL water, twice100 µL water, twice50 μL 1% TFA, 98% ACN
Equilibration II200 µL 0.1% TFA, twice200 µL 0.1% HFBA, twice---
Sample loading50 µL 0.1% TFA, FT applied once more50 µL 0.1% HFBA, FT applied once more50 µL water, then FT applied once more50 µL water, then FT applied once more30 μL 1% TFA, 95% ACN, then FT applied twice more
Wash100 µL 0.1% TFA, twice100 µL 0.1% HFBA, twice50 µL water, thrice50 µL water, thrice50 μL 1% TFA, 95% ACN
Elution I50 µL 70% ACN 0.1% TFA, twice50 µL 70% ACN 0.1% TFA, twice50 µL 40% ACN 0.05% TFA, thrice50 µL 40% ACN 0.05% TFA, thrice10 μL 0.1% FA at 40 °C
Elution II-50 µL 70% ACN 0.1% FA, once---
FT: flow-through, FA: formic acid, TFA: trifluoracetic acid, HFBA: heptafluorobutyric acid, ACN: acetonitrile. In the case of the C18 method, the cartridge and all the solvents except that for elution were thermostated at 4 °C.
Table 6. Gradient programs used during the optimization of the chromatographic method.
Gradient NameLin 4–272step 4-20-402step 4-25-403step 4-15-35-50Lin 4–50
timeB%timeB%timeB%timeB%timeB%
0404040404
114114114114114
1012786208625601510150
102901014010140703510290
1079010290102901015010790
10841079010790102901084
128410841084107901284
128412841084
1284
Publisher’s Note: MDPI stays neutral with regard to jurisdictional claims in published maps and institutional affiliations.

