Article

The Effects of Drying Techniques on Phytochemical Contents and Biological Activities on Selected Bamboo Leaves

by
Mohammad Amil Zulhilmi Benjamin
,
Shean Yeaw Ng
,
Fiffy Hanisdah Saikim
and
Nor Azizun Rusdi
*
Institute for Tropical Biology and Conservation, Universiti Malaysia Sabah, Jalan UMS, Kota Kinabalu 88400, Sabah, Malaysia
*
Author to whom correspondence should be addressed.
Molecules 2022, 27(19), 6458; https://doi.org/10.3390/molecules27196458
Submission received: 26 August 2022 / Revised: 20 September 2022 / Accepted: 24 September 2022 / Published: 30 September 2022
(This article belongs to the Section Food Chemistry)

Abstract

:
The therapeutic potential of bamboos has acquired global attention. Nonetheless, the biological activities of the plants are rarely considered due to limited available references in Sabah, Malaysia. Furthermore, the drying technique could significantly affect the retention and degradation of nutrients in bamboos. Consequently, the current study investigated five drying methods, namely, sun, shade, microwave, oven, and freeze-drying, of the leaves of six bamboo species, Bambusa multiplex, Bambusa tuldoides, Bambusa vulgaris, Dinochloa sublaevigata, Gigantochloa levis, and Schizostachyum brachycladum. The infused bamboo leaves extracts were analysed for their total phenolic content (TPC) and total flavonoid content (TFC). The antioxidant activities of the samples were determined via the 2,2-diphenyl-1-picrylhydrazyl (DPPH), 2,2′-azino-bis(3-ethylbenzothiazoline-6-sulfonic acid) (ABTS), and ferric reducing antioxidant power (FRAP) assays, whereas their toxicities were evaluated through the brine shrimp lethality assay (BSLA). The chemical constituents of the samples were determined using liquid chromatography–tandem mass spectrometry (LC-MS/MS). The freeze-drying method exhibited the highest phytochemical contents and antioxidant activity yield, excluding the B. vulgaris sample, in which the microwave-dried sample recorded the most antioxidant and phytochemical levels. The TPC and TFC results were within the 2.69 ± 0.01–12.59 ± 0.09 mg gallic acid equivalent (GAE)/g and 0.77 ± 0.01–2.12 ± 0.01 mg quercetin equivalent (QE)/g ranges, respectively. The DPPH and ABTS IC50 (half-maximal inhibitory concentration) were 2.92 ± 0.01–4.73 ± 0.02 and 1.89–0.01 to 3.47 ± 0.00 µg/mL, respectively, indicating high radical scavenging activities. The FRAP values differed significantly between the drying methods, within the 6.40 ± 0.12–36.65 ± 0.09 mg Trolox equivalent (TE)/g range. The phytochemical contents and antioxidant capacities exhibited a moderate correlation, revealing that the TPC and TFC were slightly responsible for the antioxidant activities. The toxicity assessment of the bamboo extracts in the current study demonstrated no toxicity against the BSLA based on the LC50 (lethal concentration 50) analysis at >1000 µg/mL. LC-MS analysis showed that alkaloid and pharmaceutical compounds influence antioxidant activities, as found in previous studies. The acquired information might aid in the development of bamboo leaves as functional food items, such as bamboo tea. They could also be investigated for their medicinal ingredients that can be used in the discovery of potential drugs.

1. Introduction

Drying is a crucial stage during post-harvest because it aids in preventing enzymatic breakdown and microbial development while retaining the beneficial characteristics of the dried plants [1]. Plant leaves are dried either naturally or via artificial methods. Conventional techniques, such as open sun- and shade-drying at ambient temperatures, are still employed in rural regions [1]. Nevertheless, due to the uncontrollable conditions of the methods, guaranteeing the safety, efficacy, and consistency of the dried products represents a challenge [2]. Currently, conventional air oven-drying is a standard technique to dry food, although it frequently alters the nutritional value, flavour, and texture of the food and might oxidise and degrade heat-sensitive polyphenols [3,4]. Alternatively, various artificial drying methods, including microwave and freeze-drying, have been utilised to rapidly dry substantial amounts of leaves with adequate quality [5]. Hence, fresh bamboo has a high moisture content and needs drying to avoid microbial damage and mould, making it ready for further processing, storage, transportation, and utilisation [6].
The nutritive and therapeutic potential of bamboo leaf extracts in the food and pharmaceutical industries have garnered attention worldwide [7]. Biologically, bamboo leaves are rich in polyphenols, flavonoids, and other secondary plant metabolites [8,9]. The plants are also widely utilised in traditional Asian medicine to treat arteriosclerosis, cardiovascular disease, hypertension, certain cancers, oedema, diarrhoea, vomiting, extreme thirst, and to improve the flavour and colour of foods [8,9]. Moreover, bamboos are natural antioxidants that possess the potential to be utilised as novel food additives in edible oils, fish, and meat products [10].
For many years, bamboo leaf tea has been considered a delicious and healthy drink in Asian countries [11]. Some edible bamboos, such as Bambusa sp., are consumed as tea and pickles due to their high nutritional and mineral values [12]. Zhucha, an ancient Uyghur treatment, is produced from bamboo leaves and green tea, which possess superior effectiveness and lipid-reducing effects [13]. Sasa quelpaertensis, a bamboo species endemic to Jeju Island, South Korea, is ingested as a medicinal tea for its anti-diabetic, diuretic, and anti-inflammatory properties [14]. In Japan, Sasa veitchii (or Kuma-zasa) is widely employed as an ornamental food trimming and in folk medicines. Furthermore, Kuma-zasa leaves have been utilised in the medical field to treat burns and urinary hesitancy [15].
Phenolics and flavonoids constituents are responsible for the functional efficacy of herbs. Drying herbal plants could inhibit bacterial growth, increase sample quality, and prevent the oxidation of their chemical contents. Consequently, the drying technique employed could considerably affect the degradation of the phytochemical and antioxidant contents of a plant. In this regard, toxicity studies should be accommodated in parallel with antioxidant activity to ensure their safe use as functional food materials. Nevertheless, the impacts of the methods on the quality of bamboo leaves have not been explored in depth. The present study investigated bamboo leaves and optimised their appropriate drying processes by evaluating the effects of five different drying methods (sun, shade, microwave, oven, and freeze-drying) on the phytochemical content and antioxidant activities of different bamboo species. Moreover, the toxicity effects were determined through a brine shrimp lethality assay (BSLA) of the six bamboo species selected. Using liquid chromatography–tandem mass spectrometry (LC-MS/MS), further investigation was performed on the chemical constituents of six different types of bamboo species.

2. Results and Discussion

2.1. The Phytochemical Contents

2.1.1. Total Phenolic Content

The total phenolic content (TPC) data of the six bamboo species assessed in the current study are presented in Table 1. Drying considerably increased the TPC (p < 0.05) of the extracts, and the increment pattern was the lowest in the sun-dried G. levis, followed by S. brachycladum, B. vulgaris, B. tuldoides, B. multiplex, and D. sublaevigata. Similar results were documented by Singhal et al. [16], who reported that sun-dried B. vulgaris shoots recorded the lowest TPC (195.05 ± 9.82) compared with the tray- (229.6 ± 54.25), oven- (227.55 ± 7.77), microwave- (224.95 ± 49.05), and freeze- (227.66 ± 87.12) dried specimens. The long drying time, which exposed the samples to the atmosphere, resulted in degradation from the oxidation of the phenolic compounds and might explain the low TPC of the sun-dried samples [17]. Enzymatic reactions might also contribute to the loss of the phenolic chemicals during conventional drying procedures [16].
The drying techniques employed in the present study were incapable of inactivating degradative enzymes, such as polyphenol oxidases, which were responsible for degrading phenolic compounds during lengthy drying periods [18]. The stability of phenolic chemicals in herbal infusions was also reported to be affected by drying temperatures [19]. The results demonstrated that the freeze-dried B. multiplex, D. sublaevigata, G. levis, and S. brachycladum recorded the highest TPC. The findings aligned with a report that recorded low-temperature drying techniques, including freeze-, vacuum-, and infrared-radiation-drying, enhanced the retention of bioactive chemicals and antioxidant activities in Dendrobium officinale bamboo shoots [20].
The influences of harvesting season and drying method on the phenolics, flavonoids, triterpenoids, and antioxidative activities of the leaves of two bamboo species, Pleioblastus kongosanensis f. aureostriatus and Shibatea chinensis, were observed [21]. The study also found that freeze-, vacuum-, and microwave-oven-drying procedures resulted in significantly different outcomes [21]. In another investigation, microwave-drying techniques produced the highest quality dried herbs faster than other methods [22]. Similarly, the B. tuldoides and B. vulgaris specimens evaluated in this study subjected to microwave-drying documented the highest TPC.

2.1.2. Total Flavonoid Content

Table 1 summarises the total flavonoid content (TFC) of the bamboo samples assessed in the current study. Drying notably (p < 0.05) enhanced the TFC of the bamboo extracts. The sun-dried B. tuldoides, B. vulgaris, G. levis, and S. brachycladum specimens recorded the lowest TFC. Although the oven-dried B. multiplex and shade-dried D. sublaevigata specimens documented the least TFC, most reports suggested that sun-drying might not be a satisfactory technique for some herbs [22]. Although the plants are placed in the shade out of direct sunlight, shade-drying also utilises solar energy as the heat source, which is similar to sun-drying. Nonetheless, the approach is disadvantageous because it requires unusually extended drying durations [23], which could promote the development of insects and moulds in high relative air humidity [24].
The freeze-dried B. multiplex, B. tuldoides, D. sublaevigata, G. levis, and S. brachycladum specimens in this study demonstrated the highest TFC, supporting the report by Soesanto [25], who noted that the freeze-dried extracts of B. vulgaris and G. apus shoots exhibited higher TFC, TPC, and DPPH than the oven-dried samples. Nonetheless, the microwave-dried B. vulgaris in this study recorded the highest TFC at 0.14 mg gallic acid equivalent (GAE)/g, slightly dissimilar from the freeze-dried extracts that exhibited the second highest TFC. Singhal et al. [16] reported that B. vulgaris shoots recorded the second highest TFC yield when microwave-dried (371.24 ± 17.24) following freeze-drying (438.29 ± 6.39), which were superior compared with tray- (284.87 ± 34.95), sun- (346.86 ± 26.15), and oven- (327.01 ± 19.19) drying.

2.2. Antioxidant Activities

2.2.1. The 2,2-diphenyl-1-picrylhydrazyl Assay

The 2,2-diphenyl-1-picrylhydrazyl (DPPH) assay is commonly employed to evaluate the antioxidant activities of samples because the method is simple and inexpensive, and requires little operating skill and a simple spectrophotometer [26]. The IC50 (half-maximal inhibitory concentration) value is widely utilised to assess the antioxidant activities of the samples and is determined from the concentration of antioxidants required to diminish the initial DPPH concentration by 50% [27]. A smaller IC50 value indicates better antioxidant attributes.
The DPPH results of this study are presented in Table 2. The sun-dried bamboo samples recorded high DPPH IC50 values (lowest free radical scavenging activity). At the same time, the freeze-dried B. multiplex, B. tuldoides, D. sublaevigata, G. levis, and S. brachycladum and microwave-dried B. vulgaris extracts exhibited superior DPPH free radical scavenging activities. One report suggested that a diminished antioxidant content was mainly attributed to oxidation processes or thermal degradation [28]. Consequently, several investigations have suggested that freeze-drying is preferable in conserving antioxidants [28,29].
Freeze-dried aqueous leaf extracts of G. levis, G. scortechinii, and S. zollingeri exhibited a higher DPPH yield than ethanolic extracts [30]. Fargesia robusta (clumping bamboo) also demonstrated the highest antioxidant capacity for DPPH when its aqueous methanolic leaf extract was freeze-dried [31]. In another study, Kozlowska et al. [32] noted that the antiradical properties of freeze-dried herbal materials (coriander, tarragon, lovage, and Indian borage) possessed considerably (p < 0.05) superior DPPH scavenging abilities than the fresh raw material. Nonetheless, the microwave-dried B. vulgaris sample in this study was subjected to higher microwave power or temperature, thus resulting in increased antioxidant activity and TPC [33,34].

2.2.2. The 2,2′-azino-bis(3-ethylbenzothiazoline-6-sulfonic acid) Assay

In addition to DPPH, 2,2′-azino-bis(3-ethylbenzothiazoline-6-sulfonic acid) (ABTS) is one of the most commonly employed assessments to evaluate the antioxidant activities of plant extracts, foods, and unique compounds [35]. The obtained IC50 value reflects the antioxidant activities of test samples because it records the concentration required to produce 50% inhibition. Accordingly, the lower the IC50 value, the higher the antioxidant activity.
Table 2 lists the ABTS values of the bamboo samples evaluated in the current study. The samples dried under the sun yielded the lowest antioxidant activity, excluding the fresh sample. The IC50 values of the B. multiplex, B. tuldoides, B. vulgaris, D. sublaevigata, and G. levis samples were the most significant, whereas the shade-dried S. brachycladum contributed the highest IC50 value. Saifullah et al. [36] reported that the antioxidant capacity measured via ABTS of the sun- and shade-dried lemon myrtle exhibited the lowest yield compared with hot-air-, vacuum-, and freeze-dried specimens.
The highest antioxidant activities or the lowest IC50 values were recorded by the oven-dried B. multiplex, B. tuldoides, B. vulgaris, D. sublaevigata, and S. brachycladum. Nevertheless, only the G. levis sample exhibited the least IC50 value when freeze-dried. Chuyen et al. [37] documented that the peels of Gac fruits which were hot-air-dried at 60 and 80 °C and vacuum-dried at 50 °C exhibited the highest ABTS antioxidant capacities. Consequently, hot-air- and vacuum-drying at 80 and 50 °C were recommended for drying Gac peel. Hot-air-, vacuum-, and freeze-drying methods were recommended to preserve the ABTS antioxidant activity of lemon myrtle because these techniques produced significant values compared with other methods [36]. Hot-air-drying at 40–60 °C was recommended for herbs [38], which explained the highest antioxidant activity in ABTS of the oven-dried samples in this study that was conducted at 50 °C.

2.2.3. The Ferric Reducing Antioxidant Power Assay

The reducing properties of the samples in this study were assessed via the ferric reducing antioxidant power (FRAP) assay. The results varied significantly (p < 0.05) between treatments applied (see Table 2). The sun-dried B. multiplex, B. tuldoides, B. vulgaris, D. sublaevigata, and G. levis samples, and shade-dried S. brachycladum samples, exhibited considerably reduced FRAP contents. The results aligned with one report which demonstrated that traditionally dried spearmints, particularly sun- and shade-dried extracts, demonstrated a notably diminished FRAP compared with freeze-dried samples [39]. Traditional drying methods, such as sun- and shade-drying, possess numerous drawbacks due to their inability to produce the high-quality standards required for medicinal plants [24].
Freeze-dried aqueous extracts of B. multiplex, D. sublaevigata, G. levis, and S. brachycladum resulted in the highest FRAP amount. Kong et al. [40] noted that the reducing power of the Clinacanthus nutans leaf extract when freeze-dried rose with increased value (mg TE/g), where the highest level was noted in the aqueous extract (10.07 ± 0.10), followed by the ethanolic (8.34 ± 0.14) and acetone (3.24 ± 0.30) samples. Nevertheless, the microwave-dried B. tuldoides and B. vulgaris specimens in the current study recorded the highest FRAP yield. Similarly, Lasano et al. [41] recommended microwaving fermented and unfermented Strobilanthes crispus tea to obtain preferable antioxidant capacities, including FRAP and DPPH. The antioxidant index proposed by the report might also be employed as a new marker in determining the optimal drying method for varying food products [41].

2.3. The Correlation between Phytochemical Contents and Antioxidant Capacities

The antioxidant attributes of a plant extract are often associated with its polyphenols content; therefore, the correlation between its phytochemical contents and the antioxidant capacity of the selected bamboo extracts in this study dried with different methods was analysed, and the outcomes are summarised in Table 3. The negative DPPH and ABTS values documented by all samples might also correspond to the IC50 value, because it is inversely proportional to the free radical scavenging activity of the samples, indicating that low IC50 samples possessed high antioxidant activity. Overall, the correlation coefficient values of the specimens demonstrated significant (p < 0.01) and moderate correlations between TPC-DPPH, TFC-DPPH, TPC-ABTS, TFC-ABTS, and TFC-FRAP.
The DPPH, ABTS, and FRAP R-values of the Pearson correlation coefficient for the TFC were −0.45, −0.39, and 0.42, respectively, revealing that flavonoids were the primary contributor to the antioxidant capacities of DPPH, ABTS, and FRAP. Similar results were observed by Ni et al. [21], with a moderate correlation between TFC and DPPH (R = 0.45) and a strong association between TFC and FRAP (R = 0.81) in Pleioblastus kongosanensis f. aureostriatus and Shibataea chinensis. Moreover, the TPC in this study documented a moderate association with antioxidant activities in DPPH and ABTS, with R-values of −0.40 and −0.42, respectively. Correspondingly, Hu et al. [42] reported a strong relationship between TPC and DPPH (R = 0.74) in Phyllostachys spp. leaves. Pande et al. [43] described similar findings for B. nutans leaf extracts under different extraction conditions.
The TPC-FRAP revealed no association with the Pearson correlation coefficient, which recorded an R-value of −0.05. The results indicated that TPC did not contribute to the high antioxidant capacity of FRAP. The findings were similar to the report by Ni et al. [21], who demonstrated a weak correlation between TPC and FRAP (R = 0.12). By comparing the correlation coefficient of the R-values, it is possible to suggest that the phenolic and flavonoid groups were slightly responsible for the antioxidant activities of DPPH, ABTS, and FRAP, as stated by Ouyang et al. [44]. In addition, the weaker correlation may be due to the fact that phenolics comprise a sizable collection of chemicals with various structures and antioxidant properties [45]. Due to the presence of non-participating elements such as sugars, flavonoids commonly form bonds with sugar moieties to create glycosides, which have a lower DPPH scavenging activity than their aglycones or phenolic acids on a weight basis [45]. Accordingly, quantifying the contributions of the phenolic and flavonoid compounds to the total antioxidant activity is necessary to understand the correlation between them and their connection to the antioxidant activity.

2.4. The BSLA

Statistical analysis of the B. multiplex (freeze-drying), B. tuldoides (freeze-drying), B. vulgaris (microwave-drying), D. sublaevigata (freeze-drying), G. levis (freeze-drying), and S. brachycladum (freeze-drying) samples recorded significant TPC, TFC, DPPH, ABTS, and FRAP values. The bamboo extracts were further studied for their toxicity tests via the BSLA. The LC50 (lethal concentration 50) values of the extracts and the positive control, potassium dichromate (K2Cr2O7), are presented in Table 4.
In the current study, the mortality rate of brine shrimp was proportional to the concentration of test samples evaluated. The B. multiplex, B. tuldoides, B. vulgaris, D. sublaevigata, G. levis, and S. brachycladum extracts exhibited no significant toxicity towards brine shrimps at LC50 values of 3744.85, 2974.47, 3166.15, 5668.14, 1236.53, and 2045.03 µg/mL, respectively. The positive control, K2Cr2O7, recorded an LC50 of 11.23 µg/mL, indicating high toxicity.
The BSLA was conducted to determine the functional properties of the selected bamboo extracts. Nevertheless, reports on the impacts of drying on the toxicity of aqueous bamboo extracts worldwide are limited. Consequently, the present study employed the BSLA as a reliable method for preliminary toxicity assessment of the extracts. Moreover, this study compared the BSLA results of the aqueous bamboo extracts with aqueous medicinal plant leaves extracts.
One investigation observed that among the evaluated shade-dried extracts of Pentapetes phoenicea, the chloroform and ethyl acetate extracts were weakly toxic with LC50 values of 659.8 and 928.9 μg/mL, respectively [46]. Conversely, the hexane and aqueous extracts were non-toxic, recording LC50 values of 1293.6 and 1929.2 μg/mL, respectively [46]. Shawa et al. [47] also reported that an aqueous Senna singuena leaves extract air-dried at room temperature did not demonstrate significant toxicity after 24 h. Furthermore, the BSLA values of all Phragmanthera capitata leaf solvent extracts (including aqueous extract) were not toxic at LC50 > 1000 μg/mL [48].
In conclusion, bamboo extracts could be considered safe for consumption as herbal medicine and could potentially be developed as herbal tea. Nonetheless, the non-toxic attributes exhibited by the plant could be discouraging in treating and managing cancer or tumour alternatives, because BSLA is commonly employed as an indicator for preliminary bioactivity screening, including for anticancer [49].

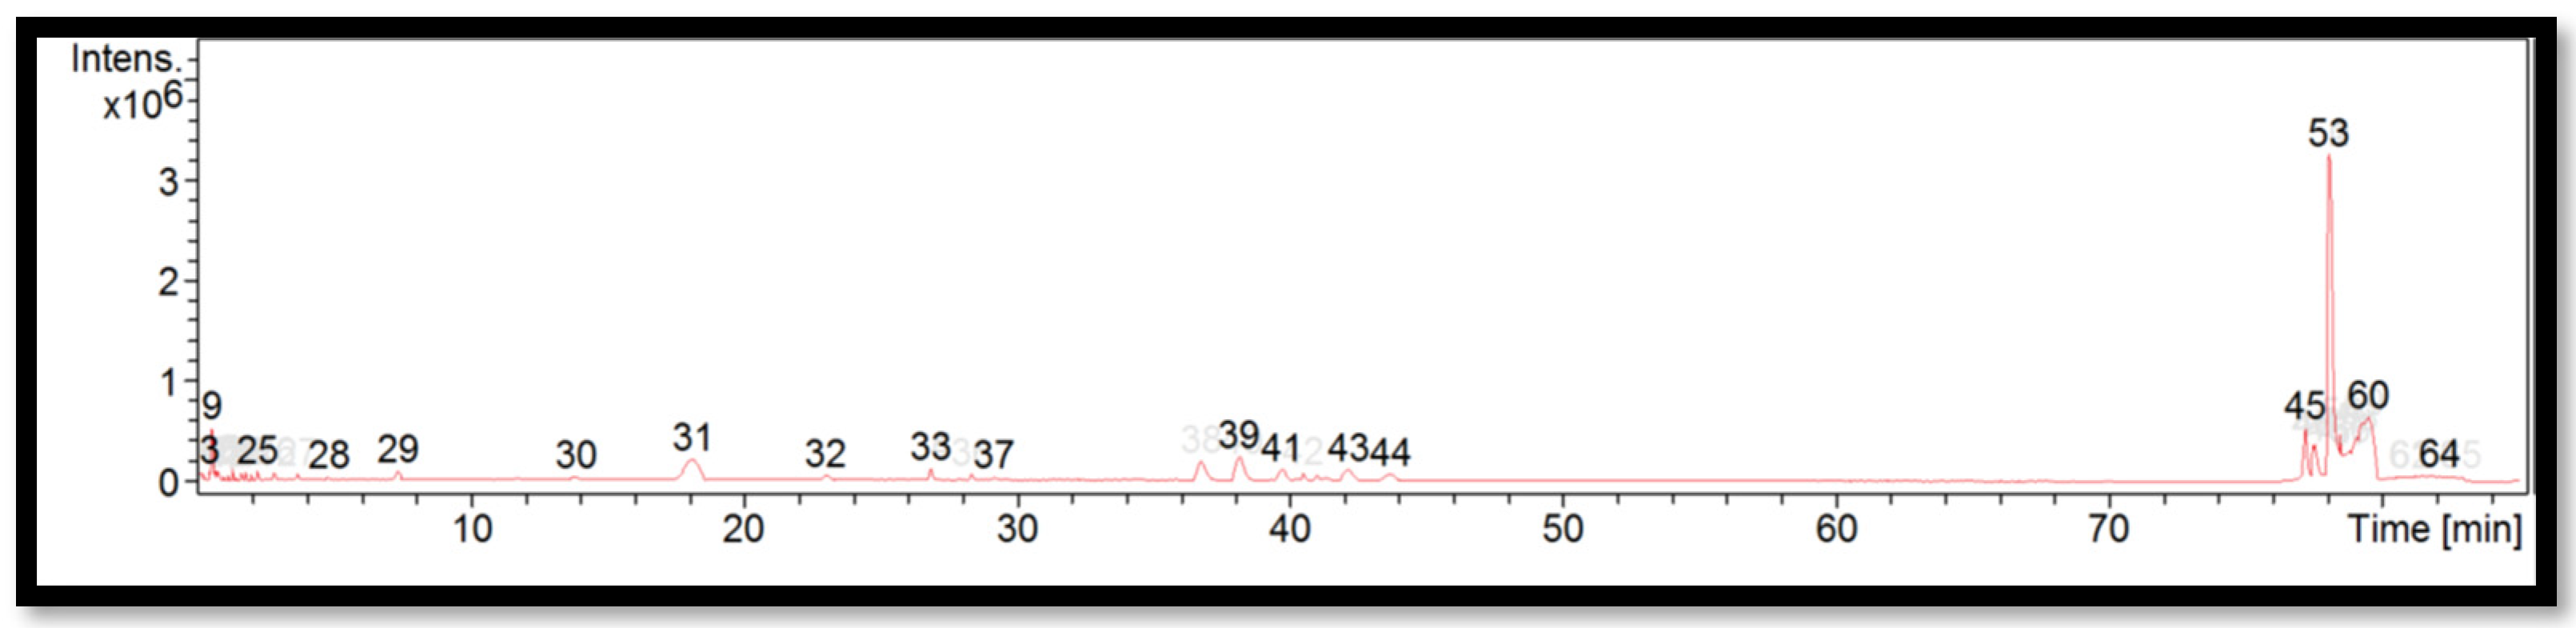
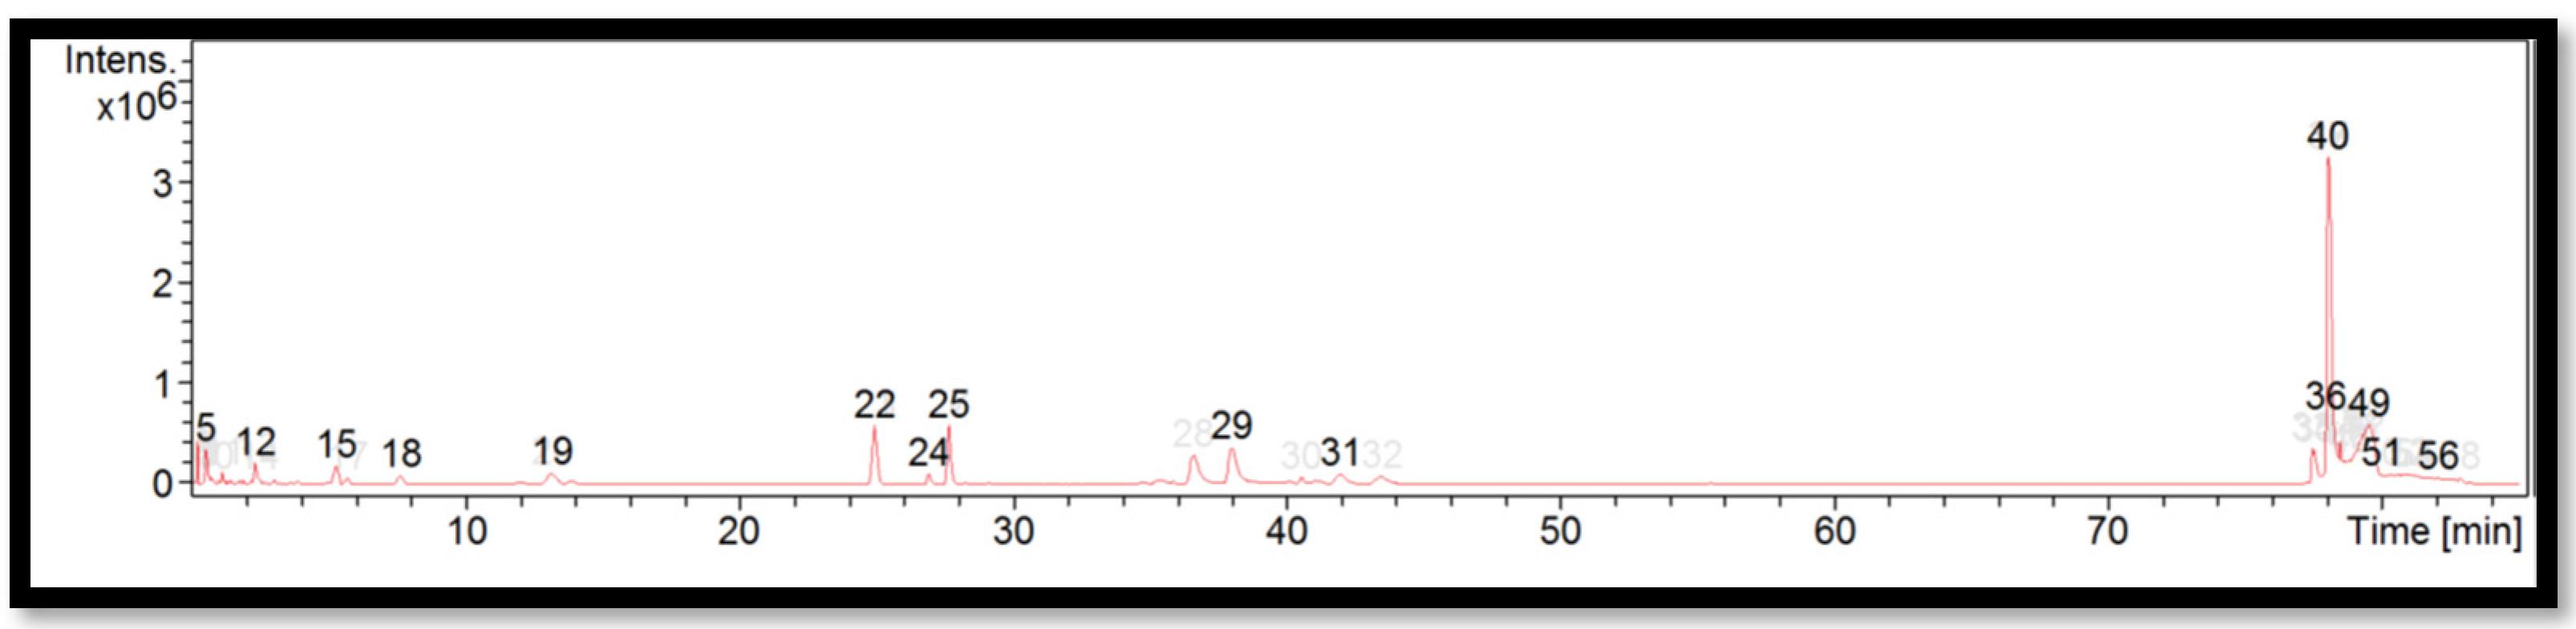
2.5. Chemical Constituents

Traditional medicine uses well-known natural products in the form of secondary metabolites derived from a wide range of natural sources. These specialised metabolites found in fungi, plants, and marine creatures function as a formidable armoury against biotic and abiotic stressors. In addition, medicinal chemists utilise natural products as structural scaffolds to synthesise new medications with enhanced pharmacological efficacy and safety [50,51,52]. Nevertheless, metabolite discovery remains a significant bottleneck in traditional medicine [53]. As a result of multiple erroneous identifications of small compounds, bioactivity investigations of traditional medicines have adopted an evidence-based approach [53]. Thus, LC-MS/MS was used to further quantify B. multiplex (freeze-drying), B. tuldoides (freeze-drying), B. vulgaris (microwave-drying), D. sublaevigata (freeze-drying), G. levis (freeze-drying), and S. brachycladum (freeze-drying) for the purpose of profiling their bioactive compounds that contribute to antioxidant properties and functional pharmaceutical applications.
The liquid chromatogram of the LC-MS/MS analysis for B. multiplex is shown in Figure 1. The compounds identified in the B. multiplex are tabulated in Table 5 along with their molecular formula, molecular weight, and m/z value. In the present study, 18 detected peaks showed significance. The highest peak was found to be felodipine (peak 53). In B. multiplex, alkaloid compounds identified as caffeine were found in peaks 28, 30, 32, and 37. Other compounds found in B. multiplex were: L-histidine (peak 9); pararosaniline (peak 39); felodipine (peak 45); and phytosphingosine (peak 60).
The liquid chromatogram of the LC-MS/MS analysis for B. tuldoides is shown in Figure 2. The compounds identified in B. tuldoides are tabulated in Table 6 along with their molecular formula, molecular weight, and m/z value. In the present study, 14 detected peaks showed significance. The highest peak was found to be felodipine (peak 35). In B. tuldoides, alkaloid compounds identified as sparteine and papaverine were found in peaks 5 and 16, respectively. Other compounds found in B. tuldoides were: PET-cGMP (peak 12); naloxone (peak 14); thiopental (peak 22); cyproheptadine (peak 24); loprazolam (peak 26); difenoconazole (peak 28); RP-8-pCPT-cGMPS (peak 31); and felodipine (peak 44).
The liquid chromatogram of the LC-MS/MS analysis for B. vulgaris is shown in Figure 3. The compounds identified in B. vulgaris are tabulated in Table 7 along with their molecular formula, molecular weight, and m/z value. In the present study, 13 detected peaks showed significance. The highest peak was found to be felodipine (peak 42). In B. vulgaris, alkaloid compounds identified as papaverine were found in peak 11. Other compounds found in B. vulgaris were: econazole (peak 3); pimozide (peak 9); cyproheptadine (peak 15); bisacodyl (peak 19); loprazolam (peak 25); difenoconazole (peak 36); felodipine (peak 51); and cinchocaine (peak 58).
The liquid chromatogram of the LC-MS/MS analysis for D. sublaevigata is shown in Figure 4. The compounds identified in D. sublaevigata are tabulated in Table 8 along with their molecular formula, molecular weight, and m/z value. In the present study, 15 detected peaks showed significance. The highest peak was found to be RP-8-pCPT-cGMPS (peak 40). In D. sublaevigata, alkaloid compounds identified as papaverine were found in peaks 22 and 24. Other compounds found in D. sublaevigata were: phenytoin (peak 5); perazine (peak 12); penconazole (peak 19); cyproheptadine (peak 29); RP-8-pCPT-cGMPS (peak 36); felodipine (peak 49); and cinchocaine (peaks 51 and 56).
The liquid chromatogram of the LC-MS/MS analysis for G. levis is shown in Figure 5. The compounds identified in G. levis are tabulated in Table 9 along with their molecular formula, molecular weight, and m/z value. In the present study, 13 detected peaks showed significance. The highest peak was found to be RP-8-pCPT-cGMPS (peak 32). In G. levis, alkaloid compounds identified as papaverine were found in peak 15. Other compounds found in G. levis were: L-histidine (peak 3); PET-cGMP (peak 10); naloxone (peak 12); cyproheptadine (peak 22); loprazolam (peak 24); RP-8-pCPT-cGMPS (peak 29); felodipine (peak 42); cinchocaine (peak 43); and amphetamine (peak 51).
The liquid chromatogram of the LC-MS/MS analysis for S. brachycladum is shown in Figure 6. The compounds identified in S. brachycladum are tabulated in Table 10 along with their molecular formula, molecular weight, and m/z value. In the present study, 13 detected peaks showed significance. The highest peak was found to be felodipine (peak 35). However, no alkaloids were found in S. brachycladum. Other compounds found in S. brachycladum were: amphetamine (peak 7); naloxone (peak 10); perazine (peak 15); cyproheptadine (peak 24); difenoconazole (peak 27); RP-8-pCPT-cGMPS (peak 32); and felodipine (peak 47).
In brief, on the basis of the notable differences, the alkaloid compounds found in B. multiplex, B. tuldoides, B. vulgaris, D. sublaevigata, and G. levis were caffeine (Figure 7), papaverine (Figure 8), and sparteine (Figure 9) according to their significant peaks. Through mass spectrometry, caffeine was found in B. multiplex, whereas papaverine was found in B. tuldoides, B. vulgaris, D. sublaevigata, and G. levis. As for sparteine, it was found only in B. tuldoides. Nevertheless, S. brachycladum showed no significant peaks attributed to alkaloid compounds.
Previous studies have shown that caffeine and papaverine could influence antioxidant activities. In recent decades, many scientific studies and reviews have documented the interest in caffeine and other coffee bean constituents for their health-promoting properties [54,55]. Many authors have claimed that caffeine is a good antioxidant [56,57,58]. Ren et al. [59] also reported that alkaloids in Pleioblastus amarus bamboo shoots were found to contain caffeine when detected through ultra-high-performance liquid chromatography (UHPLC). However, limited research has been conducted on papaverine and its links to antioxidant properties. Interestingly, based on the study by Solmaz et al. [60], in a rat model of sepsis-induced critical illness neuropathy, papaverine exhibited neuroprotective effects due to its anti-inflammatory and antioxidant characteristics. The study suggested that papaverine can contribute to antioxidant properties.
Sparteine is a heterobicyclononane alkaloid with antiarrhythmic properties, which can reduce the incidence of fibrillation and ventricular tachycardia, as well as help regulate blood pressure and heart rate [61]. Additionally, it produces a hypoglycaemic effect and promotes the pancreatic secretion of insulin and glucagon [62]. This alkaloid has also been linked to anti-inflammatory, antimicrobial, diuretic, and uterine contraction-inducing properties [63,64]. Nonetheless, prior research indicated that sparteine lacks antioxidant capabilities.
Non-alkaloids (pharmaceutical compounds) are highlighted in Table 11. Previous studies on biological activities have shown that anticonvulsant drugs contain loprazolam [65], phenytoin [66], and thiopental [67] compounds. Moreover, amphetamine [68], naloxone [69], and perazine [70] have been found in antidepressant drugs. Antifungal drugs also contain difenoconazole [71], econazole [72], and penconazole [73] compounds. Biological activities in antihistamine, antihypertensive, anti-inflammatory, and antipsychotic drugs have been associated with cyproheptadine [74], felodipine [75], L-histidine [76], and pimozide [77] compounds. Stimulant laxatives, antimicrobials, anaesthetic drugs, and dye agents contain bisacodyl [78], phytosphingosine [79], cinchocaine [80], and pararosaniline [81] compounds.
Nevertheless, no phenolic and flavonoid compounds were found in significant peaks, based on the observably low TPC and TFC values of the bamboo extracts. This factor was also observed based on a correlation analysis, as TPC and TFC showed a moderate correlation to antioxidant capacities, thus being slightly responsible for the antioxidant activities. Moreover, using the aqueous extract as a solvent could affect the polarity of compounds, which had a comparable result in alkaloid compounds based on the LC-MS/MS analysis. Yakubu and Bukoye [82] achieved a similar result, because the aqueous extract from B. vulgaris leaves was primarily composed of alkaloids, and flavonoids were the least frequent of the phytochemicals. Therefore, it was found that the aqueous bamboo extract profile is high in alkaloid compounds based on LC-MS/MS compared with TPC and TFC. Moreover, the characterisation and optimisation of chemical composition have been highlighted through positive and negative electrospray ionisation (ESI) mode using LC-MS/MS from selected bamboo extracts. According to the results, in contrast to the negative ionisation mode, the positive ionisation mode of LC-MS/MS is appropriate for screening chemical composition in selected bamboo extracts based on the number of significant peaks.

3. Materials and Methods

3.1. Chemicals and Reagents

The current study utilised acetic acid, anhydrous sodium acetate (NaOAc), anhydrous sodium carbonate (Na2CO3), hydrochloric acid (HCl), and methanol purchased from Chemiz [United Kingdom (UK)]. Anhydrous aluminium chloride (AlCl3), ferric chloride (FeCl3) heptahydrate, Folin–Ciocalteu (F-C) reagent, and gallic acid were from Merck (Germany). The study also employed 2,2′-azino-bis(3-ethylbenzothiazoline-6-sulfonic acid) (ABTS) reagent [Sigma-Aldrich, Burlington, MA, United States of America (USA)], dimethyl sulfoxide (DMSO) (Systerm, Selangor, Malaysia), potassium acetate (CH3COOK) (R&M, Dundee, UK), potassium dichromate (K2Cr2O7) (Systerm, Malaysia), potassium persulfate (K2S2O8) (HmbG, Hamburg, Germany), quercetin (Targetmol, Boston, MA, USA), Trolox (Targetmol, USA), 2,2-diphenyl-1-picrylhydrazyl (DPPH) reagent (Tokyo Chemical Industry, Tokyo, Japan), and 2,4,6-tris(2-pyridyl)-1,3,5-triazine (TPTZ) reagent (Sigma-Aldrich, USA). The chemicals and reagents were of analytical grades and purchased from Apical Scientific Sdn. Bhd. and Bio3 Scientific Sdn. Bhd., Malaysia, whereas acetonitrile and formic acid derived from Fisher Scientific (USA) were of high-performance liquid chromatography (HPLC) grade and obtained from Syarikat Jaya Usaha, Malaysia.

3.2. Plant Materials

The mature leaves of six bamboo species (Bambusa multiplex, B. tuldoides, B. vulgaris, Dinochloa sublaevigata, Gigantochloa levis, and Schizostachyum brachycladum) were harvested between 9.00 a.m. and 11.00 a.m. from the Bamboo Garden, Poring Hot Springs, Ranau, Sabah (6°2′50.795″ N, 116°42′12.731″ E) in May 2021. The samples were collected, placed in zip-lock bags, and identified by an ethnobotanist from the Institute for Tropical Biology and Conservation (ITBC), Universiti Malaysia Sabah (UMS), before being deposited in the BORNEENSIS Gallery, ITBC, UMS. Subsequently, the leaves were cleaned with running tap water and rinsed 4–5 times with distilled water before proceeding to dry treatment.

3.3. Drying Process

The samples were harvested at the same time in the morning to ensure metabolite content consistency for the drying techniques comparison. The procedure was based on the methodology suggested by Ni et al. [21] and Chen et al. [83], with some modifications. The drying processes are explained in the following subsections (Table 12). Approximately 50 g of the fresh (control variable) and dried leaves were cut into small pieces and ground into powders with an electric blender (Panasonic, Osaka, Japan). Post-drying, the moisture contents of the samples were below 10%. Subsequently, the samples were packed in different 50 mL centrifuge tubes (Biologix, Camarillo, CA, USA) and stored in a refrigerator at −20 °C (Sharp, Osaka, Japan) before further analyses.

3.4. Sample Extraction

The powdered samples were prepared through the lyophilised infusion method suggested by Neményi et al. [84] with minor modifications. First, a portion of each dried sample (1 g) was infused with 50 mL distilled water (100 °C) for 5 min at room temperature (22 °C). Subsequently, the mixtures were filtered with filter papers (Whatman, Maidstone, UK) and preserved in a 50 mL centrifuge tube (Biologix, USA). The resulting infusions were then lyophilised in a freeze-dryer (Labconco, USA) for 2.5 days to remove excess water, as Valentão et al. [85] proposed, with minor modifications. The lyophilised aqueous extract yields were stored in a refrigerator at 4 °C (Sharp, Japan). Before assessments, the extracts were adjusted to the appropriate concentration in distilled water.

3.5. Phytochemical Analysis

3.5.1. Determination of TPC

The TPC of the samples in this study was determined with the Folin–Ciocalteu method as outlined by Ainsworth and Gillespie [86], with some modifications. Aqueous gallic acid solutions (100 µg/mL) were employed as standards for the calibration curve (Figure S1). In each replicate, 100 µL of relevantly diluted standard solutions, 200 µL of 10% (v/v) F–C reagent, and 800 µL of 700 mM anhydrous Na2CO3 were mixed and vortexed. Subsequently, the mixtures were incubated for 2 h in the dark at room temperature. The absorbance of the standard was measured in a 96-well culture plate (Biologix, USA) at 765 nm against a blank (distilled water) with a microplate reader (Multiskan SkyHigh, Thermo Fisher Scientific, Waltham, MA, USA). Similarly, 100 µL of the sample extracts were reacted with F–C reagent and Na2CO3 to determine their phenolic contents. The results were expressed as the mg of gallic acid equivalent to 1 g of the dried sample (mg GAE/g).

3.5.2. Determination of TFC

In the present study, the TFCs of the bamboo samples were determined with the aluminium chloride colorimetric method as reported by Chang et al. [87], with minor alterations. Quercetin was utilised in obtaining the calibration curve (Figure S2), where 10 mg of the substance was dissolved in distilled water and diluted to 100 µg/mL. In each replicate, 120 µL of the diluted standard solution was separately mixed with 360 µL methanol (95%), 24 µL anhydrous AlCl3 [10% (w/v)], 24 µL CH3COOK (1 M), and 680 µL distilled water. After incubation at room temperature for 30 min, the reaction mixtures were added to a 96-well culture plate (Biologix, USA) before measuring the absorbance at 415 nm against the blank (distilled water) with a microplate reader (Multiskan SkyHigh, Thermo Fisher Scientific, USA). A similar procedure was followed with 120 µL of the sample extracts reacting with methanol, AlCl3, CH3COOK, and distilled water to determine their flavonoid contents. The results were expressed as mg of quercetin equivalent to 1 g of the dried sample (mg QE/g).

3.6. Antioxidant Analysis

3.6.1. Determination of DPPH

The DPPH free radical scavenging activities of the extracts were determined according to the report by Chan et al. [88], with slight alterations. First, at respective concentrations, 50 µL of the plant extracts were reacted with 195 µL DPPH–methanolic solution (0.1 mM) in a 96-well culture plate (Biologix, USA). The mixtures were then swirled gently for 1 min and allowed to stand for 1 h. Finally, the absorbance of the resulting mixture was measured with a microplate reader (Multiskan SkyHigh, Thermo Fisher Scientific, USA) at 540 nm against the blank (distilled water). Trolox was employed as the antioxidant reference standard within the 6.25–100 µg/mL concentration range (Figure S3). The findings were expressed as IC50 values (the sample concentration required to inhibit 50% of DPPH radicals) by extrapolating the regression analysis.

3.6.2. Determination of ABTS

The antioxidant capacities of the samples in this study were measured according to the ABTS free radical scavenging activity procedure adopted by Lee et al. [89], with minor modifications. First, the ABTS was prepared by reacting 5 mL of 7 mM ABTS water solution with 88 µL of 140 mM K2S2O8 at a 1:0.35 ratio. Subsequently, the mixture was allowed to stand in the dark at room temperature for 16 h. Before performing the assay, the ABTS stock solution was diluted with distilled water (at a 1:88 ratio) to obtain an absorbance at 734 nm (0.70 ± 0.02) and equilibrated to 30 °C.
The scavenging activities of the bamboo leaves in the current study were determined by mixing 100 µL of the samples with 100 µL of ABTS reagent in a 96-well culture plate (Biologix, USA) and incubating at room temperature for 6 min. After incubation, the absorbance was measured at 734 nm against the blank (distilled water) with a microplate reader (Multiskan SkyHigh, Thermo Fisher Scientific, USA). Trolox was employed as the antioxidant reference standard within the 6.25–100 µg/mL range (Figure S4). The IC50 ABTS values (the sample concentration required to inhibit 50% of the ABTS radicals) were procured by extrapolating the regression analysis results.

3.6.3. Determination of FRAP

The FRAP assay performed in the present study was based on the slightly modified procedure described by Russo et al. [90]. The FRAP reagent was prepared by mixing 38 mM anhydrous NaOAc in distilled water, pH 3.6, with 20 mM FeCl3 heptahydrate in distilled water and 10 mM TPTZ in 40 mM HCl in a 10:1:1 ratio. Approximately 20 µL of the leaf extracts and 180 µL of FRAP reagent were mixed in a 96-well culture plate (Biologix, USA) and incubated at 37 °C in a water bath (Daihan Scientific, Wonju, South Korea) for 40 min in the dark. As blanks, 20 µL distilled water was added to the 180 µL FRAP reagent. The absorbances of the resultant mixtures were measured at 593 nm against the blank (distilled water) with a microplate reader (Multiskan SkyHigh, Thermo Fisher Scientific, USA). Trolox was utilised as the antioxidant reference standard within the 0–100 µg/mL concentration range (Figure S5). The values were communicated as mg of Trolox equivalent to 1 g of dried sample (mg TE/g).

3.7. Determination of BSLA

The BSLA was determined according to the guidelines reported by Rajeh et al. [91], with some modifications. The toxicity of the compounds was assessed at 1000, 100, 10, and 1 µg/mL in 10 mL seawater solutions with 1% DMSO (v/v). In the current study, the brine shrimp cysts were hatched in a small aquarium containing natural seawater (pH 8.0) for approximately 48 h under aeration with continuous illumination at 25 °C. The nauplii were lured to one side of the vessel with a light source to isolate them. Subsequently, active nauplii were collected for examination with a plastic pipette after hatching. After 48 h of development, 10 nauplii were transplanted to each plate, and the number of survivors was counted after 24 h.
After the addition of the samples, the plates were incubated at 25 °C for 24 h. The specimens were then dissolved in DMSO at a maximum concentration of 2% to prevent potential toxicity from the solvent [92,93]. K2Cr2O7 served as the positive control. After 24 h, the plates were examined under a binocular microscope (12.5× magnification) to determine the number of survivors, thus obtaining the mortality percentage. Subsequently, the nauplii were killed with methanol, and the number of dead (immobile nauplii) in each well was recorded. The chronic LC50, or the lethal concentration resulting in 50% death after 24 h of exposure, was measured with the probit method to measure the toxicity of the extracts. The LC50 data were then determined from the regression line produced by extrapolating the concentration with the percentage of fatalities on a probit scale. Finally, each outcome was tabulated and analysed.

3.8. LC-MS/MS Analysis

3.8.1. Sample Preparation

The bamboo extracts were dissolved with ultra-purified water (total oxidisable carbon ≤5 ppb and resistivity of 18.2 MΩ-cm) in a 50 mL centrifuge tube (Biologix, USA). The extracts were then sonicated for 15 min (20–22 °C), filtered using syringe filters (polytetrafluoroethylene filter, pore size of 0.04 µm, Merck, Darmstadt, Germany), and transferred into HPLC vials (ChromineX, Selangor, Malaysia) for further analysis.

3.8.2. LC-ESI-QTOF-MS/MS Parameters

The protocol developed by Gu et al. [94] was adopted for the chemical profiling of bamboo extracts, with slight modifications. Chemical compounds in the extracts were detected by LC-QTOF-MS/MS (liquid chromatography–quadrupole time-of-flight tandem mass spectrometry) (Bruker impact II, Bruker Daltonics, Bremen, Germany). The positive ionisation mode was applied to obtain high-resolution spectra of compounds. On the Thermo UltiMate 3000 HPLC system (Thermo Fisher Scientific, USA), the C18 column (3 × 150 mm, 3 µm particle size, Acclaim Polar Advantage II, Thermo Fisher Scientific, USA) was used for the LC separation. ESI was performed with the following settings: capillary voltage of 4500 V; drying gas of 10.0 L/min at 250 °C; endplate offset of −500 V; mass range of 50–1500 m/z; and nebulizer pressure of 2.0 bar. High-resolution MS was carried out using the Bruker impact II QTOF instrument (Bruker Daltonics, Germany). The TOF system was programmed using the following settings: corrector fill of 71.4 V; reflector of 2600.0 V; flight tube of 9900.0 V; corrector extract of 400.0 V; and detector of 2226.6 V.
Mobile phase A consisted of water/formic acid (99:1, v/v), whereas mobile phase B was composed of acetonitrile/formic acid (99:1, v/v). Formic acid was used because of its compatibility with MS analysis. Both the A and B mobile phases were degassed at 21 °C for 15 min. The injection volume for each sample was 6 µL, and the flow rate was adjusted to 0.8 mL/min. Using a mixture of both the A and B mobile phases, gradient elution was carried out as follows: 0–20 min, 10% B; 20–30 min, 25% B; 30–40 min, 35% B; 40–70 min, 40% B; 70–75 min, 55% B; 75–77 min, 80% B; 77–79 min, 100% B; 79–82 min, 100% B; and 82–85 min, 10% B. At the conclusion of the programme, the eluent content was restored to the baseline gradient and the column was equilibrated for 3 min prior to the subsequent injection.

3.8.3. Data Processing

The MS raw data were obtained using Bruker Compass DataAnalysis version 4.2 (Bruker Daltonics, Germany). By applying the advanced libraries (ESI MSn Lib, Pharmaceuticals, and Plant Metabolites databases) in the system, the chemical compounds were generated by detecting and comparing the mass spectra of the samples with molecular weights based on the library databases adjusted for positive ionisation with detailed mass spectra confirmation (Figures S6–S11). The significant peaks were then tabulated and examined.

3.9. Statistical Analysis

Each procedure in the current study was conducted in triplicates and the data were expressed as mean ± standard deviation (SD). Statistical comparisons were performed with one-way analysis of variance (ANOVA), followed by Duncan’s post hoc test, with the level of statistical significance set at p < 0.05. Correlation analysis was performed via the Pearson correlation coefficient (r). The Statistical Package for Social Sciences (SPSS) for Windows (Version 19.0, IBM Corporation, New York, NY, USA) was employed in the statistical analyses.

4. Conclusions

The results of the different drying techniques documented significant differences (p < 0.05), indicating that microwave-, oven-, and freeze-drying retained superior TPC, TFC, DPPH, ABTS, and FRAP to the conventional methods of sun- and shade-drying. Furthermore, the correlation between the TFC and TPC phytochemical contents and the DPPH, ABTS, and FRAP antioxidant capacities exhibited a moderate association, suggesting that the TPC and TFC had a minor contribution to the antioxidant activity. Freeze-drying was recorded significantly better in all bamboo species, excluding B. vulgaris, which favoured microwave-drying. Although an expensive and energy-intensive technology, freeze-drying produced better-quality products in terms of preserving the antioxidant potential. Moreover, the LC50 results at >1000 µg/mL obtained in the BSLA demonstrated no toxicity, indicating that the bamboo extracts were safe to be consumed. The LC-MS results show that alkaloid and pharmaceutical compounds have been found in the extracts, based on the significant peaks in the chromatograms. Thus, in line with past studies, these compounds may stimulate antioxidant properties. This discovery may assist in further research into developing bamboo leaves as functional food items, such as bamboo tea. The investigation of bamboo extracts for medicinal components may also contribute to the search for potential drugs.

Supplementary Materials

The following supporting information can be downloaded at: https://www.mdpi.com/article/10.3390/molecules27196458/s1, Figure S1: The standard curve of gallic acid for TPC; Figure S2: The standard curve of quercetin for TFC; Figure S3: The standard curve of Trolox for DPPH; Figure S4: The standard curve of Trolox for ABTS; Figure S5: The standard curve of Trolox for FRAP; Figure S6: The mass spectrum of Bambusa multiplex (A) and caffeine (B); Figure S7: The mass spectrum of Bambusa tuldoides (A) and sparteine (B); Figure S8: The mass spectrum of Bambusa tuldoides (A) and papaverine (B); Figure S9: The mass spectrum of Bambusa vulgaris (A) and papaverine (B); Figure S10: The mass spectrum of Dinochloa sublaevigata (A) and papaverine (B); Figure S11: The mass spectrum of Gigantochloa levis (A) and papaverine (B).

Author Contributions

Conceptualization, M.A.Z.B. and N.A.R.; methodology, M.A.Z.B. and N.A.R.; software, M.A.Z.B.; validation, M.A.Z.B.; formal analysis, M.A.Z.B.; investigation, S.Y.N.; resources, N.A.R.; data curation, M.A.Z.B.; writing—original draft preparation, M.A.Z.B. and F.H.S.; writing—review and editing, M.A.Z.B. and N.A.R.; visualization, M.A.Z.B.; supervision, S.Y.N., F.H.S. and N.A.R.; project administration, N.A.R.; funding acquisition, N.A.R. All authors have read and agreed to the published version of the manuscript.

Funding

This research was funded by Universiti Malaysia Sabah from Postgraduate Research Grant (UMSGreat) [GUG0507-2/2020] and the APC was funded by Research Management Centre, Universiti Malaysia Sabah.

Institutional Review Board Statement

Not applicable.

Informed Consent Statement

Not applicable.

Data Availability Statement

Not applicable.

Acknowledgments

The authors sincerely thank Sabah Parks and Sabah Biodiversity Centre for providing the access license [JKM/MBS.1000-2/2 JLD.12 (89)]. The authors also appreciate the helpful suggestions and critical comments provided by anonymous reviewers.

Conflicts of Interest

The authors declare no conflict of interest.

Sample Availability

Samples of the compounds are available from the authors.

References

  1. Babu, A.K.; Kumaresan, G.; Raj, V.A.A.; Velraj, R. Review of leaf drying: Mechanism and influencing parameters, drying methods, nutrient preservation, and mathematical models. Renew. Sustain. Energy Rev. 2018, 90, 536–556. [Google Scholar] [CrossRef]
  2. Yuan, J.; Hao, L.-J.; Wu, G.; Wang, S.; Duan, J.; Xie, G.-Y.; Qin, M.-J. Effects of drying methods on the phytochemicals contents and antioxidant properties of Chrysanthemum flower heads harvested at two developmental stages. J. Funct. Foods 2015, 19, 786–795. [Google Scholar] [CrossRef]
  3. Nistor, O.V.; Seremet Ceclu, L.; Andronoiu, D.G.; Rudi, L.; Botez, E. Influence of different drying methods on the physicochemical properties of red beetroot (Beta vulgaris L. var. Cylindra). Food Chem. 2017, 236, 59–67. [Google Scholar] [CrossRef]
  4. Kaur, K.; Singh, A.K. Drying kinetics and quality characteristics of beetroot slices under hot air followed by microwave finish drying. Afr. J. Agric. Res. 2014, 9, 1036–1044. [Google Scholar] [CrossRef]
  5. Mokhtarikhah, G.; Ebadi, M.T.; Ayyari, M. Qualitative changes of spearmint essential oil as affected by drying methods. Ind. Crops Prod. 2020, 153, 112492. [Google Scholar] [CrossRef]
  6. Lv, H.-F.; Ma, X.-X.; Zhang, B.; Chen, X.-F.; Liu, X.-M.; Fang, C.-H.; Fei, B.-H. Microwave-vacuum drying of round bamboo: A study of the physical properties. Constr. Build. Mater. 2019, 211, 44–51. [Google Scholar] [CrossRef]
  7. Nirmala, C.; Bisht, M.S.; Bajwa, H.K.; Santosh, O. Bamboo: A rich source of natural antioxidants and its applications in the food and pharmaceutical industry. Trends Food Sci. Technol. 2018, 77, 91–99. [Google Scholar] [CrossRef]
  8. Wróblewska, K.B.; de Oliveira, D.C.S.; Grombone-Guaratini, M.T.; Moreno, P.R.H. Medicinal properties of bamboos. In Pharmacognosy—Medicinal Plants; Perveen, S., Al-Taweel, A., Eds.; IntechOpen: London, UK, 2019; pp. 159–176. [Google Scholar]
  9. Liu, M.H.; Ko, C.H.; Ma, N.; Tan, P.W.; Fu, W.M.; He, J.Y. Chemical profiles, antioxidant and anti-obesity effects of extract of Bambusa textilis McClure leaves. J. Funct. Foods 2016, 22, 533–546. [Google Scholar] [CrossRef]
  10. Lu, B.; Wu, X.; Shi, J.; Dong, Y.; Zhang, Y. Toxicology and safety of antioxidant of bamboo leaves. Part 2: Developmental toxicity test in rats with antioxidant of bamboo leaves. Food Chem. Toxicol. 2006, 44, 1739–1743. [Google Scholar] [CrossRef]
  11. Horn, T.; Häser, A. Bamboo tea: Reduction of taxonomic complexity and application of DNA diagnostics based on rbcL and matK sequence data. PeerJ 2016, 4, e2781. [Google Scholar] [CrossRef] [Green Version]
  12. Bhandari, S.; Tyagi, K.; Singh, B.; Goutam, U. Role of molecular markers to study genetic diversity in bamboo: A review. Plant Cell Biotechnol. Mol. Biol. 2021, 22, 86–97. [Google Scholar]
  13. Yang, C.; Yi, L.; Dan, L.; Qian, Y.; Ming, J. Bamboo leaf flavones and tea polyphenols show a lipid-lowering effect in a rat model of hyperlipidemia. Drug Res. 2015, 65, 668–671. [Google Scholar] [CrossRef] [PubMed]
  14. Kim, J.; Kim, Y.-S.; Lee, H.A.; Lim, J.Y.; Kim, M.; Kwon, O.; Ko, H.-C.; Kim, S.-J.; Shin, J.-H.; Kim, Y. Sasa quelpaertensis leaf extract improves high fat diet-induced lipid abnormalities and regulation of lipid metabolism genes in rats. J. Med. Food 2014, 17, 571–581. [Google Scholar] [CrossRef] [PubMed]
  15. Sasaki, Y.; Komatsu, K.; Takido, M.; Takeshita, K.; Kashiwagi, H.; Nagumo, S. Genetic profiling of Sasa species by analysis of chloroplast intron between rbcL and ORF106 and partial ORF106 regions. Biol. Pharm. Bull. 2007, 30, 1511–1515. [Google Scholar] [CrossRef]
  16. Singhal, P.; Satya, S.; Naik, S.N. Effect of different drying techniques on the nutritional, antioxidant and cyanogenic profile of bamboo shoots. Appl. Food Res. 2022, 2, 100036. [Google Scholar] [CrossRef]
  17. Janjai, S.; Bala, B.K. Solar drying technology. Food Eng. Rev. 2012, 4, 16–54. [Google Scholar] [CrossRef]
  18. Lim, Y.Y.; Murtijaya, J. Antioxidant properties of Phyllanthus amarus extracts as affected by different drying methods. LWT-Food Sci. Technol. 2007, 40, 1664–1669. [Google Scholar] [CrossRef]
  19. Riehle, P.; Vollmer, M.; Rohn, S. Phenolic compounds in Cistus incanus herbal infusions—Antioxidant capacity and thermal stability during the brewing process. Food Res. Int. 2013, 53, 891–899. [Google Scholar] [CrossRef]
  20. Meng, Q.; Fan, H.; Li, Y.; Zhang, L. Effect of drying methods on physico-chemical properties and antioxidant activity of Dendrobium officinale. J. Food Meas. Charact. 2018, 12, 1–10. [Google Scholar] [CrossRef]
  21. Ni, Q.; Zhang, Y.; Xu, G.; Gao, Q.; Gong, L.; Zhang, Y. Influence of harvest season and drying method on the antioxidant activity and active compounds of two bamboo grass leaves. J. Food Process. Preserv. 2014, 38, 1565–1576. [Google Scholar] [CrossRef]
  22. Thamkaew, G.; Sjöholm, I.; Galindo, F.G. A review of drying methods for improving the quality of dried herbs. Crit. Rev. Food Sci. Nutr. 2021, 61, 1763–1786. [Google Scholar] [CrossRef] [PubMed]
  23. Pirbalouti, A.G.; Mahdad, E.; Craker, L. Effects of drying methods on qualitative and quantitative properties of essential oil of two basil landraces. Food Chem. 2013, 141, 2440–2449. [Google Scholar] [CrossRef] [PubMed]
  24. Rocha, R.P.; Melo, E.C.; Radünz, L.L. Influence of drying process on the quality of medicinal plants: A review. J. Med. Plant Res. 2011, 5, 7076–7084. [Google Scholar] [CrossRef]
  25. Soesanto, E. Antioxidant activity of extracts from Bambusa vulgaris and Gigantochloa apus Kurz bamboo shoots. Pak. J. Nutr. 2016, 15, 580–584. [Google Scholar] [CrossRef]
  26. Arnao, M.B. Some methodological problems in the determination of antioxidant activity using chromogen radicals: A practical case. Trends Food Sci. Technol. 2000, 11, 419–421. [Google Scholar] [CrossRef]
  27. Sánchez-Moreno, C.; Larrauri, J.A.; Saura-Calixto, F. A procedure to measure the antiradical efficiency of polyphenols. J. Sci. Food Agric. 1998, 76, 270–276. [Google Scholar] [CrossRef]
  28. Kamiloglu, S.; Toydemir, G.; Boyacioglu, D.; Beekwilder, J.; Hall, R.D.; Capanoglu, E. A review on the effect of drying on antioxidant potential of fruits and vegetables. Crit. Rev. Food Sci. Nutr. 2016, 56, S110–S129. [Google Scholar] [CrossRef]
  29. Leong, S.Y.; Oey, I. Effects of processing on anthocyanins, carotenoids and vitamin C in summer fruits and vegetables. Food Chem. 2012, 133, 1577–1587. [Google Scholar] [CrossRef]
  30. Mohd Ilham, A.; Vimala, S.; Abdull Rashih, A.; Rohana, S.; Jamaluddin, M.; Juliza, M. Antioxidant and antityrosinase properties of Malaysian bamboo leaf extracts. J. Trop. For. Sci. 2008, 20, 123–131. [Google Scholar]
  31. Van Hoyweghen, L.; De Beer, T.; Deforce, D.; Heyerick, A. Phenolic compounds and anti-oxidant capacity of twelve morphologically heterogeneous bamboo species. Phytochem. Anal. 2012, 23, 433–443. [Google Scholar] [CrossRef]
  32. Kozlowska, M.; Scibisz, I.; Przybyl, J.L.; Ziarno, M.; Zbikowska, A.; Majewska, E. Phenolic contents and antioxidant activity of extracts of selected fresh and dried herbal materials. Pol. J. Food Nutr. Sci. 2021, 71, 269–278. [Google Scholar] [CrossRef]
  33. Hihat, S.; Remini, H.; Madani, K. Effect of oven and microwave drying on phenolic compounds and antioxidant capacity of coriander leaves. Int. Food Res. J. 2017, 24, 503–509. [Google Scholar]
  34. Mudau, F.N.; Ngezimana, W. Effect of different drying methods on chemical composition and antimicrobial activity of bush tea (Athrixia phylicoides). Int. J. Agric. Biol. 2014, 16, 1011–1014. [Google Scholar]
  35. Naeimi, A.F.; Alizadeh, M. Antioxidant properties of the flavonoid fisetin: An updated review of in vivo and in vitro studies. Trends Food Sci. Technol. 2017, 70, 34–44. [Google Scholar] [CrossRef]
  36. Saifullah, M.; McCullum, R.; McCluskey, A.; Vuong, Q. Effects of different drying methods on extractable phenolic compounds and antioxidant properties from lemon myrtle dried leaves. Heliyon 2019, 5, e03044. [Google Scholar] [CrossRef] [PubMed]
  37. Chuyen, H.V.; Roach, P.D.; Golding, J.B.; Parks, S.E.; Nguyen, M.H. Effects of four different drying methods on the carotenoid composition and antioxidant capacity of dried Gac peel. J. Sci. Food Agric. 2016, 97, 1656–1662. [Google Scholar] [CrossRef]
  38. Shaw, M.; Meda, V.; Tabil, L.; Opoku, A. Drying and color characteristics of coriander foliage using convective thin-layer and microwave drying. J. Microw. Power Electromagn. Energy 2007, 41, 59–68. [Google Scholar] [CrossRef]
  39. Orphanides, A.; Goulas, V.; Gekas, V. Effect of drying method on the phenolic content and antioxidant capacity of spearmint. Czech J. Food Sci. 2013, 31, 509–513. [Google Scholar] [CrossRef]
  40. Kong, H.S.; Musa, K.H.; Abdullah Sani, N. Clinacanthus nutans (Belalai Gajah/Sabah Snake Grass): Antioxidant optimization on leaves and stems. AIP Conf. Proc. 2016, 1784, 030030. [Google Scholar] [CrossRef]
  41. Lasano, N.F.; Rahmat, A.; Ramli, N.S.; Abu Bakar, M.F. Effect of oven and microwave drying on polyphenols content and antioxidant capacity of herbal tea from Strobilanthes crispus leaves. Asian J. Pharm. Clin. Res. 2018, 11, 363–368. [Google Scholar] [CrossRef]
  42. Hu, C.; Xu, D.; Chen, H.; Yuan, K. Contents of the total flavonoids and the total phenols and antioxidant activities in the leaf from different species of Phyllostachys. Adv. Mater. Res. 2012, 343–344, 1103–1108. [Google Scholar] [CrossRef]
  43. Pande, H.; Kumar, B.; Varshney, V.K. HPLC-ESI-QTOF-MS analysis of phenolic compounds, antioxidant capacity and α-glucosidase inhibitory effect of Bambusa nutans leaves. Indian J. Chem. 2018, 57B, 988–996. [Google Scholar]
  44. Ouyang, W.; Lei, F.; Yang, Y.; Liu, L.; Li, Q.; Guo, A. Analysis of nutritional components of four bamboo leaves and antioxidant activity of flavonoid extracts in vitro. Nat. Prod. Res. Dev. 2019, 31, 1669–1674. [Google Scholar]
  45. Lu, Y.; Foo, L.Y. Antioxidant activities of polyphenols from sage (Salvia officinalis). Food Chem. 2001, 75, 197–202. [Google Scholar] [CrossRef]
  46. Sharma, N.; Gupta, P.C.; Singh, A.; Rao, C.V. Brine shrimp bioassay of Pentapetes phoenicea Linn. and Ipomoea carnea Jacq. leaves. Der Pharm. Lett. 2013, 5, 162–167. [Google Scholar]
  47. Shawa, I.T.; Mponda, J.; Msefula, C.; Manda, H.; Gondwe, M.; Maliwichi-Nyirenda, C. Brine shrimp lethality and phytochemical determination of aqueous extracts of Senna singueana, Musa paradisiaca, and Ziziphus mucronata in Malawi. J. Basic Appl. Res. 2015, 1, 82–88. [Google Scholar]
  48. Ohikhena, F.U.; Wintola, O.A.; Afolayan, A.J. Toxicity assessment of different solvent extracts of the medicinal plant, Phragmanthera capitata (Sprengel) Balle on brine shrimp (Artemia salina). Int. J. Pharmacol. 2016, 12, 701–710. [Google Scholar] [CrossRef]
  49. Artanti, N.; Firmansyah, T.; Darmawan, A. Bioactivities evaluation of Indonesian mistletoes (Dendrophthoe pentandra (L.) Miq.) leaves extracts. J. Appl. Pharm. Sci. 2012, 2, 24–27. [Google Scholar]
  50. Yuan, H.; Ma, Q.; Ye, L.; Piao, G. The traditional medicine and modern medicine from natural products. Molecules 2016, 21, 559. [Google Scholar] [CrossRef] [Green Version]
  51. David, B.; Wolfender, J.-L.; Dias, D.A. The pharmaceutical industry and natural products: Historical status and new trends. Phytochem. Rev. 2015, 14, 299–315. [Google Scholar] [CrossRef]
  52. Cragg, G.M.; Newman, D.J. Natural products: A continuing source of novel drug leads. Biochim. Biophys. Acta 2013, 1830, 3670–3695. [Google Scholar] [CrossRef] [PubMed]
  53. Patwardhan, B. Traditional medicine-inspired evidence-based approaches to drug discovery. In Evidence-Based Validation of Herbal Medicine; Mukherjee, P.K., Ed.; Elsevier: Amsterdam, The Netherlands, 2015; pp. 259–272. [Google Scholar]
  54. Martini, D.; Del Bo’, C.; Tassotti, M.; Riso, P.; Del Rio, D.; Brighenti, F.; Porrini, M. Coffee consumption and oxidative stress: A review of human intervention studies. Molecules 2016, 21, 979. [Google Scholar] [CrossRef]
  55. George, S.E.; Ramalakshmi, K.; Rao, L.J.M. A perception on health benefits of coffee. Crit. Rev. Food Sci. Nutr. 2008, 48, 464–486. [Google Scholar] [CrossRef] [PubMed]
  56. Zhao, E.H.; Ergul, B.; Zhao, W. Caffeine’s antioxidant potency optically sensed with double-stranded DNA-encased single-walled carbon nanotubes. J. Phys. Chem. B 2015, 119, 4068–4075. [Google Scholar] [CrossRef] [PubMed]
  57. Rathod, M.A.; Patel, D.; Das, A.; Tipparaju, S.R.; Shinde, S.S.; Anderson, R.F. Inhibition of radical-induced DNA strand breaks by water-soluble constituents of coffee: Phenolics and caffeine metabolites. Free Radic. Res. 2013, 47, 480–487. [Google Scholar] [CrossRef]
  58. León-Carmona, J.R.; Galano, A. Free radical scavenging activity of caffeine’s metabolites. Int. J. Quantum Chem. 2012, 112, 3472–3478. [Google Scholar] [CrossRef]
  59. Ren, Y.; Ma, Y.; Zhang, Z.; Qiu, L.; Zhai, H.; Gu, R.; Xie, Y. Total alkaloids from bamboo shoots and bamboo shoot shells of Pleioblastus amarus (Keng) Keng f. and their anti-inflammatory activities. Molecules 2019, 24, 2699. [Google Scholar] [CrossRef]
  60. Solmaz, V.; Kaya, M.; Uslu, F.B.; Atasoy, O.; Erbaş, O. Papaverine has therapeutic potential for sepsis-induced neuropathy in rats, possibly via the modulation of HMGB1-RAGE axis and its antioxidant prosperities. J. Investig. Surg. 2022, 35, 7–13. [Google Scholar] [CrossRef]
  61. Gremigni, P.; Hamblin, J.; Harris, D. Genotype x Environment Interactions and Lupin Alkaloids. In Proceedings of the 9th International Lupin Conference, Klink/Muritz, Germany, 20–24 June 2000. [Google Scholar]
  62. Sgambato, S.; Paolisso, G.; Passariello, N.; Varricchio, M.; D’Onofrio, F. Effect of sparteine sulphate upon basal and nutrient-induced insulin and glucagon secretion in normal man. Eur. J. Clin. Pharmacol. 1987, 32, 477–480. [Google Scholar] [CrossRef]
  63. Schmeller, T.; Wink, M. Utilization of alkaloids in modern medicine. In Alkaloids: Biochemistry, Ecology, and Medicinal Applications; Roberts, M.F., Wink, M., Eds.; Springer: Boston, MA, USA, 1998; pp. 435–459. [Google Scholar]
  64. de la Vega, R.; Gutierrez, M.P.; Sanz, C.; Calvo, R.; Robredo, L.M.; de la Cuadra, C.; Muzquiz, M. Bactericide-like effect of lupinus alkaloids. Ind. Crops Prod. 1996, 5, 141–148. [Google Scholar] [CrossRef]
  65. McDonough, J.H., Jr.; McMonagle, J.; Copeland, T.; Zoeffel, D.; Shih, T.-M. Comparative evaluation of benzodiazepines for control of soman-induced seizures. Arch. Toxicol. 1999, 73, 473–478. [Google Scholar] [CrossRef] [PubMed]
  66. Mishory, A.; Yaroslavsky, Y.; Bersudsky, Y.; Belmaker, R.H. Phenytoin as an antimanic anticonvulsant: A controlled study. Am. J. Psychiatry 2000, 157, 463–465. [Google Scholar] [CrossRef] [PubMed]
  67. Papatheodoropoulos, C.; Sotiriou, E.; Kotzadimitriou, D.; Drimala, P. At clinically relevant concentrations the anaesthetic/amnesic thiopental but not the anticonvulsant phenobarbital interferes with hippocampal sharp wave-ripple complexes. BMC Neurosci. 2007, 8, 60. [Google Scholar] [CrossRef] [PubMed]
  68. Stahl, S.M. Antidepressant treatment of psychotic major depression: Potential role of the σ receptor. CNS Spectr. 2005, 10, 319–323. [Google Scholar] [CrossRef]
  69. Sikka, P.; Kaushik, S.; Kumar, G.; Kapoor, S.; Bindra, V.K.; Saxena, K.K. Study of antinociceptive activity of SSRI (fluoxetine and escitalopram) and atypical antidepressants (venlafaxine and mirtazepine) and their interaction with morphine and naloxone in mice. J. Pharm. Bioallied Sci. 2011, 3, 412–416. [Google Scholar] [CrossRef]
  70. Wójcikowski, J.; Daniel, W.A. Distribution interactions between perazine and antidepressant drugs. In vivo studies. Pol. J. Pharmacol. 2000, 52, 449–457. [Google Scholar]
  71. Godeau, C.; Morin-Crini, N.; Staelens, J.-N.; Martel, B.; Rocchi, S.; Chanet, G.; Fourmentin, M.; Crini, G. Adsorption of a triazole antifungal agent, difenoconazole, on soils from a cereal farm: Protective effect of hemp felt. Environ. Technol. Innov. 2021, 22, 101394. [Google Scholar] [CrossRef]
  72. Firooz, A.; Nafisi, S.; Maibach, H.I. Novel drug delivery strategies for improving econazole antifungal action. Int. J. Pharm. 2015, 495, 599–607. [Google Scholar] [CrossRef]
  73. Husak, V.V.; Mosiichuk, N.M.; Storey, J.M.; Storey, K.B.; Lushchak, V.I. Acute exposure to the penconazole-containing fungicide Topas partially augments antioxidant potential in goldfish tissues. Comp. Biochem. Physiol. Part C 2017, 193, 1–8. [Google Scholar] [CrossRef]
  74. De Bruyne, P.; Christiaens, T.; Boussery, K.; Mehuys, E.; Van Winckel, M. Are antihistamines effective in children? A review of the evidence. Arch. Dis. Child. 2017, 102, 56–60. [Google Scholar] [CrossRef]
  75. Shah, U.; Joshi, G.; Sawant, K. Improvement in antihypertensive and antianginal effects of felodipine by enhanced absorption from PLGA nanoparticles optimized by factorial design. Mater. Sci. Eng. C 2014, 35, 153–163. [Google Scholar] [CrossRef] [PubMed]
  76. Peterson, J.W.; Boldogh, I.; Popov, V.L.; Saini, S.S.; Chopra, A.K. Anti-inflammatory and antisecretory potential of histidine in Salmonella-challenged mouse small intestine. Lab. Investig. 1998, 78, 523–534. [Google Scholar] [PubMed]
  77. Elmaci, I.; Altinoz, M.A. Targeting the cellular schizophrenia. Likely employment of the antipsychotic agent pimozide in treatment of refractory cancers and glioblastoma. Crit. Rev. Oncol. Hematol. 2018, 128, 96–109. [Google Scholar] [CrossRef] [PubMed]
  78. Noergaard, M.; Andersen, J.T.; Jimenez-Solem, E.; Christensen, M.B. Long term treatment with stimulant laxatives—Clinical evidence for effectiveness and safety? Scand. J. Gastroenterol. 2019, 54, 27–34. [Google Scholar] [CrossRef]
  79. Başpınar, Y.; Kotmakçı, M.; Öztürk, I. Antimicrobial activity of phytosphingosine nanoemulsions against bacteria and yeasts. Celal Bayar Univ. J. Sci. 2018, 14, 223–228. [Google Scholar] [CrossRef]
  80. Ghoniem, M.G.; Mohamed, M.A.; Eldin, G.M.G.; Errachid, A. Sensitive electrochemical strategy via the construction of functionalized carbon nanotubes/ionic liquid nanocomposite for the determination of anaesthetic drug cinchocaine. Measurement 2021, 185, 110071. [Google Scholar] [CrossRef]
  81. de Jong, J.P.; Voerman, J.S.A.; Leenen, P.J.M.; van der Sluijs-Gelling, A.J.; Ploemacher, R.E. Improved fixation of frozen lympho-haemopoietic tissue sections with hexazotized pararosaniline. Histochem. J. 1991, 23, 392–401. [Google Scholar] [CrossRef]
  82. Yakubu, M.T.; Bukoye, B.B. Abortifacient potentials of the aqueous extract of Bambusa vulgaris leaves in pregnant Dutch rabbits. Contraception 2009, 80, 308–313. [Google Scholar] [CrossRef]
  83. Chen, G.; Li, C.; Wang, S.; Mei, X.; Zhang, H.; Kan, J. Characterization of physicochemical properties and antioxidant activity of polysaccharides from shoot residues of bamboo (Chimonobambusa quadrangularis): Effect of drying procedures. Food Chem. 2019, 292, 281–293. [Google Scholar] [CrossRef]
  84. Neményi, A.; Stefanovitsné-Bányai, É.; Burján, S.S.; Pék, Z.; Hegedus, A.; Gyuricza, C.; Helyes, L. Seasonal variations in total antioxidant capacity and total phenolics content of leaves of Phyllostachys taxa using different extraction methods. Not. Bot. Horti Agrobot. Cluj-Napoca 2014, 42, 43–50. [Google Scholar] [CrossRef] [Green Version]
  85. Valentão, P.; Fernandes, E.; Carvalho, F.; Andrade, P.B.; Seabra, R.M.; Bastos, M.L. Hydroxyl radical and hypochlorous acid scavenging activity of small centaury (Centaurium erythraea) infusion. A comparative study with green tea (Camellia sinensis). Phytomedicine 2003, 10, 517–522. [Google Scholar] [CrossRef] [PubMed]
  86. Ainsworth, E.A.; Gillespie, K.M. Estimation of total phenolic content and other oxidation substrates in plant tissues using Folin-Ciocalteu reagent. Nat. Protoc. 2007, 2, 875–877. [Google Scholar] [CrossRef] [PubMed]
  87. Chang, C.-C.; Yang, M.-H.; Wen, H.-M.; Chern, J.-C. Estimation of total flavonoid content in propolis by two complementary colorimetric methods. J. Food Drug Anal. 2002, 10, 178–182. [Google Scholar] [CrossRef]
  88. Chan, K.W.; Khong, N.M.H.; Iqbal, S.; Umar, I.M.; Ismail, M. Antioxidant property enhancement of sweet potato flour under simulated gastrointestinal pH. Int. J. Mol. Sci. 2012, 13, 8987–8997. [Google Scholar] [CrossRef]
  89. Lee, K.J.; Oh, Y.C.; Cho, W.K.; Ma, J.Y. Antioxidant and anti-inflammatory activity determination of one hundred kinds of pure chemical compounds using offline and online screening HPLC assay. Evid. -Based Complement. Altern. Med. 2015, 2015, 165457. [Google Scholar] [CrossRef]
  90. Russo, D.; Kenny, O.; Smyth, T.J.; Milella, L.; Hossain, M.B.; Diop, M.S.; Rai, D.K.; Brunton, N.P. Profiling of phytochemicals in tissues from Sclerocarya birrea by HPLC-MS and their link with antioxidant activity. ISRN Chromatogr. 2013, 2013, 283462. [Google Scholar] [CrossRef]
  91. Rajeh, M.A.B.; Zuraini, Z.; Sasidharan, S.; Latha, L.Y.; Amutha, S. Assessment of Euphorbia hirta L. leaf, flower, stem and root extracts for their antibacterial and antifungal activity and brine shrimp lethality. Molecules 2010, 15, 6008–6018. [Google Scholar] [CrossRef]
  92. Geethaa, S.; Thavamany, P.J.; Chiew, S.P.; Thong, O.M. Interference from ordinarily used solvents in the outcomes of Artemia salina lethality test. J. Adv. Pharm. Technol. Res. 2013, 4, 179–182. [Google Scholar] [CrossRef]
  93. Baravalia, Y.; Vaghasiya, Y.; Chanda, S. Brine shrimp cytotoxicity, anti-inflammatory and analgesic properties of Woodfordia fruticosa Kurz flowers. Iran. J. Pharm. Res. 2012, 11, 851–861. [Google Scholar]
  94. Gu, C.; Howell, K.; Dunshea, F.R.; Suleria, H.A.R. LC-ESI-QTOF/MS characterisation of phenolic acids and flavonoids in polyphenol-rich fruits and vegetables and their potential antioxidant activities. Antioxidants 2019, 8, 405. [Google Scholar] [CrossRef] [Green Version]
Figure 1. LC-MS/MS chromatogram of B. multiplex.
Molecules 27 06458 g001
Figure 2. LC-MS/MS chromatogram of B. tuldoides.
Molecules 27 06458 g002
Figure 3. LC-MS/MS chromatogram of B. vulgaris.
Molecules 27 06458 g003
Figure 4. LC-MS/MS chromatogram of D. sublaevigata.
Molecules 27 06458 g004
Figure 5. LC-MS/MS chromatogram of G. levis.
Molecules 27 06458 g005
Figure 6. LC-MS/MS chromatogram of S. brachycladum.
Molecules 27 06458 g006
Figure 7. Chemical structures of caffeine.
Molecules 27 06458 g007
Figure 8. Chemical structures of papaverine.
Molecules 27 06458 g008
Figure 9. Chemical structures of sparteine.
Molecules 27 06458 g009
Table 1. The TPC and TFC of the selected bamboo extracts dried with different methods.
Drying MethodsTPC 1TFC 2
B. multiplex
Fresh 35.64 ± 0.09 b0.87 ± 0.01 f
Sun-drying5.09 ± 0.01 d1.13 ± 0.00 c
Shade-drying5.42 ± 0.02 c1.26 ± 0.00 b
Microwave-drying5.44 ± 0.05 c1.04 ± 0.01 d
Oven-drying5.18 ± 0.00 d0.89 ± 0.00 e
Freeze-drying5.74 ± 0.06 a1.62 ± 0.01 a
B. tuldoides
Fresh 35.26 ± 0.01 d1.65 ± 0.01 d
Sun-drying4.31 ± 0.03 f1.17 ± 0.00 f
Shade-drying4.92 ± 0.01 e1.41 ± 0.00 e
Microwave-drying5.91 ± 0.00 a2.06 ± 0.00 b
Oven-drying5.60 ± 0.04 c1.69 ± 0.02 c
Freeze-drying5.84 ± 0.01 b2.11 ± 0.00 a
B. vulgaris
Fresh 34.64 ± 0.05 e0.84 ± 0.00 d
Sun-drying4.24 ± 0.00 f0.81 ± 0.00 e
Shade-drying5.45 ± 0.00 d0.85 ± 0.00 d
Microwave-drying6.17 ± 0.04 a1.10 ± 0.01 a
Oven-drying5.77 ± 0.03 b0.94 ± 0.01 c
Freeze-drying5.58 ± 0.01 c0.96 ± 0.00 b
D. sublaevigata
Fresh 38.26 ± 0.05 b0.78 ± 0.00 b,c
Sun-drying7.38 ± 0.00 d0.78 ± 0.00 b
Shade-drying8.27 ± 0.09 b0.77 ± 0.00 c
Microwave-drying8.20 ± 0.02 b0.83 ± 0.00 a
Oven-drying7.91 ± 0.01 c0.84 ± 0.00 a
Freeze-drying12.59 ± 0.09 a0.84 ± 0.00 a
G. levis
Fresh 33.92 ± 0.00 d0.81 ± 0.01 c
Sun-drying2.69 ± 0.01 f0.77 ± 0.01 d
Shade-drying3.68 ± 0.02 e0.84 ± 0.00 b
Microwave-drying4.60 ± 0.03 b0.82 ± 0.01 c
Oven-drying4.29 ± 0.00 c0.84 ± 0.00 b
Freeze-drying4.78 ± 0.01 a0.87 ± 0.01 a
S. brachycladum
Fresh 34.34 ± 0.09 d1.85 ± 0.01 b
Sun-drying4.23 ± 0.01 e0.98 ± 0.00 f
Shade-drying4.34 ± 0.04 d1.31 ± 0.01 e
Microwave-drying5.01 ± 0.03 c1.70 ± 0.00 d
Oven-drying5.30 ± 0.09 b1.74 ± 0.00 c
Freeze-drying5.61 ± 0.01 a2.12 ± 0.01 a
The values represent the means ± standard deviations of three replicates. Different letters (within a column) indicate significant differences (one-way ANOVA, Duncan’s multiple comparison test, p < 0.05). 1 TPC was expressed as mg gallic acid equivalent to 1 g of dried sample (mg GAE/g). 2 TFC was expressed as the mg quercetin equivalent to 1 g of dried sample (mg QE/g). 3 Fresh sample was expressed as control variable.
Table 2. The DPPH, ABTS, and FRAP assay results of the selected bamboo extracts dried with different methods.
Drying MethodsDPPH 1ABTS 2FRAP 3
B. multiplex
Fresh 43.73 ± 0.00 e2.93 ± 0.01 e31.33 ± 0.05 d
Sun-drying4.09 ± 0.00 f2.77 ± 0.01 d22.39 ± 0.11 f
Shade-drying3.42 ± 0.00 b2.59 ± 0.01 b29.73 ± 0.07 e
Microwave-drying3.67 ± 0.01 d2.72 ± 0.01 c33.83 ± 0.10 b
Oven-drying3.49 ± 0.00 c2.50 ± 0.01 a32.06 ± 0.07 c
Freeze-drying3.20 ± 0.00 a2.73 ± 0.00 c36.65 ± 0.09 a
B. tuldoides
Fresh 43.54 ± 0.02 d3.07 ± 0.01 f27.68 ± 0.12 d
Sun-drying4.01 ± 0.00 f2.70 ± 0.00 e19.40 ± 0.11 f
Shade-drying3.82 ± 0.01 e2.60 ± 0.01 d25.87 ± 0.10 e
Microwave-drying3.37 ± 0.01 c2.29 ± 0.01 c35.98 ± 0.06 a
Oven-drying3.00 ± 0.02 b1.89 ± 0.01 a33.83 ± 0.01 c
Freeze-drying2.92 ± 0.01 a1.98 ± 0.00 b35.83 ± 0.05 b
B. vulgaris
Fresh 43.59 ± 0.01 c2.74 ± 0.00 d28.36 ± 0.14 d
Sun-drying4.14 ± 0.00 f2.94 ± 0.00 f15.86 ± 0.10 f
Shade-drying3.72 ± 0.00 e2.80 ± 0.01 e25.16 ± 0.13 e
Microwave-drying3.11 ± 0.00 a2.32 ± 0.00 c35.32 ± 0.15 a
Oven-drying3.37 ± 0.00 b2.01 ± 0.00 a33.47 ± 0.10 c
Freeze-drying3.63 ± 0.00 d2.13 ± 0.01 b34.74 ± 0.14 b
D. sublaevigata
Fresh 43.78 ± 0.00 d2.57 ± 0.00 c14.06 ± 0.10 e
Sun-drying4.33 ± 0.00 f2.76 ± 0.00 d6.40 ± 0.12 f
Shade-drying4.12 ± 0.00 e2.58 ± 0.01 c15.50 ± 0.01 d
Microwave-drying3.36 ± 0.00 c2.38 ± 0.01 b19.50 ± 0.12 c
Oven-drying3.16 ± 0.00 b2.22 ± 0.00 a24.60 ± 0.06 b
Freeze-drying3.05 ± 0.00 a2.38 ± 0.01 b31.23 ± 0.11 a
G. levis
Fresh 44.42 ± 0.01 f3.09 ± 0.00 d29.35 ± 0.14 c
Sun-drying4.36 ± 0.00 e3.47 ± 0.00 f18.26 ± 0.17 e
Shade-drying4.11 ± 0.01 d3.22 ± 0.01 e22.80 ± 0.09 d
Microwave-drying4.05 ± 0.00 c3.05 ± 0.01 c34.22 ± 0.11 b
Oven-drying3.37 ± 0.00 b2.47 ± 0.00 b34.85 ± 0.09 a
Freeze-drying3.23 ± 0.00 a2.44 ± 0.00 a35.02 ± 0.07 a
S. brachycladum
Fresh 43.49 ± 0.01 c2.41 ± 0.00 c27.40 ± 0.07 d
Sun-drying4.73 ± 0.02 f3.10 ± 0.01 e13.33 ± 0.03 e
Shade-drying4.45 ± 0.01 e3.33 ± 0.01 f13.18 ± 0.02 f
Microwave-drying3.71 ± 0.01 d2.36 ± 0.00 b30.22 ± 0.08 b
Oven-drying3.28 ± 0.01 b2.12 ± 0.01 a28.03 ± 0.06 c
Freeze-drying3.23 ± 0.00 a2.51 ± 0.00 d35.81 ± 0.09 a
Trolox 54.09 ± 0.004.55 ± 0.02
The values represent the means ± standard deviations of three replicates. Different letters (within a column) indicate significant differences (one-way ANOVA, Duncan’s multiple comparison test, p < 0.05). 1 DPPH is expressed as IC50 (µg/mL). 2 ABTS is expressed as IC50 (µg/mL). 3 FRAP is expressed as mg Trolox equivalent to 1 g of dried sample (mg TE/g). 4 Fresh sample is expressed as a control variable. 5 Trolox is expressed as a positive control.
Table 3. The Pearson correlation between the phytochemical contents and antioxidant capacities of the dried bamboo extracts.
PhytochemicalAntioxidant Capacity
DPPHABTSFRAP
Rp-ValueRp-ValueRp-Value
TPC−0.40 **0.00−0.42 **0.00−0.050.64
TFC−0.45 **0.00−0.39 **0.000.42 **0.00
** Correlation is significant at the 0.01 level (2-tailed).
Table 4. The mortality percentage and lethality concentration of shrimp nauplii after treatment with the bamboo extracts.
SamplesConcentration (µg/mL)% MortalityLC50 (µg/mL)
K2Cr2O7 1100010011.23
10033
1033
127
B. multiplex1000173744.85
10010
107
10
B. tuldoides1000202974.47
10010
107
10
B. vulgaris1000173166.15
10013
107
10
D. sublaevigata1000135668.14
10010
107
10
G. levis1000271236.53
10020
1010
10
S. brachycladum1000202045.03
10017
1010
10
1 K2Cr2O7 was expressed as a positive control.
Table 5. The compounds identified in B. multiplex.
PeakRT (min)Identified CompoundsMolecular FormulaMolecular Weightm/z
30.5Unidentified199.9663200.9736
90.6L-HistidineC6H9N3O2155.0354156.0427
252.2Unidentified445.2898446.2971
284.8CaffeineC8H10N4O2577.3688578.3760
297.4Unidentified452.3372453.3445
3013.9CaffeineC8H10N4O2550.1329551.1402
3118.2Unidentified534.1379535.1452
3223.0CaffeineC8H10N4O2534.1378535.1451
3326.9Unidentified700.4868701.4941
3729.2CaffeineC8H10N4O2428.1840429.1913
3938.2PararosanilineC19H17N3287.2837288.2909
4139.7Unidentified315.2784316.2857
4342.2Unidentified315.3145316.3218
4443.7Unidentified315.3144316.3217
4577.2FelodipineC18H19Cl2NO4337.3346338.3419
5378.0FelodipineC18H19Cl2NO4337.3365338.3438
6079.5PhytosphingosineC18H39NO3337.3346338.3419
6482.1Unidentified343.2721344.2794
Table 6. The compounds identified in B. tuldoides.
PeakRT (min)Identified CompoundsMolecular FormulaMolecular Weightm/z
50.6SparteineC15H26N2234.1583235.1656
122.5PET-cGMPC18H15N5O7PNa113.0840114.0913
145.7NaloxoneC19H21NO4327.2521328.2594
157.6Unidentified452.3361453.3434
1625.0PapaverineC20H21NO4678.5037340.2591
2227.7ThiopentalC11H18N2O2S791.5873396.8009
2438.0CyproheptadineC21H21N287.2827288.2900
2642.0LoprazolamC23H21ClN6O3315.3139316.3211
2877.5DifenoconazoleC19H17Cl2N3O3309.3035310.3108
3178.0RP-8-pCPT-cGMPSC16H14ClN5O6PS2Na311.3193312.3265
3578.0FelodipineC18H19Cl2NO4337.3367338.3439
4479.5FelodipineC18H19Cl2NO4337.3348338.3421
4981.2Unidentified337.3347338.3419
5282.8Unidentified225.9441226.9514
Table 7. The compounds identified in B. vulgaris.
PeakRT (min)Identified CompoundsMolecular FormulaMolecular Weightm/z
30.5EconazoleC18H15Cl3N2O155.0349156.0422
70.7Unidentified200.0322201.0394
93.1PimozideC28H29F2N3O489.3156490.3229
107.6Unidentified452.3377453.3449
1126.9PapaverineC20H21NO4678.5046340.2596
1537.9CyproheptadineC21H21N287.2832288.2905
1939.6BisacodylC22H19NO4361.1714362.1787
2541.9LoprazolamC23H21ClN6O3315.3143316.3216
3677.5DifenoconazoleC19H17Cl2N3O3337.3351338.3423
4278.0FelodipineC18H19Cl2NO4320.3085321.3158
5179.5FelodipineC18H19Cl2NO4337.3352338.3425
5279.8Unidentified343.2730344.2802
5881.4CinchocaineC20H29N3O2337.3349338.3422
Table 8. The compounds identified in D. sublaevigata.
PeakRT (min)Identified CompoundsMolecular FormulaMolecular Weightm/z
50.5PhenytoinC15H12N2O2155.0349156.0421
122.4PerazineC20H25N3S339.2523340.2596
155.3Unidentified474.3177475.3250
187.7Unidentified452.3365453.3438
1913.2PenconazoleC13H15Cl2N3565.4204566.4276
2225.0PapaverineC20H21NO4678.5038679.5111
2427.0PapaverineC20H21NO4678.5026340.2586
2527.7Unidentified813.5703814.5776
2938.0CyproheptadineC21H21N287.2825288.2897
3142.0Unidentified315.3136316.3209
3678.0RP-8-pCPT-cGMPSC16H14ClN5O6PS2Na311.3185312.3258
4078.0RP-8-pCPT-cGMPSC16H14ClN5O6PS2Na320.3077321.3149
4979.5FelodipineC18H19Cl2NO4337.3339338.3412
5180.0CinchocaineC20H29N3O2343.2714344.2787
5682.1CinchocaineC20H29N3O2343.2717344.2789
Table 9. The compounds identified in G. levis.
PeakRT (min)Identified CompoundsMolecular FormulaMolecular Weightm/z
30.5L-HistidineC6H9N3O2155.0347156.0420
102.5PET-cGMPC18H15N5O7PNa113.0840114.0913
125.7NaloxoneC19H21NO4327.2530328.2602
137.6Unidentified452.3369453.3442
1525.0PapaverineC20H21NO4678.5056340.2601
1827.7Unidentified813.5731814.5803
2238.0CyproheptadineC21H21N287.2833288.2906
2442.0LoprazolamC23H21ClN6O3315.3148316.3221
2978.0RP-8-pCPT-cGMPSC16H14ClN5O6PS2Na311.3195312.3268
3278.0RP-8-pCPT-cGMPSC16H14ClN5O6PS2Na674.6705675.6778
4279.5FelodipineC18H19Cl2NO4337.3351338.3424
4380.0CinchocaineC20H29N3O2343.2728344.2801
5182.8AmphetamineC9H13N225.9441226.9513
Table 10. The compounds identified in S. brachycladum.
PeakRT (min)Identified CompoundsMolecular FormulaMolecular Weightm/z
30.5Unidentified155.0348156.0421
72.5AmphetamineC9H13N113.0840114.0913
105.7NaloxoneC19H21NO4327.2523328.2596
117.6Unidentified452.3367453.3440
1525.0PerazineC20H25N3S678.5043340.2594
1827.7Unidentified829.5351415.7748
2437.4CyproheptadineC21H21N287.2828288.2901
2541.3Unidentified315.3141316.3214
2777.5DifenoconazoleC19H17Cl2N3O3309.3037310.3110
3278.0RP-8-pCPT-cGMPSC16H14ClN5O6PS2Na311.3194312.3267
3578.0FelodipineC18H19Cl2NO4337.3365338.3437
4779.5FelodipineC18H19Cl2NO4337.3351338.3423
5281.4Unidentified343.2726344.2799
Table 11. Non-alkaloid compounds with their properties.
Chemical CompoundsPropertiesReferences
LoprazolamAnticonvulsant drugsMcDonough Jr et al. [65]
PhenytoinAnticonvulsant drugsMishory et al. [66]
ThiopentalAnticonvulsant drugsPapatheodoropoulos et al. [67]
AmphetamineAntidepressant drugsStahl [68]
NaloxoneAntidepressant drugsSikka et al. [69]
PerazineAntidepressant drugsWójcikowski and Daniel [70]
DifenoconazoleAntifungal drugsGodeau et al. [71]
EconazoleAntifungal drugsFirooz et al. [72]
PenconazoleAntifungal drugsHusak et al. [73]
CyproheptadineAntihistamine drugsDe Bruyne et al. [74]
FelodipineAntihypertensive drugsShah et al. [75]
L-HistidineAnti-inflammatory drugsPeterson et al. [76]
PimozideAntipsychotic drugsElmaci and Altinoz [77]
BisacodylStimulant laxative drugsNoergaard et al. [78]
PhytosphingosineAntimicrobial drugsBaşpınar et al. [79]
CinchocaineAnaesthetic drugsGhoniem et al. [80]
PararosanilineDye agentsde Jong et al. [81]
Table 12. Summary of the drying methods applied to the sample leaves.
Drying MethodsDrying Process
Sun-dryingSamples were exposed to sunlight for 1 week
Shade-dryingSamples were dried in room temperature at 22–25 °C and humidity levels between 30% and 50% for 1 week
Microwave-dryingSamples were put in a microwave dryer (Samsung, Seoul, Korea) at atmospheric pressure and 160 W power (three times, 2 min each time)
Oven-dryingSamples were put in an oven (Protech, Selangor, Malaysia) at 50 °C for 24 h
Freeze-dryingSamples were frozen at −80 °C for 48 h, and then put in a freeze-dryer (Labconco, Kansas City, MO, USA) for 24 h
Publisher’s Note: MDPI stays neutral with regard to jurisdictional claims in published maps and institutional affiliations.

