

Elicitor-Induced VOC Emission by Grapevine Leaves: Characterisation in the Vineyard

 , ,
, ,  , ,
, ,
Abstract
1. Introduction
2. Results
Polyphenol Analysis
3. VOC Emission Analysis
3.1. Determination of the Optimal Sampling Method
3.2. Bastid®-Induced VOCs
3.3. MeJA- and Copper Sulphate-Induced VOCs
3.4. Vineyard Blends Characterisation
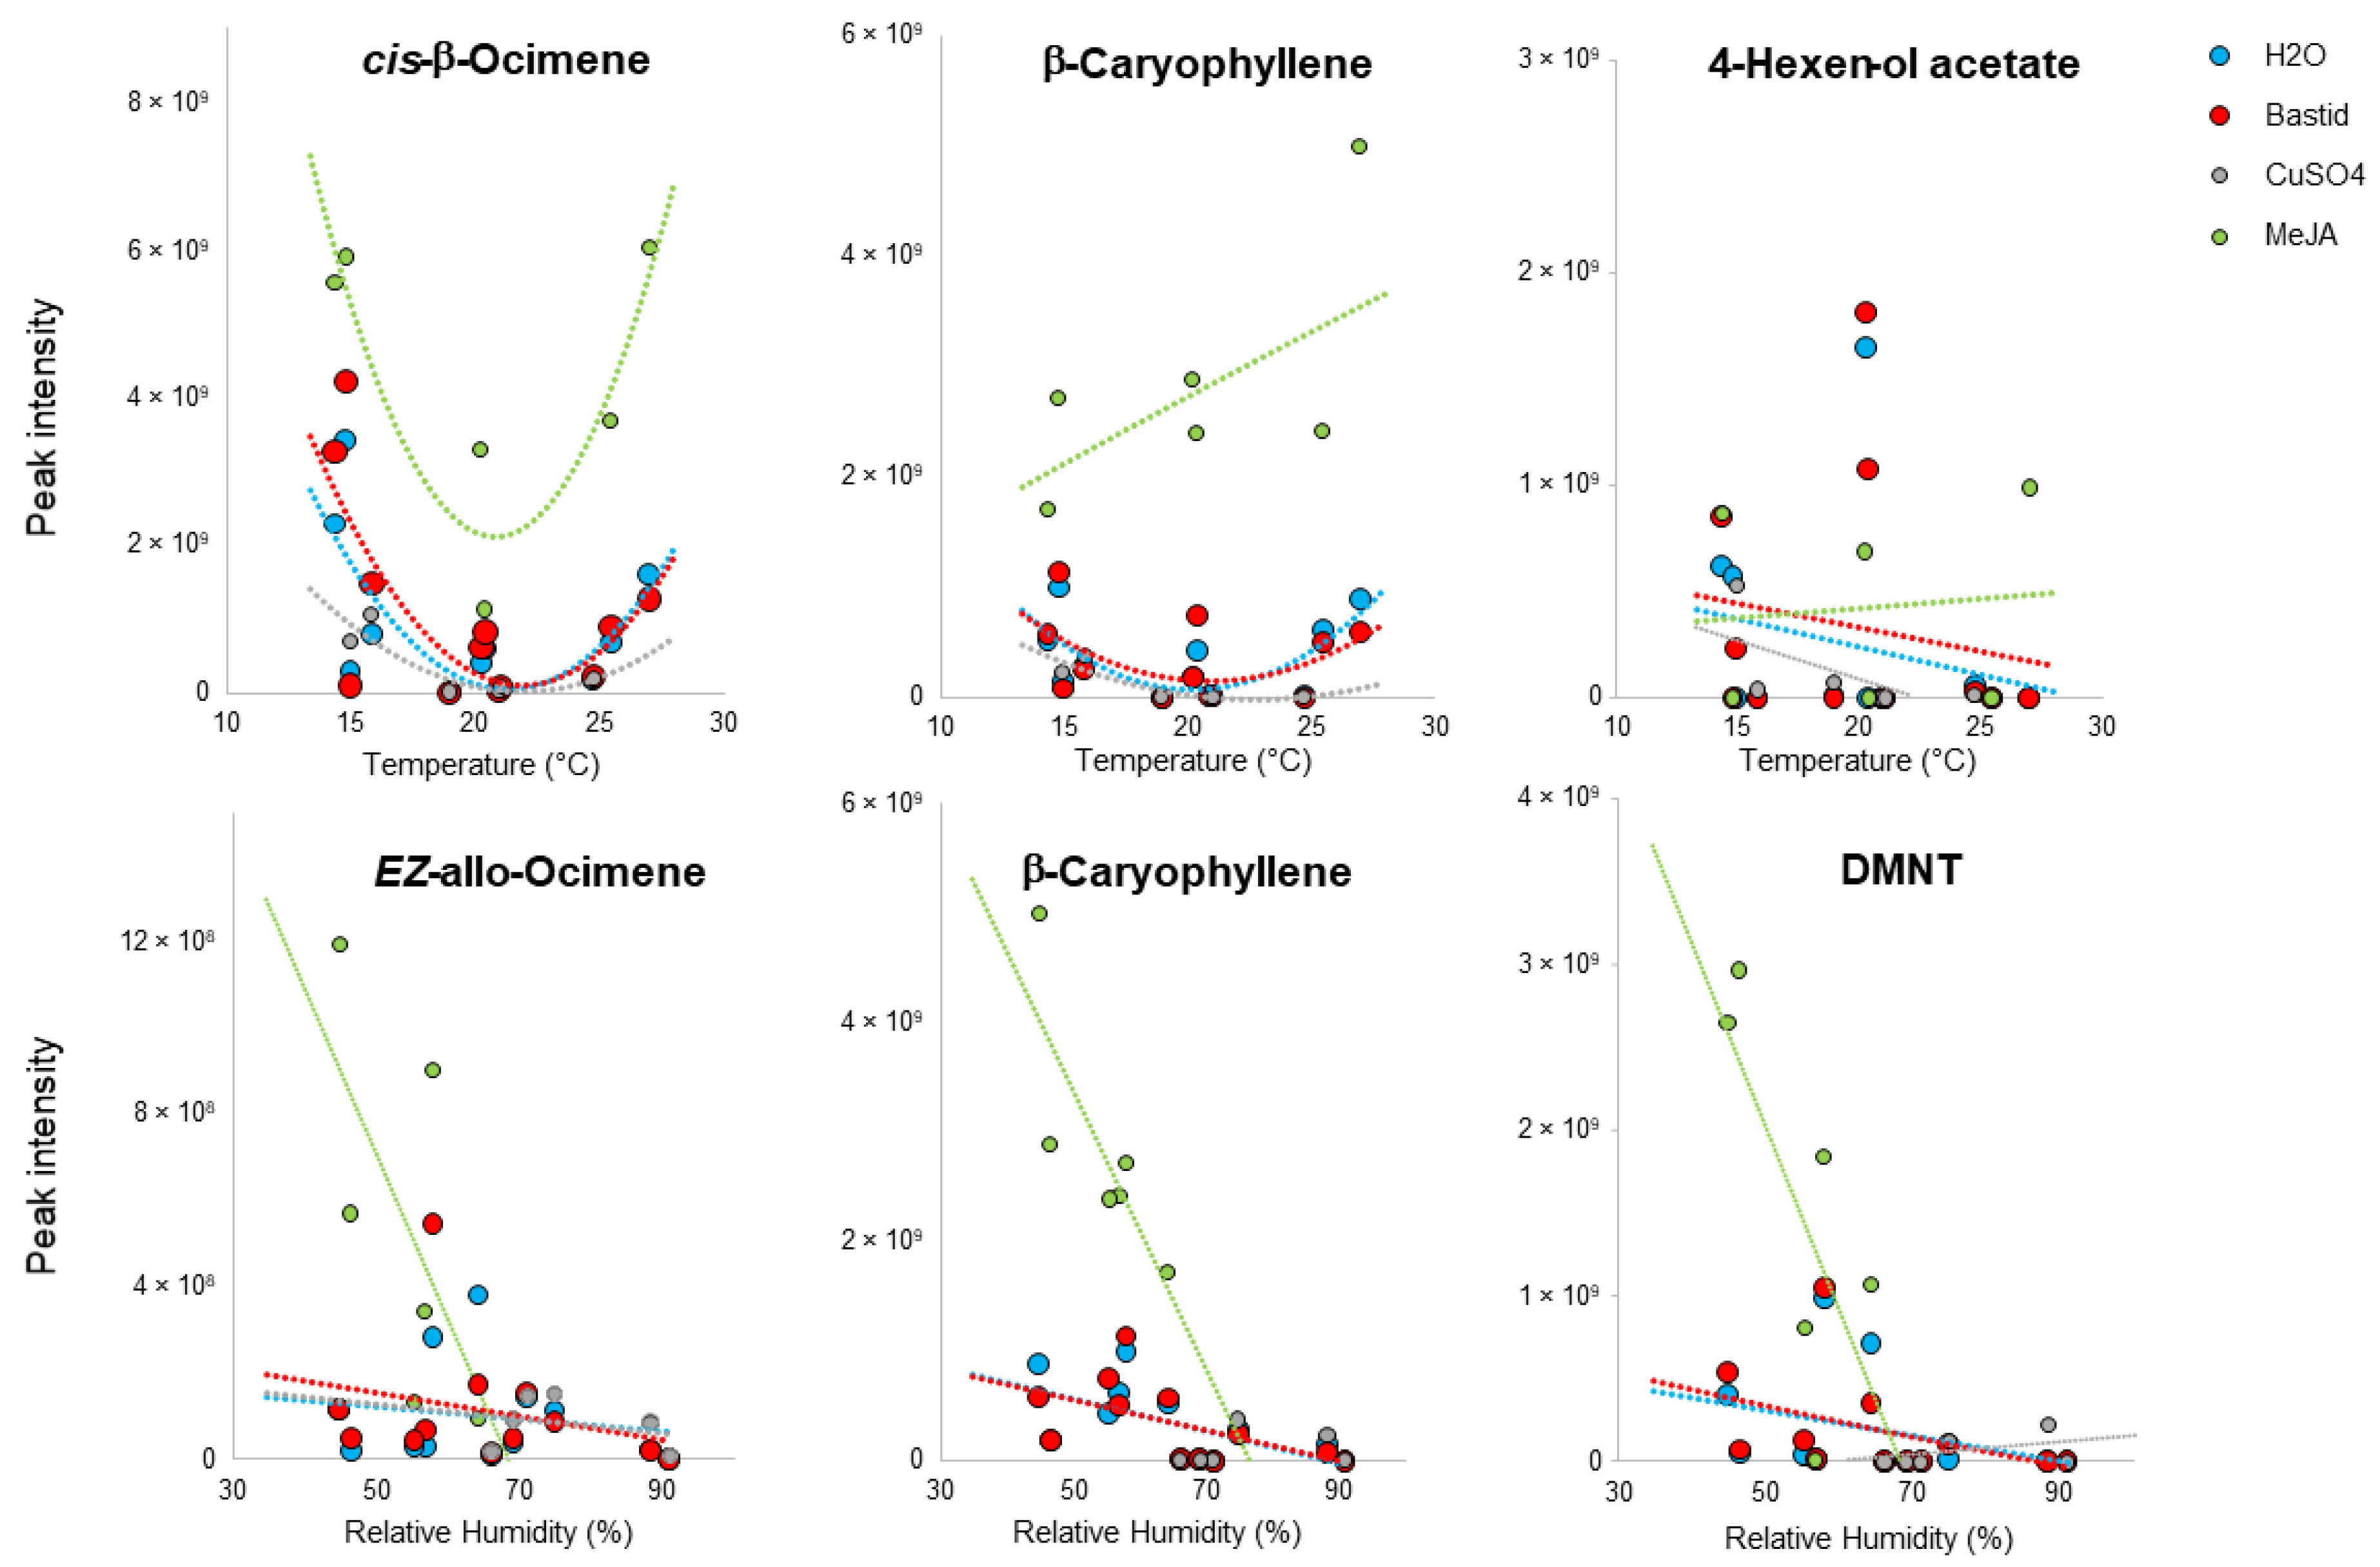
3.5. Impact of Environmental Factors on VOC Detection
4. Discussion
Elicitation of Polyphenols
5. Elicitation of VOC Emission
5.1. Development of a Method for VOC Collection in the Field
5.2. Induction of VOC Emission by Elicitor Treatments
5.3. Impact of Climate on VOC Emission
6. Conclusions
7. Experimental Section
7.1. Experimental Plots
7.2. Elicitor Treatments
7.3. Phenolics Analysis
8. VOC Collection and Analysis
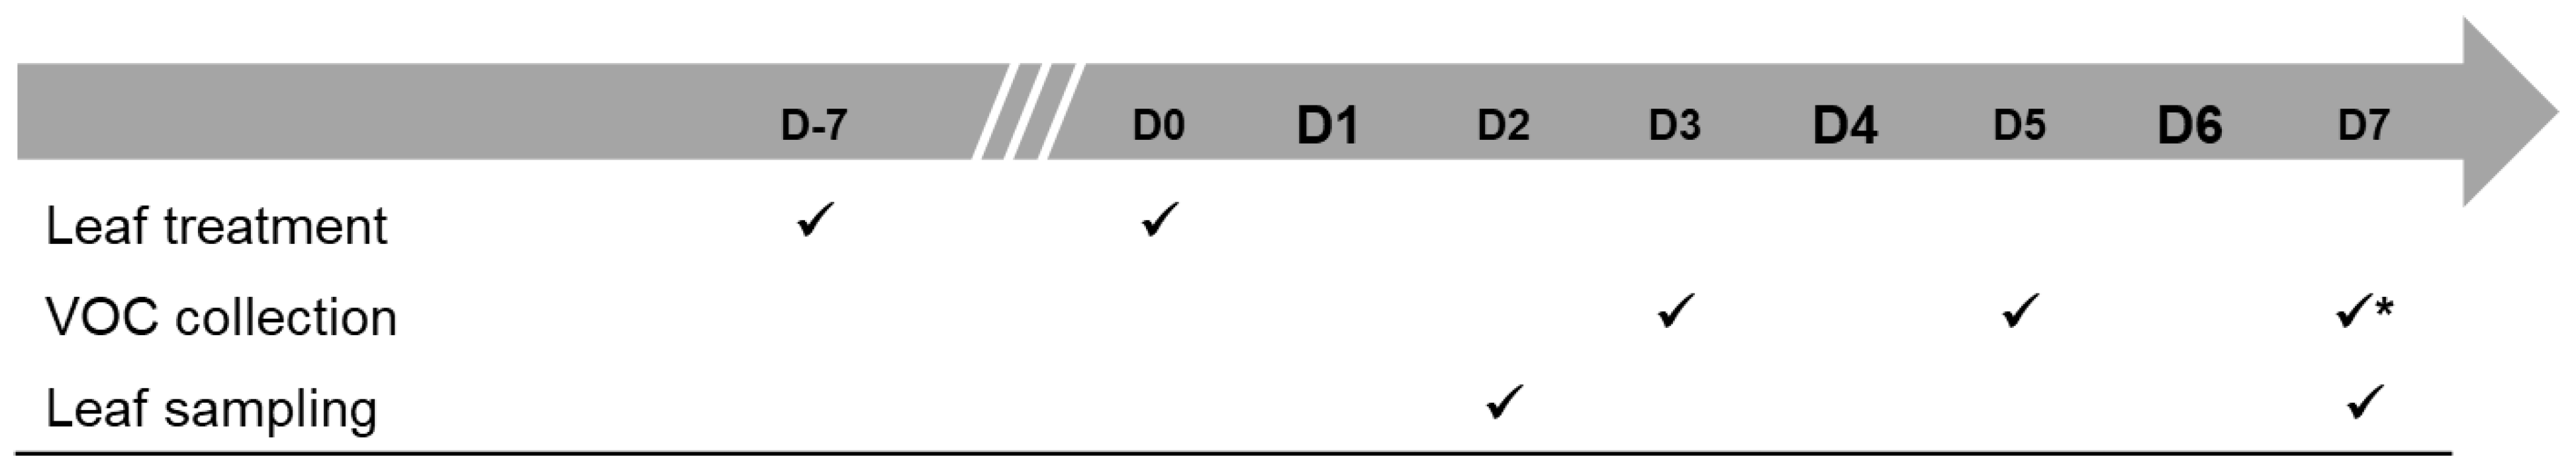
8.1. VOC Collection
8.2. GC-MS Analysis
8.3. Data Treatment
Supplementary Materials
Author Contributions
Funding
Institutional Review Board Statement
Informed Consent Statement
Data Availability Statement
Conflicts of Interest
Sample Availability
References
- Dangl, J.L.; Jones, J.D. Plant pathogens and integrated defence responses to infection. Nature 2001, 411, 826–833. [Google Scholar] [CrossRef] [PubMed]
- Heloir, M.C.; Adrian, M.; Brule, D.; Claverie, J.; Cordelier, S.; Daire, X.; Dorey, S.; Gauthier, A.; Lemaitre-Guillier, C.; Negrel, J.; et al. Recognition of elicitors in grapevine: From MAMP and DAMP perception to induced resistance. Front. Plant Sci. 2019, 10, 1117. [Google Scholar] [CrossRef] [PubMed]
- Garcia-Brugger, A.; Lamotte, O.; Vandelle, E.; Bourque, S.; Lecourieux, D.; Poinssot, B.; Wendehenne, D.; Pugin, A. Early signaling events induced by elicitors of plant defenses. Mol. Plant Microbe Interact. 2006, 19, 711–724. [Google Scholar] [CrossRef] [PubMed]
- Zhang, Y.; Li, X. Salicylic acid: Biosynthesis, perception, and contributions to plant immunity. Curr. Opin. Plant Biol. 2019, 50, 29–36. [Google Scholar] [CrossRef] [PubMed]
- Yi, S.Y.; Shirasu, K.; Moon, J.S.; Lee, S.-G.; Kwon, S.-Y. The activated SA and JA signaling pathways have an influence on flg22-triggered oxidative burst and callose deposition. PLoS ONE 2014, 9, e88951. [Google Scholar] [CrossRef] [PubMed]
- Belhadj, A.; Saigne, C.; Telef, N.; Cluzet, S.; Bouscaut, J.; Corio-Costet, M.F.; Merillon, J.M. Methyl jasmonate induces defense responses in grapevine and triggers protection against Erysiphe necator. J. Agric. Food Chem. 2006, 54, 9119–9125. [Google Scholar] [CrossRef] [PubMed]
- Dufour, M.C.; Corio-Costet, M.F. Variability in the sensitivity of biotrophic grapevine pathogens (Erysiphe necator and Plasmopara viticola) to acibenzolar-S methyl and two phosphonates. Eur. J. Plant Pathol. 2013, 136, 247–259. [Google Scholar] [CrossRef]
- Burdziej, A.; Bellee, A.; Bodin, E.; Valls Fonayet, J.; Magnin, N.; Szakiel, A.; Richard, T.; Cluzet, S.; Corio-Costet, M.F. Three types of elicitors induce grapevine resistance against downy mildew via common and specific immune responses. J. Agric. Food Chem. 2021, 69, 1781–1795. [Google Scholar] [CrossRef]
- Perrin, D.R.; Cruickshank, I. Studies on Phytoalexins VII. Chemical stimulation of Pisatin formation in Pisum Sativum L. Aust. J. Biol. Sci. 1965, 18, 803–816. [Google Scholar] [CrossRef]
- Tomiyama, K.; Fukaya, M. Accumulation of rishitin in dead potato-tuber tissue following treatment with HgCl2. Jpn. J. Phytopathol. 1975, 41, 418–420. [Google Scholar] [CrossRef][Green Version]
- Hanawa, F.; Tahara, S.; Mizutani, J. Antifungal stress compounds from Veratrum grandiflorum leaves treated with cupric chloride. Phytochemistry 1992, 31, 3005–3007. [Google Scholar] [CrossRef]
- Aziz, A.; Trotel-Aziz, P.; Dhuicq, L.; Jeandet, P.; Couderchet, M.; Vernet, G. Chitosan oligomers and copper sulfate induce grapevine defense reactions and resistance to gray mold and downy mildew. Phytopathology 2006, 96, 1188–1194. [Google Scholar] [CrossRef] [PubMed]
- Van Aubel, G.; Cambier, P.; Dieu, M.; Van Cutsem, P. Plant immunity induced by COS-OGA elicitor is a cumulative process that involves salicylic acid. Plant Sci. 2016, 247, 60–70. [Google Scholar] [CrossRef] [PubMed]
- Aveline, N.; Bidaut, F.; Daire, X. Les stimulateurs de défense en viticulture. Phytoma Défense Végétaux 2019, 723, 16–18. [Google Scholar]
- Steimetz, E.; Trouvelot, S.; Gindro, K.; Bordier, A.; Poinssot, B.; Adrian, M.; Daire, X. Influence of leaf age on induced resistance in grapevine against Plasmopara viticola. Physiol. Mol. Plant Pathol. 2012, 79, 89–96. [Google Scholar] [CrossRef]
- Delaunois, B.; Farace, G.; Jeandet, P.; Clément, C.; Baillieul, F.; Dorey, S.; Cordelier, S. Elicitors as alternative strategy to pesticides in grapevine? Current knowledge on their mode of action from controlled conditions to vineyard. Environ. Sci. Pollut. Res. Int. 2014, 21, 4837–4846. [Google Scholar] [CrossRef]
- Adrian, M.; Trouvelot, S.; Gamm, M.; Poinssot, B.; Héloir, M.C.; Daire, X. Activation of grapevine defense mechanisms: Theoritical and and applied approaches. In Plant Defence: Biological Control; Mérillon, J.-M., Ramawat, K.G., Eds.; Springer: Berlin/Heidelberg, Germany, 2012; Volume 12, p. 313. [Google Scholar]
- Pezet, R.; Gindro, K.; Viret, O.; Richter, H. Effects of resveratrol, viniferins and pterostilbene on Plasmopara viticola zoospore mobility and disease development. Vitis 2004, 43, 145–148. [Google Scholar]
- Chong, J.; Poutaraud, A.; Hugueney, P. Metabolism and roles of stilbenes in plants. Plant Sci. 2009, 177, 143–155. [Google Scholar] [CrossRef]
- Adrian, M.; Trouvelot, S.; Steimetz, E.; Chiltz, A.; Klinguer, A.; Bernaud, E.; Guillier, C.; Heloir, M.-C.; Poinssot, B.; Daire, X. Induced resistance as a strategy for vineyard protection. In Proceedings of the International Symposium Ampelos “Trends in World Vitiniculture Development”, Santorin, Greece, 30–31 May 2013. [Google Scholar]
- Lemaitre-Guillier, C.; Dufresne, C.; Chartier, A.; Cluzet, S.; Valls, J.; Jacquens, L.; Douillet, A.; Aveline, N.; Adrian, M.; Daire, X. VOCs are relevant biomarkers of elicitor-induced defences in grapevine. Molecules 2021, 26. [Google Scholar] [CrossRef]
- Dudareva, N.; Negre, F.; Nagegowda, D.A.; Orlova, I. Plant Volatiles: Recent advances and future perspectives. Crit. Rev. Plant Sci. 2006, 25, 417–440. [Google Scholar] [CrossRef]
- Lazazzara, V.; Avesani, S.; Robatscher, P.; Oberhuber, M.; Pertot, I.; Schuhmacher, R.; Perazzolli, M. Biogenic volatile organic compounds in the grapevine response to pathogens, beneficial microorganisms, resistance inducers, and abiotic factors. J. Exp. Bot. 2022, 73, 529–554. [Google Scholar] [CrossRef] [PubMed]
- Piesik, D.; Wenda-Piesik, A. Sitophilus granarius responses to blends of five groups of cereal kernels and one group of plant volatiles. J. Stored Prod. Res. 2015, 62, 36–39. [Google Scholar] [CrossRef]
- Wenda-Piesik, A.; Piesik, D.; Nowak, A.; Wawrzyniak, M. Tribolium confusum responses to blends of cereal kernels and plant volatiles. J. Appl. Entomol. 2016, 140, 558–563. [Google Scholar] [CrossRef]
- Kishimoto, K.; Matsui, K.; Ozawa, R.; Takabayashi, J. Analysis of defensive responses activated by volatile allo-ocimene treatment in Arabidopsis thaliana. Phytochemistry 2006, 67, 1520–1529. [Google Scholar] [CrossRef] [PubMed]
- Yi, H.S.; Heil, M.; Adame-Alvarez, R.M.; Ballhorn, D.J.; Ryu, C.M. Airborne induction and priming of plant defenses against a bacterial pathogen. Plant Physiol. 2009, 151, 2152–2161. [Google Scholar] [CrossRef]
- Riedlmeier, M.; Ghirardo, A.; Wenig, M.; Knappe, C.; Koch, K.; Georgii, E.; Dey, S.; Parker, J.E.; Schnitzler, J.P.; Vlot, A.C. Monoterpenes support systemic acquired resistance within and between plants. Plant Cell 2017, 29, 1440–1459. [Google Scholar] [CrossRef]
- Attaran, E.; Rostas, M.; Zeier, J. Pseudomonas syringae elicits emission of the terpenoid (E,E)-4,8,12-trimethyl-1,3,7,11-tridecatetraene in Arabidopsis leaves via jasmonate signaling and expression of the terpene synthase TPS4. Mol. Plant Microbe Interact. 2008, 21, 1482–1497. [Google Scholar] [CrossRef]
- Lazazzara, V.; Bueschl, C.; Parich, A.; Pertot, I.; Schuhmacher, R.; Perazzolli, M. Downy mildew symptoms on grapevines can be reduced by volatile organic compounds of resistant genotypes. Sci. Rep. 2018, 8, 1618. [Google Scholar] [CrossRef]
- Obara, N.; Hasegawa, M.; Kodama, O. Induced volatiles in elicitor-treated and rice blast fungus-inoculated rice leaves. Biosci. Biotechnol. Biochem. 2002, 66, 2549–2559. [Google Scholar] [CrossRef]
- Zhang, P.; Chen, K. Age-dependent variations of volatile emissions and inhibitory activity toward Botrytis cinerea and Fusarium oxysporum in Tomato leaves treated with Chitosan oligosaccharide. J. Plant Biol. 2009, 52, 332–339. [Google Scholar] [CrossRef]
- Salifu, R.; Chen, C.; Sam, F.E.; Jiang, Y. Application of Elicitors in Grapevine Defense: Impact on Volatile Compounds. Horticulturae 2022, 8, 451. [Google Scholar] [CrossRef]
- Chalal, M.; Winkler, J.B.; Gourrat, K.; Trouvelot, S.; Adrian, M.; Schnitzler, J.P.; Jamois, F.; Daire, X. Sesquiterpene volatile organic compounds (VOCs) are markers of elicitation by sulfated laminarine in grapevine. Front. Plant Sci. 2015, 6, 350. [Google Scholar] [CrossRef] [PubMed]
- Cabrera, J.C.; Boland, A.; Cambier, P.; Frettinger, P.; Van Cutsem, P. Chitosan oligosaccharides modulate the supramolecular conformation and the biological activity of oligogalacturonides in Arabidopsis. Glycobiology 2010, 20, 775–786. [Google Scholar] [CrossRef] [PubMed]
- Hadwiger, L.A. Multiple effects of chitosan on plant systems: Solid science or hype. Plant Sci. 2013, 208, 42–49. [Google Scholar] [CrossRef] [PubMed]
- Hampel, D.; Mosandl, A.; Wüst, M. Biosynthesis of mono-and sesquiterpenes in carrot roots and leaves (Daucus carota L.): Metabolic cross talk of cytosolic mevalonate and plastidial methylerythritol phosphate pathways. Phytochemistry 2005, 66, 305–311. [Google Scholar] [CrossRef] [PubMed]
- Tholl, D.; Hossain, O.; Weinhold, A.; Rose, U.S.R.; Wei, Q. Trends and applications in plant volatile sampling and analysis. Plant J. 2021, 106, 314–325. [Google Scholar] [CrossRef] [PubMed]
- Donati, L.; Ferretti, L.; Frallicciardi, J.; Rosciani, R.; Valletta, A.; Pasqua, G. Stilbene biosynthesis and gene expression in response to methyl jasmonate and continuous light treatment in Vitis vinifera cv. Malvasia del Lazio and Vitis rupestris Du Lot cell cultures. Physiol. Plant 2019, 166, 646–662. [Google Scholar] [CrossRef]
- Santamaria, A.R.; Mulinacci, N.; Valletta, A.; Innocenti, M.; Pasqua, G. Effects of elicitors on the production of resveratrol and viniferins in cell cultures of Vitis vinifera L. cv Italia. J. Agric. Food Chem. 2011, 59, 9094–9101. [Google Scholar] [CrossRef]
- Vezzulli, S.; Civardi, S.; Ferrari, F.; Bavaresco, L. Methyl Jasmonate Treatment as a Trigger of Resveratrol Synthesis in Cultivated Grapevine. Am. J. Enol. Vitic. 2007, 58, 530–533. [Google Scholar]
- Goufo, P.; Singh, R.K.; Cortez, I. A Reference List of Phenolic Compounds (Including Stilbenes) in Grapevine (Vitis vinifera L.) Roots, Woods, Canes, Stems, and Leaves. Antioxidants 2020, 9, 398. [Google Scholar] [CrossRef]
- Wang, L.; Xu, M.; Liu, C.; Wang, J.; Xi, H.; Wu, B.; Loescher, W.; Duan, W.; Fan, P.; Li, S. Resveratrols in grape berry skins and leaves in vitis germplasm. PLoS ONE 2013, 8, e61642. [Google Scholar] [CrossRef] [PubMed]
- Wojdyło, A.; Samoticha, J.; Nowicka, P.; Chmielewska, J. Characterisation of (poly)phenolic constituents of two interspecific red hybrids of Rondo and Regent (Vitis vinifera) by LC-PDA-ESI-MS QTof. Food Chem. 2018, 239, 94–101. [Google Scholar] [CrossRef] [PubMed]
- Petronilho, S.; Coimbra, M.A.; Rocha, S.M. A critical review on extraction techniques and gas chromatography based determination of grapevine derived sesquiterpenes. Anal. Chim. Acta 2014, 846, 8–35. [Google Scholar] [CrossRef] [PubMed]
- Salinas, M.; Zalacain, A.; Pardo, F.; Alonso, G.L. Stir Bar Sorptive Extraction applied to volatile constituents evolution during Vitis vinifera ripening. J. Agric. Food Chem. 2004, 52, 4821–4827. [Google Scholar] [CrossRef] [PubMed]
- Cheung, W.H.K.; Pasamontes, A.; Peirano, D.J.; Zhao, W.; Grafton-Cardwell, E.E.; Kapaun, T.; Yokomi, R.K.; Simmons, J.; Doll, M.; Fiehn, O.; et al. Volatile organic compound (VOC) profiling of citrus tristeza virus infection in sweet orange citrus varietals using thermal desorption gas chromatography time of flight mass spectrometry (TD-GC/TOF-MS). Metabolomics 2015, 11, 1514–1525. [Google Scholar] [CrossRef]
- Kfoury, N.; Scott, E.; Orians, C.; Robbat, A. Direct Contact Sorptive Extraction: A Robust Method for Sampling Plant Volatiles in the Field. J. Agric. Food Chem. 2017, 65, 8501–8509. [Google Scholar] [CrossRef]
- Cicolella, A. Les composés organiques volatils (COV): Définition, classification et propriétés. Rev. Mal. Respir. 2008, 25, 155–163. [Google Scholar] [CrossRef]
- Stewart-Jones, A.; Poppy, G.M. Comparison of Glass Vessels and Plastic Bags for Enclosing Living Plant Parts for Headspace Analysis. J. Chem. Ecol. 2006, 32, 845. [Google Scholar] [CrossRef]
- Holopainen, J.K.; Gershenzon, J. Multiple stress factors and the emission of plant VOCs. Trends Plant Sci. 2010, 15, 176–184. [Google Scholar] [CrossRef]
- Farré-Armengol, G.; Filella, I.; Llusià, J.; Peñuelas, J. β-Ocimene, a key floral and foliar volatile involved in multiple interactions between plants and other organisms. Molecules 2017, 22, 1148. [Google Scholar] [CrossRef]
- Loughrin, J.H.; Potter, D.A.; Hamilton-Kemp, T.R.; Byers, M.E. Diurnal emission of volatile compounds by Japanese beetle-damaged grape leaves. Phytochemistry 1997, 45, 919–923. [Google Scholar] [CrossRef]
- Krugner, R.; Wallis, C.M.; Walse, S.S. Attraction of the egg parasitoid, Gonatocerus ashmeadi Girault (Hymenoptera: Mymaridae) to synthetic formulation of a (E)-β-ocimene and (E,E)-α-farnesene mixture. Biol. Control 2014, 77, 23–28. [Google Scholar] [CrossRef]
- Cai, X.; Bian, L.; Xu, X.; Luo, Z.; Li, Z.; Chen, Z. Field background odour should be taken into account when formulating a pest attractant based on plant volatiles. Sci. Rep. 2017, 7, 41818. [Google Scholar] [CrossRef]
- Kishimoto, K.; Matsui, K.; Ozawa, R.; Takabayashi, J. Volatile C6-aldehydes and Allo-ocimene activate defense genes and induce resistance against Botrytis cinerea in Arabidopsis thaliana. Plant Cell Physiol. 2005, 46, 1093–1102. [Google Scholar] [CrossRef] [PubMed]
- Catola, S.; Marino, G.; Emiliani, G.; Huseynova, T.; Musayev, M.; Akparov, Z.; Maserti, B.E. Physiological and metabolomic analysis of Punica granatum (L.) under drought stress. Planta 2016, 243, 441–449. [Google Scholar] [CrossRef]
- Zhang, Y.; Fu, X.; Wang, F.; Yang, Z. Spatial differences in (Z)-3-hexen-1-ol production preferentially reduces Spodoptera litura larva attack on the young leaves of Nicotiana benthamiana. Plant Sci. 2016, 252, 367–373. [Google Scholar] [CrossRef]
- Savchenko, T.; Dehesh, K. Drought stress modulates oxylipin signature by eliciting 12-OPDA as a potent regulator of stomatal aperture. Plant Signal. Behav. 2014, 9, 1151–1160. [Google Scholar] [CrossRef]
- Scala, A.; Allmann, S.; Mirabella, R.; Haring, M.A.; Schuurink, R.C. Green Leaf Volatiles: A Plant’s Multifunctional Weapon against Herbivores and Pathogens. Int. J. Mol. Sci. 2013, 14, 17781–17811. [Google Scholar] [CrossRef]
- Wang, R.; Shen, X.; Wang, C.; Ge, R.; Zhang, Z.; Guo, X. Analysis of leaf volatiles of Crabapple (Malus sp.) individuals in different aphids’ resistance. Am. J. Plant Sci. 2014, 5, 7. [Google Scholar] [CrossRef]
- Al-Tameme, H.J.; Hadi, M.Y.; Hameed, I.H. Phytochemical analysis of Urtica dioica leaves by fourier-transform infrared spectroscopy and gas chromatography-mass spectrometry. J. Pharmacogn. Phytother. 2015, 7, 238–252. [Google Scholar]
- Niederbacher, B.; Winkler, J.B.; Schnitzler, J.P. Volatile organic compounds as non-invasive markers for plant phenotyping. J. Exp. Bot. 2015, 66, 5403–5416. [Google Scholar] [CrossRef] [PubMed]
- Zhang, Q.-H.; Birgersson, G.; Zhu, J.; Löfstedt, C.; Löfqvist, J.; Schlyter, F. Leaf Volatiles from Nonhost Deciduous Trees: Variation by Tree Species, Season and Temperature, and Electrophysiological Activity in Ips typographus. J. Chem. Ecol. 1999, 25, 1923–1943. [Google Scholar] [CrossRef]
- Niinemets, Ü.; Reichstein, M. Controls on the emission of plant volatiles through stomata: Differential sensitivity of emission rates to stomatal closure explained. J. Geophys. Res. Atmos. 2003, 108, 4211. [Google Scholar] [CrossRef]
- Mofikoya, A.O.; Miura, K.; Ghimire, R.P.; Blande, J.D.; Kivimäenpää, M.; Holopainen, T.; Holopainen, J.K. Understorey Rhododendron tomentosum and leaf trichome density affect mountain birch VOC emissions in the subarctic. Sci. Rep. 2018, 8, 13261. [Google Scholar] [CrossRef]
- Ju, Y.-L.; Yue, X.-F.; Zhao, X.-F.; Zhao, H.; Fang, Y.-L. Physiological, micro-morphological and metabolomic analysis of grapevine (Vitis vinifera L.) leaf of plants under water stress. Plant Physiol. Biochem. 2018, 130, 501–510. [Google Scholar] [CrossRef]
- Copolovici, L.O.; Filella, I.; Llusià, J.; Niinemets, Ü.; Peñuelas, J. The capacity for thermal protection of photosynthetic electron transport varies for different monoterpenes in Quercus ilex. Plant Physiol. 2005, 139, 485–496. [Google Scholar] [CrossRef]
- Vallat, A.; Gu, H.; Dorn, S. How rainfall, relative humidity and temperature influence volatile emissions from apple trees in situ. Phytochemistry 2005, 66, 1540–1550. [Google Scholar] [CrossRef]
- Mofikoya, A.; Miura, K.; Holopainen, T.; Holopainen, J.K. Passive adsorption of neighbouring plant volatiles linked to associational susceptibility in a subarctic ecosystem. Biogeosci. Discuss. 2016, 1–30. [Google Scholar] [CrossRef]
- Camacho-Coronel, X.; Molina-Torres, J.; Heil, M. Sequestration of exogenous volatiles by plant cuticular waxes as a mechanism of passive associational resistance: A proof of concept. Front. Plant Sci. 2020, 11, 121. [Google Scholar] [CrossRef]
- Egigu, M.C.; Ibrahim, M.A.; Riikonen, J.; Yahya, A.; Holopainen, T.; Julkunen-Tiitto, R.; Holopainen, J.K. Effects of rising temperature on secondary compounds of Yeheb (Cordeauxia edulis Hemsley). Am. J. Plant Sci. 2014, 5, 517–527. [Google Scholar] [CrossRef][Green Version]
- Krzyzaniak, Y.; Trouvelot, S.; Negrel, J.; Cluzet, S.; Valls, J.; Richard, T.; Bougaud, A.; Jacquens, L.; Klinguer, A.; Chiltz, A.; et al. A plant extract acts both as a resistance inducer and an oomycide against grapevine downy mildew. Front. Plant Sci. 2018, 9, 1085. [Google Scholar] [CrossRef] [PubMed]


| Vineyard | Year | Total VOCs | Terpenoids |
|---|---|---|---|
| Burgundy | 2018 | 0.69 ± 0.23 | 0.62 ± 0.13 |
| 2019 | 1.02 ± 0.25 | 1.18 ± 0.38 | |
| Bordeaux | 2018 | 0.78 ± 0.37 | 0.88 ± 1.26 |
| 2019 | 1.05 ± 0.48 | 1.26 ± 0.48 |
| Burgundy | Formula | PB_D3 | PB_D5 | FS_D3 | FS_D5 | BC_D3 | BC_D5 | Induced in 2018 | |
|---|---|---|---|---|---|---|---|---|---|
| Terpenoids | β-Pinene | C10H16 | 1.00 | n.i. | 1.04 | 1.07 | 1.35 | 1.88 | FS |
| β-Myrcene | C10H16 | n.i. | 1.04 | n.i. | 2.16 | 2.28 × 10⁷ | 3.21 | ||
| α-Terpinene | C10H16 | 1.68 * | 1.01 × 10⁷ | 1.76 | 1.55 | 1.96 × 10⁷ | |||
| trans-β-Ocimene | C10H16 | n.i. * | 1.15 | n.i. | 1.58 | 2.29 * | 1.90 | ||
| cis-β-Ocimene | C10H16 | 1.43 * | 1.23 | n.i. | 1.33 | 1.52 | 1.38 | FS, BC | |
| E,Z allo-Ocimene | C10H16 | n.i. | 1.92 * | 1.00 | 2.25 | 2.51 | 1.38 | ||
| Linalool | C10H18O | 1.03 | 1.22 | n.i. | 1.21 | 1.14 | 1.93 | ||
| 1H-Cyclopropa[a]naphthalene, 1a,2,3,3a,4,5,6,7b-octahydro-1,1,3a,7-tetramethyl-, [1aR-(1a.α,3a.α.,7b.α)]- | C15H24 | 5.00 * | 1.01 | 1.06 | 1.44 | ||||
| Isocaryophyllene | C15H24 | 1.27 | 2.46 × 10⁷ | 1.60 × 10⁷ | 2.22 × 10⁷ | 3.75 × 10⁷ | |||
| Others | Methyl salicylate | C8H8O3 | 1.08 | 1.19 | 1.35 | n.i. | 1.24 | n.i. | BC |
| (E)-4,8-Dimethylnona-1,3,7-triene (DMNT) | C11H18 | n.i. | 1.07 | 1.33 | n.i. | 1.50 | 3.00 | FS, BC | |
| Acetic acid, methyl ester | C3H6O2 | 2.96 × 10⁷ | 2.65 | 3.84 × 10⁶ | 2.17 | 5.30 × 10⁶ | FS | ||
| 3,5-di-tert-Butyl-4-hydroxybenzaldehyde | C15H22O2 | 7.08 × 10⁵ | 4.73 × 10⁵ | 1.98 | 1.09 | ||||
| Benzene, 1-methyl-3-(1-methylethenyl)- | C10H12 | 1.06 | n.i. | 7.46 × 10⁶ | n.i. | 2.46 | 2.06 | ||
| Nonanal | C9H18O | 1.01 * | 1.07 | 1.39 | 1.07 | n.i. | 1.23 | BC | |
| Bordeaux | PB_D3 | PB_D5 | FS_D3 | FS_D5 | BC_D3 | BC_D4 | |||
| Terpenoids | α-Pinene | C10H16 | 1.23 | n.i. | 2.44 | 4.21 * | 1.01 | 13.3 | BC |
| Limonene | C10H16 | 1.81 | 1.05 | n.i. | 4.65 | 1.80 | n.i. | BC | |
| E,E allo-Ocimene | C10H16 | n.i. | 1.14 | 2.55 | 1.31 | 1.57 | 2.15 | ||
| E,Z allo-Ocimene | C10H16 | n.i. | n.i. | 2.22 | 1.08 | 1.1 | 1.22 | BC | |
| γ-Terpinene | C10H16 | 15.3 | 2.48 | n.i. | 1.98 | 7.48 × 10⁵ | |||
| (−)-β-Bourbonene | C15H24 | 1.75 | 5.7 * | 3.34 | 3.62 | FS | |||
| Butanoic acid, 3-hexenyl ester, (Z)- | C10H18O2 | n.i. | 2.18 * | 74.2 | 1.70 × 10⁵ | 12.2 | FS | ||
| Others | 2,6-Diisopropylnaphthalene | C16H20 | 2.25 × 10⁶ | 3.14 | 7.55 × 10³ | 1.21 | FS | ||
| Acetic acid, hexyl ester | C8H16O2 | 2.43 | n.i. | n.i. | 3.14 × 10⁵ | 1.12 | 1.11 | BC | |
| n-Hexadecanoic acid | C16H32O2 | n.i. | 1.78 | 9.39 | 1.58 | n.i. | 1.68 |
| MeJA | Formula | PB_D3 | PB_D5 | FS_D3 | FS_D5 | BC_D3 | BC_D5 | |
|---|---|---|---|---|---|---|---|---|
| Terpenoids | α-Pinene | C10H16 | 2.14 | 2.28 | 4.53 | 7.27 | 2.47 | 4.39 |
| β-Pinene | C10H16 | 2.82 | 5.00 | 7.07 | 6.76 | 2.78 | 4.83 | |
| β-Myrcene | C10H16 | 2.23 | 1.96 | 9.73 * | 21.8 | 1.65 × 10⁸ * | 4.44 | |
| α-Terpinene | C10H16 | 6.15 | 9.03 × 10⁷ | 38.2 * | 4.77 | 8.17 | 5.43 × 10⁶ | |
| trans-β-Ocimene | C10H16 | 2.60 | 1.75 | 9.36 | 8.60 | 26.3 | 3.74 | |
| E,E allo-Ocimene | C10H16 | 9.97 | 9.99 | 6.68 | 3.81 | |||
| E,Z allo-Ocimene | C10H16 | 2.46 | 3.17 | 10.2 | 11.5 | 28.8 | 4.30 | |
| cis-β-Ocimene | C10H16 | 2.42 | 1.72 | 3.73 | 5.40 | 8.19 | 1.88 | |
| Limonene | C10H16 | 3.31 | 2.65 | 5.95 | 5.14 | 5.09 | 3.56 | |
| Linalool | C10H18O | n.i. | 1.18 | 5.71 | 2.75 | 9.56 | 2.27 | |
| Humulene | C15H24 | 3.58 | 3.73 | 14.0 | 12.7 | 60.2 * | 14.2 | |
| β-Caryophyllene | C15H24 | 3.30 | 2.73 | 5.64 | 3.93 | 16.07 | 5.60 | |
| Isocaryophyllene | C15H24 | 7.46 | 3.64 × 10⁸ | 1.47 × 10⁸ | 8.04 × 10⁷ | |||
| (1R,2S,6S,7S,8S)-8-Isopropyl-1-methyl-3-methylenetricyclo[4.4.0.02,7]decane-rel- | C15H24 | 2.05 | 1.07 | 5.98 | 3.55 × 10⁷ | 4.59 × 10⁷ * | 2.38 × 10⁷ | |
| Naphthalene, 1,2,3,5,6,8a-hexahydro-4,7-dimethyl-1-(1-methylethyl)-, (1S-cis)- | C15H24 | 2.08 | n.i. | 2.68 | 8.53 | 1.98 × 10⁷ * | 2.33 × 10⁷ | |
| α-Copaene | C15H24 | 1.46 | 1.88 | 1.51 | 2.73 | 117.14 | 6.93 | |
| cis-Muurola-4(14),5-diene | C15H24 | n.i. | 2.14 | 5.76 | 3.50 | 4,47 × 10⁶ | ||
| Bicyclosesquiphellandrene | C15H24 | n.i. | 1.51 | 1.15 | 3.45 | 1,26 × 10⁷ | 8.54 | |
| α-Terpineol | C10H18O | 2.80 | 3.88 × 10⁷ | 33.1 * | 7.27 × 10⁷ | 1.70 × 10⁷ | 1.58 × 10⁷ | |
| Others | Acetic acid | C2H4O2 | n.i. | 1.75 | n.i. | 1.16 | 1.01 | 1.52 |
| Benzene, 1,3-dimethyl- | C8H10 | 2.70 | 2.95 × 10⁷ | 5.78 | 2.36 | |||
| α-Calacorene | C15H20 | 5.70 | 12.8 | 4.63 | 3.71 × 10⁶ | 9.13 × 10⁵ * | 9.62 × 10⁵ | |
| (E)-4,8-Dimethylnona-1,3,7-triene (DMNT) | C11H18 | 1.51 | 1.87 | 6.54 * | 6.19 | 60.8 | 19.2 | |
| Benzene, 1-methyl-3-(1-methylethenyl)- | C10H12 | 17.5 | 2.50 | 7.29 × 10⁷ * | 15.5 | 35.8 * | 3.20 | |
| o-Cymene | C10H14 | 4.77 | 1.88 | 5.31 * | 4.41 | 5.31 | 6.50 | |
| Acetic acid, methyl ester | C3H6O2 | 4.45 × 10⁶ | 1.07 | 2.42 × 10⁷ | n.i. | 5.32 × 10⁶ | ||
| 3-Hexen-1-ol, acetate, (Z)- | C8H14O2 | 2.68 | 1.05 | 1.22 | 1.45 | n.i. | n.i. | |
| Nonanal | C9H18O | 2.58 | 1.19 | n.i. | 1.44 | 1.37 | 1.11 | |
| CuSO4 | PB_D3 | PB_D5 | FS_D3 | FS_D5 | BC_D2 | BC_D5 | ||
| Terpenoids | α-Pinene | C10H16 | 1.56 | n.i. | n.i. | 1.70 | 1.10 | 13.5 |
| β-Pinene | C10H16 | 2.00 | 1.10 | n.i. | 5.48 | n.i. | 9.25 × 10⁵ | |
| trans-β-Ocimene | C10H16 | 1.12 | 1.24 | 1.68 | n.i. | 1.60 | 1.90 | |
| E,E allo-Ocimene | C10H16 | 1.27 | 3.95 | 5.36 | n.i. | 1.68 | 2.19 * | |
| E,Z allo-Ocimene | C10H16 | 1.33 | 3.88 | 4.97 | 1.02 | 1.60 | 2.28 | |
| cis-β-Ocimene | C10H16 | 1.31 | 2.35 | 1.29 | n.i. | 1.61 | 1.38 | |
| Limonene | C10H16 | 1.32 | 1.79 | n.i. | 4.64 | 1.22 | 1.41 | |
| Isocaryophyllene | C15H24 | 1.02 × 10⁸ * | 7.96 × 10⁴ | 1.70 × 10⁵ | 5.37 × 10⁵ | |||
| (−)-β-Bourbonene | C15H24 | 1.27 | 12.9 * | 1.54 | 4.68 | 4.37 | ||
| β-Caryophyllene | C15H24 | 1.35 | 1.60 * | n.i. | 1.07 | 1.22 | 1.63 * | |
| Humulene | C15H24 | 1.89 | 1.39 | 1.28 | 1.53 | |||
| α-Copaene | C15H24 | 1.38 | 2.13 | n.i. | n.i. | 3.32 × 10⁵ | 1.16 | |
| Bicyclo[5.2.0]nonane, 2-methylene-4,8,8-trimethyl-4-vinyl- | C15H24 | 1.42 | 5.84 | n.i. | n.i. | 1.13 | 1.38 | |
| Eucalyptol | C10H18O | 3.82 | 4.49 | 2.96 × 10⁵ | 8.25 × 10⁴ | |||
| Butanoic acid, 3-hexenyl ester, (Z)- | C10H18O2 | n.i. | 3.28 | 1.85 | n.i. | 1.11 × 10⁵ | 10.6 | |
| Others | Benzene, 1-methyl-3-(1-methylethyl)- | C10H14 | 1.97 × 10⁷ | 1.93 | 1.49 | 3.99 | 6.59 × 10⁴ | |
| Methyl salicylate | C8H8O3 | 1.32 | 1.86 | 1.06 | 1.17 | 2.60 | n.i. | |
| Hexanal | C6H12O | 4.03 × 10⁸ | 2.58 | 2.27 | 3.38 × 10⁵ | |||
| n-Valeric acid cis-3-hexenyl ester | C11H20O2 | 2.94 × 10⁷ | 1.73 × 10⁷ | n.i. | 2.01 × 10⁴ | 1.25 × 10⁶ | ||
| (E)-4,8-Dimethylnona-1,3,7-triene (DMNT) | C11H18 | 5.50 | 2.20 × 10⁸ * | 2.24 | n.i. | 3.37 | ||
| n-Hexadecanoic acid | C16H32O2 | 2.75 * | 1.70 | 2.08 | 1.33 | n.i. | 2.16 | |
| 6H-Benzofuro[3,2-c][1]benzopyran, 3,9-dimethoxy- | C17H14O4 | 1.58 × 10⁶ | 1.80 × 10⁶ | 2.24 | 2.44 * | 1.18 | 2.07 |
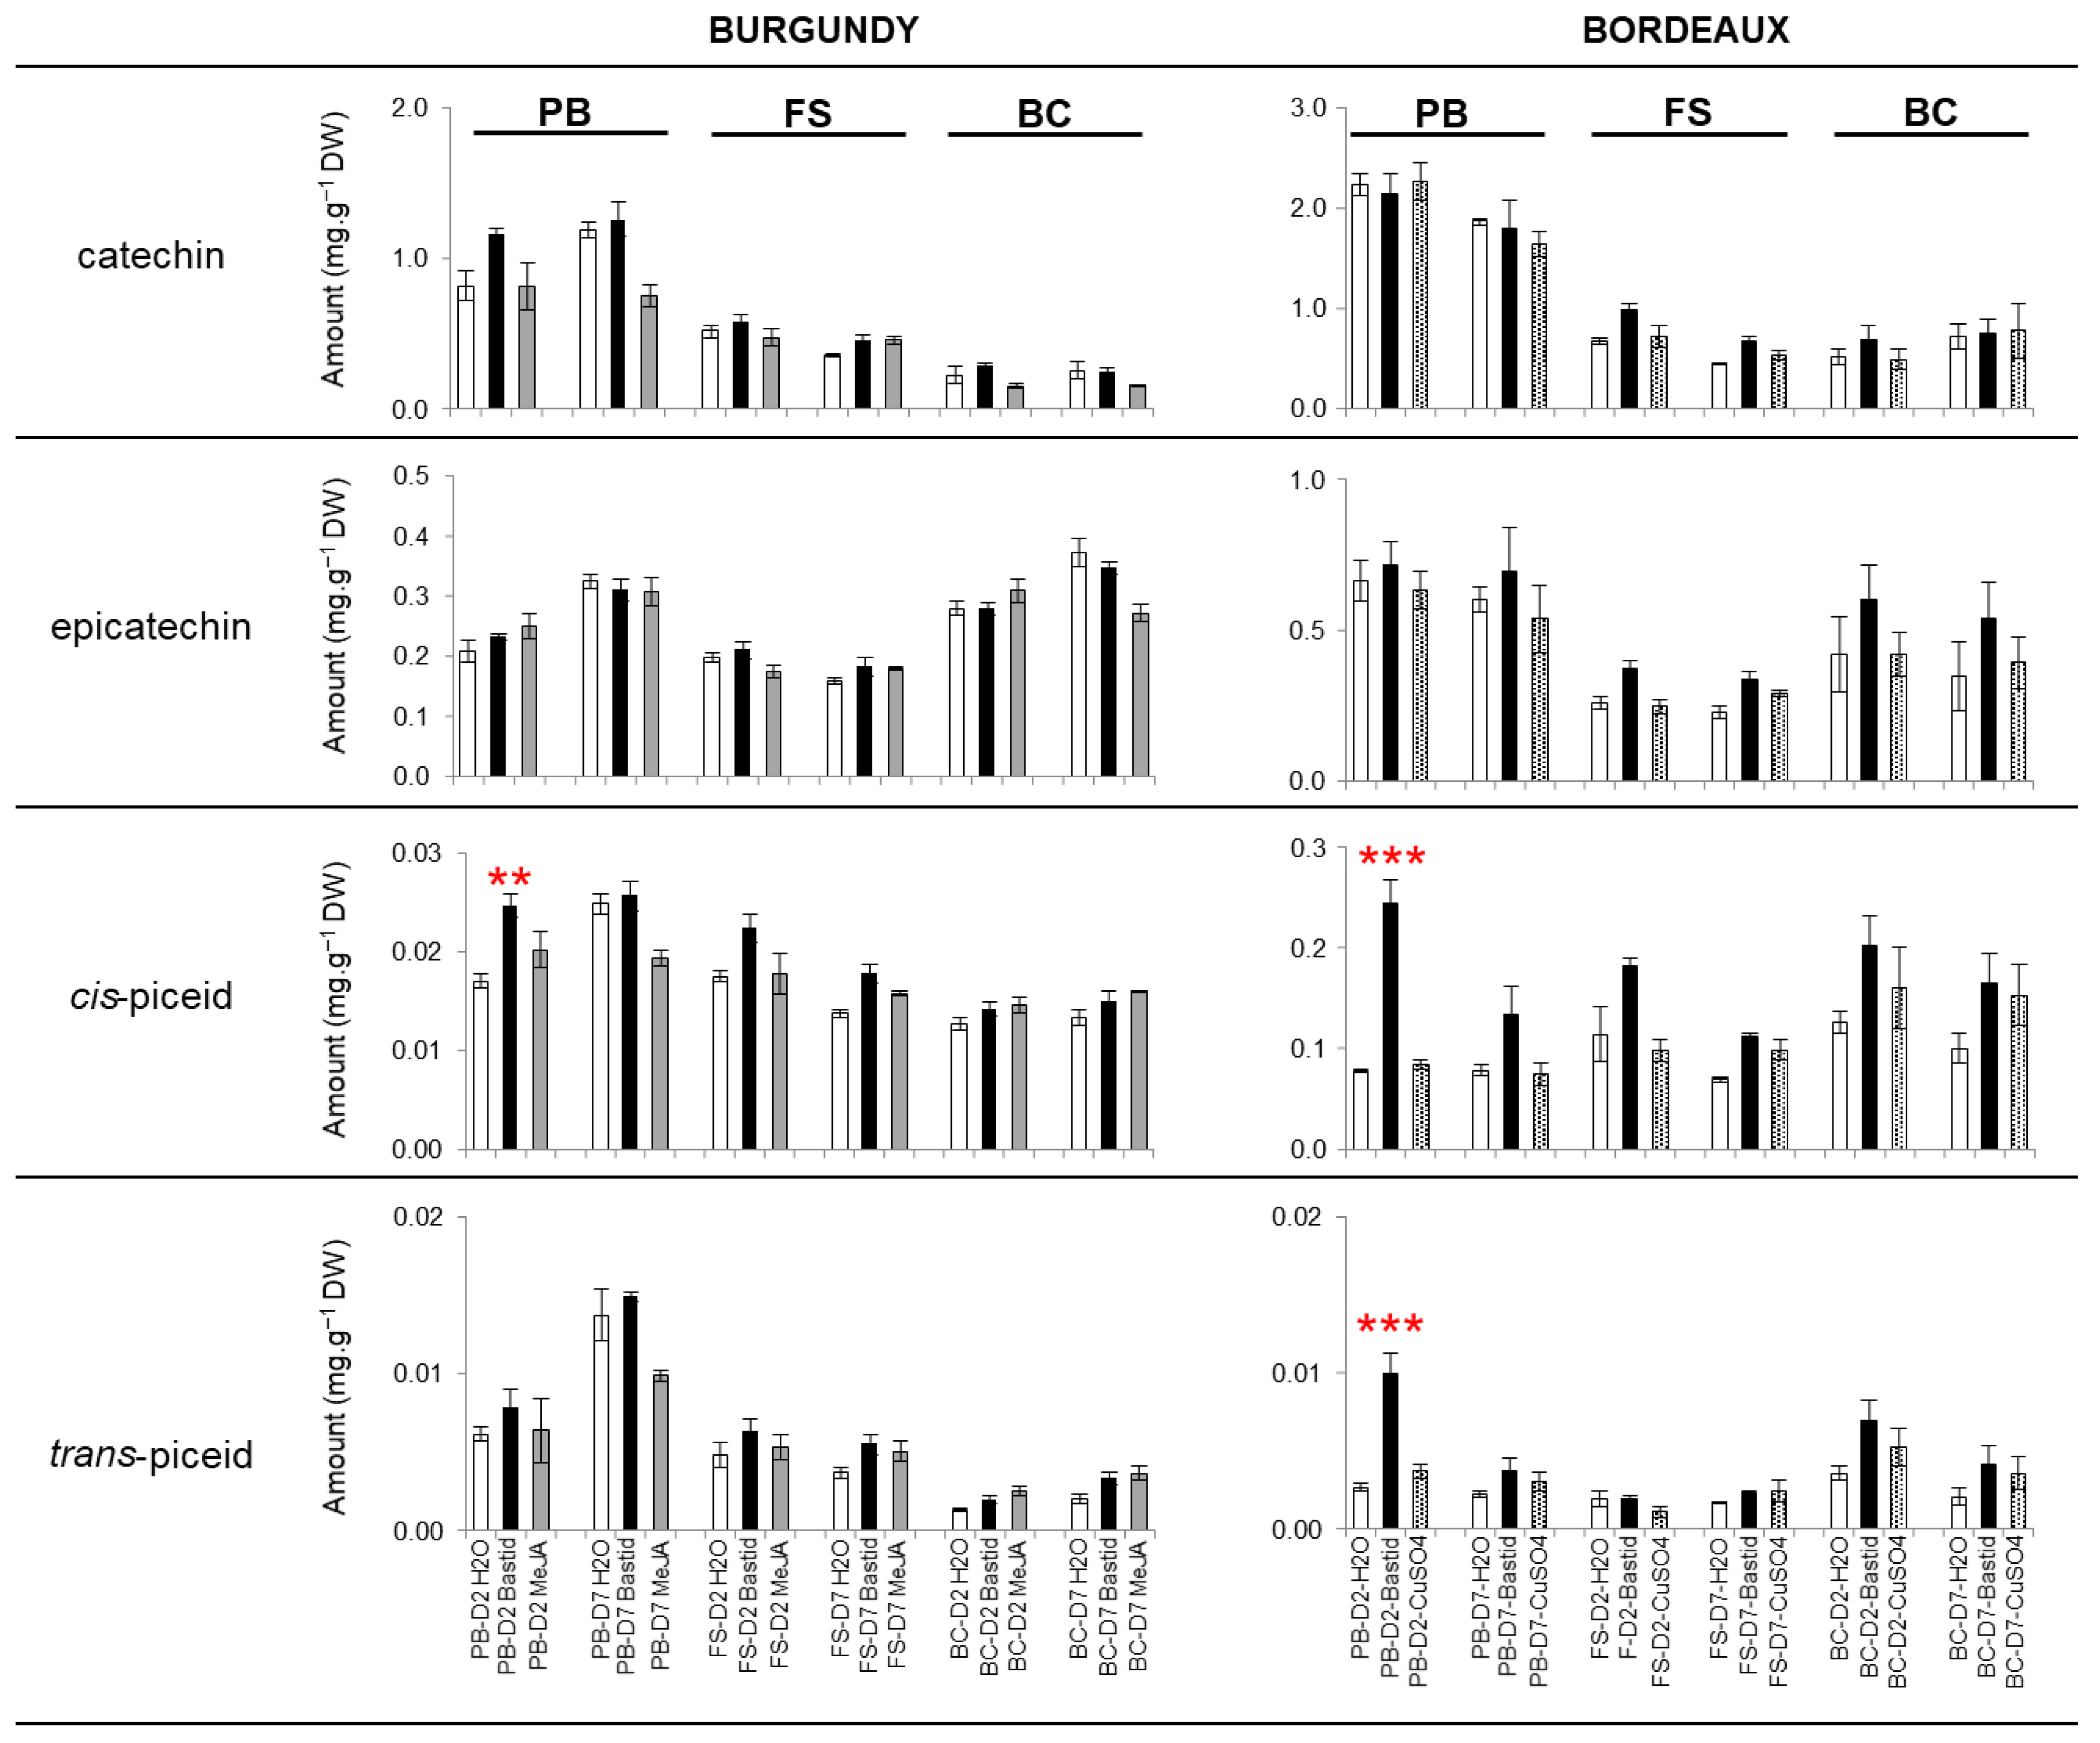
 up,
up,  stable;
  down ranking). Grey coloured lines, elicitor-induced VOCs absent in the water control;
  induced terpenoids. Phenological stages of grapevine: pre-blossom: PB; fruit-set: FS and bunch-closure: BC. Time points: three- and five-days post treatment (D3 and D5). n.i.: not induced; *: putative contaminant.
up, stable; down ranking). Grey coloured lines, elicitor-induced VOCs absent in the water control; induced terpenoids. Phenological stages of grapevine: pre-blossom: PB; fruit-set: FS and bunch-closure: BC. Time points: three- and five-days post treatment (D3 and D5). n.i.: not induced; *: putative contaminant.
induced terpenoids. Phenological stages of grapevine: pre-blossom: PB; fruit-set: FS and bunch-closure: BC. Time points: three- and five-days post treatment (D3 and D5). n.i.: not induced; *: putative contaminant.
up, stable; down ranking). Grey coloured lines, elicitor-induced VOCs absent in the water control; induced terpenoids. Phenological stages of grapevine: pre-blossom: PB; fruit-set: FS and bunch-closure: BC. Time points: three- and five-days post treatment (D3 and D5). n.i.: not induced; *: putative contaminant. up; stable; down ranking). Grey coloured lines, elicitor-induced VOCs absent in the water control; induced terpenoids. Phenological stages of grapevine: PB, pre-blossom; F, fruit-set; BC, bunch-closure. Time points: three- and five-days post treatment (D3 and D5). n.i.: not induced; *: putative contaminant.
up; stable; down ranking). Grey coloured lines, elicitor-induced VOCs absent in the water control; induced terpenoids. Phenological stages of grapevine: PB, pre-blossom; F, fruit-set; BC, bunch-closure. Time points: three- and five-days post treatment (D3 and D5). n.i.: not induced; *: putative contaminant.
up; stable; down ranking). Grey coloured lines, elicitor-induced VOCs absent in the water control; induced terpenoids. Phenological stages of grapevine: PB, pre-blossom; F, fruit-set; BC, bunch-closure. Time points: three- and five-days post treatment (D3 and D5). n.i.: not induced; *: putative contaminant.
| Bastid® | CuSO4 | MeJA | |
|---|---|---|---|
| Burgundy | 50 mg/L | 0.56 g/L | |
| Bordeaux | 156 mg/L (2.5 L/ha) | 3 g/L |
Publisher’s Note: MDPI stays neutral with regard to jurisdictional claims in published maps and institutional affiliations. |
© 2022 by the authors. Licensee MDPI, Basel, Switzerland. This article is an open access article distributed under the terms and conditions of the Creative Commons Attribution (CC BY) license (https://creativecommons.org/licenses/by/4.0/).
Share and Cite
Lemaitre-Guillier, C.; Chartier, A.; Dufresne, C.; Douillet, A.; Cluzet, S.; Valls, J.; Aveline, N.; Daire, X.; Adrian, M. Elicitor-Induced VOC Emission by Grapevine Leaves: Characterisation in the Vineyard. Molecules 2022, 27, 6028. https://doi.org/10.3390/molecules27186028
Lemaitre-Guillier C, Chartier A, Dufresne C, Douillet A, Cluzet S, Valls J, Aveline N, Daire X, Adrian M. Elicitor-Induced VOC Emission by Grapevine Leaves: Characterisation in the Vineyard. Molecules. 2022; 27(18):6028. https://doi.org/10.3390/molecules27186028
Chicago/Turabian StyleLemaitre-Guillier, Christelle, Agnès Chartier, Christelle Dufresne, Antonin Douillet, Stéphanie Cluzet, Josep Valls, Nicolas Aveline, Xavier Daire, and Marielle Adrian. 2022. "Elicitor-Induced VOC Emission by Grapevine Leaves: Characterisation in the Vineyard" Molecules 27, no. 18: 6028. https://doi.org/10.3390/molecules27186028
APA StyleLemaitre-Guillier, C., Chartier, A., Dufresne, C., Douillet, A., Cluzet, S., Valls, J., Aveline, N., Daire, X., & Adrian, M. (2022). Elicitor-Induced VOC Emission by Grapevine Leaves: Characterisation in the Vineyard. Molecules, 27(18), 6028. https://doi.org/10.3390/molecules27186028