A DFT Study on the Excited Electronic States of Cyanopolyynes: Benchmarks and Applications
Abstract
1. Introduction
2. Results and Discussion
2.1. Training Sets
2.2. Electronic Excitation Energy
- mean percent error:
- mean square percent error:
- mean absolute percent error:
2.3. Vibrational Frequencies
- -
- root mean square error
- -
- uncertainty of
2.4. Recommendations
2.5. Electronic Excitation Energy of Longer Cyanoacetylenes
3. Materials and Methods
4. Conclusions
Supplementary Materials
Author Contributions
Funding
Informed Consent Statement
Data Availability Statement
Conflicts of Interest
References
- Zangwill, A.; Soven, P. Density-functional approach to local-field effects in finite systems: Photoabsorption in the rare gases. Phys. Rev. A 1980, 21, 1561–1572. [Google Scholar] [CrossRef]
- Gronowski, M. TD-DFT benchmark: Excited states of atoms and atomic ions. Comput. Theor. Chem 2017, 1108, 50–56. [Google Scholar] [CrossRef]
- Loos, P.F.; Lipparini, F.; Boggio-Pasqua, M.; Scemama, A.; Jacquemin, D. A Mountaineering Strategy to Excited States: Highly Accurate Energies and Benchmarks for Medium Sized Molecules. J. Chem. Theory Comput. 2020, 16, 1711–1741. [Google Scholar] [CrossRef]
- Loos, P.F.; Scemama, A.; Jacquemin, D. The Quest for Highly Accurate Excitation Energies: A Computational Perspective. J. Phys. Chem. Lett. 2020, 11, 2374–2383. [Google Scholar] [CrossRef]
- Loos, P.F.; Scemama, A.; Blondel, A.; Garniron, Y.; Caffarel, M.; Jacquemin, D. A Mountaineering Strategy to Excited States: Highly Accurate Reference Energies and Benchmarks. J. Chem. Theory Comput. 2018, 14, 4360–4379. [Google Scholar] [CrossRef]
- Liang, J.; Feng, X.; Hait, D.; Head-Gordon, M. Revisiting the Performance of Time-Dependent Density Functional Theory for Electronic Excitations: Assessment of 43 Popular and Recently Developed Functionals from Rungs One to Four. J. Chem. Theory Comput. 2022, 18, 3460–3473. [Google Scholar] [CrossRef]
- Suellen, C.; Freitas, R.G.; Loos, P.F.; Jacquemin, D. Cross-Comparisons between Experiment, TD-DFT, CC, and ADC for Transition Energies. J. Chem. Theory Comput. 2019, 15, 4581–4590. [Google Scholar] [CrossRef]
- Caricato, M.; Trucks, G.W.; Frisch, M.J.; Wiberg, K.B. Electronic Transition Energies: A Study of the Performance of a Large Range of Single Reference Density Functional and Wave Function Methods on Valence and Rydberg States Compared to Experiment. J. Chem. Theory Comput. 2010, 6, 370–383. [Google Scholar] [CrossRef]
- Send, R.; Kuhn, M.; Furche, F. Assessing Excited State Methods by Adiabatic Excitation Energies. J. Chem. Theory Comput. 2011, 7, 2376–2386. [Google Scholar] [CrossRef]
- Jacquemin, D.; Planchat, A.; Adamo, C.; Mennucci, B. TD-DFT Assessment of Functionals for Optical 0-0 Transitions in Solvated Dyes. J. Chem. Theory Comput. 2012, 8, 2359–2372. [Google Scholar] [CrossRef]
- Jacobsen, R.L.; Johnson, R.D., 3rd; Irikura, K.K.; Kacker, R.N. Anharmonic Vibrational Frequency Calculations Are Not Worthwhile for Small Basis Sets. J. Chem. Theory Comput. 2013, 9, 951–954. [Google Scholar] [CrossRef]
- Merrick, J.P.; Moran, D.; Radom, L. An Evaluation of Harmonic Vibrational Frequency Scale Factors. J. Phys. Chem. A 2007, 111, 11683–11700. [Google Scholar] [CrossRef] [PubMed]
- Kesharwani, M.K.; Brauer, B.; Martin, J.M. Frequency and zero-point vibrational energy scale factors for double-hybrid density functionals (and other selected methods): Can anharmonic force fields be avoided? J. Phys. Chem. A 2015, 119, 1701–1714. [Google Scholar] [CrossRef] [PubMed]
- Furche, F.; Ahlrichs, R. Adiabatic time-dependent density functional methods for excited state properties. J. Chem. Phys. 2002, 117, 7433–7447. [Google Scholar] [CrossRef]
- Botschwina, P. Accurate equilibrium structures for small polyatomic molecules, radicals and carbenes. Mol. Phys. 2005, 103, 1441–1460. [Google Scholar] [CrossRef]
- Ehrenfreund, P.; Charnley, S.B. Organic Molecules in the Interstellar Medium, Comets, and Meteorites: A Voyage from Dark Clouds to the Early Earth. Annu. Rev. Astron. Astrophys. 2000, 38, 427–483. [Google Scholar] [CrossRef]
- Loomis, R.A.; Burkhardt, A.M.; Shingledecker, C.N.; Charnley, S.B.; Cordiner, M.A.; Herbst, E.; Kalenskii, S.; Lee, K.L.K.; Willis, E.R.; Xue, C.; et al. An investigation of spectral line stacking techniques and application to the detection of HC11N. Nat. Astron. 2021, 5, 188–196. [Google Scholar] [CrossRef]
- Ding, H.; Boguslavskiy, A.E.; Schmidt, T.W.; Maier, J.P. Gas phase electronic spectrum of the nitrogen terminated nanowire NC16N. Chem. Phys. Lett. 2004, 392, 225–228. [Google Scholar] [CrossRef]
- Chalifoux, W.A.; Tykwinski, R.R. Synthesis of polyynes to model the sp-carbon allotrope carbyne. Nat. Chem. 2010, 2, 967–971. [Google Scholar] [CrossRef]
- Varkey, E.C.; Hutter, J.; Limacher, P.A.; Luthi, H.P. Impact of donor-acceptor functionalization on the properties of linearly pi-conjugated oligomers: Establishing quantitative relationships for the substituent and substituent cooperative effect based on quantum chemical calculations. J. Org. Chem. 2013, 78, 12681–12689. [Google Scholar] [CrossRef]
- Casari, C.S.; Tommasini, M.; Tykwinski, R.R.; Milani, A. Carbon-atom wires: 1-D systems with tunable properties. Nanoscale 2016, 8, 4414–4435. [Google Scholar] [CrossRef]
- West, K.; Wang, C.; Batsanov, A.S.; Bryce, M.R. Carbon-rich molecules: Synthesis and isolation of aryl/heteroaryl terminal bis(butadiynes) (HC≡C-C≡C-Ar-C≡C-C≡CH) and their applications in the synthesis of oligo(arylenebutadiynylene) molecular wires. Org. Biomol. Chem. 2008, 6, 1934–1937. [Google Scholar] [CrossRef] [PubMed]
- Cornil, J.; Beljonne, D.; Calbert, J.P.; Brédas, J.L. Interchain Interactions in Organic π-Conjugated Materials: Impact on Electronic Structure, Optical Response, and Charge Transport. Adv. Mater. 2001, 13, 1053–1067. [Google Scholar] [CrossRef]
- Ricci, A.; Chiarini, M.; Lo Sterzo, C.; Pizzoferrato, R.; Paoloni, S. Synthesis and photophysical properties of poly(arylene ethynylene) small-molecules and polymers derivatized with leucine substituents. J. Photochem. Photobiol. A 2015, 298, 1–8. [Google Scholar] [CrossRef]
- Pino, T.; Ding, H.; Güthe, F.; Maier, J.P. Electronic spectra of the chains HC2nH (n = 8–13) in the gas phase. J. Chem. Phys. 2001, 114, 2208–2212. [Google Scholar] [CrossRef]
- Wada, Y.; Wakabayashi, T.; Kato, T. Photoinduced reaction of hydrogen-end-capped polyynes with iodine molecules. J. Phys. Chem. B 2011, 115, 8439–8445. [Google Scholar] [CrossRef] [PubMed]
- Apetrei, C.; Nagarajan, R.; Maier, J.P. Gas phase 11Σu+←X1Σg+ electronic spectra of polyacetylenes HC2nH, n = 5–7. J. Phys. Chem. A 2009, 113, 11099–11100. [Google Scholar] [CrossRef] [PubMed]
- Jochnowitz, E.B.; Maier, J.P. Electronic spectroscopy of carbon chains. Mol. Phys. 2008, 106, 2093–2106. [Google Scholar] [CrossRef]
- Jolly, A.; Benilan, Y. Review of quantitative spectroscopy of polyynes. J. Quant. Spectrosc. Radiat. Transf. 2008, 109, 963–973. [Google Scholar] [CrossRef]
- Shi, L.; Rohringer, P.; Wanko, M.; Rubio, A.; Waßerroth, S.; Reich, S.; Cambré, S.; Wenseleers, W.; Ayala, P.; Pichler, T. Electronic band gaps of confined linear carbon chains ranging from polyyne to carbyne. Phys. Rev. Materials 2017, 1, 075601. [Google Scholar] [CrossRef]
- Zirzlmeier, J.; Schrettl, S.; Brauer, J.C.; Contal, E.; Vannay, L.; Bremond, E.; Jahnke, E.; Guldi, D.M.; Corminboeuf, C.; Tykwinski, R.R.; et al. Optical gap and fundamental gap of oligoynes and carbyne. Nat. Commun. 2020, 11, 4797. [Google Scholar] [CrossRef] [PubMed]
- Movsisyan, L.D.; Peeks, M.D.; Greetham, G.M.; Towrie, M.; Thompson, A.L.; Parker, A.W.; Anderson, H.L. Photophysics of threaded sp-carbon chains: The polyyne is a sink for singlet and triplet excitation. J. Am. Chem. Soc. 2014, 136, 17996–18008. [Google Scholar] [CrossRef]
- Job, V.A.; King, G.W. The electronic spectrum of cyanoacetylene. J. Mol. Spectrosc. 1966, 19, 155–177. [Google Scholar] [CrossRef]
- Job, V.A.; King, G.W. The electronic spectrum of cyanoacetylene. J. Mol. Spectrosc. 1966, 19, 178–184. [Google Scholar] [CrossRef]
- Herzberg, G.; Innes, K.K. Ultraviolet Absorption Spectra of Hcn and Dcn: I. The α—X and β—X Systems. Can. J. Phys. 1957, 35, 842–879. [Google Scholar] [CrossRef]
- Chutjian, A.; Tanaka, H.; Wicke, B.G.; Srivastava, S.K. Electron-impact excitation of the low-lying electronic states of HCN. J. Chem. Phys. 1977, 67, 4835–4839. [Google Scholar] [CrossRef]
- Fish, G.B.; Cartwright, G.J.; Walsh, A.D.; Warsop, P.A. Rotational structure in the Transition of cyanogen at 2200 Å. J. Mol. Spectrosc. 1972, 41, 20–32. [Google Scholar] [CrossRef]
- Callomon, J.H.; Davey, A.B. Rotational Analysis of the 3000 Absorption System of Cyanogen, C2N2. Proc. Phys. Soc. 1963, 82, 335–336. [Google Scholar] [CrossRef]
- Dargelos, A.; Karamanis, P.; Pouchan, C. Ab-initio calculations of the IR spectra of dicyanodiacetylene (C6N2) beyond the harmonic approximation. Chem. Phys. Lett. 2019, 723, 155–159. [Google Scholar] [CrossRef]
- Fischer, G.; Johnson, G.D.; Ramsay, D.A.; Ross, I.G. Electronic Spectrum of Dicyanoacetylene. 2. Interpretation of the 2800 Å Transition. J. Phys. Chem. A 2003, 107, 10637–10641. [Google Scholar] [CrossRef]
- Miller, F.A.; Hannan, R.B. The ultraviolet absorption spectrum of dicyanoacetylene. Spectrochim. Acta 1958, 12, 321–331. [Google Scholar] [CrossRef]
- Miller, F.A.; Lemmon, D.H. The infrared and Raman spectra of dicyanodiacetylene, NCCCCCCN. Spectrochim. Acta Part A Mol. Spectrosc. 1967, 23, 1415–1423. [Google Scholar] [CrossRef]
- McSwiney, H.D.; Merritt, J.A. 3100-Å Electronic Absorption of Dicyanodiacetylene. J. Chem. Phys. 1970, 52, 5184–5186. [Google Scholar] [CrossRef]
- Jacox, M.E. Vibrational and Electronic Energy Levels of Polyatomic Transient Molecules. In NIST Chemistry WebBook, NIST Standard Reference Database Number 69; Linstrom, P.J., Mallard, W.G., Eds.; National Institute of Standards and Technology: Gaithersburg, MD, USA, 2022; p. 20899. [Google Scholar]
- Turowski, M.; Crepin, C.; Gronowski, M.; Guillemin, J.C.; Coupeaud, A.; Couturier-Tamburelli, I.; Pietri, N.; Kołos, R. Electronic Absorption and Phosphorescence of Cyanodiacetylene. J. Chem. Phys. 2010, 133, 074310. [Google Scholar] [CrossRef]
- Turowski, M.; Crepin, C.; Douin, S.; Kolos, R. Formation and spectroscopy of dicyanotriacetylene (NC8N) in solid Kr. J. Phys. Chem. A 2015, 119, 2701–2708. [Google Scholar] [CrossRef]
- Turowski, M.; Crépin, C.; Couturier-Tamburelli, I.; Piétri, N.; Kołos, R. Low-temperature phosphorescence of dicyanoacetylene in rare gas solids. Low Temp. Phys. 2012, 38, 723–726. [Google Scholar] [CrossRef][Green Version]
- Crepin, C.; Turowski, M.; Ceponkus, J.; Douin, S.; Boye-Peronne, S.; Gronowski, M.; Kołos, R. Uv-Induced Growth of Cyanopolyyne Chains in Cryogenic Solids. Phys. Chem. Chem. Phys. 2011, 13, 16780–16785. [Google Scholar] [CrossRef]
- Turowski, M. Niskotemperaturowe Badania Fotochemii i Spektroskopii Cyjanoacetylenów o Znaczeniu Astrofizycznym. Ph.D. Thesis, Institute of Physical Chemistry Polish Academy of Sciences, Warsaw, Poland, 2012. [Google Scholar]
- Coupeaud, A.; Turowski, M.; Gronowski, M.; Pietri, N.; Couturier-Tamburelli, I.; Kołos, R.; Aycard, J.P. Spectroscopy of Cyanodiacetylene in Solid Argon and the Photochemical Generation of Isocyanodiacetylene. J. Chem. Phys. 2007, 126, 164301. [Google Scholar] [CrossRef]
- Szczepaniak, U.; Kolos, R.; Gronowski, M.; Chevalier, M.; Guillemin, J.C.; Turowski, M.; Custer, T.; Crepin, C. Cryogenic Photochemical Synthesis and Electronic Spectroscopy of Cyanotetracetylene. J. Phys. Chem. A 2017, 121, 7374–7384. [Google Scholar] [CrossRef]
- Szczepaniak, U.; Kolos, R.; Gronowski, M.; Guillemin, J.C.; Crepin, C. Low Temperature Synthesis and Phosphorescence of Methylcyanotriacetylene. J. Phys. Chem. A 2018, 122, 89–99. [Google Scholar] [CrossRef]
- Szczepaniak, U.; Kołos, R.; Gronowski, M.; Chevalier, M.; Guillemin, J.C.; Crepin, C. Synthesis and Electronic Phosphorescence of Dicyanooctatetrayne (NC10N) in Cryogenic Matrixes. J. Phys. Chem. A 2018, 122, 5580–5588. [Google Scholar] [CrossRef] [PubMed]
- Chang, J.-W.; Lee, Y.-P. The C2N2 a3Σu+ → X1Σg+ chemiluminescence in matrices. J. Mol. Struct. 1987, 157, 155–165. [Google Scholar] [CrossRef]
- Smith, A.M.; Schallmoser, G.; Thoma, A.; Bondybey, V.E. Infrared spectral evidence of N≡C–C≡C–N≡C: Photoisomerization of N≡C–C≡C–C≡N in an argon matrix. J. Chem. Phys. 1993, 98, 1776–1785. [Google Scholar] [CrossRef]
- Weimer, M.; Hieringer, W.; Sala, F.D.; Görling, A. Electronic and optical properties of functionalized carbon chains with the localized Hartree–Fock and conventional Kohn–Sham methods. Chem. Phys. 2005, 309, 77–87. [Google Scholar] [CrossRef]
- Cai, Z.-L.; Sendt, K.; Reimers, J.R. Failure of density-functional theory and time-dependent density-functional theory for large extended π systems. J. Chem. Phys. 2002, 117, 5543–5549. [Google Scholar] [CrossRef]
- Laurent, A.D.; Jacquemin, D. TD-DFT benchmarks: A review. Int. J. Quant. Chem. 2013, 113, 2019–2039. [Google Scholar] [CrossRef]
- Brückner, C.; Engels, B. Benchmarking singlet and triplet excitation energies of molecular semiconductors for singlet fission: Tuning the amount of HF exchange and adjusting local correlation to obtain accurate functionals for singlet–triplet gaps. Chem. Phys. 2017, 482, 319–338. [Google Scholar] [CrossRef]
- Nguyen, K.A.; Kennel, J.; Pachter, R. A density functional theory study of phosphorescence and triplet–triplet absorption for nonlinear absorption chromophores. J. Chem. Phys. 2002, 117, 7128–7136. [Google Scholar] [CrossRef]
- Hendon, C.H.; Tiana, D.; Murray, A.T.; Carbery, D.R.; Walsh, A. Helical frontier orbitals of conjugated linear molecules. Chem. Sci. 2013, 4, 4278. [Google Scholar] [CrossRef]
- Balakrishnan, A.; Vijayakumar, S. Highly delocalised molecular orbitals in boron-, carbon- and nitrogen-based linear chains: A DFT study. Mol. Phys. 2022, 120, e2020923. [Google Scholar] [CrossRef]
- Milani, A.; Tommasini, M.; Russo, V.; Li Bassi, A.; Lucotti, A.; Cataldo, F.; Casari, C.S. Raman spectroscopy as a tool to investigate the structure and electronic properties of carbon-atom wires. Beilstein J. Nanotechnol. 2015, 6, 480–491. [Google Scholar] [CrossRef] [PubMed]
- Yang, S.; Kertesz, M. Bond length alternation and energy band gap of polyyne. J. Phys. Chem. A 2006, 110, 9771–9774. [Google Scholar] [CrossRef] [PubMed]
- McCarthy, M.C.; Levine, E.S.; Apponi, A.J.; Thaddeus, P. Experimental Structures of the Carbon Chains HC7N, HC9N, and HC11N by Isotopic Substitution. J. Mol. Spectrosc. 2000, 203, 75–81. [Google Scholar] [CrossRef] [PubMed]
- Sadlej-Sosnowska, N.; Ocios-Bębenek, A.; Dobrowolski, J.C.; Boczar, D. Geometrical, electrical, and energetic parameters of hetero-disubstituted cumulenes and polyynes in the presence and absence of the external electric field. Struct. Chem. 2021, 33, 479–490. [Google Scholar] [CrossRef]
- Jacquemin, D.; Adamo, C. Bond Length Alternation of Conjugated Oligomers: Wave Function and DFT Benchmarks. J. Chem. Theory Comput. 2011, 7, 369–376. [Google Scholar] [CrossRef] [PubMed]
- Zang, Y.; Fu, T.; Zou, Q.; Ng, F.; Li, H.; Steigerwald, M.L.; Nuckolls, C.; Venkataraman, L. Cumulene Wires Display Increasing Conductance with Increasing Length. Nano Lett. 2020, 20, 8415–8419. [Google Scholar] [CrossRef]
- Yildizhan, M.M.; Fazzi, D.; Milani, A.; Brambilla, L.; Del Zoppo, M.; Chalifoux, W.A.; Tykwinski, R.R.; Zerbi, G. Photogenerated cumulenic structure of adamantyl endcapped linear carbon chains: An experimental and computational investigation based on infrared spectroscopy. J. Chem. Phys. 2011, 134, 124512. [Google Scholar] [CrossRef]
- Schermann, G.; Grösser, T.; Hampel, F.; Hirsch, A. Dicyanopolyynes: A Homologuous Series of End-Capped Linear sp Carbon. Chem. Eur. J. 1997, 3, 1105–1112. [Google Scholar] [CrossRef]
- Kołos, R. Carbon chain extension processes in cryogenic environments: UV-assisted growth of polyynic nitriles in solidified rare gases. Low Temp. Phys. 2019, 45, 583–589. [Google Scholar] [CrossRef]
- Frisch, M.J.; Trucks, G.W.; Schlegel, H.B.; Scuseria, G.E.; Robb, M.A.; Cheeseman, J.R.; Scalmani, G.; Barone, V.; Mennucci, B.; Petersson, G.A.; et al. Gaussian 09; Gaussian, Inc.: Wallingford, CT, USA, 2009. [Google Scholar]
- Frisch, M.J.; Trucks, G.W.; Schlegel, H.B.; Scuseria, G.E.; Robb, M.A.; Cheeseman, J.R.; Scalmani, G.; Barone, V.; Petersson, G.A.; Nakatsuji, H.; et al. Gaussian 16; Gaussian, Inc.: Wallingford, CT, USA, 2016. [Google Scholar]
- Bauernschmitt, R.; Ahlrichs, R. Treatment of Electronic Excitations within the Adiabatic Approximation of Time Dependent Density Functional Theory. Chem. Phys. Lett. 1996, 256, 454–464. [Google Scholar] [CrossRef]
- Casida, M.E.; Jamorski, C.; Casida, K.C.; Salahub, D.R. Molecular Excitation Energies to High-Lying Bound States from Time-Dependent Density-Functional Response Theory: Characterization and Correction of the Time-Dependent Local Density Approximation Ionization Threshold. J. Chem. Phys. 1998, 108, 4439. [Google Scholar] [CrossRef]
- Stratmann, R.E.; Scuseria, G.E.; Frisch, M.J. An Efficient Implementation of Time-Dependent Density-Functional Theory for the Calculation of Excitation Energies of Large Molecules. J. Chem. Phys. 1998, 109, 8218. [Google Scholar] [CrossRef]
- Liu, J.; Liang, W. Analytical approach for the excited-state Hessian in time-dependent density functional theory: Formalism, implementation, and performance. J. Chem. Phys. 2011, 135, 184111. [Google Scholar] [CrossRef]
- Pulay, P. ImprovedSCF convergence acceleration. J. Comput. Chem. 1982, 3, 556–560. [Google Scholar] [CrossRef]
- Kudin, K.N.; Scuseria, G.E.; Cancès, E. A black-box self-consistent field convergence algorithm: One step closer. J. Chem. Phys. 2002, 116, 8255. [Google Scholar] [CrossRef]
- Bacskay, G.B. A quadratically convergent Hartree—Fock (QC-SCF) method. Application to closed shell systems. Chem. Phys. 1981, 61, 385–404. [Google Scholar] [CrossRef]
- Becke, A.D. Density-Functional Thermochemistry. III. The Role of Exact Exchange. J. Chem. Phys. 1993, 98, 5648–5652. [Google Scholar] [CrossRef]
- Lee, C.; Yang, W.; Parr, R.G. Development of the Colle-Salvetti correlation-energy formula into a functional of the electron density. Phys. Rev. B Condens. Matter 1988, 37, 785–789. [Google Scholar] [CrossRef]
- Perdew, J.P.; Burke, K.; Wang, Y. Generalized Gradient Approximation for the Exchange-Correlation Hole of a Many-Electron System. Phys. Rev. B 1996, 54, 16533–16539. [Google Scholar] [CrossRef]
- Perdew, J.P. Density-functional approximation for the correlation energy of the inhomogeneous electron gas. Phys. Rev. B Condens. Matter 1986, 33, 8822–8824. [Google Scholar] [CrossRef]
- Becke, A.D. Density-functional thermochemistry. IV. A new dynamical correlation functional and implications for exact-exchange mixing. J. Chem. Phys. 1996, 104, 1040–1046. [Google Scholar] [CrossRef]
- Becke, A.D. Density-functional thermochemistry. V. Systematic optimization of exchange-correlation functionals. J. Chem. Phys. 1997, 107, 8554–8560. [Google Scholar] [CrossRef]
- Schmider, H.L.; Becke, A.D. Optimized density functionals from the extended G2 test set. J. Chem. Phys. 1998, 108, 9624–9631. [Google Scholar] [CrossRef]
- Hamprecht, F.A.; Cohen, A.J.; Tozer, D.J.; Handy, N.C. Development and assessment of new exchange-correlation functionals. J. Chem. Phys. 1998, 109, 6264–6271. [Google Scholar] [CrossRef]
- Wilson, P.J.; Bradley, T.J.; Tozer, D.J. Hybrid exchange-correlation functional determined from thermochemical data and ab initio potentials. J. Chem. Phys. 2001, 115, 9233–9242. [Google Scholar] [CrossRef]
- Zhao, Y.; Truhlar, D.G. The M06 suite of density functionals for main group thermochemistry, thermochemical kinetics, noncovalent interactions, excited states, and transition elements: Two new functionals and systematic testing of four M06-class functionals and 12 other functionals. Theor. Chem. Acc. 2007, 120, 215–241. [Google Scholar] [CrossRef]
- Kohn, W.; Sham, L.J. Self-Consistent Equations Including Exchange and Correlation Effects. Phys. Rev. 1965, 140, A1133–A1138. [Google Scholar] [CrossRef]
- Vosko, S.H.; Wilk, L.; Nusair, M. Accurate spin-dependent electron liquid correlation energies for local spin density calculations: A critical analysis. Can. J. Phys. 1980, 58, 1200–1211. [Google Scholar] [CrossRef]
- Boese, A.D.; Handy, N.C. New exchange-correlation density functionals: The role of the kinetic-energy density. J. Chem. Phys. 2002, 116, 9559–9569. [Google Scholar] [CrossRef]
- Boese, A.D.; Martin, J.M. Development of density functionals for thermochemical kinetics. J. Chem. Phys. 2004, 121, 3405–3416. [Google Scholar] [CrossRef] [PubMed]
- Van Voorhis, T.; Scuseria, G.E. A novel form for the exchange-correlation energy functional. J. Chem. Phys. 1998, 109, 400–410. [Google Scholar] [CrossRef]
- Yanai, T.; Tew, D.P.; Handy, N.C. A New Hybrid Exchange–Correlation Functional Using the Coulomb-Attenuating Method (Cam-B3lyp). Chem. Phys. Lett. 2004, 393, 51–57. [Google Scholar] [CrossRef]
- Chai, J.D.; Head-Gordon, M. Systematic optimization of long-range corrected hybrid density functionals. J. Chem. Phys. 2008, 128, 084106. [Google Scholar] [CrossRef]
- Grimme, S. Semiempirical GGA-type density functional constructed with a long-range dispersion correction. J. Comput. Chem. 2006, 27, 1787–1799. [Google Scholar] [CrossRef]
- Chai, J.D.; Head-Gordon, M. Long-range corrected hybrid density functionals with damped atom-atom dispersion corrections. Phys. Chem. Chem. Phys. 2008, 10, 6615–6620. [Google Scholar] [CrossRef]
- Dunning, T.H. Gaussian Basis Sets for Use in Correlated Molecular Calculations. I. The Atoms Boron through Neon and Hydrogen. J. Chem. Phys. 1989, 90, 1007. [Google Scholar] [CrossRef]
- Kendall, R.A.; Dunning, T.H.; Harrison, R.J. Electron Affinities of the First-Row Atoms Revisited. Systematic Basis Sets and Wave Functions. J. Chem. Phys. 1992, 96, 6796. [Google Scholar] [CrossRef]
- Weigend, F.; Ahlrichs, R. Balanced basis sets of split valence, triple zeta valence and quadruple zeta valence quality for H to Rn: Design and assessment of accuracy. Phys. Chem. Chem. Phys. 2005, 7, 3297–3305. [Google Scholar] [CrossRef]
- Rappoport, D.; Furche, F. Property-optimized gaussian basis sets for molecular response calculations. J. Chem. Phys. 2010, 133, 134105. [Google Scholar] [CrossRef]
- Schuchardt, K.L.; Didier, B.T.; Elsethagen, T.; Sun, L.; Gurumoorthi, V.; Chase, J.; Li, J.; Windus, T.L. Basis set exchange: A community database for computational sciences. J. Chem. Inf. Model. 2007, 47, 1045–1052. [Google Scholar] [CrossRef]
- Feller, D. The role of databases in support of computational chemistry calculations. J. Comput. Chem. 1996, 17, 1571–1586. [Google Scholar] [CrossRef]
- Pritchard, B.P.; Altarawy, D.; Didier, B.; Gibson, T.D.; Windus, T.L. New Basis Set Exchange: An Open, Up-to-Date Resource for the Molecular Sciences Community. J. Chem. Inf. Model. 2019, 59, 4814–4820. [Google Scholar] [CrossRef]

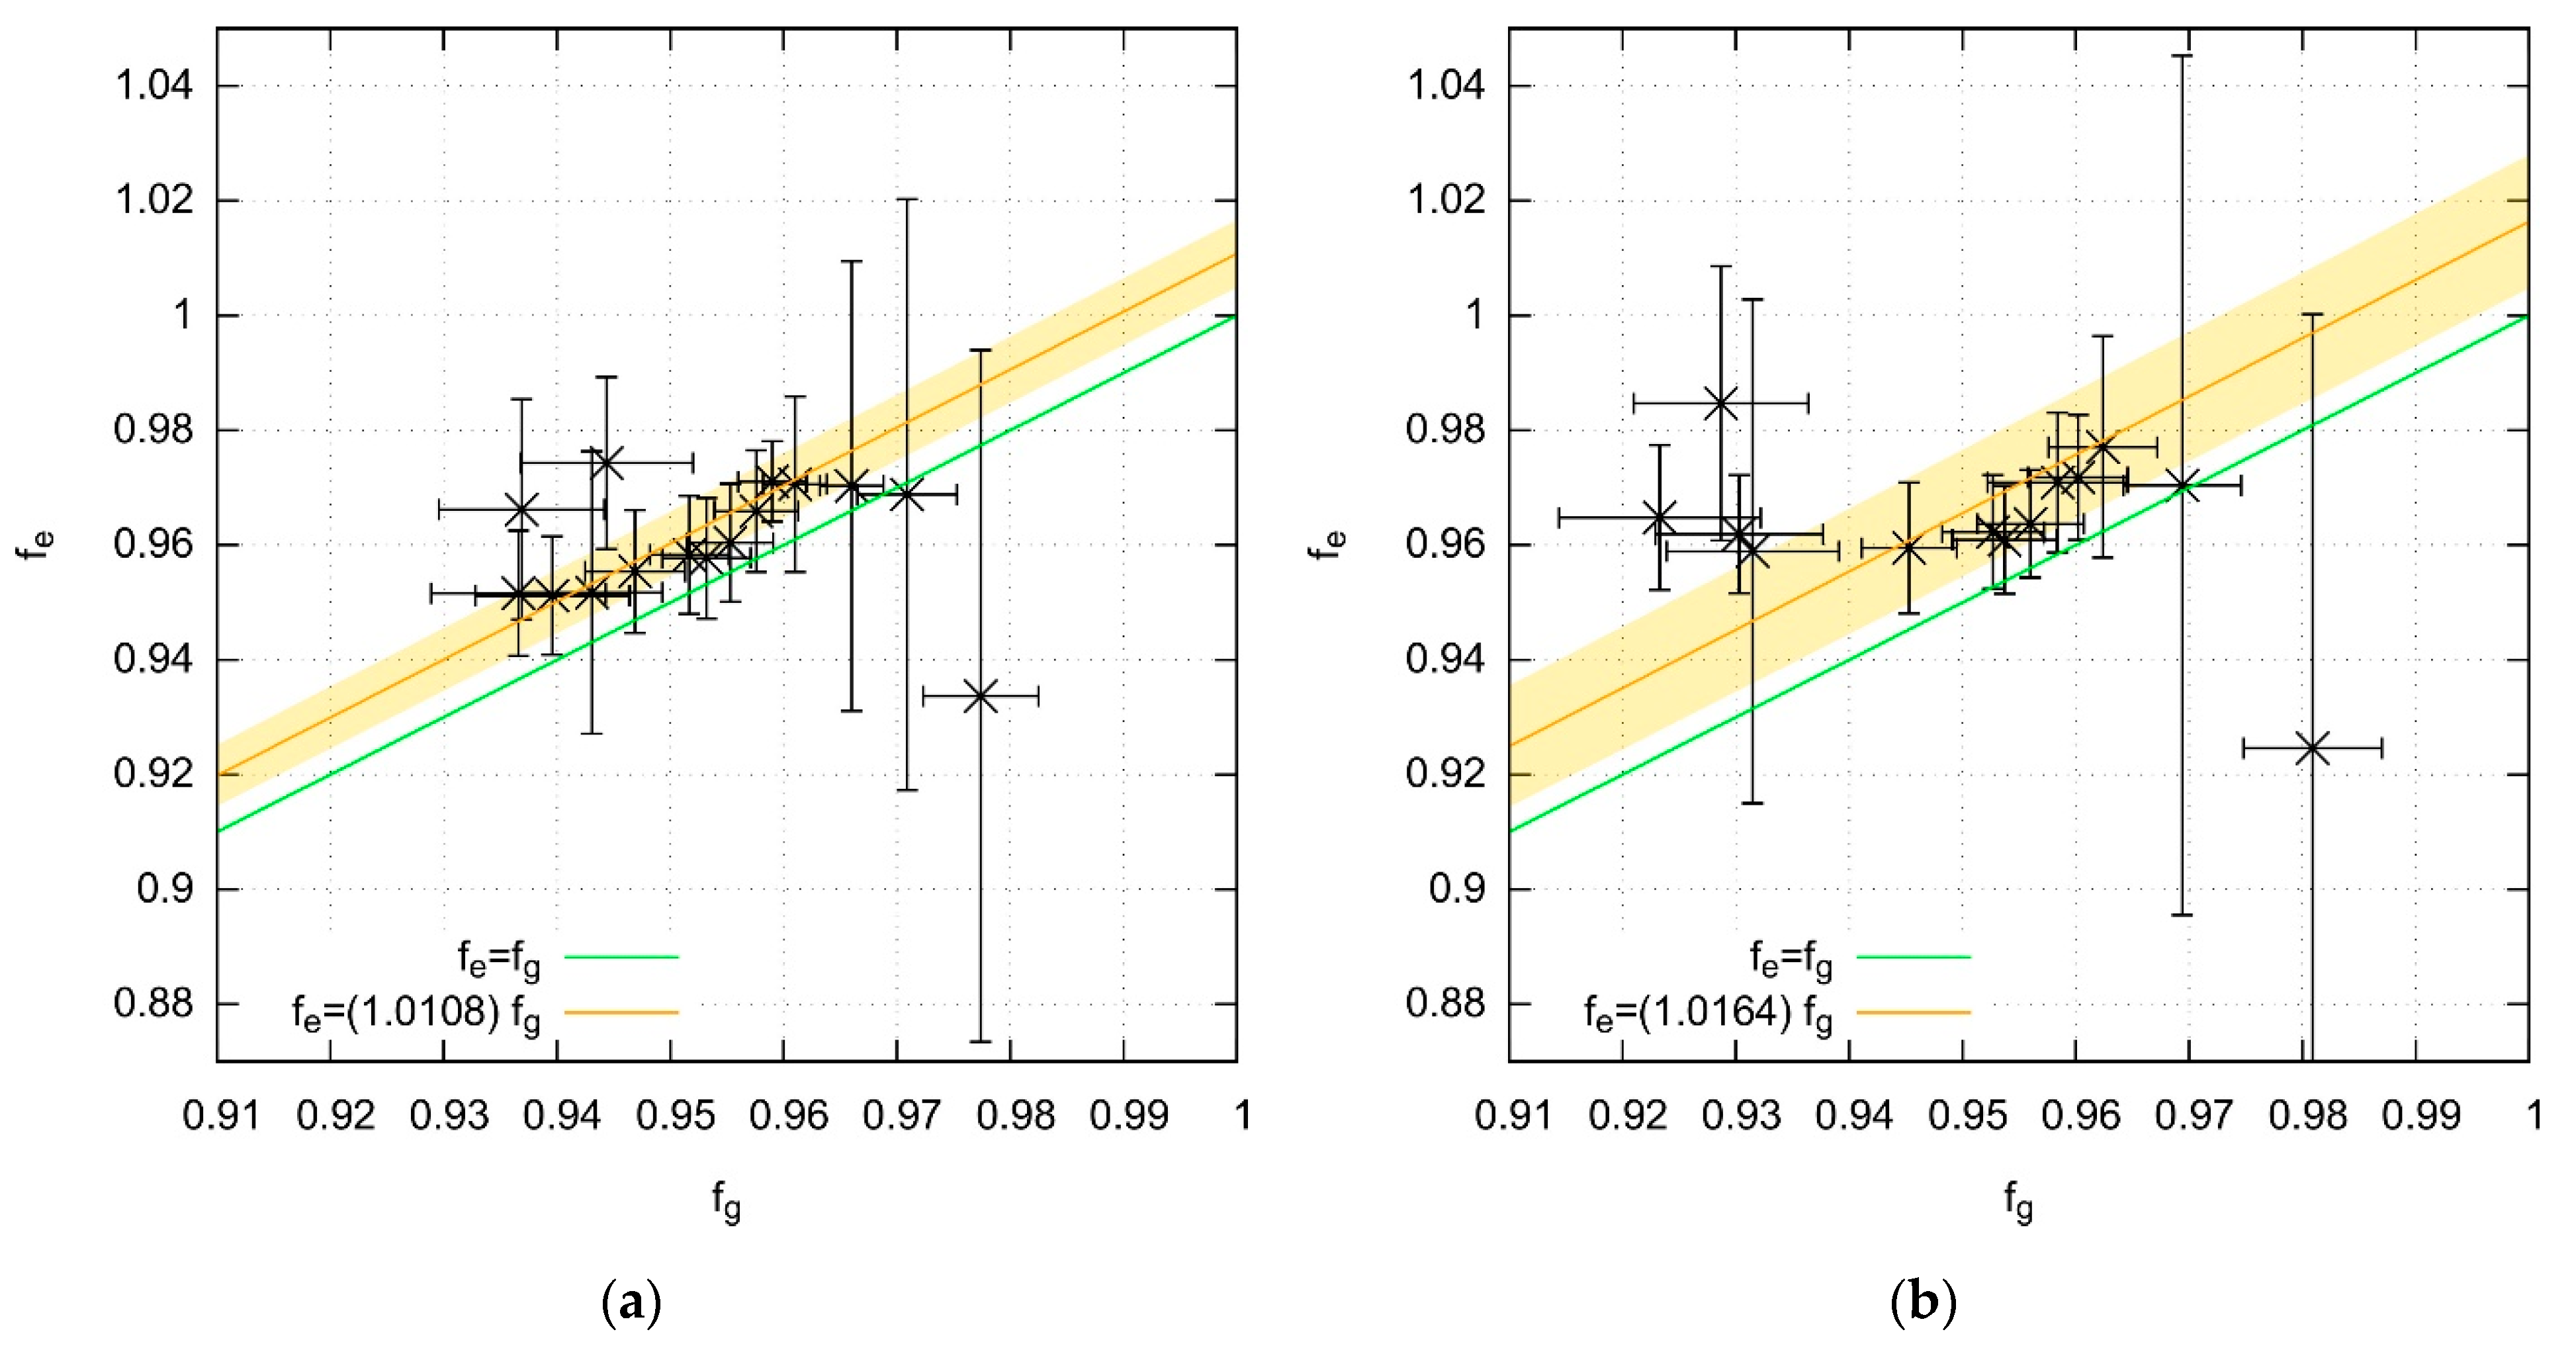
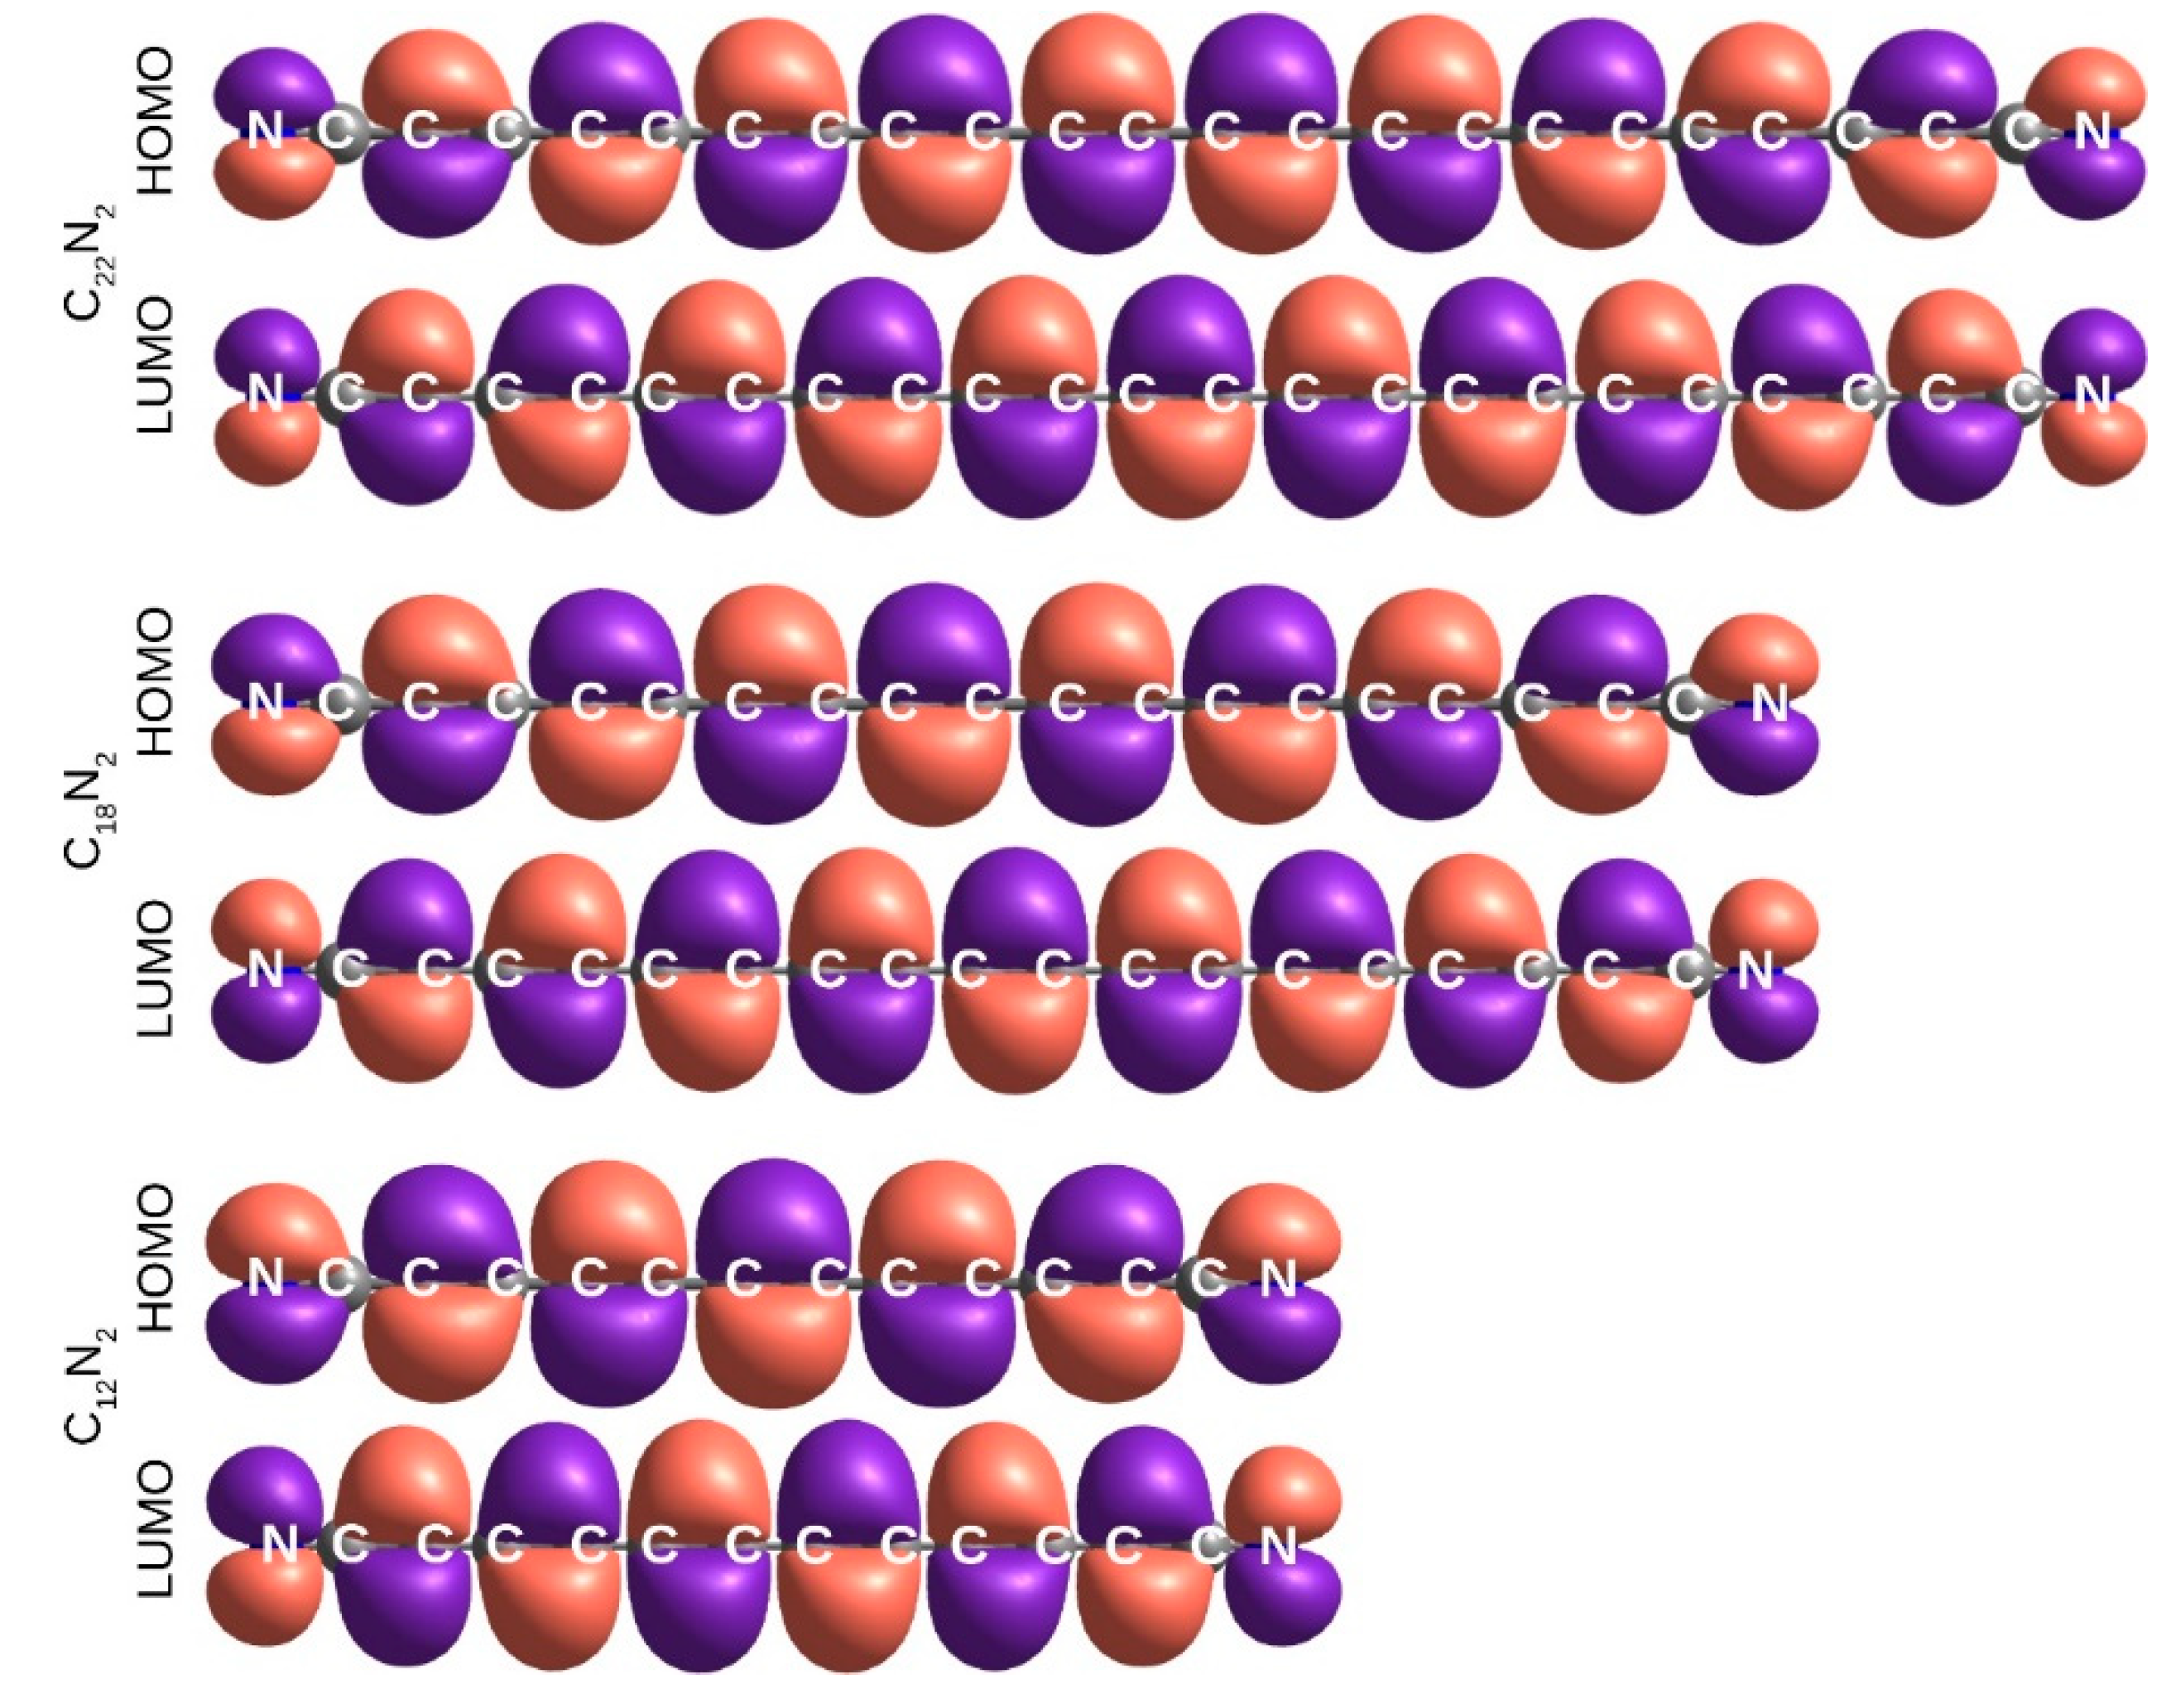
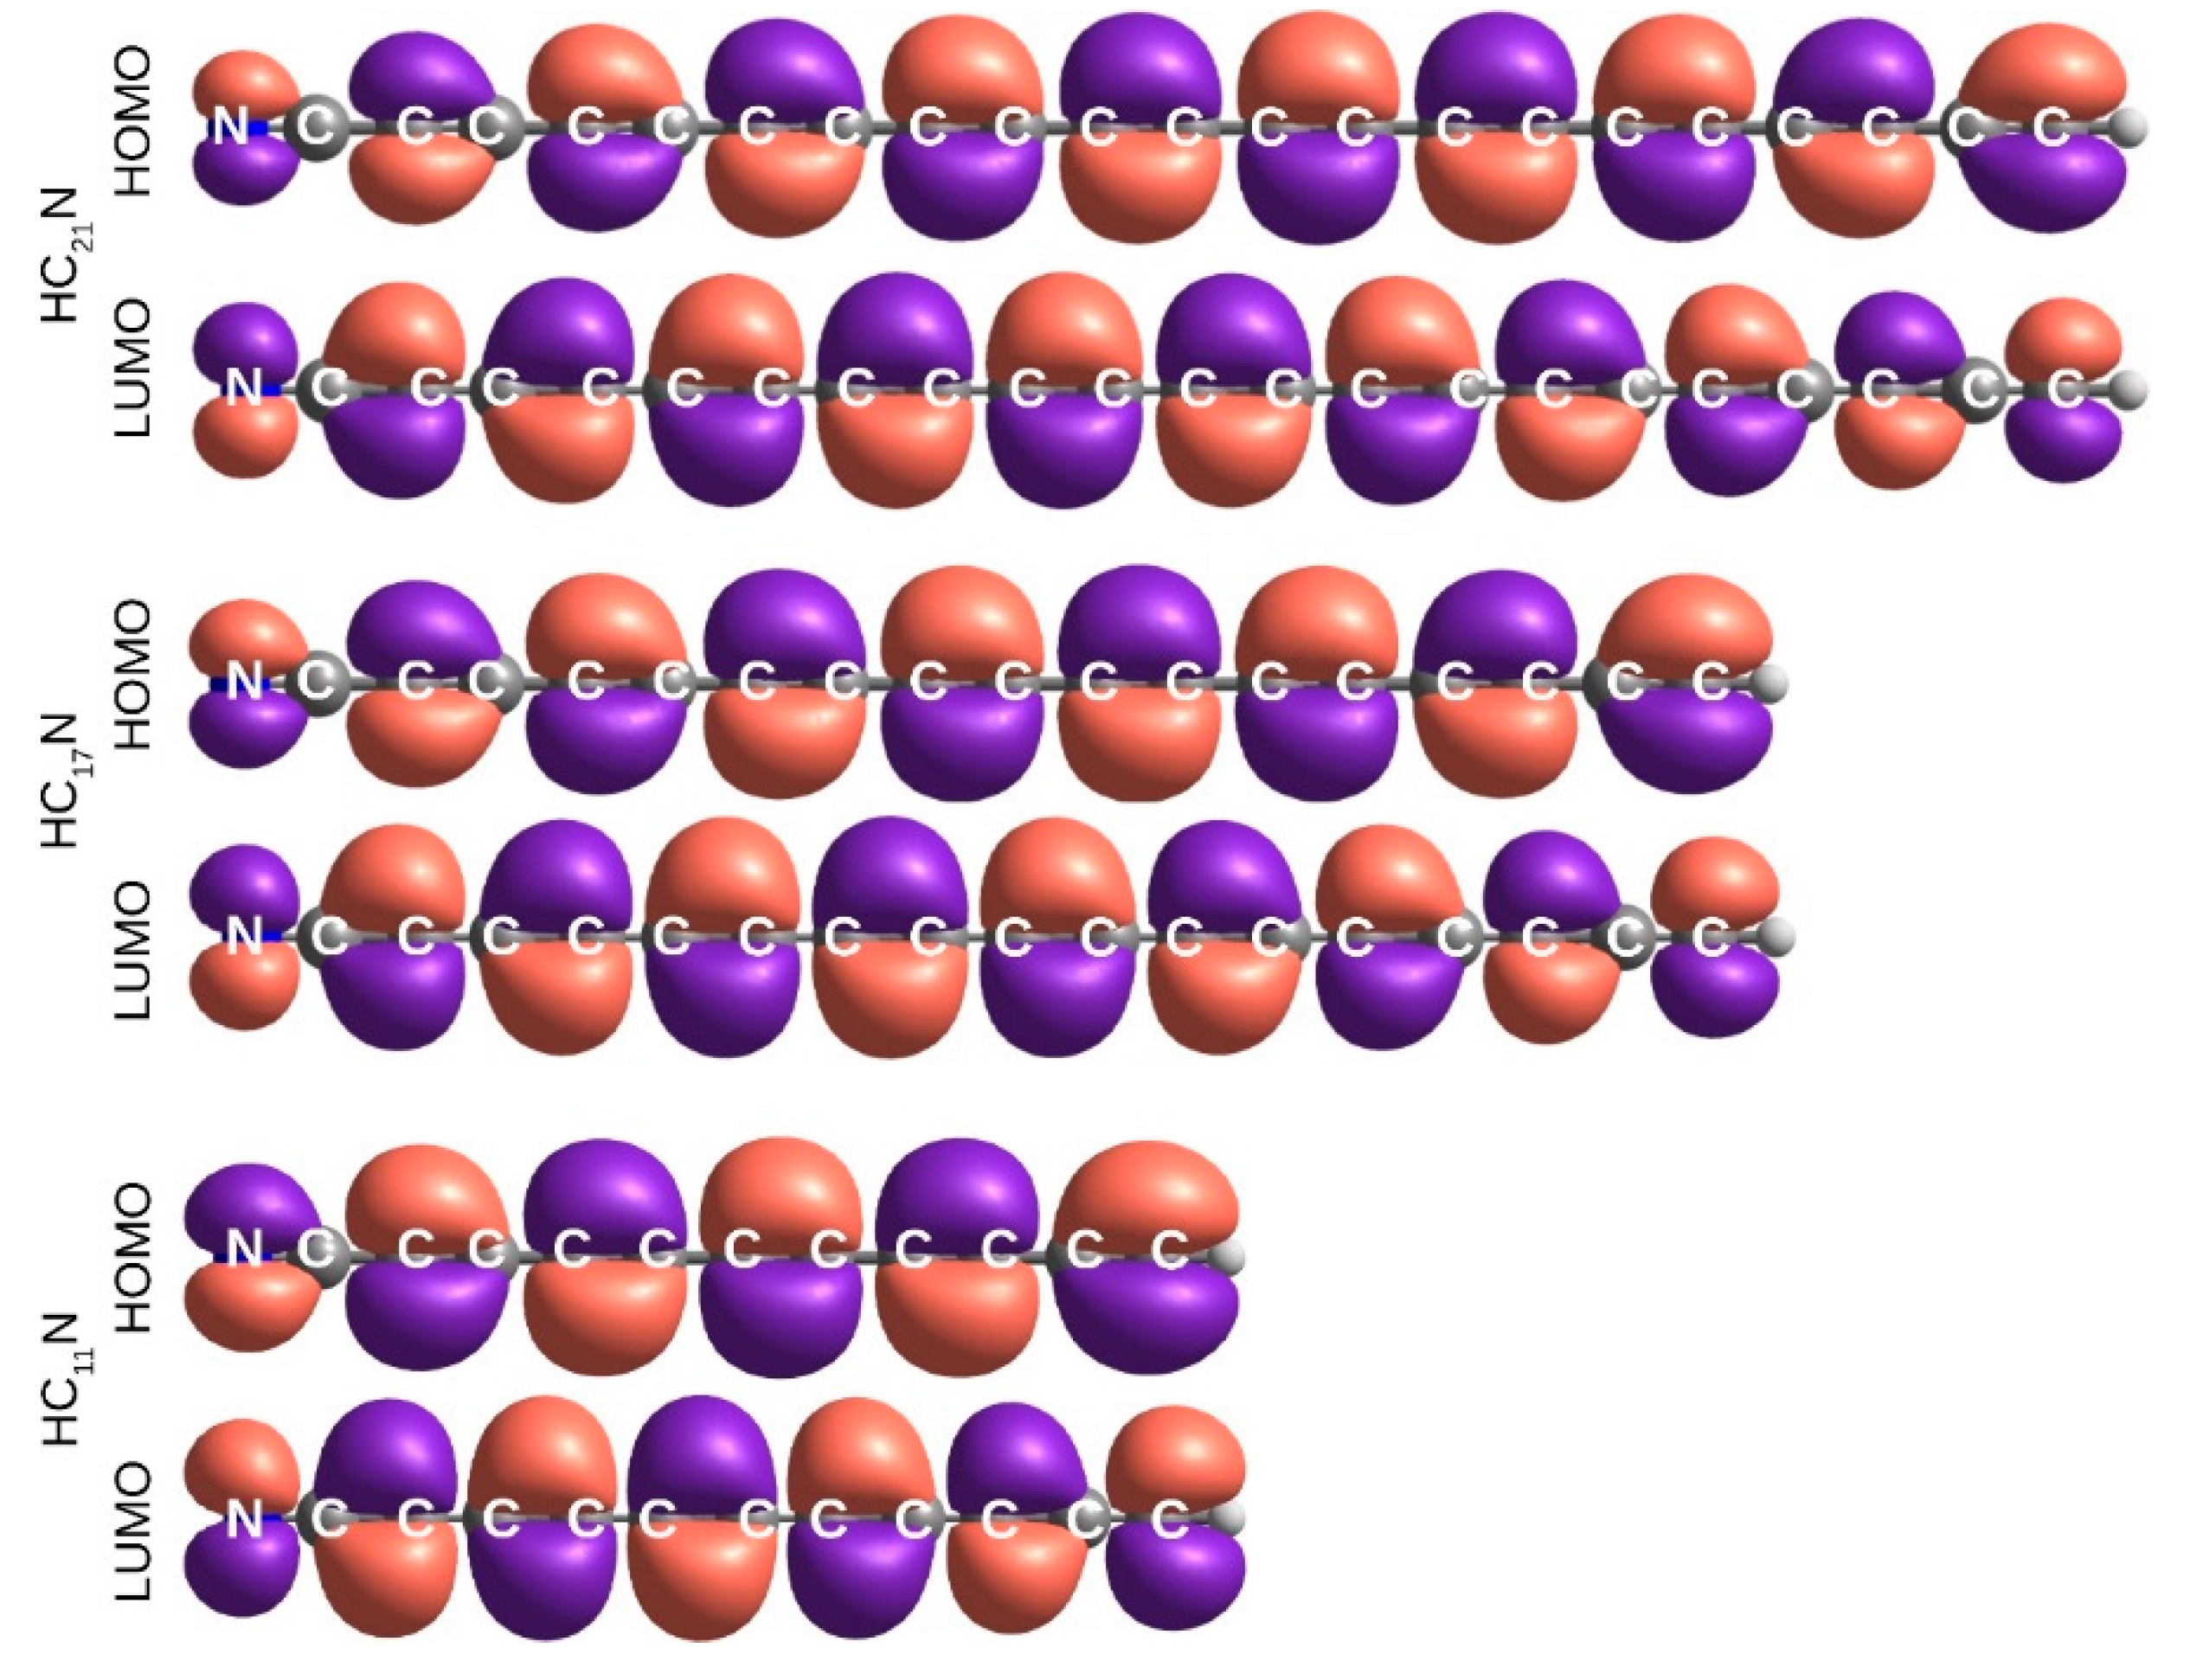

| aug-cc-pVDZ | aug-cc-pVTZ | def2SVPD | def2TZVPD | def2QZVPD | |
|---|---|---|---|---|---|
| tHCTHhyb | −16.1 | −14.28 | −14.87 | −14.28 | −14.13 |
| VSXC | −14.53 | −13.22 | −13.62 | −13.41 | −13.04 |
| BMK | −14.93 | −12.16 | −13.71 | −12.53 | −11.88 |
| B1B95 | −14.64 | −12.73 | −13.19 | −12.96 | −12.9 |
| B3P86 | −14.79 | −12.98 | −13.63 | −13 | −12.91 |
| B98 | −15.98 | −14.03 | −14.76 | −14.08 | −13.92 |
| B971 | −16.01 | −14.13 | −14.81 | −14.17 | −14.03 |
| B972 | −14.61 | −12.98 | −13.43 | −12.97 | −12.88 |
| wB97X | −11.7 | −9.91 | −10.52 | −9.97 | −9.83 |
| wB97XD | −13.19 | −11.29 | −11.97 | −11.37 | −11.16 |
| CAM-B3LYP | −13.14 | −11.17 | −11.9 | −11.19 | −11.04 |
| M062X | −16.13 | −14.36 | −14.99 | −14.02 | −14.06 |
| SVWN | −15.57 | −13.55 | −14.4 | −14.16 | - |
| B3PW91 | −14.83 | −13.07 | −13.67 | −13.08 | −12.98 |
| B3LYP | −15.78 | −13.43 | −14.59 | −13.9 | −13.81 |
| aug-cc-pVDZ | aug-cc-pVTZ | def2SVPD | def2TZVPD | def2QZVPD | |
|---|---|---|---|---|---|
| tHCTHhyb | −17.0 | −15.4 | −16.3 | −15.5 | −14.9 |
| VSXC | −16.8 | −16.4 | −16.5 | −16.5 | - |
| BMK | −12.6 | −10.6 | −12.0 | −10.5 | - |
| B1B95 | −14.0 | −12.6 | −13.2 | −12.6 | −12.8 |
| B3P86 | −15.3 | −13.7 | −14.6 | −13.8 | −13.5 |
| B98 | −16.2 | −14.4 | −15.5 | −14.6 | −14.2 |
| B971 | −16.3 | −14.5 | −15.6 | −14.9 | −14.3 |
| B972 | −14.9 | −13.5 | −14.3 | −13.6 | −13.3 |
| wB97X | −8.5 | −6.9 | −7.9 | −7.3 | −7.9 |
| wB97XD | −11.3 | −9.6 | −10.6 | −9.8 | −10.1 |
| CAM-B3LYP | −11.4 | −9.5 | −10.5 | −9.6 | −10.0 |
| M062X | −10.8 | −9.5 | −10.3 | −9.1 | −11.2 |
| SVWN | −18.3 | −17.1 | −17.6 | −17.7 | - |
| B3PW91 | −15.2 | −13.7 | −14.6 | −13.8 | - |
| B3LYP | −16.1 | −14.0 | −15.4 | −14.5 | −14.2 |
| aug-cc-pVDZ | aug-cc-pVTZ | def2SVPD | def2TZVPD | |
|---|---|---|---|---|
| tHCTHhyb | −7.77 | −2.76 | −4.31 | −4.52 |
| VSXC | −12.81 | - | −13.44 | −14.51 |
| BMK | 4.41 | 10.04 | 8.31 | 10.42 |
| B1B95 | -0.37 | 1.12 | 5.42 | 1.96 |
| B3P86 | −6.02 | −5.55 | −3.63 | −5.66 |
| B98 | −1.47 | −1.52 | −3.51 | −5.10 |
| B971 | 0.49 | 0.40 | −0.72 | 0.09 |
| B972 | −2.13 | −3.82 | −5.26 | −1.80 |
| wB97X | 6.96 | 13.48 | 6.79 | 15.5 |
| wB97XD | 6.41 | 8.72 | 6.80 | 6.45 |
| CAM-B3LYP | 5.96 | 4.62 | 4.83 | 6.82 |
| M062X | 16.3 | 16.49 | 16.73 | 18.14 |
| SVWN | −4.84 | −5.41 | −5.52 | −5.56 |
| B3PW91 | −2.84 | −4.77 | −6.14 | −4.42 |
| B3LYP | −3.72 | 0.05 | −3.07 | −3.6 |
| aug-cc-pVTZ | def2-SVPD | def2-TZVPD | ||||||||||||||||
|---|---|---|---|---|---|---|---|---|---|---|---|---|---|---|---|---|---|---|
| tHCTHhyb | 0.97 | 0.039 | 78 | 0.91 | 0.31 | 100 | 0.937 | 0.031 | 80 | 0.753 | 0.086 | 53 | 0.976 | 0.01 | 24 | 1.007 | 0.078 | 26 |
| VSXC | 0.969 | 0.051 | 108 | 0.925 | 0.113 | 39 | 0.946 | 0.024 | 61 | 0.787 | 0.051 | 28 | n/a | n/a | n/a | n/a | n/a | n/a |
| BMK | 0.974 | 0.015 | 26 | n/a | n/a | n/a | 0.92 | 0.038 | 98 | 0.701 | 0.082 | 55 | 0.965 | 0.011 | 29 | 0.937 | 0.072 | 32 |
| B1B95 | 0.955 | 0.011 | 28 | 0.914 | 0.071 | 29 | 0.929 | 0.025 | 65 | 0.77 | 0.082 | 44 | 0.955 | 0.011 | 28 | 0.921 | 0.066 | 30 |
| B3P86 | 0.958 | 0.01 | 28 | 0.921 | 0.067 | 29 | 0.923 | 0.031 | 82 | 0.735 | 0.079 | 49 | 0.957 | 0.011 | 28 | 0.924 | 0.067 | 30 |
| B98 | 0.971 | 0.007 | 17 | 0.979 | 0.054 | 18 | 0.932 | 0.03 | 79 | 0.749 | 0.082 | 50 | 0.968 | 0.01 | 28 | 0.95 | 0.073 | 32 |
| B971 | 0.971 | 0.015 | 30 | 0.938 | 0.113 | 36 | 0.936 | 0.028 | 74 | 0.763 | 0.082 | 48 | 0.972 | 0.008 | 21 | 0.994 | 0.069 | 23 |
| B972 | 0.958 | 0.01 | 27 | 0.925 | 0.068 | 30 | 0.929 | 0.026 | 67 | 0.772 | 0.077 | 45 | 0.958 | 0.01 | 27 | 0.932 | 0.069 | 31 |
| wB97X | 0.952 | 0.011 | 29 | 0.888 | 0.048 | 22 | 0.925 | 0.025 | 66 | 0.765 | 0.061 | 35 | 0.95 | 0.011 | 30 | 0.886 | 0.052 | 25 |
| wB97XD | 0.952 | 0.025 | 66 | 0.885 | 0.175 | 79 | 0.922 | 0.028 | 75 | 0.746 | 0.071 | 43 | 0.956 | 0.007 | 18 | 0.936 | 0.046 | 16 |
| CAM-B3LYP | 0.951 | 0.01 | 27 | 0.892 | 0.049 | 23 | 0.917 | 0.031 | 81 | 0.725 | 0.066 | 40 | 0.949 | 0.011 | 29 | 0.886 | 0.052 | 24 |
| M062X | 0.966 | 0.019 | 50 | 0.883 | 0.055 | 26 | 0.934 | 0.034 | 90 | 0.74 | 0.064 | 38 | 0.965 | 0.019 | 51 | 0.884 | 0.056 | 26 |
| SVWN | 0.934 | 0.06 | 119 | 0.68 | 0.14 | 82 | 0.913 | 0.048 | 125 | 0.658 | 0.097 | 72 | 0.976 | 0.038 | 43 | n/a | n/a | n/a |
| B3PW91 | 0.96 | 0.01 | 27 | 0.925 | 0.066 | 29 | 0.925 | 0.03 | 80 | 0.741 | 0.079 | 49 | 0.96 | 0.011 | 28 | 0.927 | 0.068 | 31 |
| B3LYP | 0.966 | 0.011 | 28 | 0.922 | 0.072 | 29 | 0.93 | 0.031 | 82 | 0.739 | 0.077 | 47 | 0.964 | 0.011 | 28 | 0.926 | 0.067 | 30 |
| aug-cc-pVTZ | def2-SVPD | def2-TZVPD | ||||||||||||||||
|---|---|---|---|---|---|---|---|---|---|---|---|---|---|---|---|---|---|---|
| tHCTHhyb | 0.966 | 0.003 | 13 | 0.939 | 0.023 | 14 | 0.954 | 0.021 | 98 | 0.781 | 0.145 | 109 | 0.966 | 0.002 | 11 | 0.945 | 0.017 | 11 |
| VSXC | 0.971 | 0.004 | 21 | 0.947 | 0.023 | 13 | 0.961 | 0.018 | 84 | 0.82 | 0.139 | 99 | 0.971 | 0.004 | 19 | 0.953 | 0.019 | 11 |
| BMK | 0.944 | 0.008 | 37 | 0.902 | 0.039 | 25 | 0.933 | 0.022 | 106 | 0.75 | 0.14 | 109 | 0.943 | 0.006 | 29 | 0.912 | 0.028 | 18 |
| B1B95 | 0.947 | 0.004 | 21 | 0.905 | 0.025 | 16 | 0.936 | 0.018 | 88 | 0.784 | 0.127 | 96 | 0.947 | 0.004 | 18 | 0.912 | 0.018 | 11 |
| B3P86 | 0.953 | 0.004 | 19 | 0.913 | 0.026 | 17 | 0.942 | 0.021 | 99 | 0.766 | 0.139 | 107 | 0.953 | 0.003 | 16 | 0.919 | 0.02 | 12 |
| B98 | 0.959 | 0.003 | 14 | 0.93 | 0.02 | 13 | 0.948 | 0.02 | 92 | 0.786 | 0.137 | 102 | 0.958 | 0.003 | 12 | 0.934 | 0.017 | 10 |
| B971 | 0.961 | 0.003 | 13 | 0.933 | 0.019 | 12 | 0.95 | 0.019 | 88 | 0.796 | 0.135 | 99 | 0.961 | 0.002 | 11 | 0.937 | 0.016 | 10 |
| B972 | 0.952 | 0.003 | 17 | 0.912 | 0.021 | 13 | 0.941 | 0.018 | 86 | 0.791 | 0.129 | 97 | 0.952 | 0.003 | 13 | 0.921 | 0.012 | 8 |
| wB97X | 0.937 | 0.008 | 37 | 0.881 | 0.031 | 20 | 0.928 | 0.018 | 87 | 0.785 | 0.115 | 87 | 0.937 | 0.007 | 35 | 0.889 | 0.023 | 15 |
| wB97XD | 0.943 | 0.006 | 30 | 0.895 | 0.03 | 20 | 0.934 | 0.02 | 94 | 0.774 | 0.129 | 99 | 0.943 | 0.006 | 27 | 0.905 | 0.02 | 13 |
| CAM-B3LYP | 0.94 | 0.007 | 33 | 0.89 | 0.029 | 19 | 0.93 | 0.019 | 90 | 0.776 | 0.12 | 90 | 0.939 | 0.007 | 32 | 0.893 | 0.025 | 16 |
| M062X | 0.937 | 0.007 | 36 | 0.885 | 0.03 | 20 | 0.927 | 0.018 | 86 | 0.786 | 0.115 | 86 | 0.936 | 0.007 | 33 | 0.893 | 0.021 | 14 |
| SVWN | 0.977 | 0.005 | 24 | 0.947 | 0.038 | 23 | 0.955 | 0.034 | 156 | 0.68 | 0.17 | 153 | 0.976 | 0.006 | 26 | 0.941 | 0.044 | 26 |
| B3PW91 | 0.955 | 0.004 | 18 | 0.915 | 0.025 | 16 | 0.943 | 0.021 | 99 | 0.768 | 0.139 | 107 | 0.955 | 0.003 | 15 | 0.921 | 0.019 | 12 |
| B3LYP | 0.958 | 0.004 | 18 | 0.918 | 0.024 | 15 | 0.947 | 0.019 | 91 | 0.782 | 0.132 | 98 | 0.957 | 0.003 | 16 | 0.921 | 0.021 | 13 |
Publisher’s Note: MDPI stays neutral with regard to jurisdictional claims in published maps and institutional affiliations. |
© 2022 by the authors. Licensee MDPI, Basel, Switzerland. This article is an open access article distributed under the terms and conditions of the Creative Commons Attribution (CC BY) license (https://creativecommons.org/licenses/by/4.0/).
Share and Cite
Gronowski, M.; Kołos, R. A DFT Study on the Excited Electronic States of Cyanopolyynes: Benchmarks and Applications. Molecules 2022, 27, 5829. https://doi.org/10.3390/molecules27185829
Gronowski M, Kołos R. A DFT Study on the Excited Electronic States of Cyanopolyynes: Benchmarks and Applications. Molecules. 2022; 27(18):5829. https://doi.org/10.3390/molecules27185829
Chicago/Turabian StyleGronowski, Marcin, and Robert Kołos. 2022. "A DFT Study on the Excited Electronic States of Cyanopolyynes: Benchmarks and Applications" Molecules 27, no. 18: 5829. https://doi.org/10.3390/molecules27185829
APA StyleGronowski, M., & Kołos, R. (2022). A DFT Study on the Excited Electronic States of Cyanopolyynes: Benchmarks and Applications. Molecules, 27(18), 5829. https://doi.org/10.3390/molecules27185829


