3.2. Temperature and Pressure in Different Shock Directions
The total energy curves of the TNAZ system under different shock wave loading conditions are shown in
Figure S1.
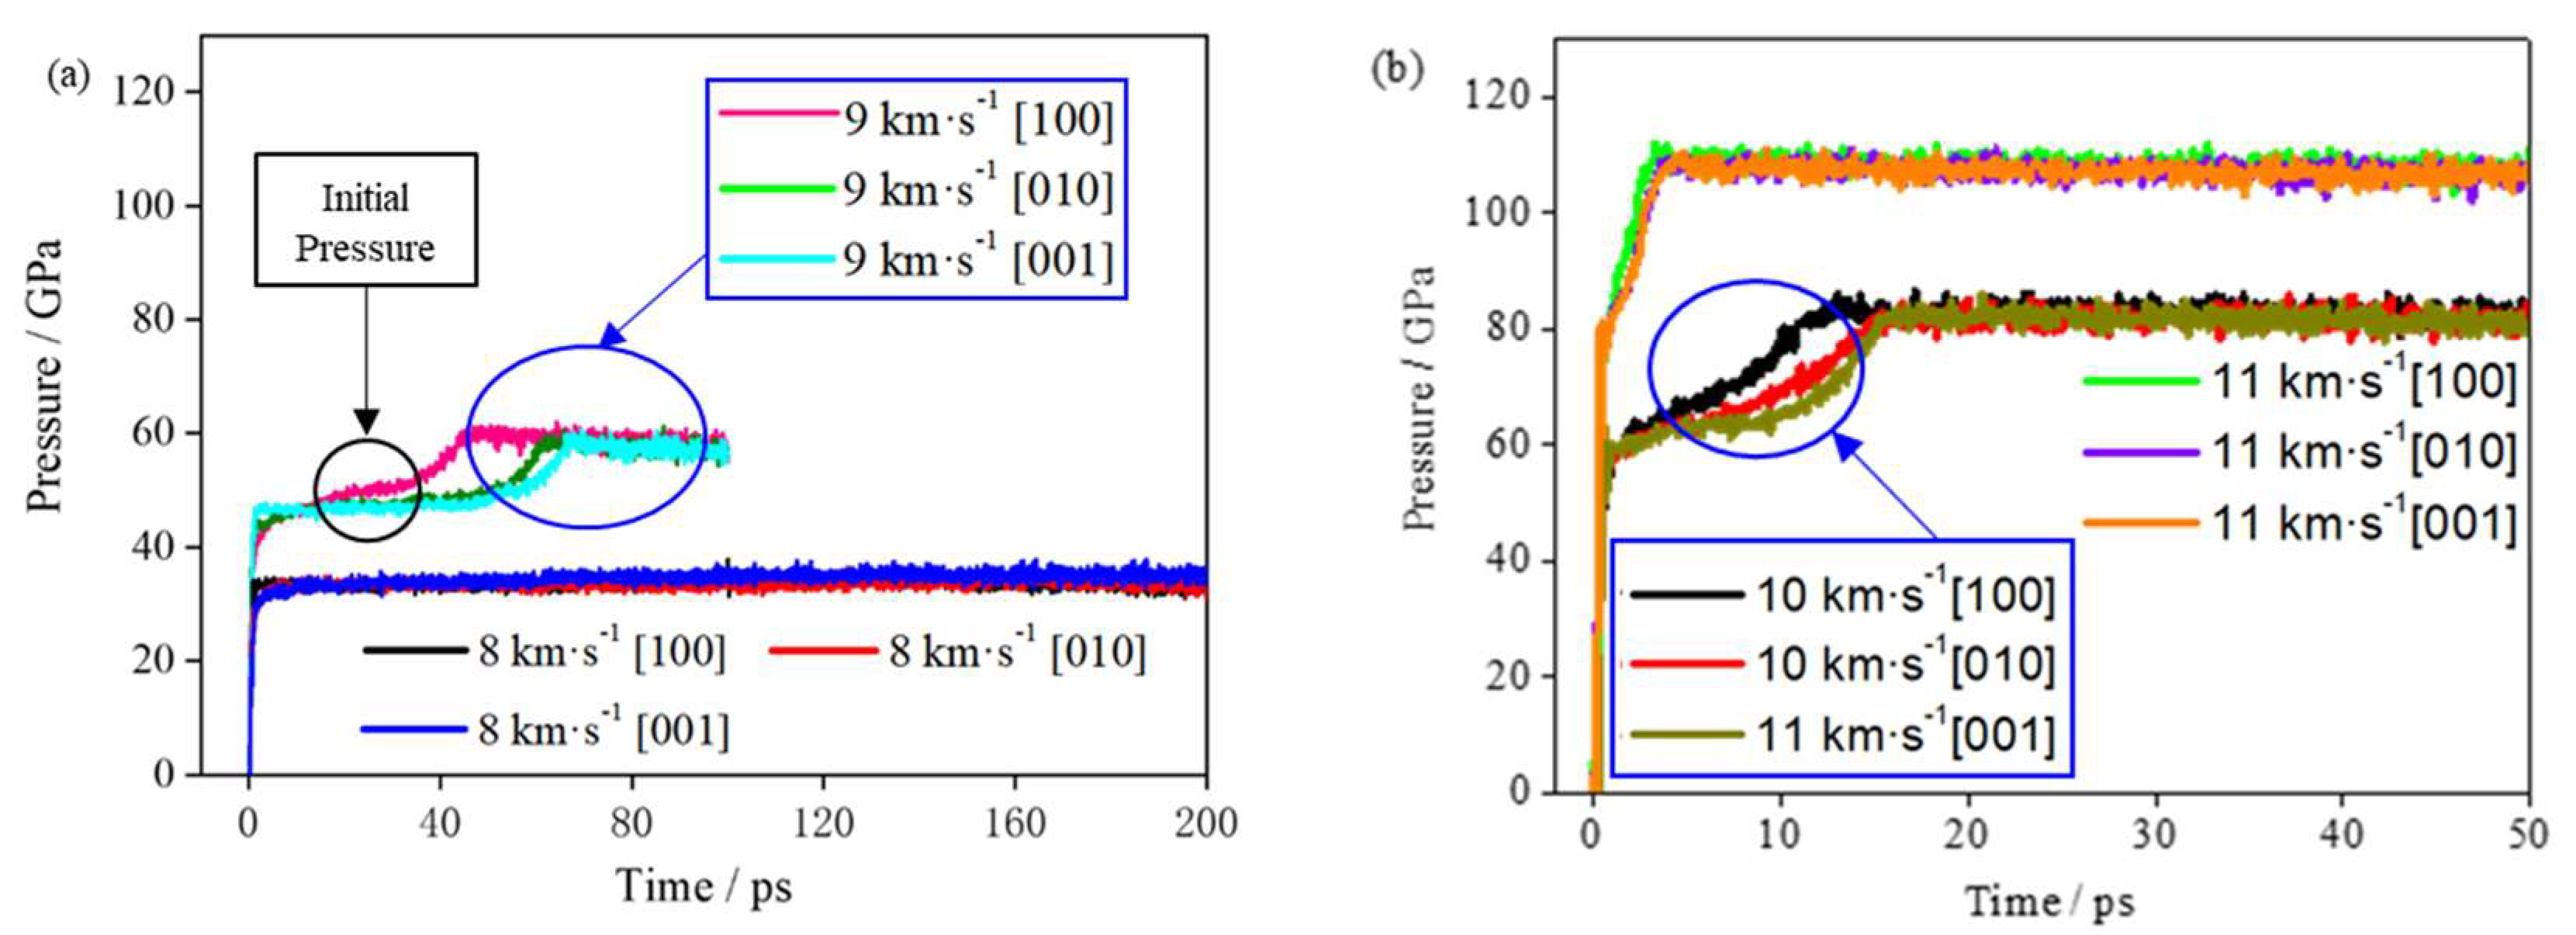
Figure 3 shows the hydrostatic pressure curve of the system with time in different shock velocities. At the initial moment, when the system is subjected to shock compression, the pressure quickly jumps. With a greater shock wave velocity, a larger initial shock wave pressure is generated, and the pressurization time is shorter. Then, the reaction begins to occur, and the pressure further rapidly increases. The rate of the pressure increase and its peak value are related to the shock wave velocity and direction. When the shock wave velocities are identical, the pressures in different loading directions have a similar evolution trend. A greater shock wave velocity corresponds to a greater pressure of the system.
Table S2 shows the initial pressure value, stable pressure value and corresponding time in different directions. The initial pressure in this paper refers to the first peak pressure when the shock wave was applied to the supercell. When the shock velocity is 8 km∙s
−1, the initial shock pressures are 33.55, 33.31 and 33.60 GPa in the [100], [010] and [001] directions, respectively. At a shock velocity of 8 km∙s
−1, the reaction is slow, and the pressure of the TNAZ system does not significantly increase within 150 ps. According to the slope of the curve in
Figure 4, the chemical reaction is divided into the fast chemical reaction and the slow chemical reaction stage. Therefore, no statistical analysis was performed at 8 km∙s
−1. When the shock velocity is greater than or equal to 9 km∙s
−1, the pressure of the TNAZ system obviously increases and reaches a stable value. In
Table S2, when the shock velocity is identical, as the reaction progresses, the rate of pressure increase in the [100] direction is faster than that in the [010] and [001] directions. The rate of chemical reactions in the [100] direction is faster than that in the [010] and [001] directions. This result also indicates that TNAZ has a strong anisotropy in the pressure under shock.
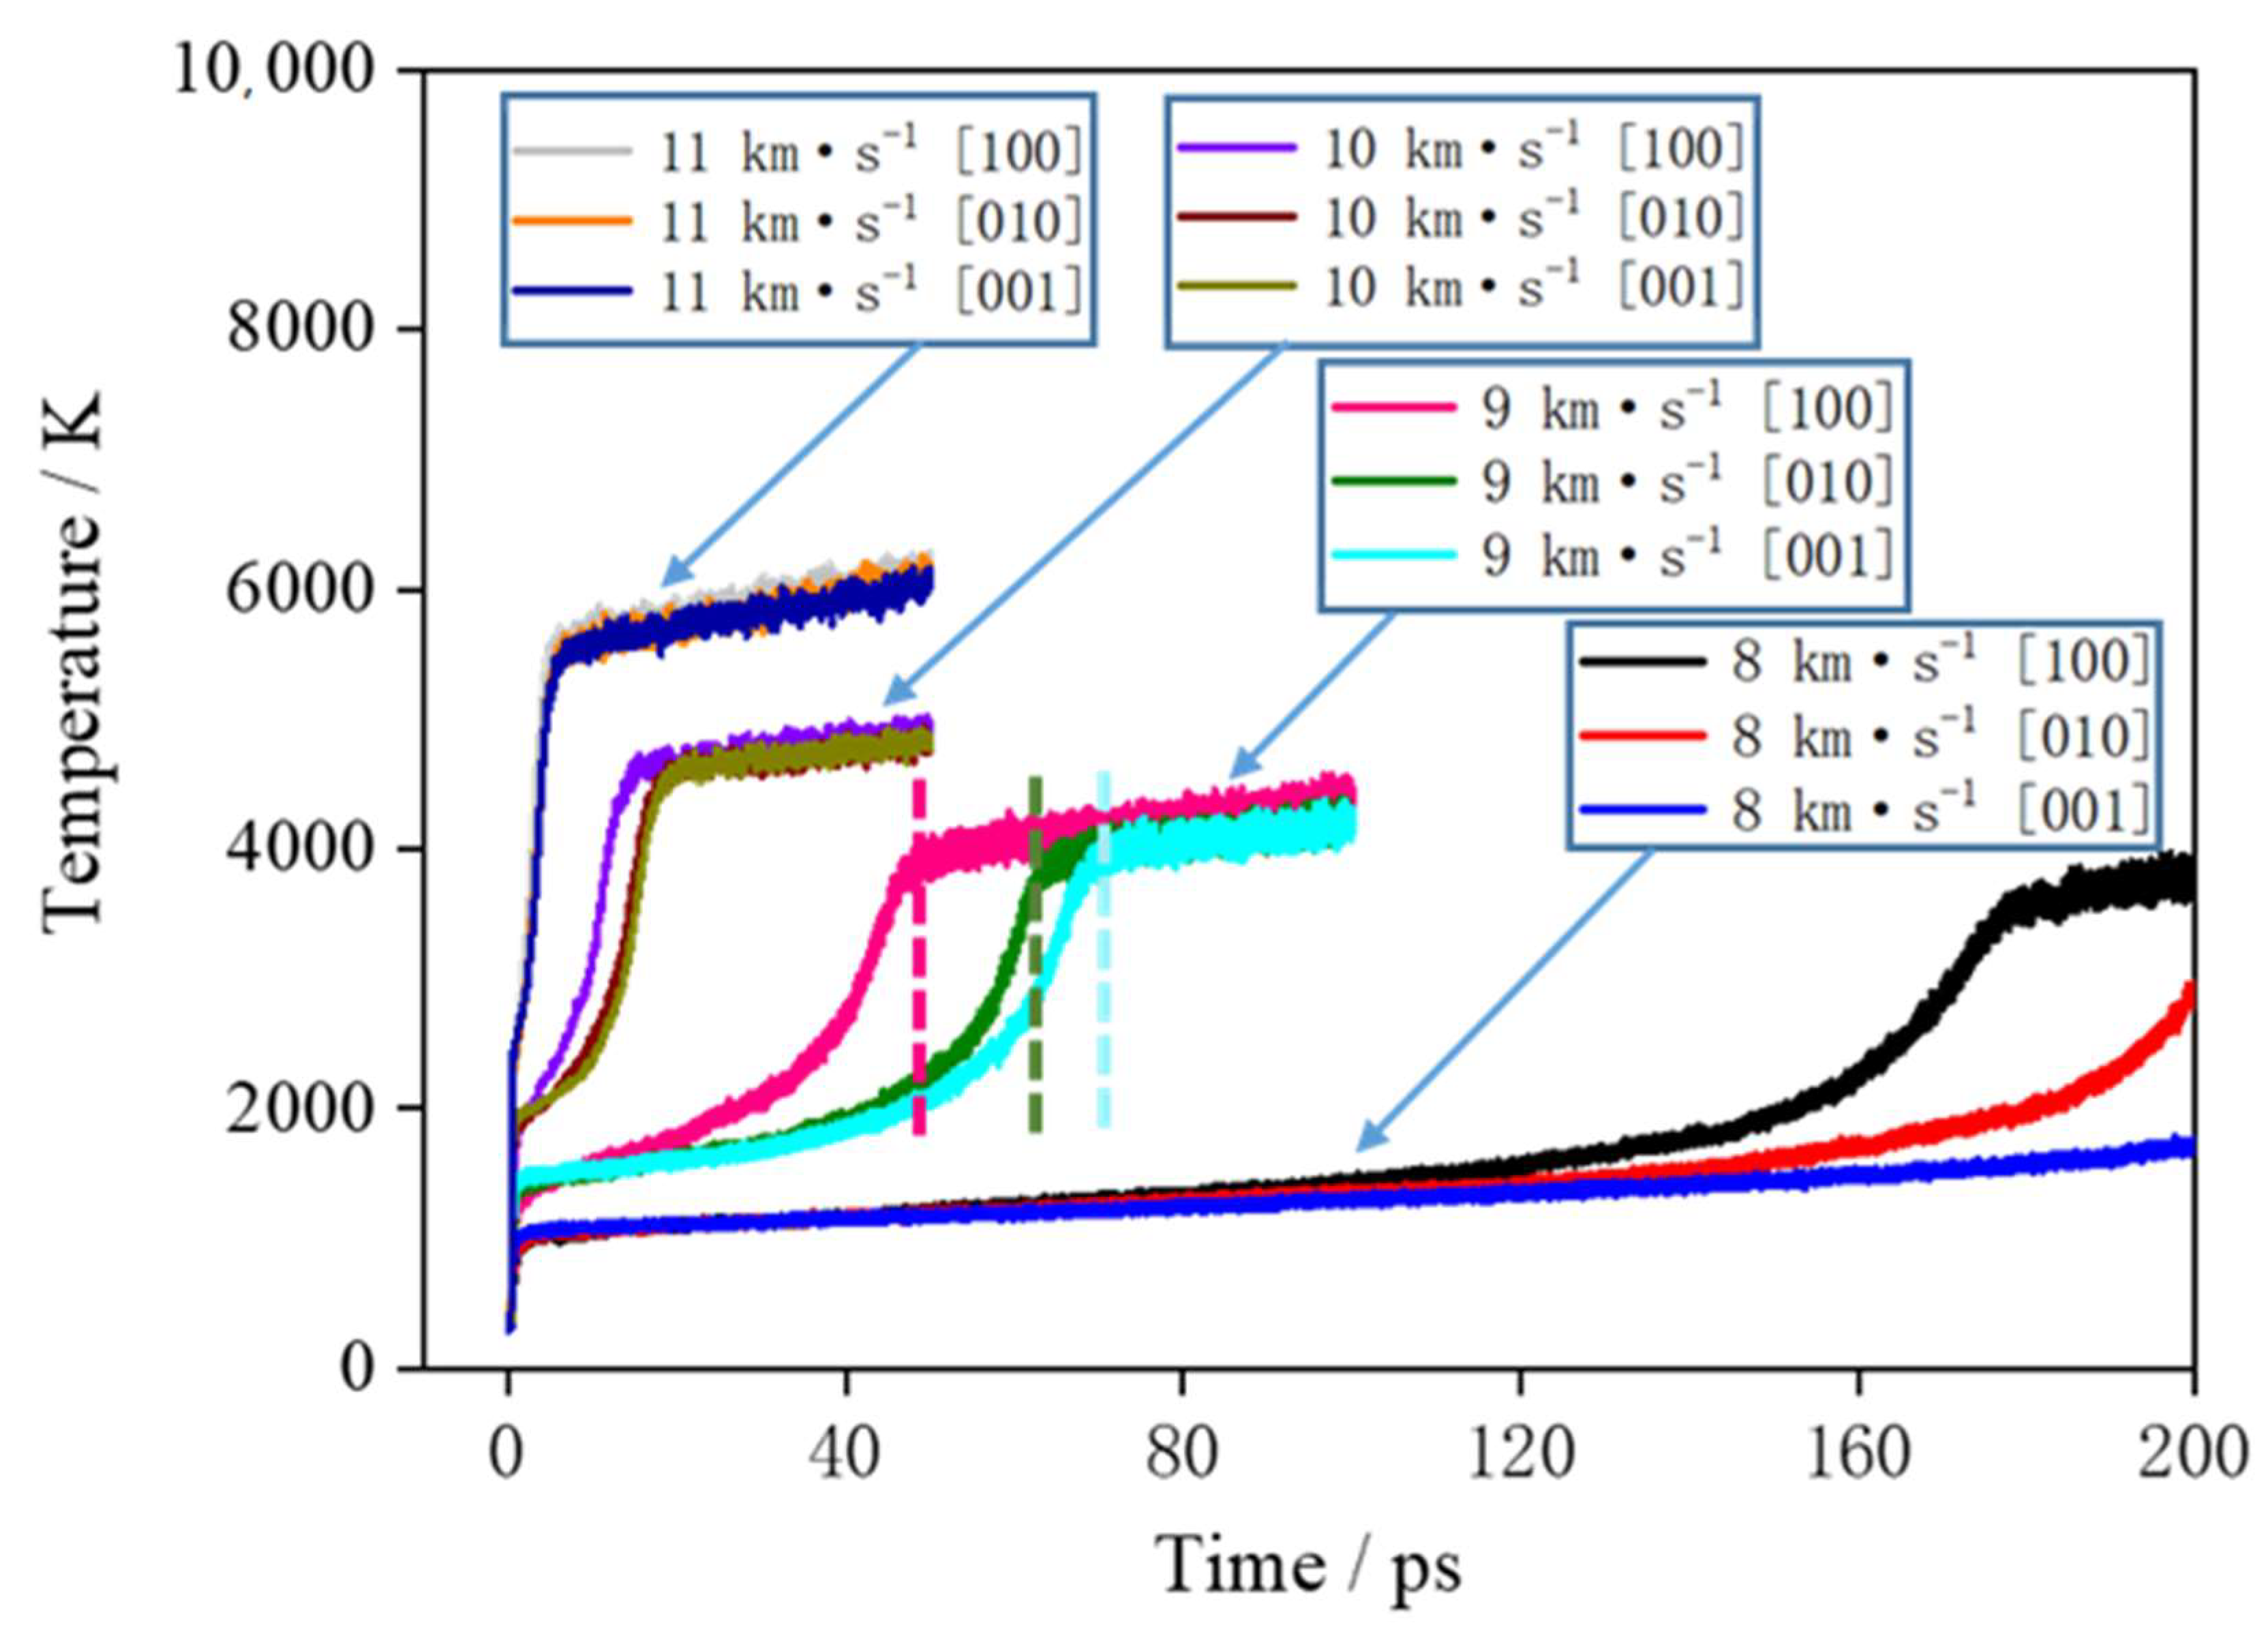
Figure 4 shows the curve of the supercell temperature with time. First, the supercell is subjected to shock compression under shock, and kinetic energy is converted into internal energy. Behind the shock wave front, the temperature of the medium sharply increases; then, rapid chemical reactions occur, which release a large amount of heat. Here, the stage where the temperature rapidly increases is called the rapid chemical reaction stage, and the stage where temperature slowly increases is called the slow reaction stage. When the rapid chemical reactions are completed, there are many clusters in the products, and the clusters continue to decompose and produce the final small-molecule products. There are relatively slow chemical reactions in this process, and the released heat is much less than that released in the rapid chemical reaction stage. When the shock velocity is 8 km∙s
−1, due to the low compression intensity of the shock, the rapid chemical reactions of different directions begin at 130 ps. When the shock velocity is 9 km∙s
−1, the rapid chemical reactions of different directions end in 50–70 ps and enter the slow chemical reaction stage. When the shock velocity is 10 and 11 km∙s
−1, the rapid chemical reactions of different directions are completed in 0–20 ps, and the slow chemical reaction stage begins.
At shock velocities of 8, 9, 10 and 11 km∙s
−1, the temperatures in the [100] direction are 1243, 3987, 4903 and 6106 K at 50 ps, respectively. When the shock velocity is larger, the temperature of the system rises faster, the system starts to react quickly, the reaction rate is larger, and the system enters into the slow chemical reaction stage earlier. From the temperature curves of 9 and 10 km∙s
−1, it can be seen that in the rapid chemical reaction stage, the temperature rise rate of the system in the [100] direction is significantly higher than that of the [010] and [001] directions. It shows that the rate of rapid chemical reaction of TNAZ under the shock loading in the [100] direction is higher than that of the other two directions. When the shock wave velocity is 8 km∙s
−1, due to the low shock pressure, the chemical reaction is slow, and within the calculation time of 200 ps, only a small increase in the temperature of the system occurs in the [100] direction. For the shock wave velocity of 11 km∙s
−1, due to the large shock loading intensity, the explosive completes a rapid chemical reaction in a very short time, and the temperature changes of the system are not significantly different under different shock loading directions. In conclusion, it can be seen from
Figure 3 and
Figure 4 that the TNAZ exhibits obvious anisotropy characteristics for shock wave loading with different directions, and the difference is the most obvious for the velocity of 9 km∙s
−1.
3.3. Study on the Causes of TNAZ Anisotropy
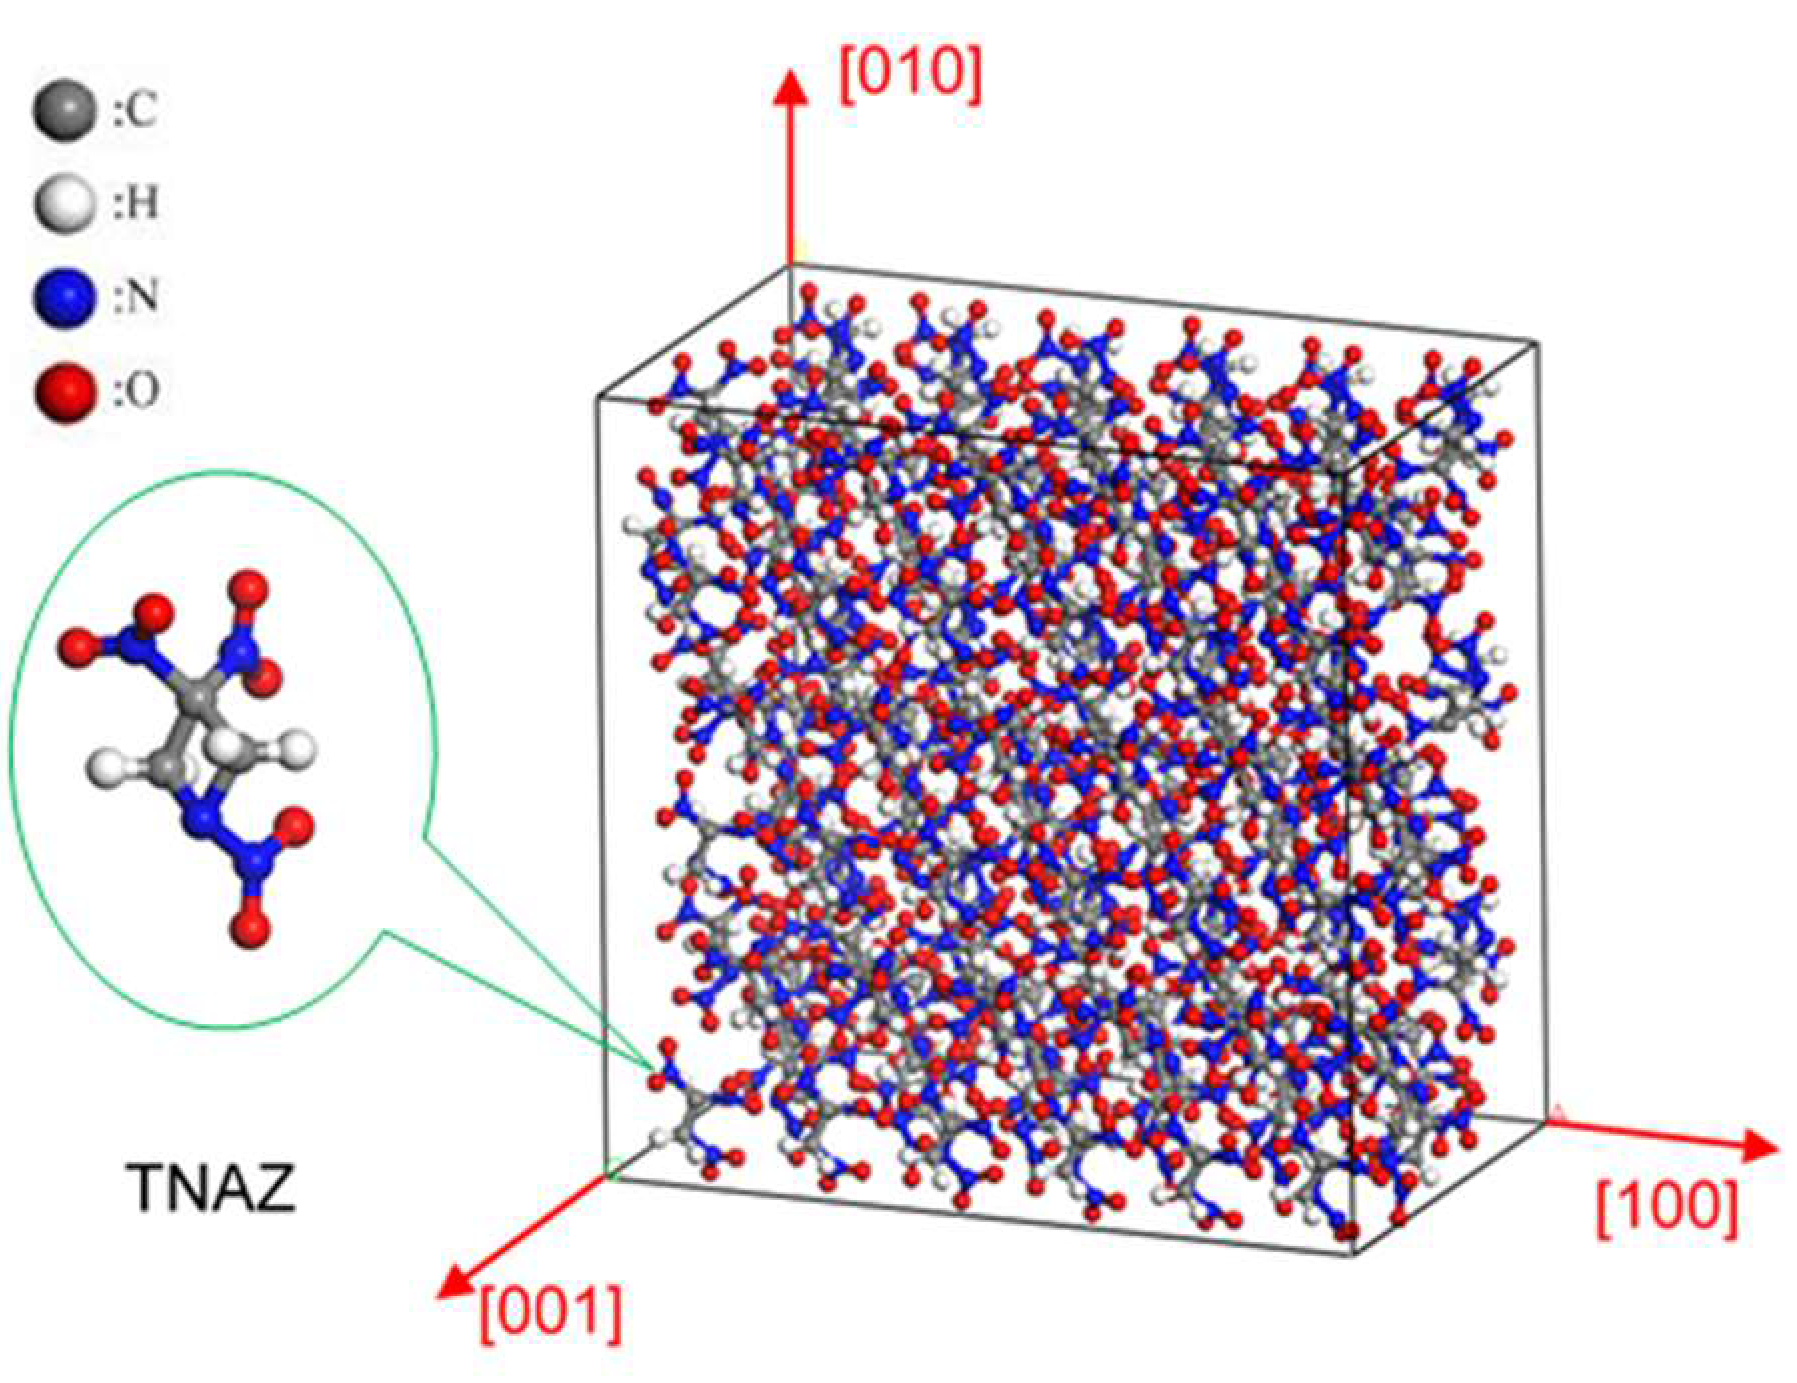
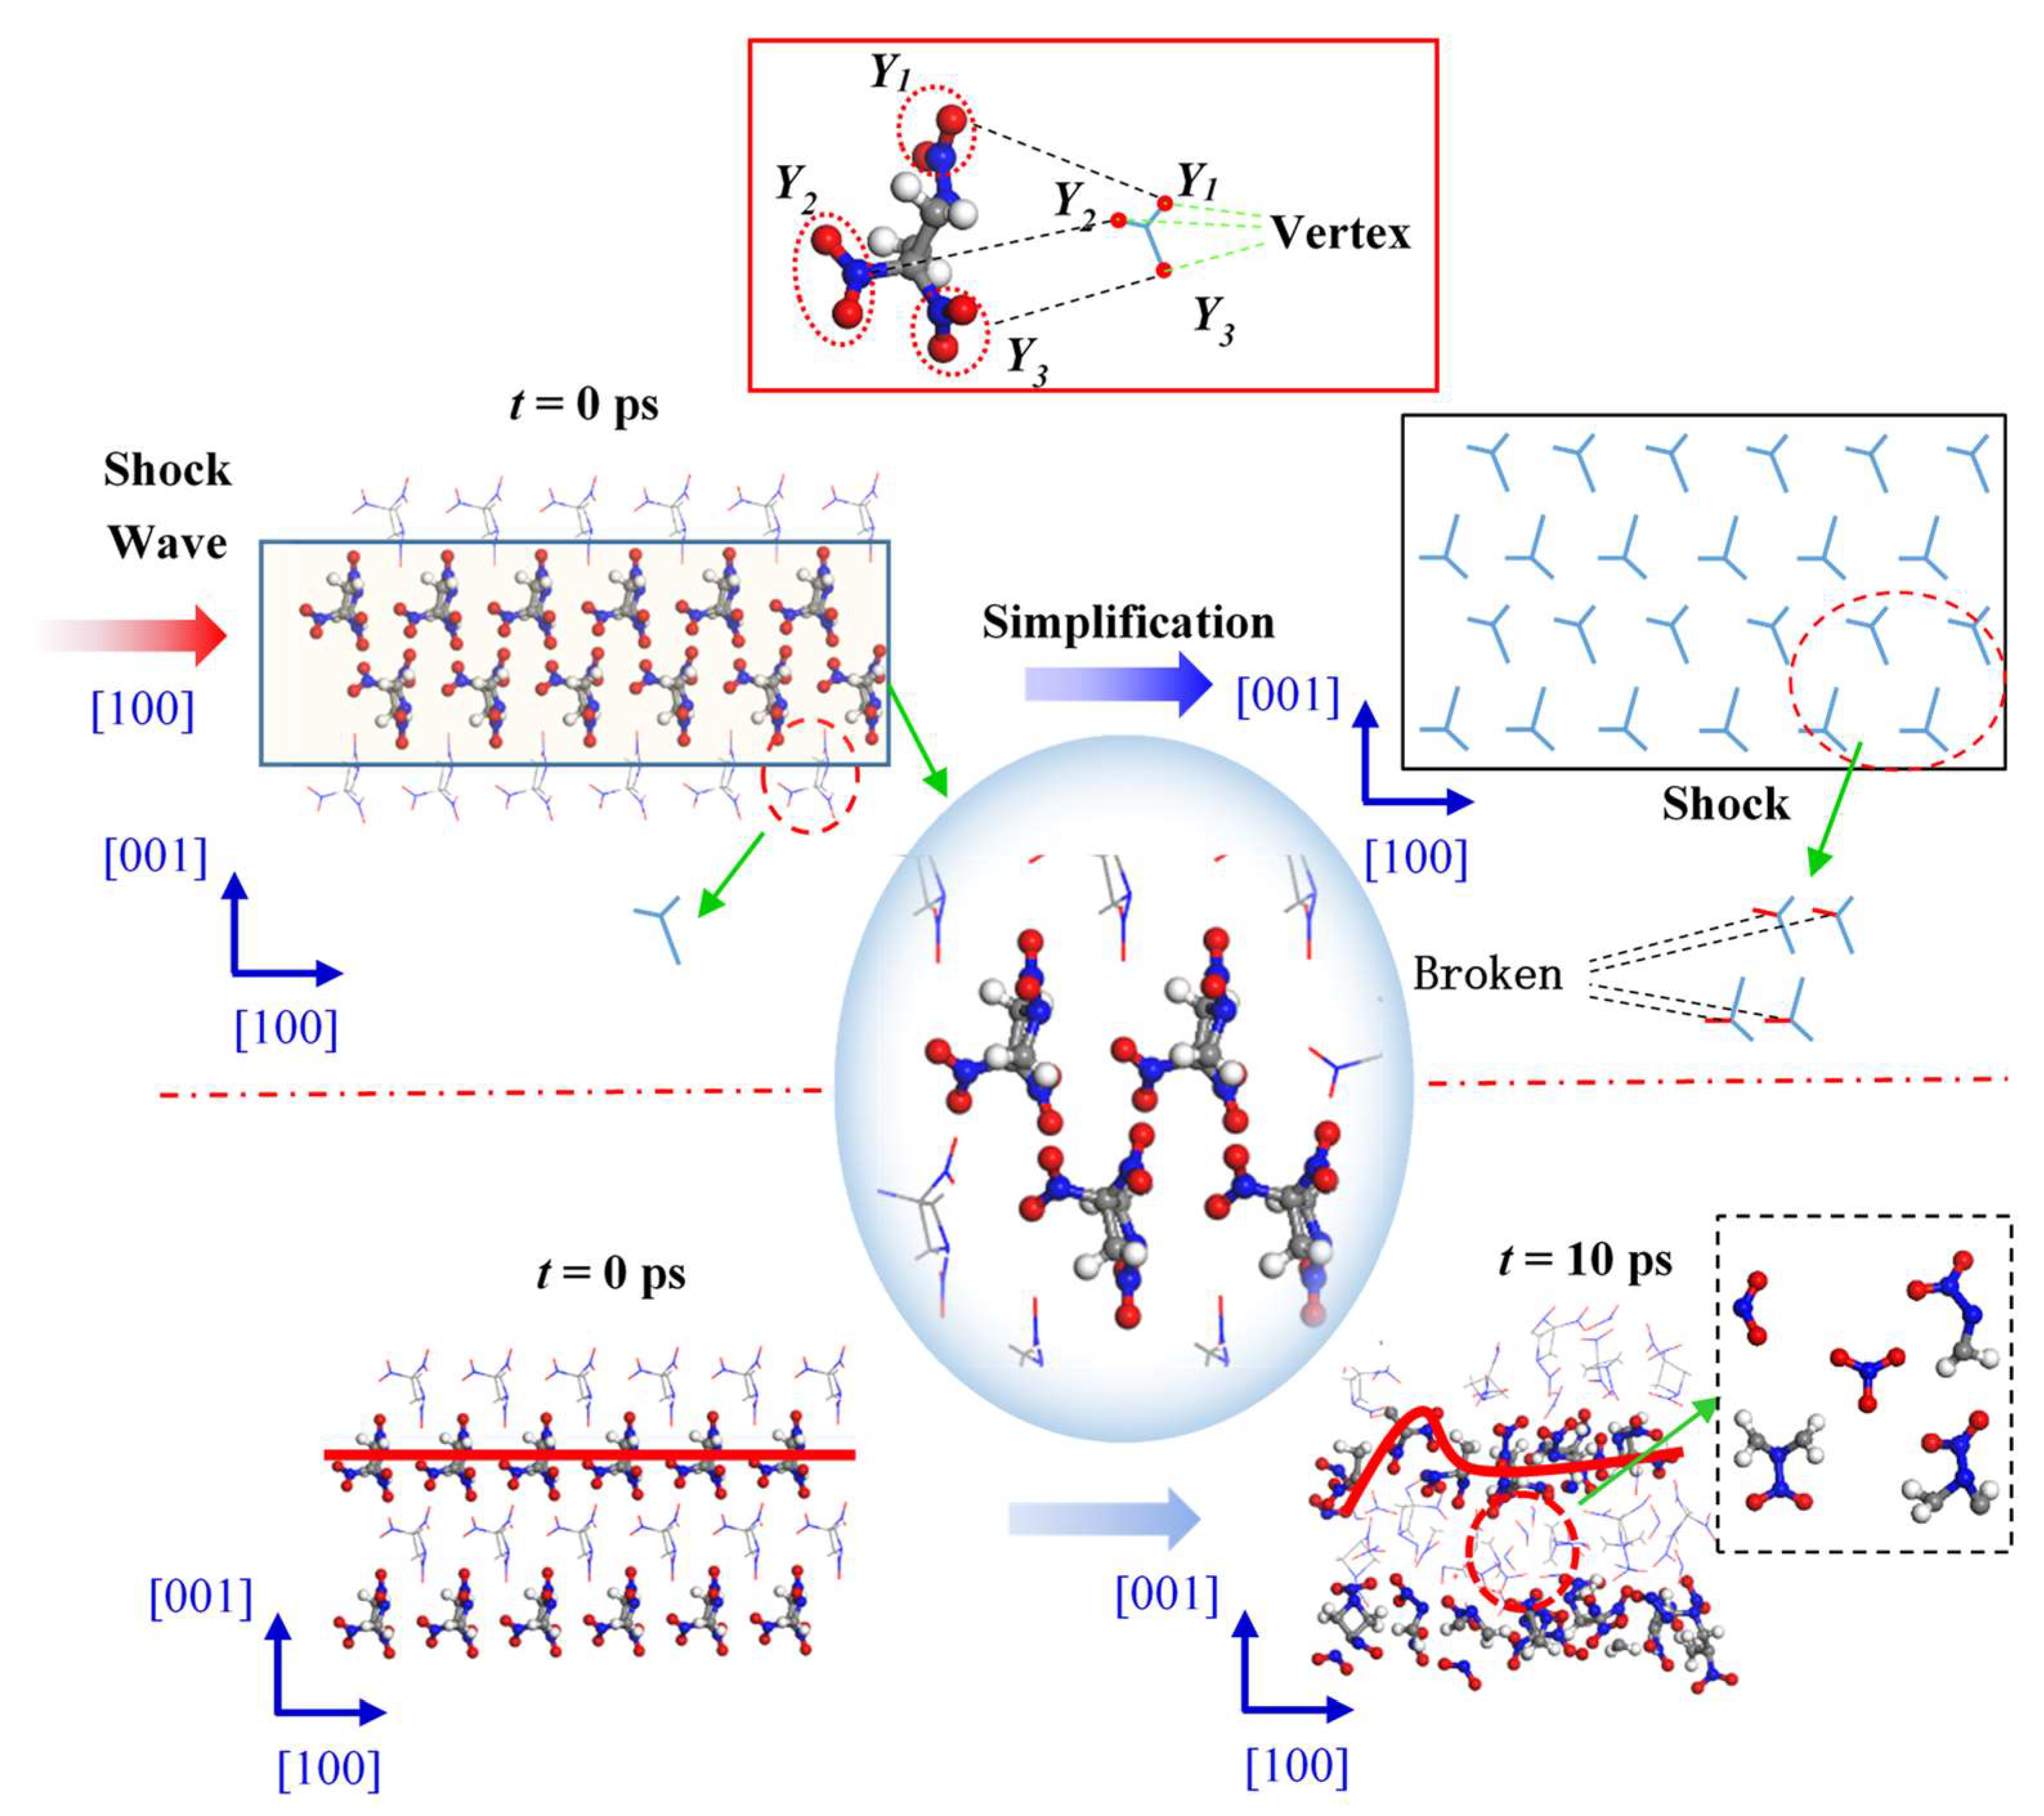
TNAZ has strong anisotropic pressure and temperature responses in different directions, which may be related to the molecular arrangements in different directions. Here, this paper takes the supercell with a shock velocity of 9 km∙s−1 as an example for the analysis.
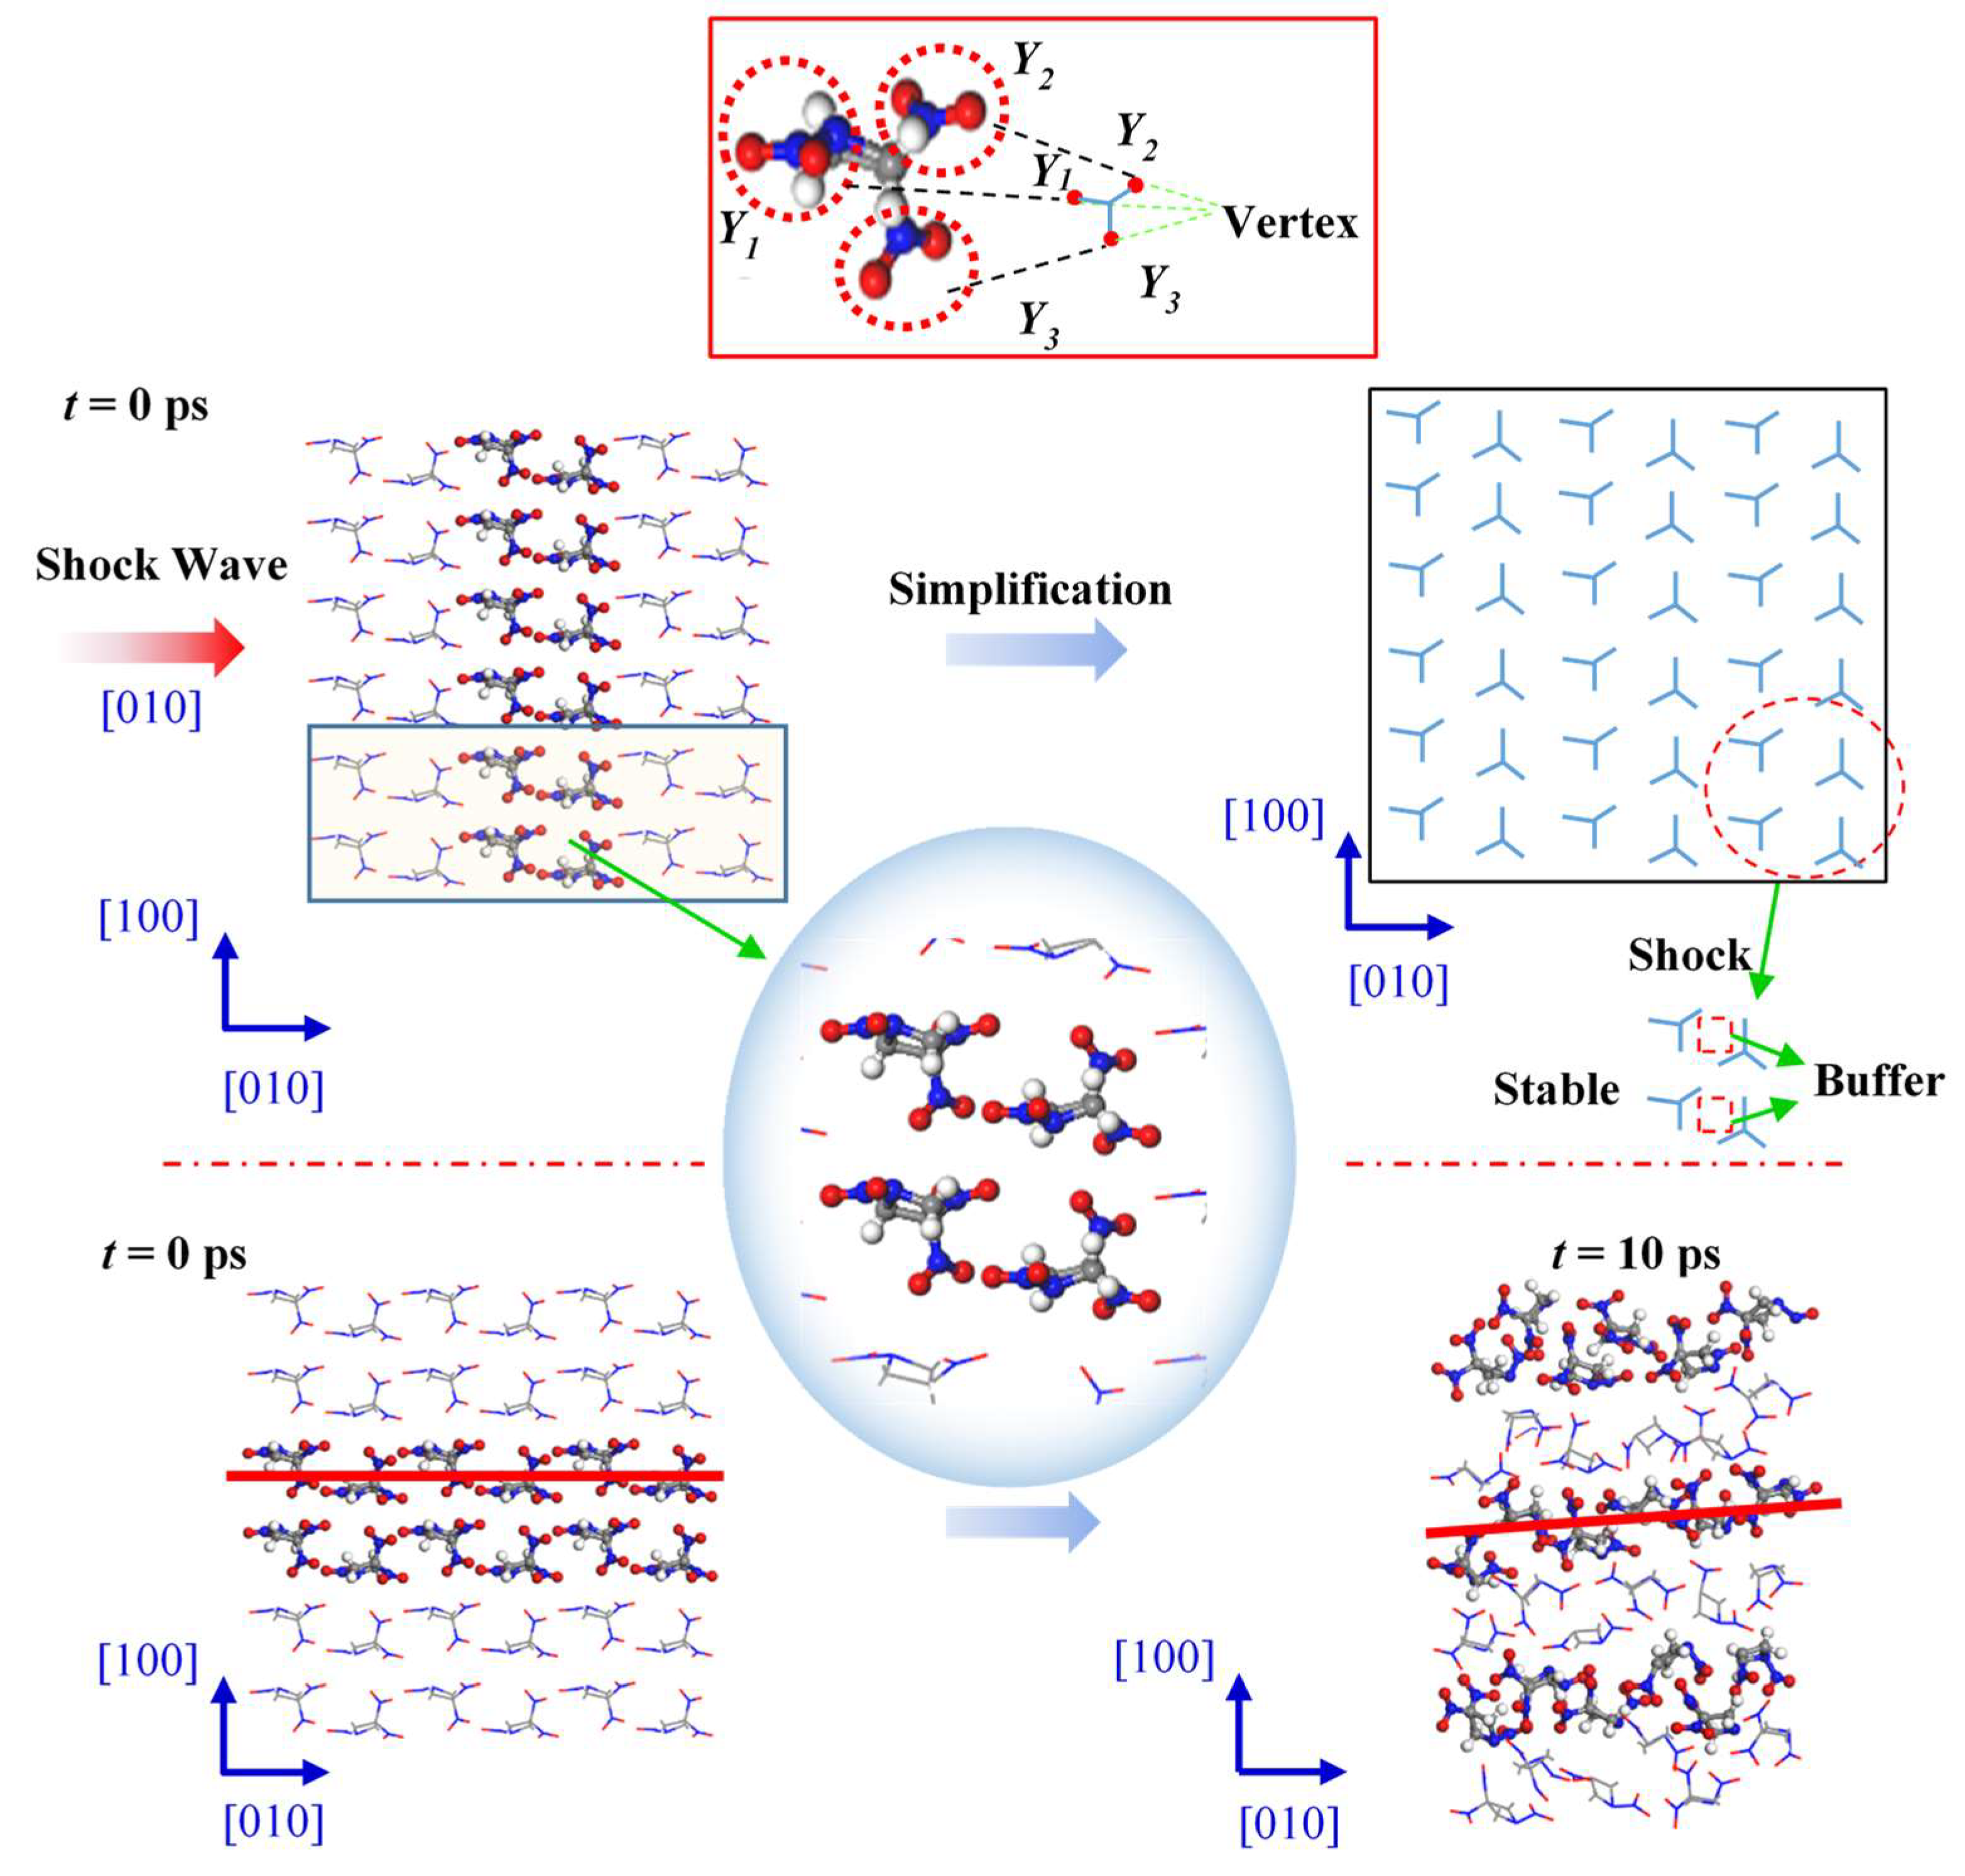
Figure 5 shows the changes in internal structure of the TNAZ supercell shocked in the [100] direction. For the convenience of observation, this paper uses the “Y” figure to represent the approximate shape of the TNAZ single molecule in the [100] direction. From the perspective of molecular arrangement, TNAZ molecules are arranged in a straight line in the [100] direction, and the direction of the molecules on the same line is identical. When the supercell is shocked in the [100] direction, a vertex of the “Y” shape is squeezed with the adjacent “Y” shape. The squeezing easily breaks the molecular structure and makes the supercell react. As shown in
Table 1, when t = 0 ps, the initial number of TNAZ molecules is 144. When t = 10 ps, the number of TNAZ molecules is reduced to 94 in the [100] direction. Compared to the [010] and [001] directions, the [100] direction has more small molecules. There are five NO
2 molecules, two HNO
2 molecules, one O
2 molecule and two NO
3 molecules, respectively. Along the [100] direction, the arrangement of TNAZ molecules cannot be maintained, and the molecular structure has been significantly deformed. Thus, in this direction, the reaction rate of the supercell is the fastest.
Figure 6 shows changes in the internal structure of the TNAZ supercell shocked in the [010] direction. From the perspective of the molecular arrangement, the TNAZ molecules are also arranged in a straight line in the [010] direction. However, the directions of adjacent TNAZ molecules on the same line are opposite. When the supercell is shocked in the [010] direction, a vertex of the “Y” shape (Y1) and two vertices of the adjacent “Y” shape (Y2 and Y3) are near each other. In the [010] direction, there is a large space between adjacent TNAZ molecules to form a “buffer” for the shock in this direction. The supercell remains relative stable in this direction. As shown in
Table 2, when t = 0 ps, the initial number of TNAZ molecules is 144. When t = 10 ps, the TNAZ molecules are shocked in the [010] direction, and the number of TNAZ molecules is reduced to 121. The TNAZ molecules maintain a linear arrangement in the [010] direction, and the molecular structure remains intact. At 10 ps, the number of unreacted TNAZ molecules in the system after being shocked in the [100] direction is less than that in the [100] direction. There are not many small molecules in the [010] direction. The number of NO
2, HNO
2, O
2 and NO
3 is two, zero, one and two, respectively. Thus, in this direction, the rate of reactions is lower than in the [100] direction.
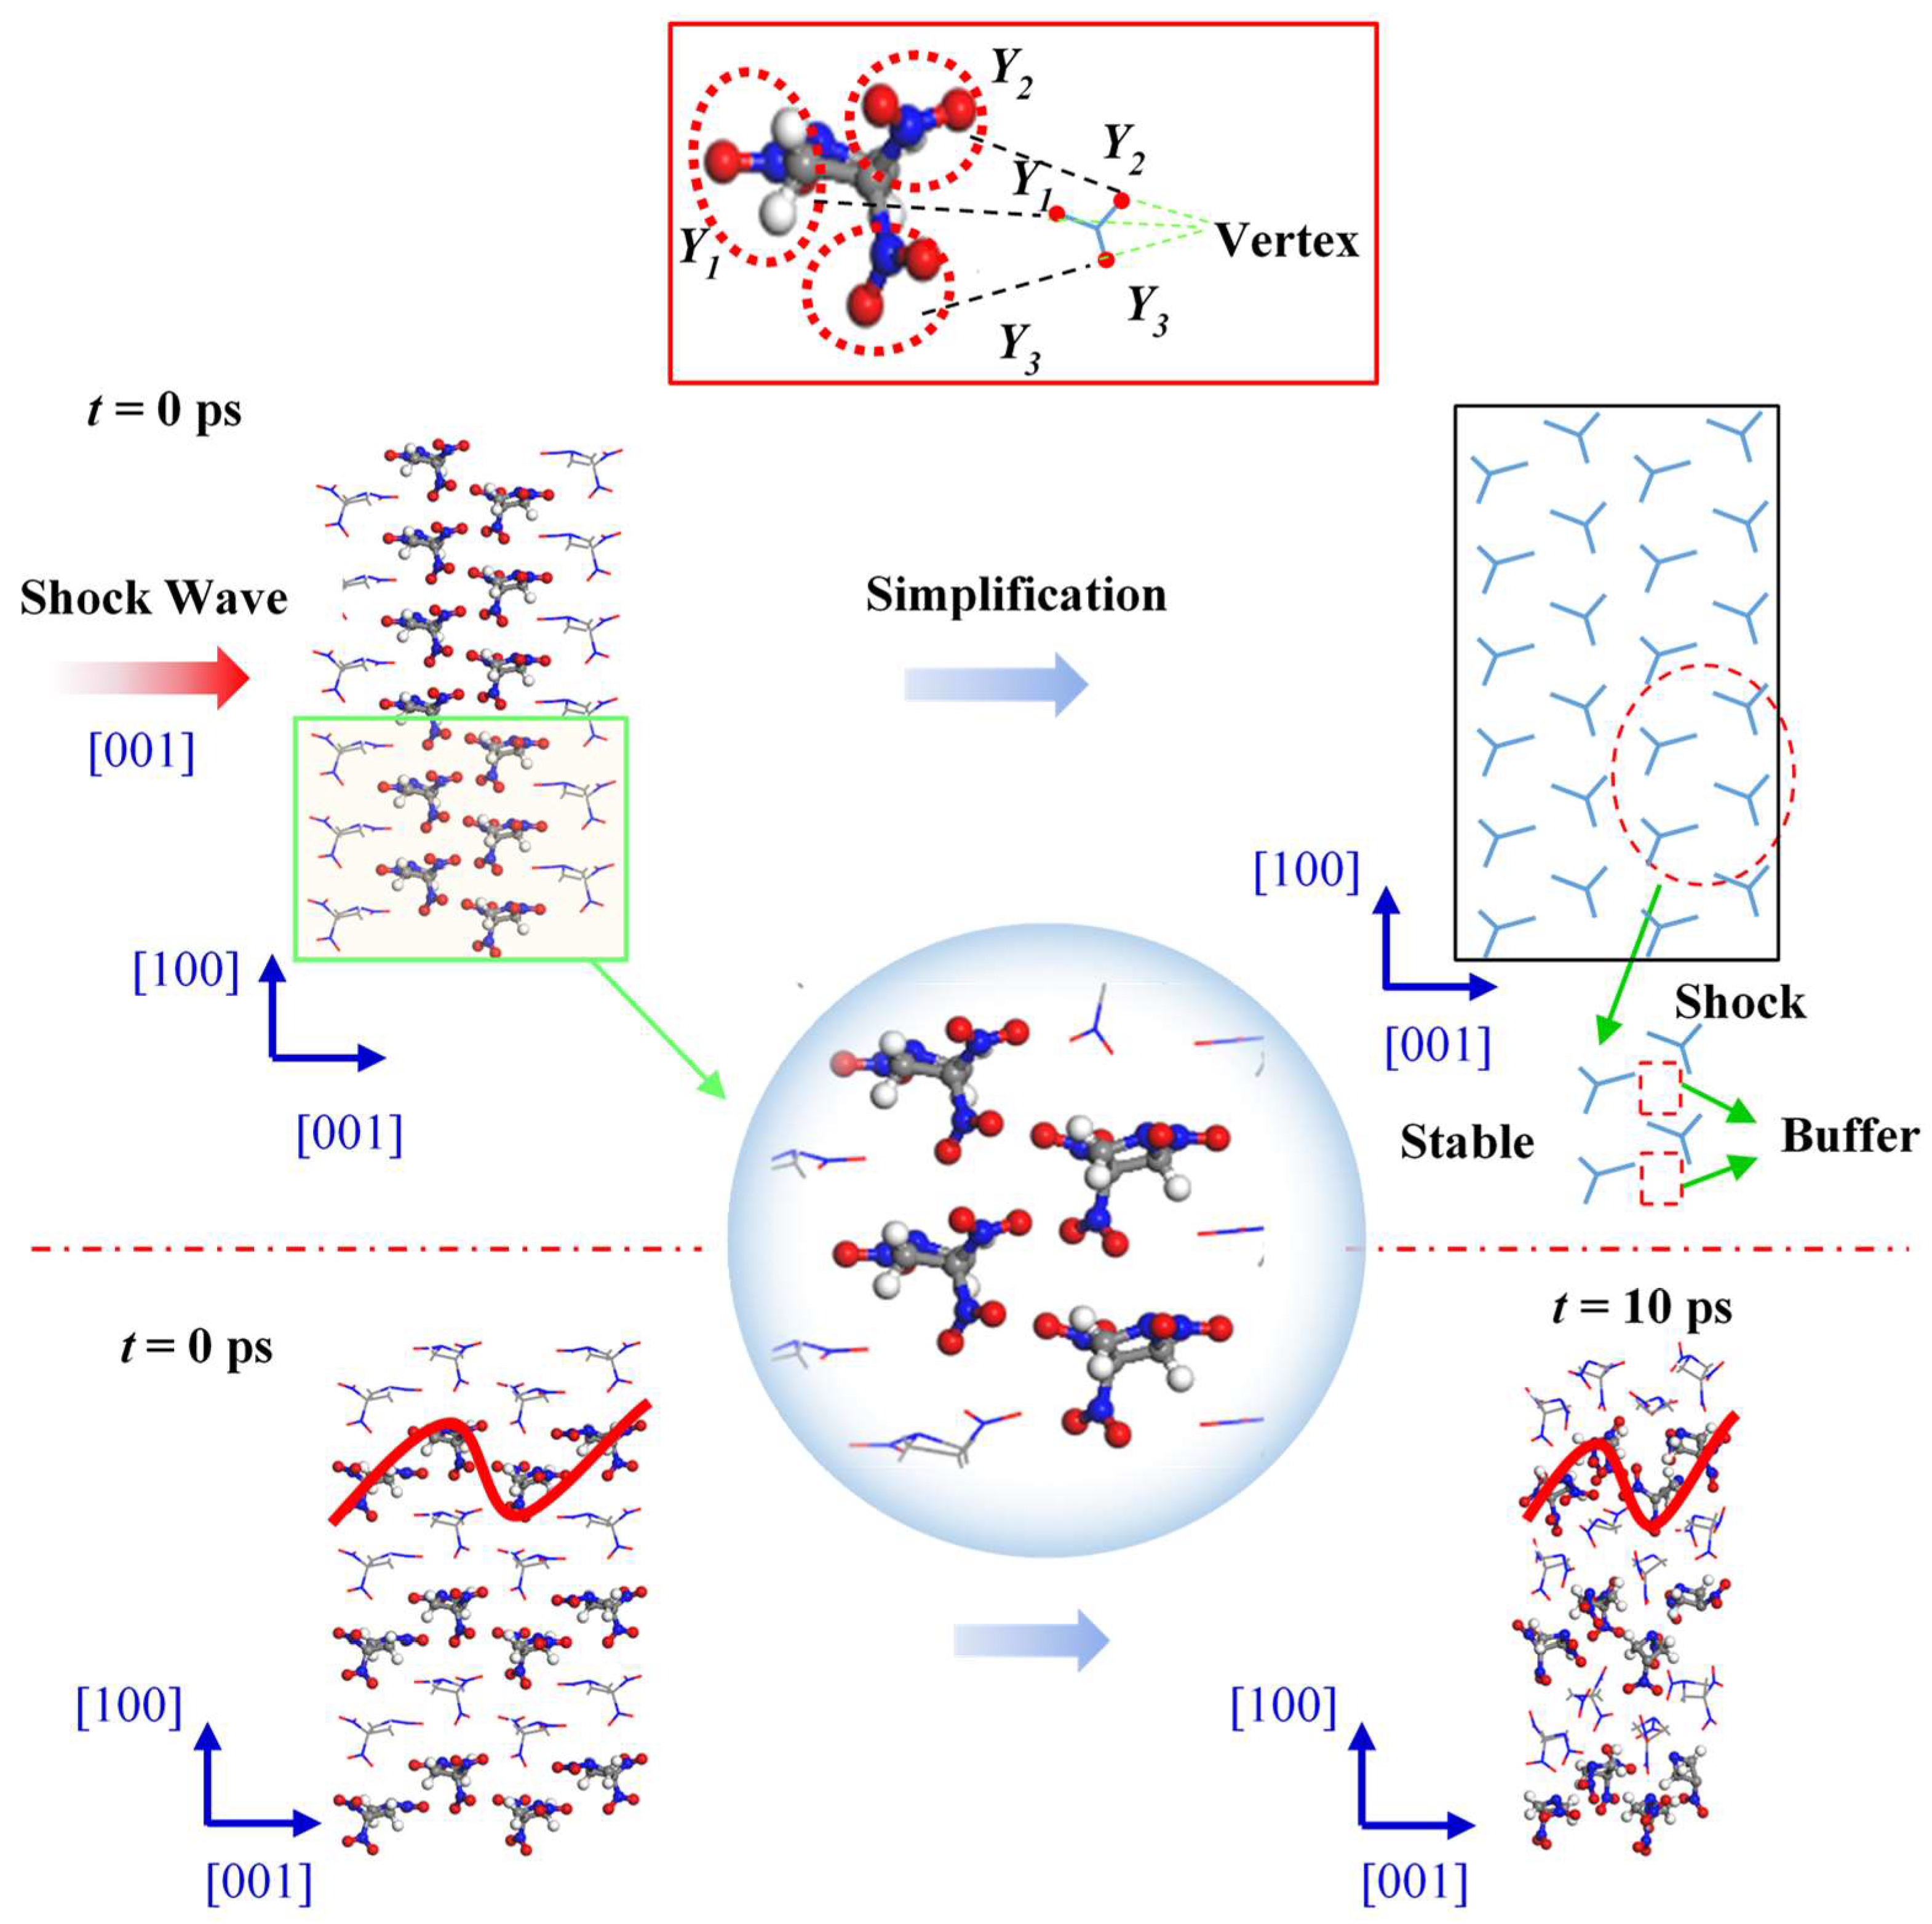
Figure 7 shows the changes in internal structure of the TNAZ supercell shocked in the [001] direction. From the perspective of the molecular arrangement, the TNAZ molecules are arranged as a wavelike line in the [001] direction. When the supercell is shocked in the [001] direction, a vertex of the “Y” shape (Y1) is also near two vertices of the adjacent “Y” shape (Y2 and Y3). When adjacent TNAZ molecules are close, there is a large space between the molecules, which form a type of “buffer” for the shock in this direction. Thus, the molecular structure is not easily destroyed in the [001] direction, and the supercell is stable in this direction. As shown in
Table 3, when t = 0 ps, the initial number of TNAZ molecules is also 144. When t = 10 ps, the number of TNAZ molecules is reduced to 132 in the [001] direction. The TNAZ molecules maintain the arrangement of a wavelike line in the [001] direction, and many molecules are intact. There are not many small molecules in the [010] direction. The number of NO
2, HNO
2, O
2 and NO
3 is four, zero, one and two, respectively. Hence, in this direction, the rate of reactions is also lower than that in the [100] direction.
Based on the steric hindrance model proposed by Dick et al. [
31], during the impact sliding process, molecules avoid close contact between each other through rotational deformation and other methods to cushion the impact compression. In the [100] direction, the molecules are arranged in a good order, the front-row molecules directly collide with the back-row molecules, and the impact compression effect cannot be buffered. In the [010] and [001] directions, due to the staggered arrangement of molecules, along the compression direction, there are some slip spaces between the molecules, so the molecules move into the intermolecular space, rotate and deform to avoid molecular collisions. Therefore, the impact sensitivity of TNAZ in the [100] direction is higher than that in the other two directions.
3.4. Initial Reactions and the Chemical Bonds
The high-frequency reactions of the first 10 ps at 9 km∙s
−1 is shown in
Table 4. Bimolecular polymerization first occurs in the shock. By the time of bimolecular polymerization in different directions, the “buffering” effect in different directions can be revealed. In the [100], [010] and [001] directions, the time of bimolecular polymerization is 0.40 ps, 0.975 ps and 1.375 ps, respectively. Compared to the [100] and [001] directions, the molecular arrangement along the [010] direction can significantly increase the “buffering” effect. The polymerization reaction is exothermic, and the pyrolysis reaction is endothermic. Therefore, the frequencies of the net polymerization reactions in the three directions can be analyzed, i.e., the frequency of the polymerization reactions minus the frequency of the pyrolysis reactions. In the [100], [010] and [001] directions, the frequencies of the net polymerization reactions are 16, 4 and 1, respectively. The reactions in the [100] direction release the most heat, and the temperature increase of the TNAZ supercell is the fastest; the reactions in the [001] direction releases the least heat, and the temperature increase of the TNAZ supercell is the slowest. A high temperature can accelerate the unimolecular reactions of TNAZ. In terms of reaction time, the unimolecular reactions in the [100] direction take place earlier than that in the [010] and [001] directions. Above all, the sensitivity order of TNAZ in different directions is [100] > [010] > [001].
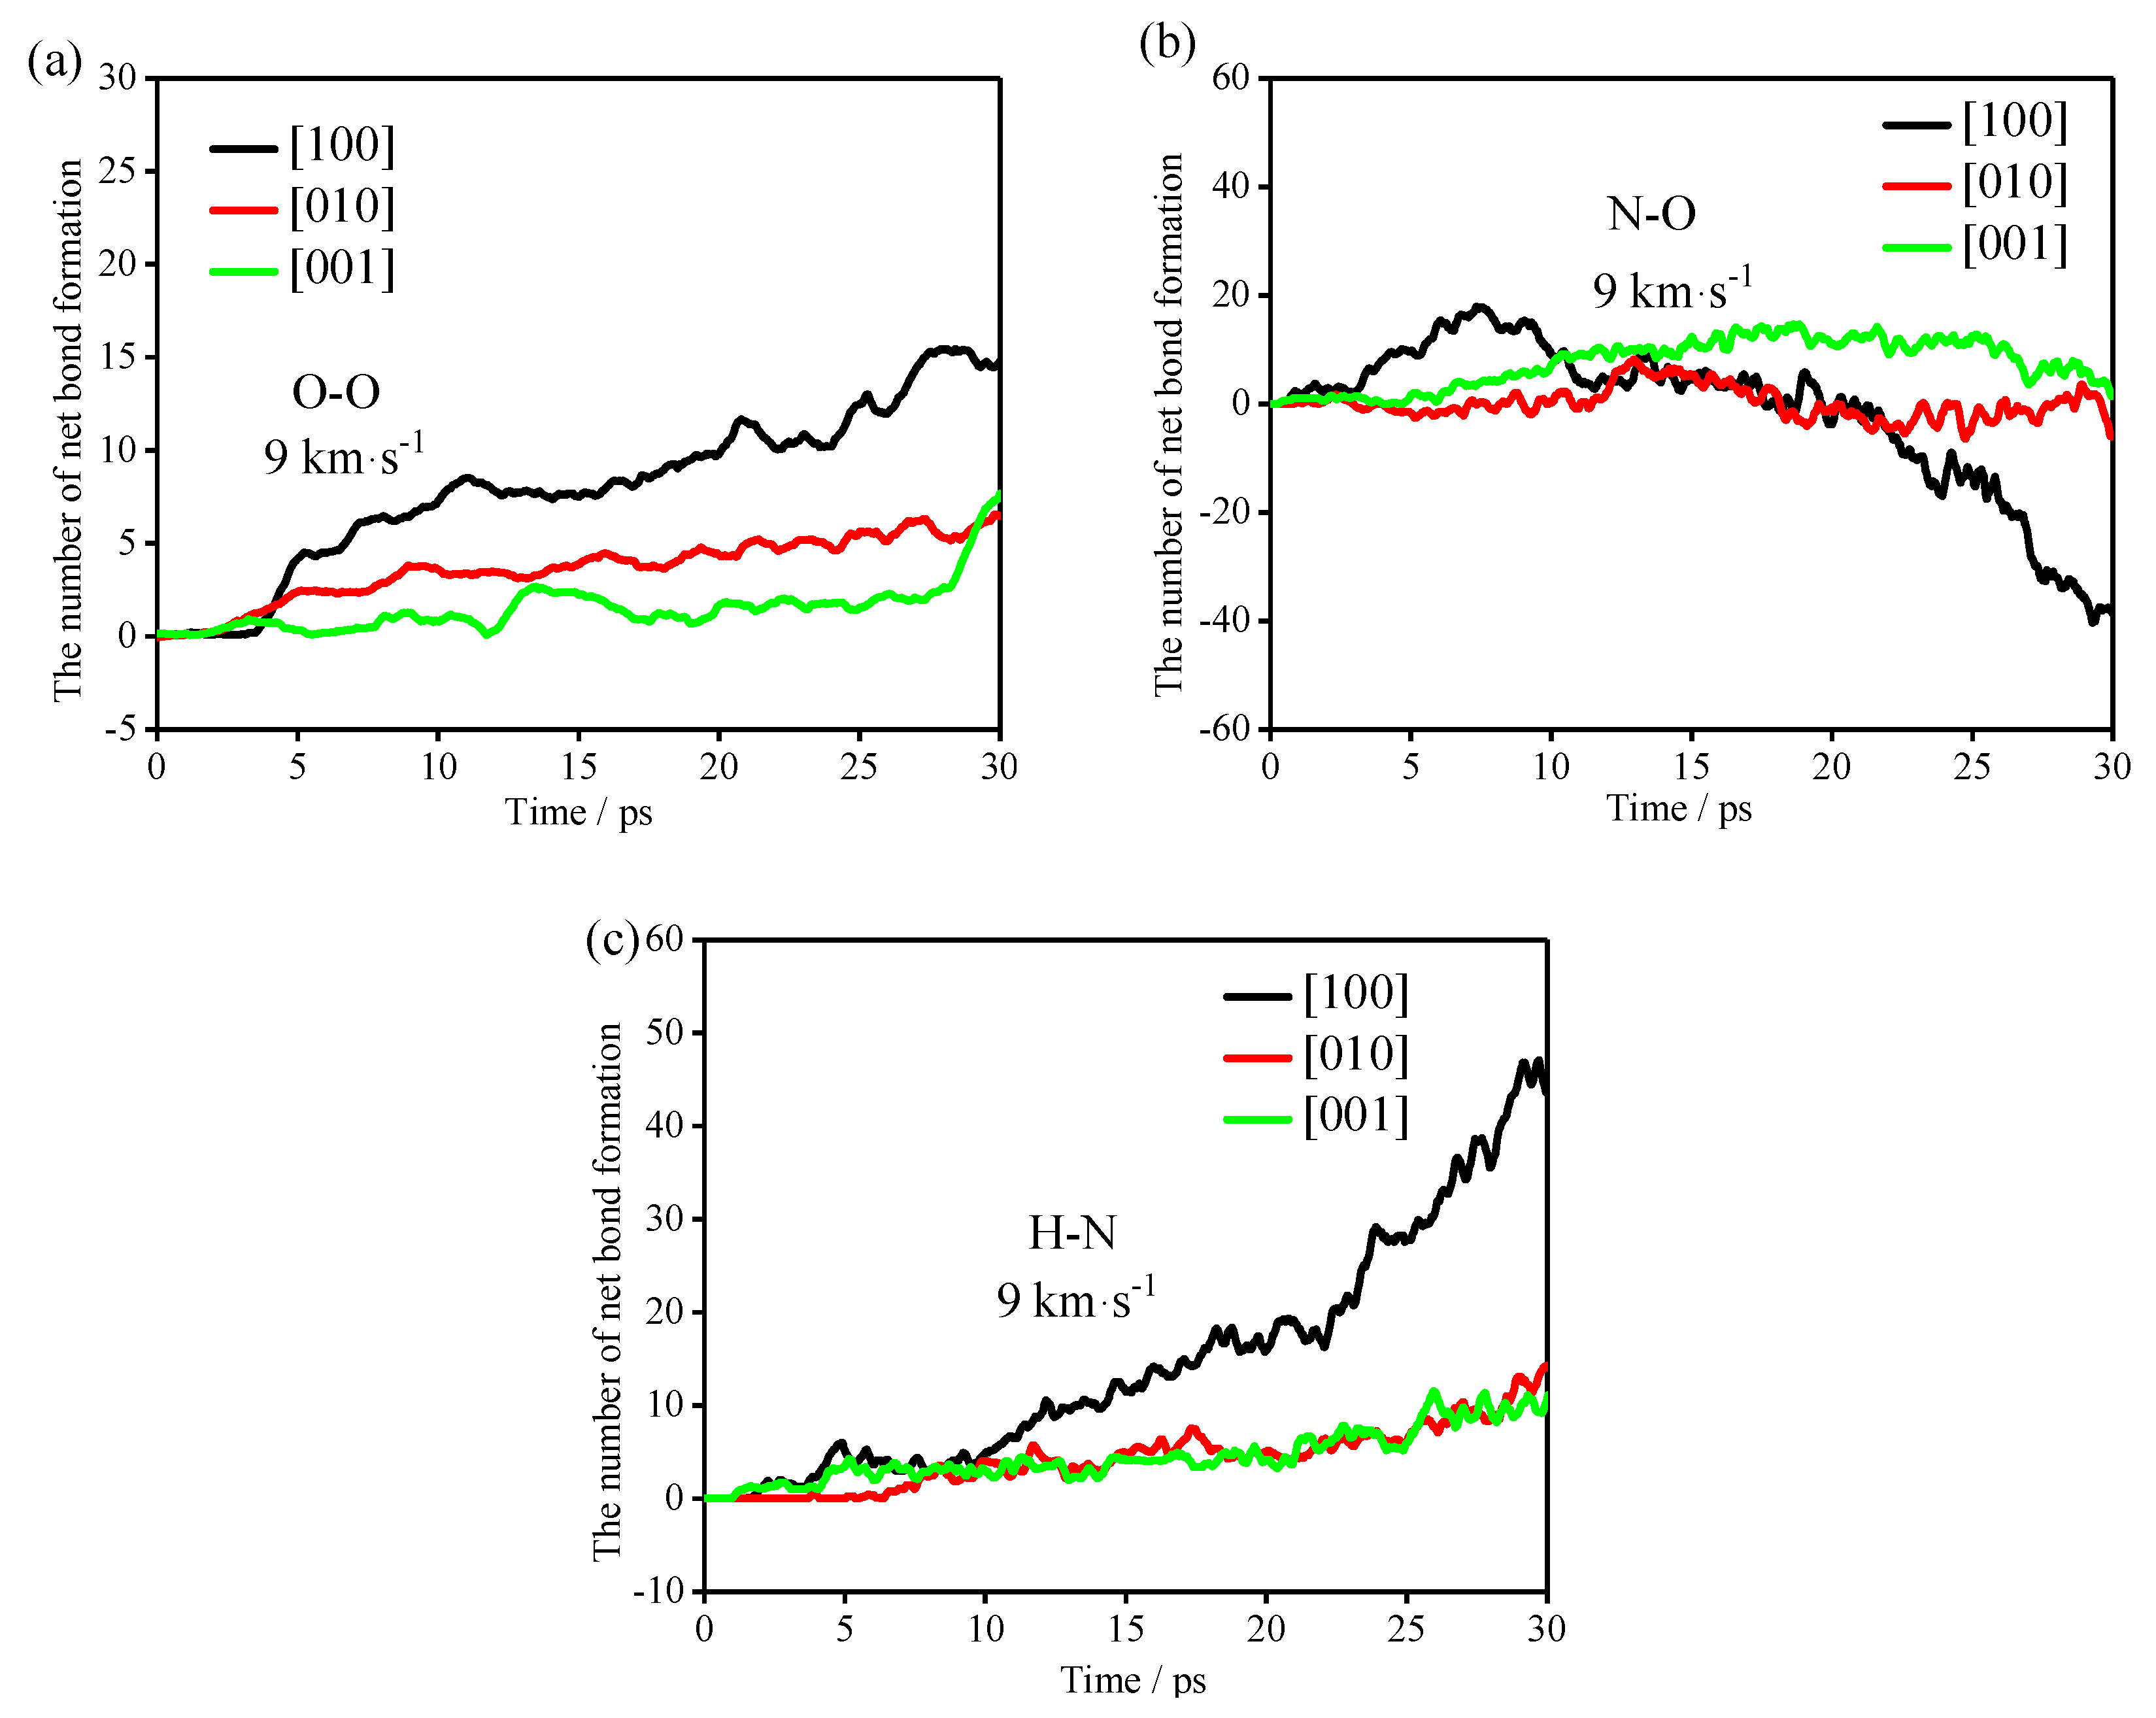
To study the formation of clusters in the early stage of the reactions, the bonds (O-O, N-O and H-N) with obvious changes in the early stage of the reactions were analyzed, as shown in
Figure 8. In
Figure 8, the positive value plotted on the
Y-axis represents the number of positive net bonds, and the negative value represents the number of negative net bonds, that is, the number of net broken bonds.
It can be seen from
Table 4 that the polymerization of the TNAZ system frequently occurs before 10 ps. Therefore, in the first 10 ps reactions, the TNAZ molecules in the [100] shock direction are mainly combined into clusters by the formation of O-O, N-O and H-N bonds. The TNAZ molecules in the [010] shock direction are mainly combined into clusters by the formation of H-N bonds. The TNAZ molecules in the [001] shock direction are mainly combined into clusters by the formation of O-O bonds. In the formation of O-O and H-N bonds, the net bonding rate is the fastest in the [100] shock direction. Although the net bonding of O-O and H-N bonds in the [010] and [001] shock directions also show differences, the difference is not significant. Compared with the change trend of O-O and H-N bonds in the three directions, the change trend of the N-O bonds in the three directions is obviously different. In the [100] shock direction, the N-O bonds form first and then break. In the [010] and [001] shock directions, the trend of net bond formation is not obvious, and almost all of them show net bond breaking. This phenomenon may be related to the shock direction. In the [100] direction, the number of N-O bonds has an upward peak during the first 5–10 ps. This is due to the close distance between the N and O atoms in adjacent TNAZ molecules in the [100] direction. Shock wave compression makes the distance between the N and O atoms shorter than the cut-off radius, resulting in an increase in the number of N-O bonds.
The occurrence of the chemical reaction must be accompanied by the breaking of bonds. The shock directions affect the formation and cleavage of bonds at the initial stage. In other words, the shock directions affect the initial reaction path of the TNAZ system.
3.5. Main Intermediate Products and Cluster Analysis
In different shock directions, the small-molecule products of TNAZ are H2O, N2, CO2, NO2, O2, NO3, HNO2, etc. Here, typical small-molecule products such as O2, NO3 and HNO2 were selected for the analysis. When the shock velocities are identical, the mechanisms of reactions in different directions to form small molecules are not exactly identical. When the supercell is shocked in a certain direction, the distance between the atoms in the direction of the shock decreases. When the atoms or groups on some molecules are detached, the decrease in distance makes it easy for these atoms or groups to combine, which causes the differences between the reaction paths of the small molecules in subsequent reactions.
Table 5 shows the high-frequency reactions of the O
2 formation in three directions. The net response frequencies in the [010] direction, [001] direction and [100] direction are −1, 13 and 6, respectively. From the reactants, the net reaction frequency at which O
2 molecule is produced via single-molecule decomposition is the highest in the [010] direction with the value of 12. Most of the reactants in the [001] directions are polymers.
Thus, most of the TNAZ molecules in the [001] directions first polymerize into polymers; then, these polymers decompose into O2 molecules. In the [001] directions, O2 is mainly produced from the polymer, while in the [010] direction, O2 is mainly formed by the decomposition of TNAZ molecules. In terms of reaction time, the time sequence of O2 appearance in each direction is different. The appearance time of O2 in the [100], [010] and [001] directions is 6.70, 3.13 and 13.15 ps, respectively. Thus, in the [010] direction, O2 molecules appear first.
Table 6 shows the high-frequency reactions of NO
3 formation in three directions. Compared to O
2 molecules, most of the reactants are TNAZ molecules in the reactions, and NO
3 generally appears earlier than O
2. In the [100] direction, the net reaction frequency of NO
3 formation is 9; in the [010] direction, the net frequency is 16; finally, in the [001] direction, the net frequency is 17. The [100] direction produces fewer NO
3 molecules than that of the other two directions. When the supercell is shocked in the [001] direction, some reactants are polymers, which are not observed in the cases of the other two directions. In terms of reaction time, the time sequence of NO
3 appearance in each direction is different. In the case of shock wave loading in the [100] direction, NO
3 molecules first appear at 1.73 ps.
Table 7 shows the high-frequency reactions of HNO
2 formation in three directions. Compared to O
2 and NO
3 molecules, the single-molecule reactants have higher reaction frequency. In terms of reactants, the reaction frequency at which reactants are polymers is 0 in the three directions, which is obviously different from the O
2 and NO
3 molecules. Compared to the other two directions, more HNO
2 molecules are produced when shocked under the shock wave loading in the [001] direction. In terms of reaction time, HNO
2 appears in the [100], [010] and [001] directions at 4.70 ps, 11.75 ps and 2.55 ps, respectively. Thus, in the [001] direction, HNO
2 molecules appear first.
In conclusion, O2, NO3 and HNO2 first appear in the [010], [100] and [001] directions, respectively. The appearance time of small molecules is affected by the directions of shock and not directly related to the sensitivity. The reaction paths of small molecules in three directions are also different. The reactants of O2 and NO3 are many polymers in the [001] directions but less in the [100] and [010] direction. Compared with O2 and NO3, the reactants of HNO2 are almost single molecules, and the reaction mainly occurs in the [001] direction.
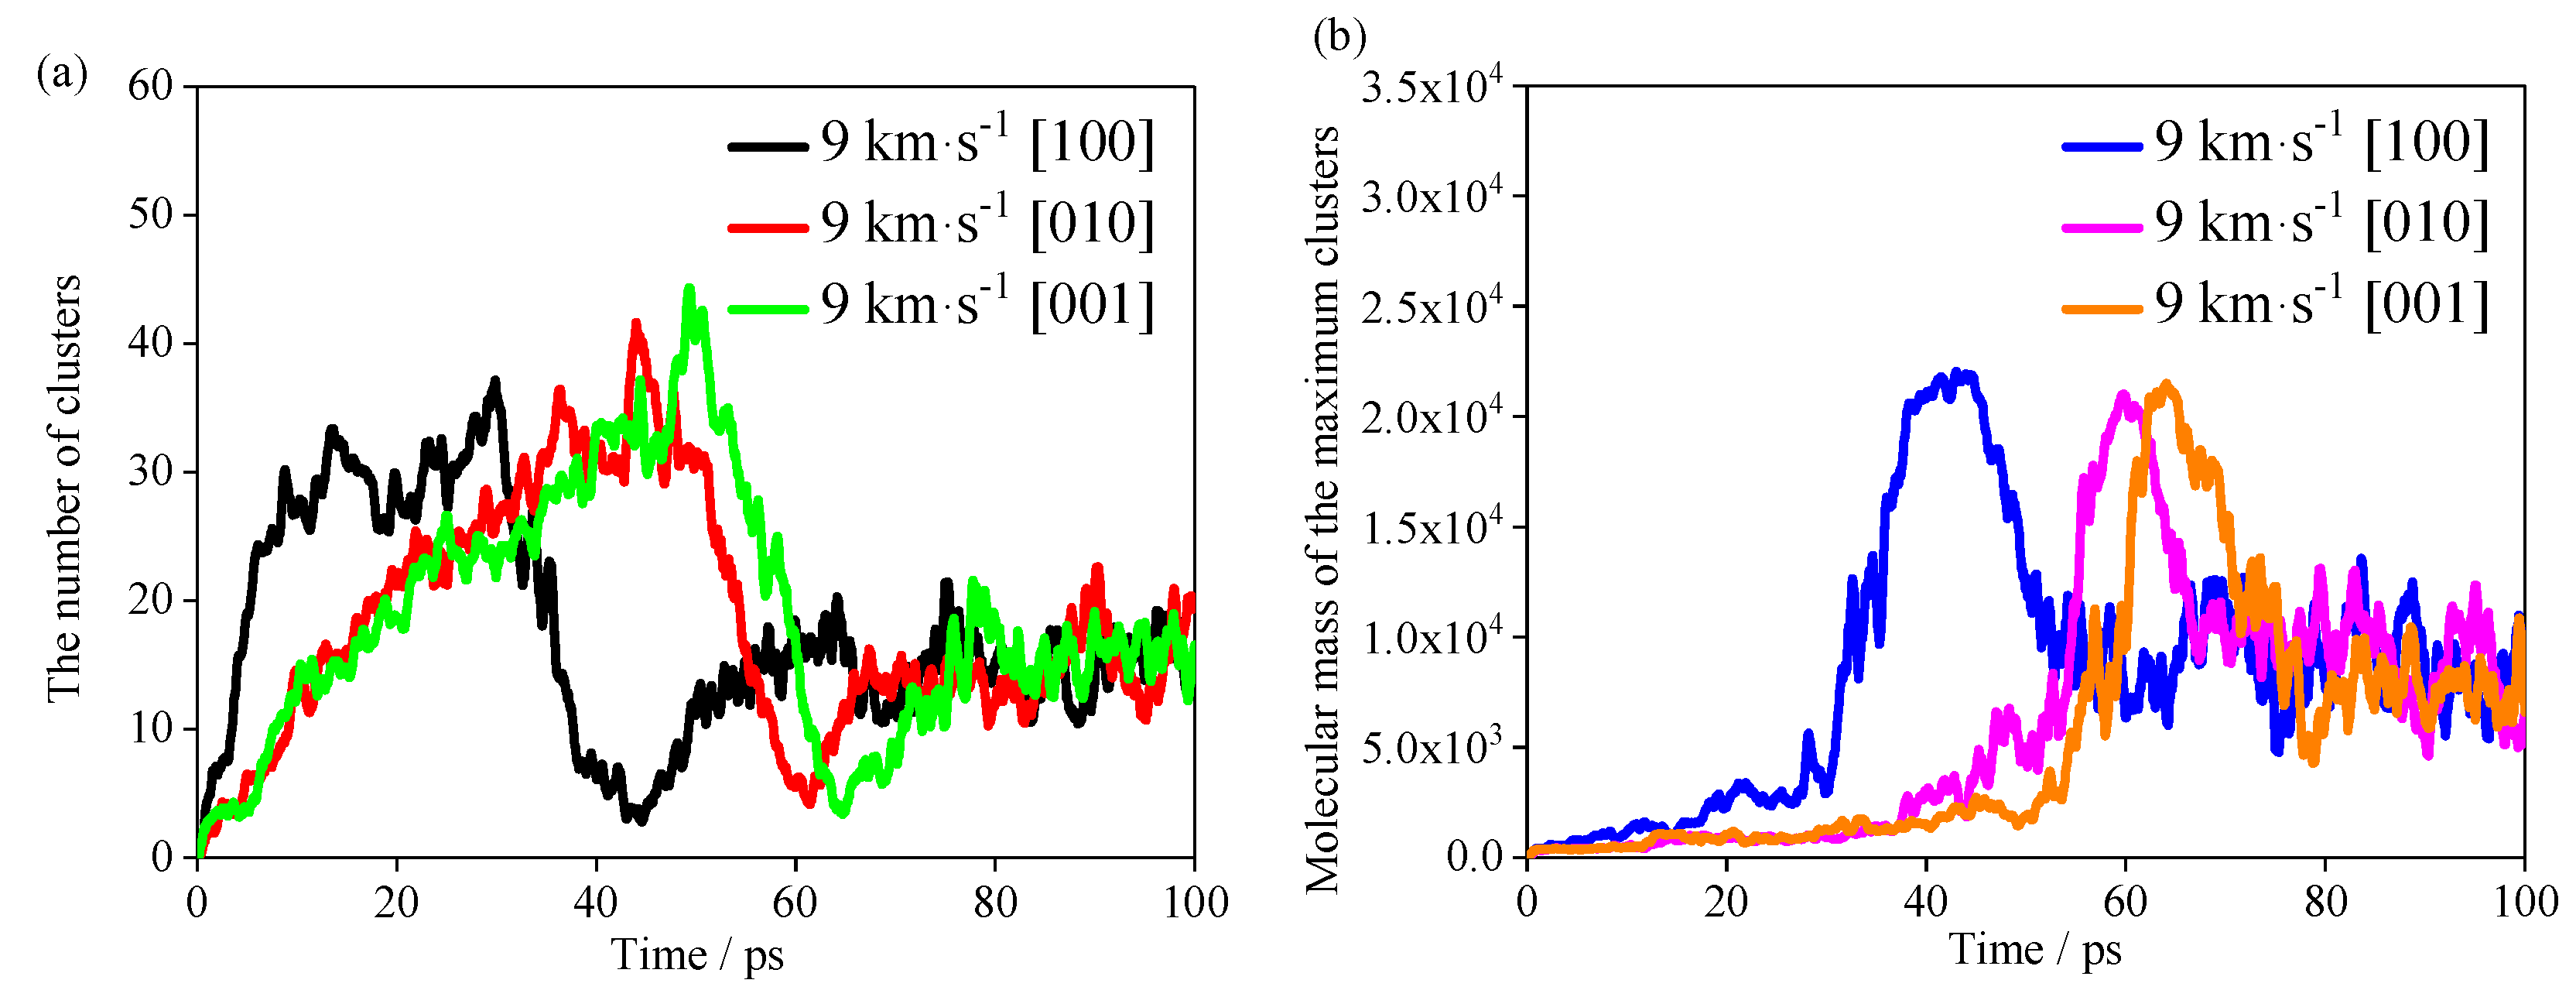
The evolutions of the number of clusters and molecular mass of maximum clusters in the TNAZ system with different shocks are shown in
Figure 9a,b. For the convenience of statistics and analysis, “clusters” refers to molecules whose relative molecular weight is more than that of a single TNAZ molecule. First, the most rapid increase in number of clusters occurs in the [100] direction, but the most rapid decrease in number of clusters also occurs in this direction. The numbers of clusters in the [010] and [001] directions reach the maximum value at very similar times, but they are later than that in the [100] direction. When the number of clusters decreases, the molecular weight of the largest cluster rapidly increases, which indicates that the reduced clusters are aggregated to the largest cluster. The shock in the [100] direction makes TNAZ molecules form large clusters with a molecular mass above 20,000. Under the shock of the [100] direction, the time it takes for the number of clusters to reach 30 is approximately 20 ps, and the molecular mass of the largest cluster rapidly increases, so more TNAZ molecules participate in the polymerization reactions in the [100] direction. After approximately 45 ps, the cluster with the largest molecular mass begins to decompose, and those in the [100] direction decompose before those in the [010] and [001] directions. In summary, there is a hysteresis in the response of the [010] and [001] directions to the pressure, and the arrangement of molecules in this direction can buffer the pressure, so that the shock sensitivity of TNAZ supercell is lower in the [010] and [001] directions than in the [100] direction.


