Article

Comparison of LC-MS3 and LC-MRM Method for Quantifying Voriconazole and Its Application in Therapeutic Drug Monitoring of Human Plasma

1
Department of Laboratory Medicine, The First Hospital of Jilin University, Changchun 130061, China
2
School of Life and Pharmaceutical Sciences, Dalian University of Technology, Panjin 124221, China
3
Department of Laboratory Medicine, Nanfang Hospital, Southern Medical University, Guangzhou 510515, China
*
Authors to whom correspondence should be addressed.
These authors contributed equally to this work.
Molecules 2022, 27(17), 5609; https://doi.org/10.3390/molecules27175609
Submission received: 15 July 2022 / Revised: 10 August 2022 / Accepted: 26 August 2022 / Published: 31 August 2022
(This article belongs to the Special Issue Analytical Applications of Biochemical Mass Spectrometry)

Abstract

:
The TDM of voriconazole which exhibits wide inter-individual variability is indispensable for treatment in clinic. In this study, a method that high-performance liquid chromatography tandem mass spectrometry cubed (HPLC-MS3) is first built and validated to quantify voriconazole in human plasma. The system is composed of Shimadzu Exion LCTM UPLC coupled with a Qtrap 5500 mass spectrometer. The separation of voriconazole is performed on a Poroshell 120 SB-C18 column at a flow rate of 0.8 mL/min remaining 7 min for each sample. The calibration curves are linear in the concentration range of 0.25–20 μg/mL. Intra-day and inter-day accuracies and precisions are within 8.0% at three concentrations, and the recoveries and matrix effect are all within accepted limits. In terms of stability, there is no significant degradation of voriconazole under various conditions. The HPLC-MS3 and HPLC-MRM (multiple reaction monitoring) methods are compared in 42 patients with Passing–Bablok regression and Bland–Altman plots, and the results show no significant difference between the two methods. However, HPLC-MS3 has a higher S/N (signal-to-noise ratio) and response than the MRM. Finally, the HPLC-MS3 assay is successfully applied to monitor the TDM (therapeutic drug monitoring) of voriconazole in human plasma, and this verifies that the dosing guidelines for voriconazole have been well implemented in the clinic and patients have received excellent treatment.

1. Introduction

Experts recommend voriconazole, which is the first available second-generation triazole drug, as primary therapy for invasive aspergillosis [1]. It is also used prophylactically by clinicians to avoid serious infections in immunosuppressed organ transplant recipients. The therapeutic drug monitoring (TDM) of voriconazole is not consistently recommended because it exhibits nonlinear pharmacokinetics, predictability of its accumulation or elimination is limited [2] and it has high interpatient and intrapatient variability. However, that the serum concentration of voriconazole is frequently monitored during and after severe inflammation is critical to maintain the serum concentration of voriconazole within the therapeutic range in elderly individuals [3]. Moreover, according to guideline recommendations, voriconazole serum concentrations should be monitored in patients with hepatic insufficiency, with drugs’ combination affecting voriconazole pharmacokinetics, with CYP2C19 gene mutations, with adverse drug events or poor efficacy of voriconazole, and which is life-threatening due to fungal infections. The TDM of voriconazole should also be determined in pediatric patients due to lack of experience with the drug and significant inter-individual variation [4]. Closely monitoring voriconazole pharmacokinetics also helps individualize antifungal therapy for children [5]. Thus, it is suggested that TDM of voriconazole may be indispensable for treatment.
For TDM of voriconazole, there are many analytical assays have been developed, such as immunoassays [6], high-performance liquid chromatography (HPLC) [7], gas chromatography mass spectrometry (GC-MS) [8] and liquid chromatography tandem mass spectrometry (LC-MS/MS) [9]. However, when a value close to the lower limit of the therapeutic range, an overestimation of immunoassay (systematic error of 0.39 μg/mL) is detected [10] and the enzyme multiplied immunoassay technique (EMIT)-measured levels are higher than those of HPLC [11]. Compared with HPLC assays with ultraviolet or fluorescence detection, the LC-MS/MS assays have improved selectivity, sensitivity, accuracy and precision. Just to our knowledge, it is not reported that the technique of MS3 is used to detect voriconazole in biological samples.
The MS3 detection, a scanning mode of Q-Q-Trap tandem mass spectrometry, for both of which the excitation efficiency and the scanning rate (20,000 Da/s) are significantly improved [12,13]. For MS3 detection, the precursor ions of analyte are firstly selected in Q1 and then fragmented in Q2 to produce ions that are captured in Q3. A specific product ion is then selected for secondary fragmentation in a linear ion trap, and second-generation fragment ions are scanned out to the detector. It improves the selectivity and lower limit of detection values by removing interference and background noise [14,15].
In this paper, we present an LC-MS3 method to intend to improve the quantitative comparison of voriconazole after medication of patients. As we know, this is the first time voriconazole has been quantified by using the LC-MS3 method in human plasma. Overall, there is a large intra- and inter-individual variability in voriconazole, and the need for individualized administration of voriconazole is well established.

2. Results and Discussion

2.1. Optimization of HPLC Conditions

A C18 column, which is suitable for the retention and separation of voriconazole from matrix components, is used for chromatography because it gives the best peak shape and resolution. Acetonitrile (ACN) is used as the organic solvent because of good retention and chromatographic resolution. Moreover, using 0.1% formic acid in water gives high signal intensity and negligible carryover. The rapid chromatographic separation and high sensitivity could be achieved by using a gradient elution method. Under the optimized conditions, the retention times of voriconazole and Carbamazepine-d2,15N (Car-d2,15N) are 4.14 and 3.89 min, respectively.

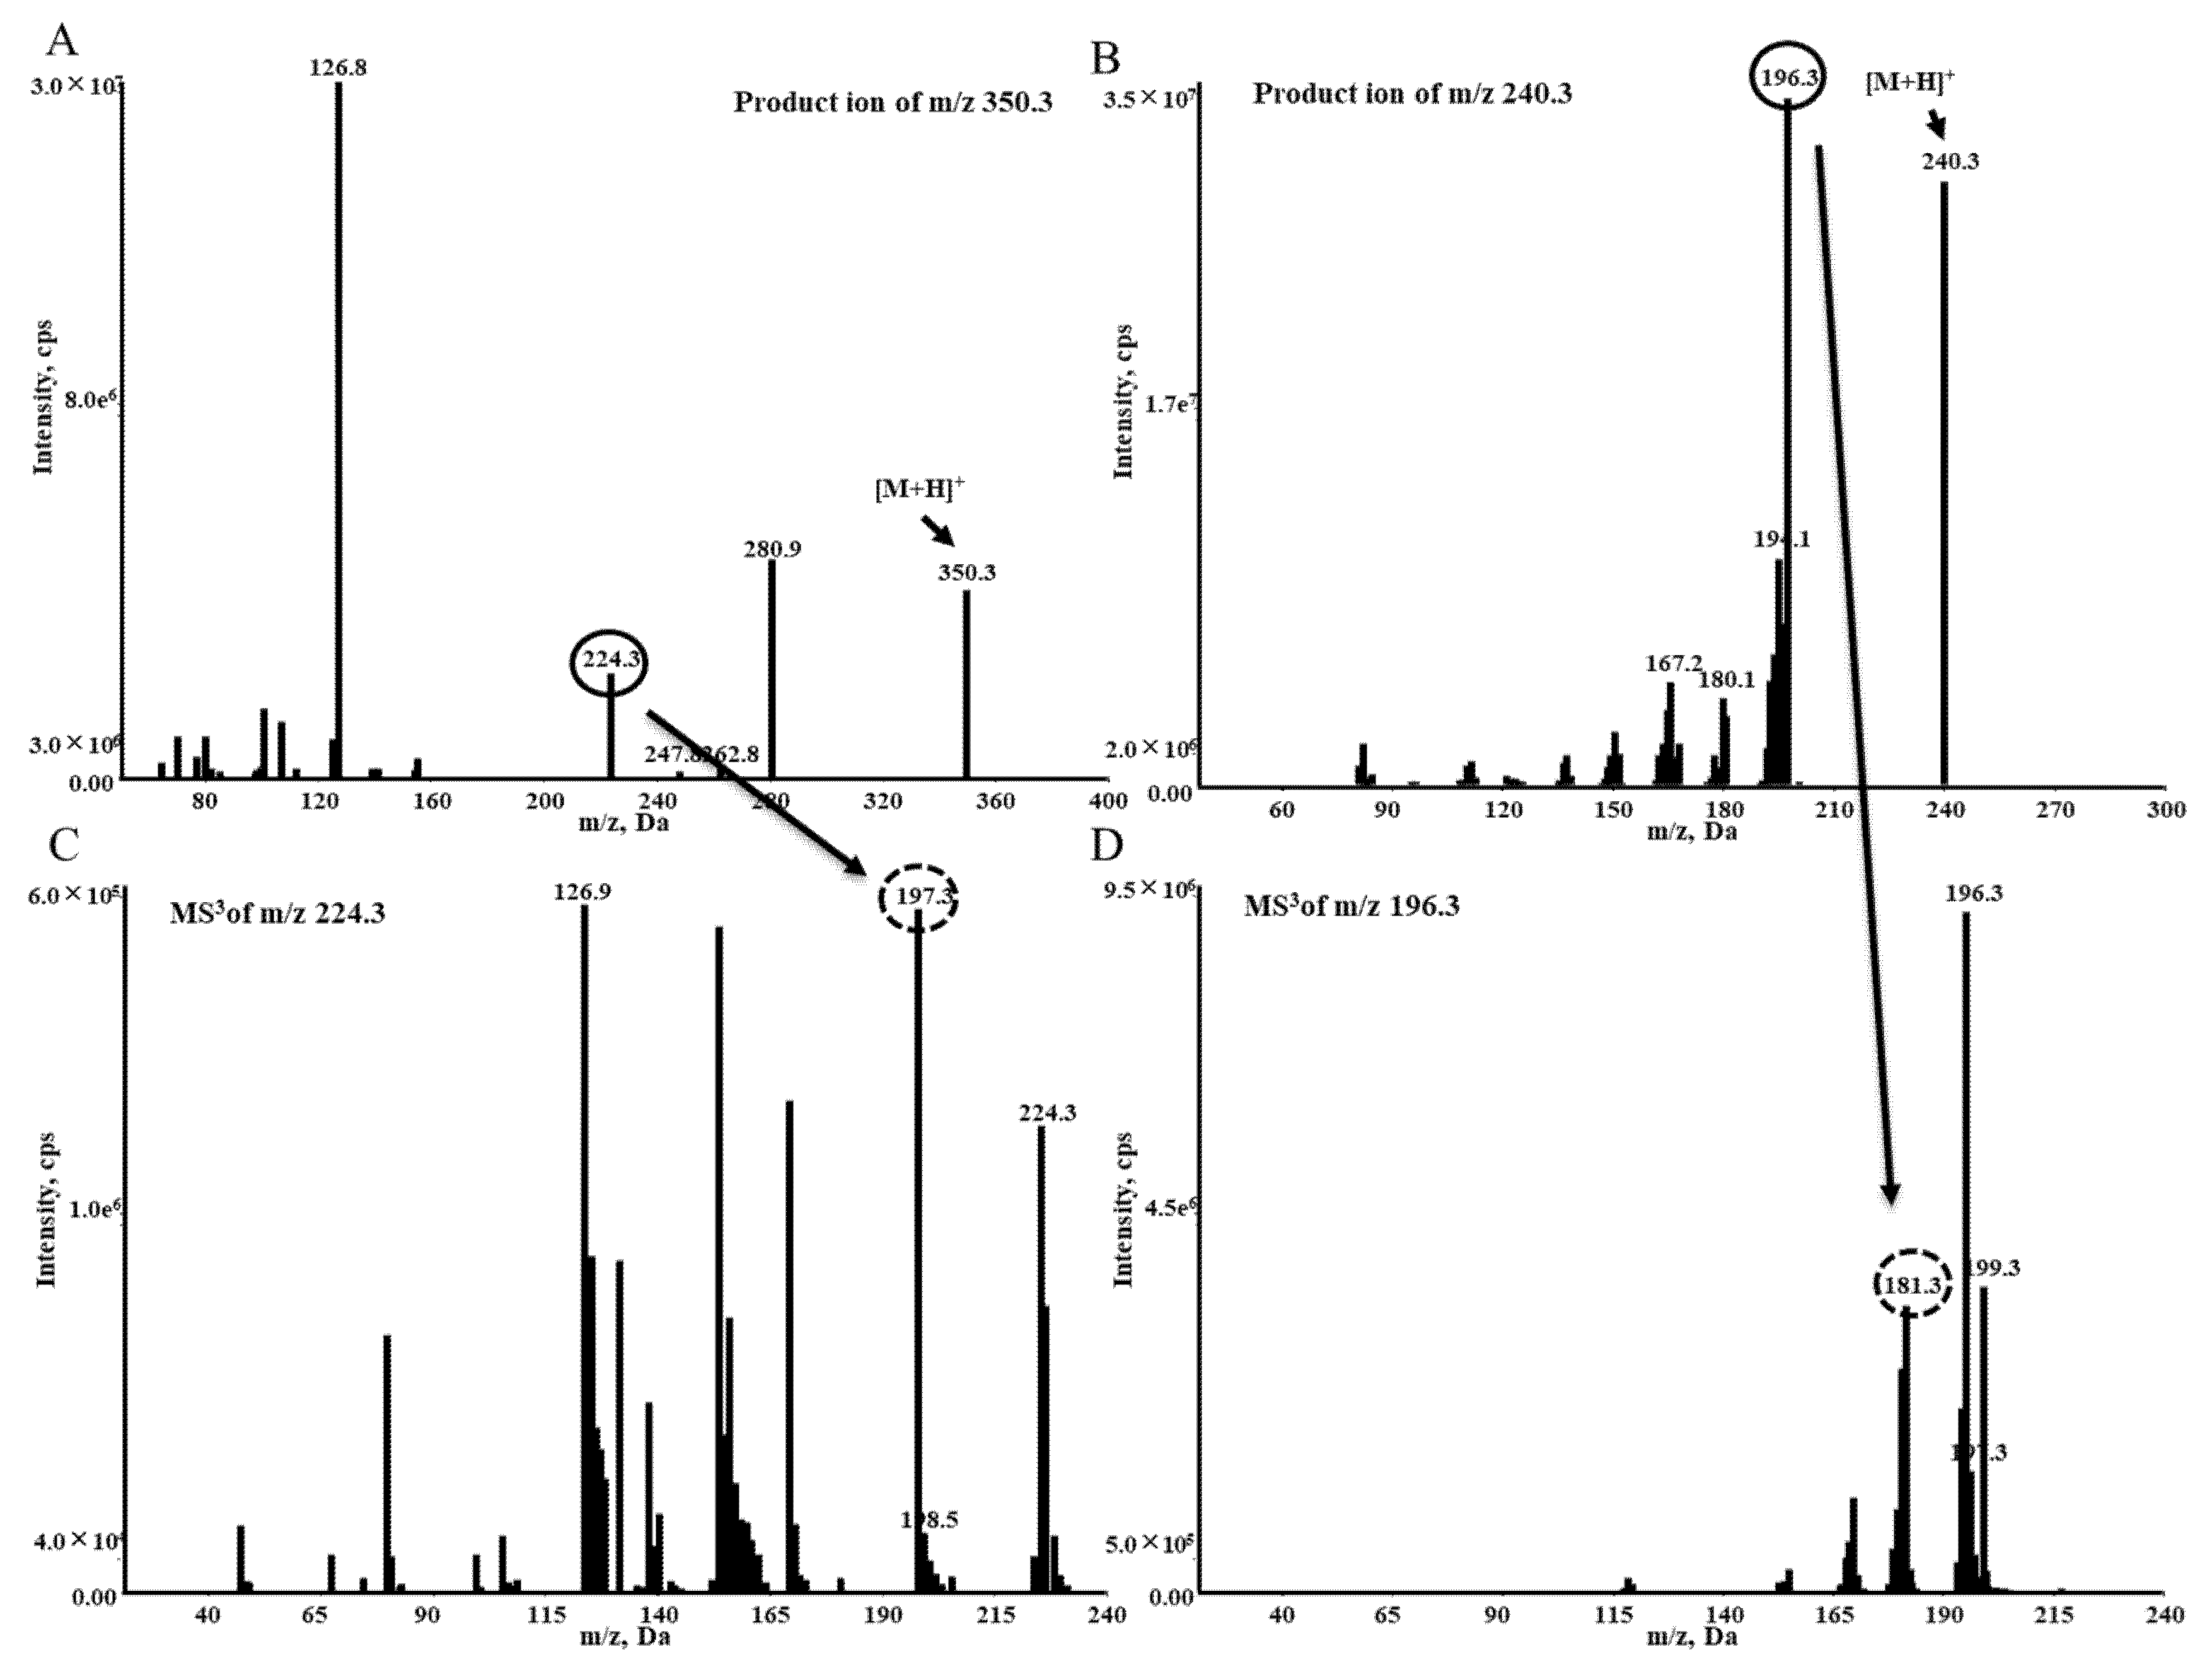
2.2. Optimization of MS Conditions

Both voriconazole and internal standard (IS) have the better sensitivity in positive ESI mode. The voriconazole and Car-d2,15N are detected by the transitions at m/z 350.3→224.3 and m/z 240.3→196.3 under MRM mode, respectively (Figure 1A,B). In the MS3 mode for voriconazole, the product ions at m/z 224.3 are further fragmented in the linear trap, and fragment ions at m/z 197.3 as a quantification trace and 126.9 are observed (Figure 1C). For IS, the daughter ions at m/z 181.3 are selected as a quantification trace (Figure 1D). Finally, the MS3 acquisitions use the transition ions at m/z 350.3→224.3→197.3 for detection of voriconazole (Figure 2A) and 240.3→196.3→181.3 for quantitation of IS (Figure 2B).
In the MS3, the collision energy (CE) is determined as 23 eV for voriconazole, 20 eV for IS. The excitation energy (AF2) is optimized to reveal a value of 0.1 V. The optimized MS parameters are shown in Table 1.

2.3. Sample Preparation

Based on the advantages of simplicity and rapidity, protein precipitation with methanol is selected for sample processing. In the research, the plasma: methanol 2:20 is found to give a high and stable recovery. To a 20 µL plasma is added 20 µL IS solution and 200 µL methanol to precipitate protein. Then, to ensure g enough sensitivity and ignored matrix effects, the supernatants from protein precipitation are diluted three times with water. In this study, the LOQ (lower limit of quantitation) of 0.25 μg/mL is sufficient and could be easily reduced by using more plasma or less dilution or more injection volume.

2.4. Assay Validation

As shown in representative LC-MS3 chromatograms of voriconazole and Car-d2,15N (Figure 3), the assay is free of significant interference at the retention times. The carry-over is negligible because of no enhancement for the response of voriconazole and Car-d2,15N in blank plasma samples (Figure 3A). In addition, cross-talk between MS channels is not observed at plasma samples (Figure 3C). The calibration curve (y = 0.1197x − 0.0181, r2 = 0.9996) shows good linearity in the range of 0.25–20 µg/mL. Accuracy and precision for the analysis of voriconazole in human plasma are shown in Table 2. Intra- and inter-day precision (relative standard deviation, RSD) are all within 8.72, and accuracies (relative error, RE) are all from 2.63 to 5.45 at the three concentrations. The actual concentrations as a percentage of nominal concentration for low, medium and high quality control (QC) samples, respectively, are shown by mean ± standard deviation (SD). Three concentrations of matrix effects are, respectively, as follows: 99.6 ± 4.5, 100.4 ± 5.6, 107.2 ± 2.8. No signification of suppression or enhancement signal is observed in both matrices. The recoveries are all within accepted limits (85~115%). The results also showed that the recoveries are all repeatable and concordant across the concentration range studied (Table 3). In terms of stability, the concentrations of voriconazole are within ±15% of nominal concentrations after storage at −80 °C for 2 weeks, 8 °C for 6 h, three freeze–thaw cycles and at room temperature (RT) for 8 h, which indicates there is no significant degradation of voriconazole under various storage conditions (Table 4).

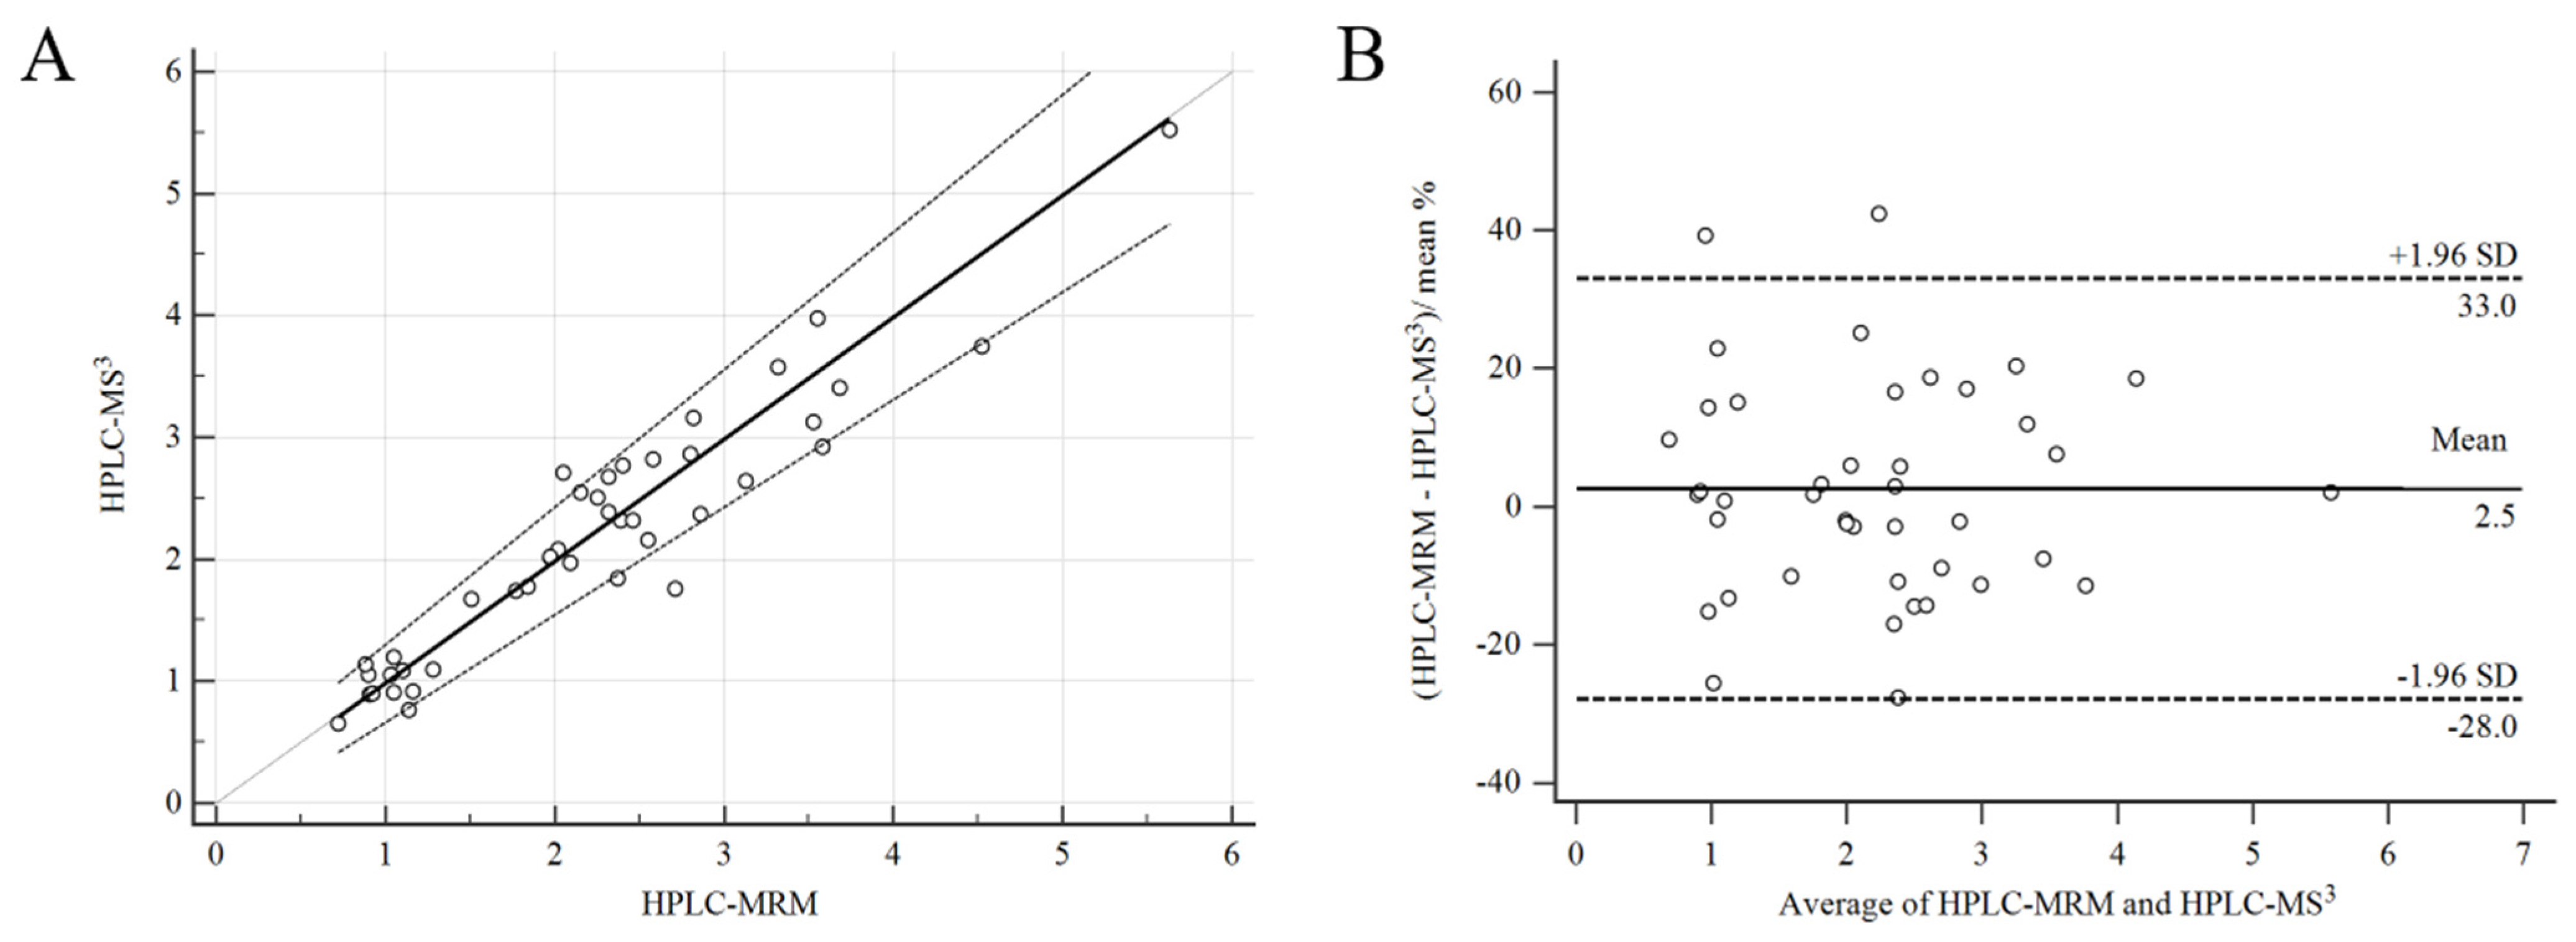
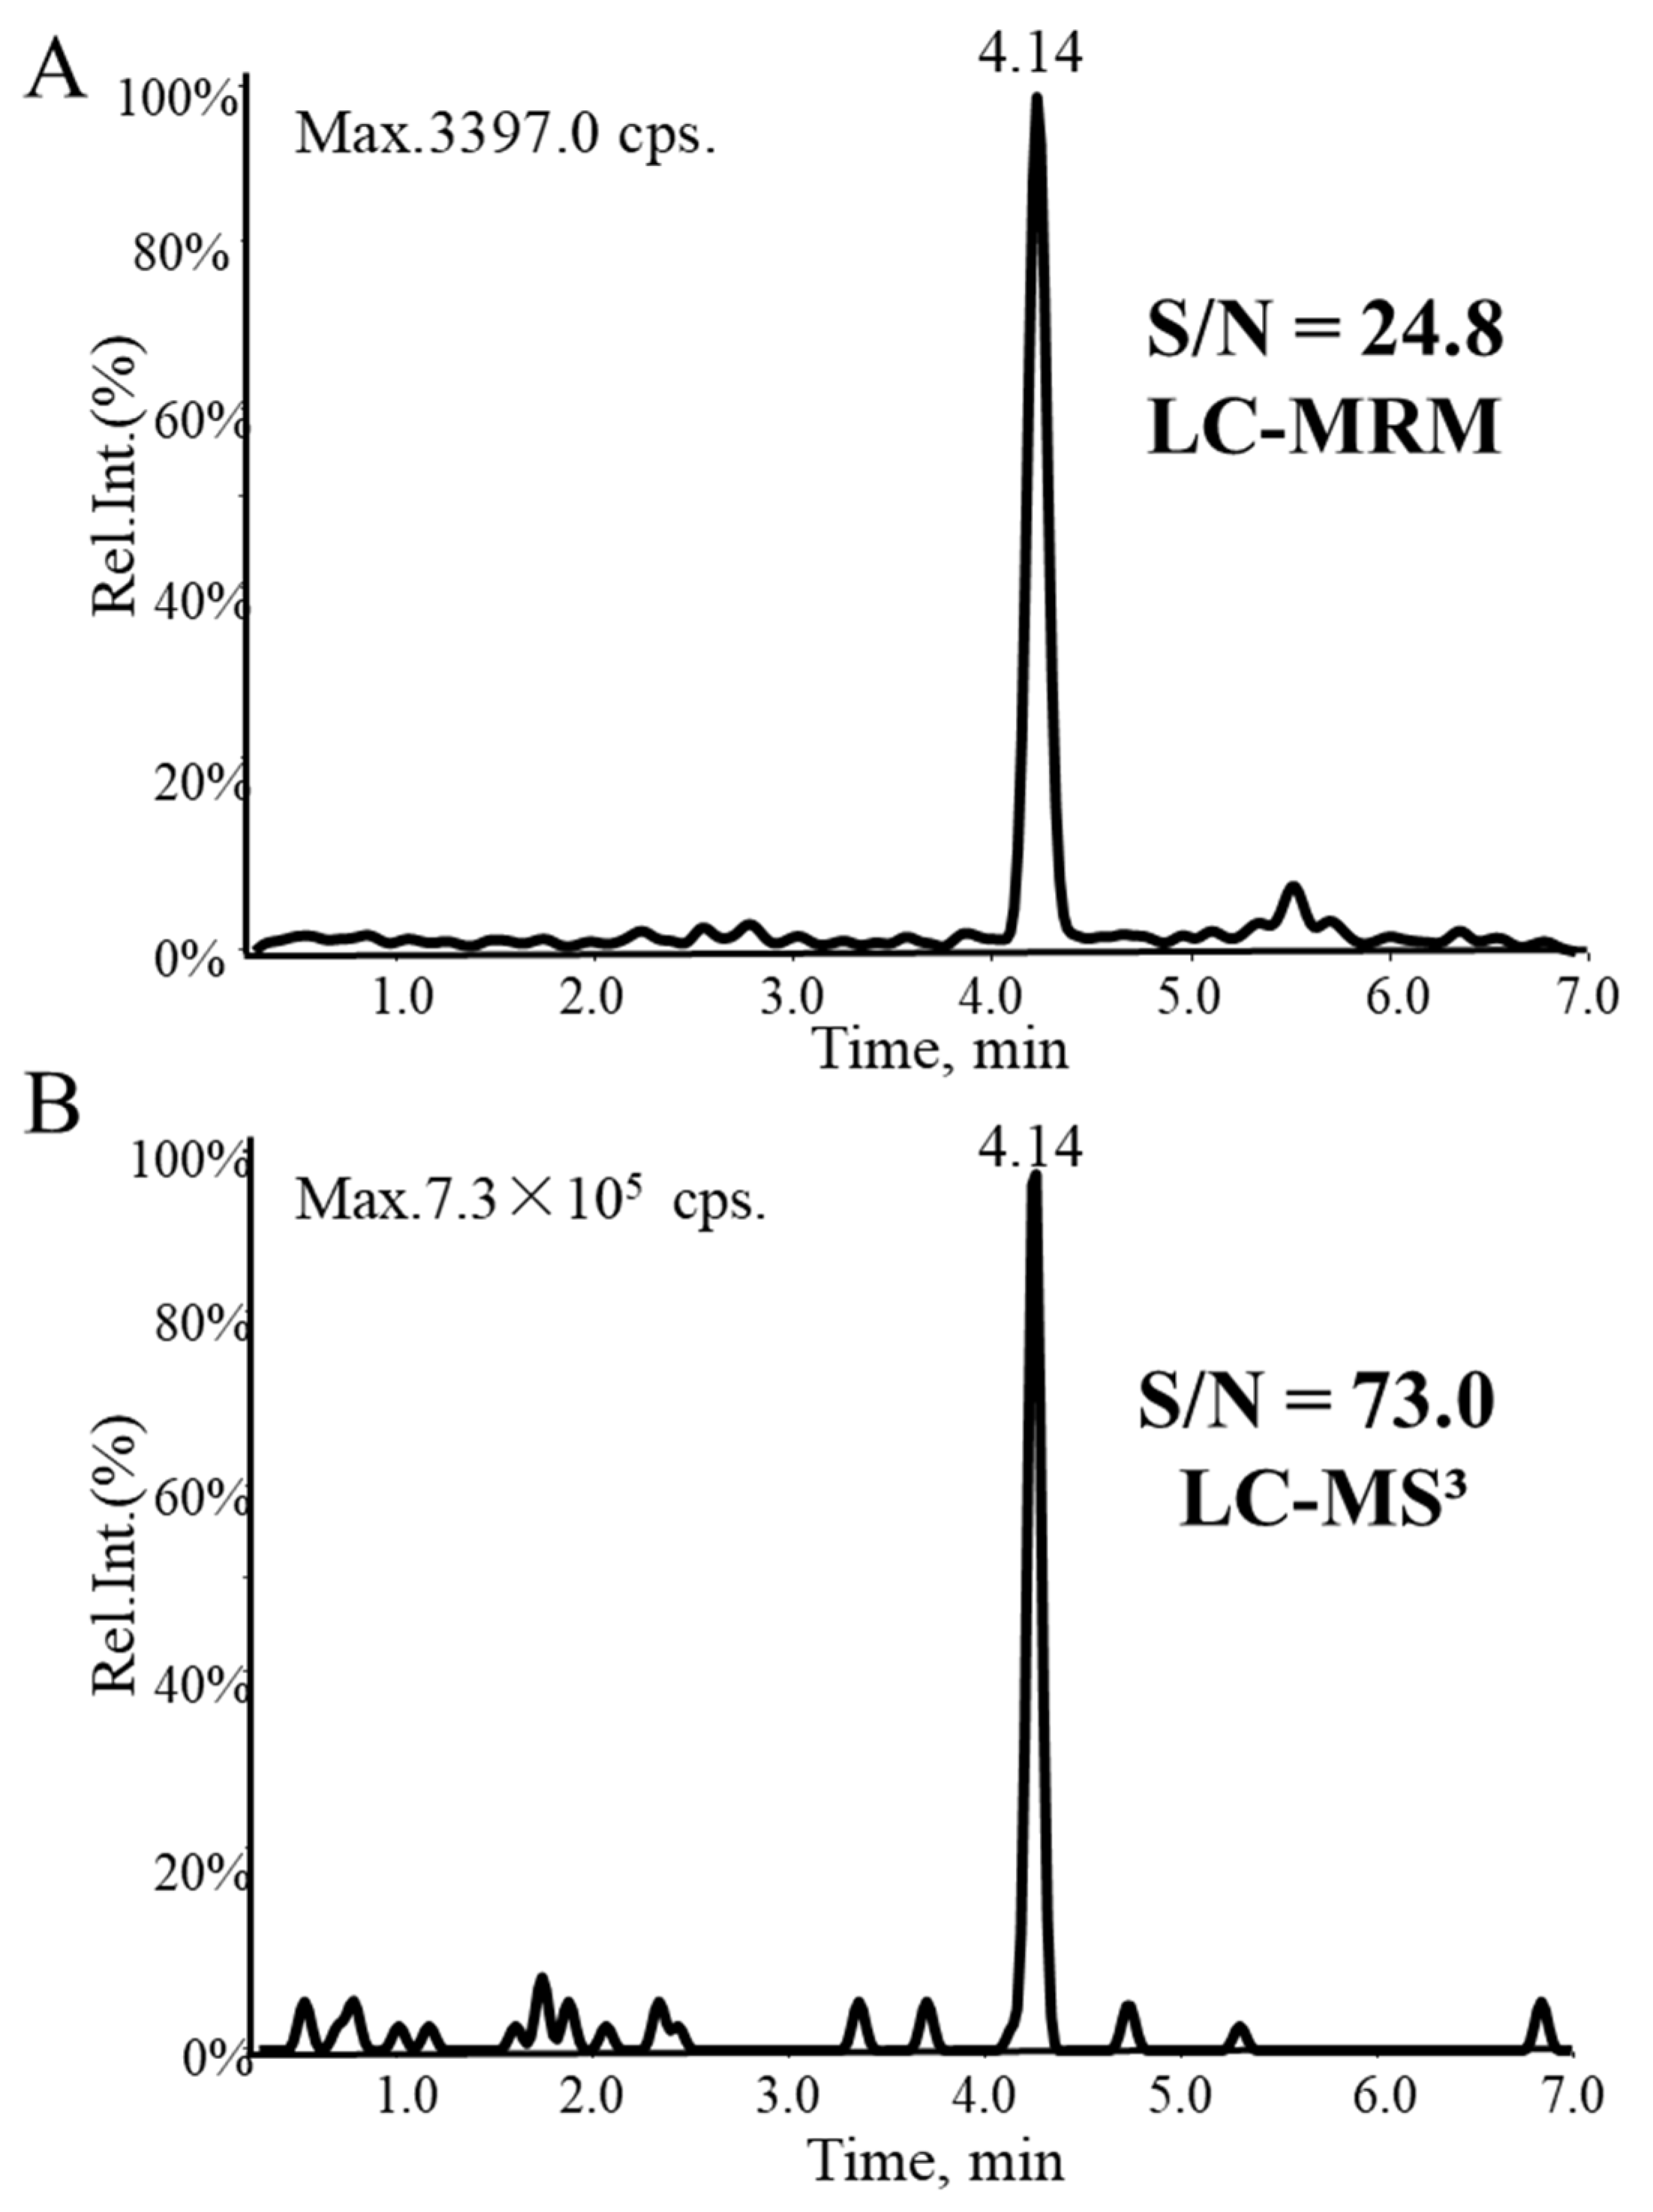
2.5. Comparison of HPLC-MS3 and HPLC-MRM Methods

An LC-MRM method using transitions at m/z 350.3→224.3 for voriconazole and m/z 240.3→196.3 for Car-d2,15N is optimized and compared with the LC-MS3 method. Compared with MS2 acquisition, an MS3 scan could maintain a higher level of sensitivity. The peak height of voriconazole at 0.25 μg/mL is just 3397.0 cps, and S/N is 24.8 with the MS2 method (Figure 4A). However, for MS3 acquisition, the peak height is 7.3 × 10⁵ cps and S/N is 73.0 (Figure 4B). This is because the MS3 scan mode reduces matrix interference and background noise by adding a fragmentation step. Therefore, the MS3 has a higher S/N and response than the MRM.

2.6. The Novelty and Significance of the LC-MS3 Method

The MS3 technique is restricted to Qtrap MS systems and ion trap MS systems; the LC-MS/MS system comprises a HPLC with a QTRAP hybrid linear ion trap triple quadrupole mass spectrometer in this study. As our knowledge, this is the first report of the use of the LC-MS3 technique for quantification of voriconazole in human plasma and its application in therapeutic drug monitoring. The advantages of the LC-MS3 method include high selectivity, high sensitivity and high signal to noise ratio. Compared to GC-MS, the MS3 method includes high through-put (7 min per sample) and small sample volume (only 20 µL) [8]. Compared to the LC-MS/MS that was reported, protein precipitation with methanol was selected for sample processing in the MS3 method, which is simple and rapid [16]. This study offers a novel promising alternative technique to the traditional LC–MRM technique, benefiting from the high selectivity and high sensitivity of LC-MS3 Technique.

2.7. Method Application

The validated HPLC-MS3 methods are applied for the quantification of the voriconazole concentration in 42 plasma samples from patients half an hour before drug administration. The comparison of the HPLC-MS3 and HPLC-MS2 method is shown in Figure 5. Passing–Bablok analysis to MS2 and MS3 methods provides a regression equation: y = −0.0187 + 1.001 x, p < 0.0001. The slope 95% CI included 1 (0.8830–1.1288), indicating that there is no proportional bias and 95% CI included 0 (−0.2213–0.1689), indicating the absence of an additional constant deviation (Figure 5A). A Bland–Altman test is also used to evaluate the agreement between the MRM and MS3 methods. In Figure 5B, that average concentration of voriconazole measured using two methods is as x-axis, and the percent difference of two methods as y-axis. In total, 95.2% of plots fell within maximum allowed difference (±1.96 SD). These results suggest that two methods can be reliably exchanged in analysis of voriconazole in human plasma.
The valley concentration of voriconazole is illustrated using HPLC-MS3 in Figure 6 and Table S1. The result shows that these expected values from 5.52 μg/mL are within the reference range from 0.50 μg/mL to 5.00 μg/mL [4]. This verified that the dosing guidelines for voriconazole have been well implemented in the clinic and patients have received excellent treatment.

3. Materials and Methods

3.1. Reagents and Chemicals

Standards for voriconazole (Figure 7A) were purchased from the A Chemtek Inc (ACT). Car-d2,15N for using as IS (Figure 7B) was provided by United States Biological. HPLC grade ACN and methanol were purchased from Fisher (Fair Lawn, NJ, USA). The formic acid was purchased from Merck (Darmstadt, Germany). Ultra-high purity water was prepared using a Milli-Q System (Millipore, Bedford, MA, USA).

3.2. LC-MS3 Conditions

Chromatography was performed on a Shimadzu Exion LCTM UPLC system (Kyoto, Japan) equipped with a binary pump, a degasser, a thermostatically controlled column compartment set at 40 °C and an auto sample manager (Kyoto, Japan) maintained at 8 °C. Separation was performed on a Poroshell 120 SB-C18 column (4.6 × 50 mm, 2.7 μm) using gradient elution with 0.1% formic acid in water (solvent A) and acetonitrile (solvent B) at a flow rate of 0.8 mL/min. The separation gradient program is as follows: 0.0–2.0 min, (25.0% B); 2.0–3.0 min, (25.0–65.0% B); 3.0–3.5 min: (65–75.0% B); 3.5–4.0 min (75.0–90.0% B); 4.0–4.5 min (90.0% B); 4.5–4.6 min (90.0–25.0% B); 4.6–7.0 min: (25.0% B).
MS analysis employed a Qtrap 5500 mass spectrometer (AB Sciex, Foster City, Canada) equipped with a TurboIonSpray™ source operated in the positive ion mode. In the MS3 mode, first generation product ions (MS2) were fragmented to yield the second generation product ions (MS3), which then underwent MS3 transitions. MS conditions were optimized by the syringe pump infusion of standard solutions of voriconazole and Carbamazepine-d2,15N. The optimized parameters were shown in Table 1. Data acquisition was controlled by Analysis 1.6.3 software.

3.3. Preparation of Calibration Standards and Quality Control Samples

A stock solution of voriconazole was prepared in methanol:water (50:50). Calibration standards were prepared by diluting standard solutions with blank human plasma to a final concentration of 0.25, 0.5, 1.0, 2.5, 5.0, 10.0 and 20.0 μg/mL. QC samples of 0.5, 2.5 and 10.0 μg/mL were prepared independently in a similar manner. A IS stock solution was diluted to 5 μg/mL. All solutions were stored at −80 °C until use.
The 20 μL calibration standards and QC samples were added to 20 μL IS working solution and 280 μL methanol. After vortexing for 5 min and centrifuging at 4 °C and at 15,000 rpm for 10 min, the mixture was diluted three times with water. Then, 2 μL of the supernatant was injected into the LC-MS system for analysis.

3.4. Assay Validation

The assay validation was performed in accordance with the biological method validation guidance of the U.S. Food and Drug Administration (FDA) [16,17]. The procedures for assay validation were selectivity, linearity, LOQ, extraction recovery, matrix effect, accuracy, precision and stability. The details are shown in Supplementary Materials.

3.5. Clinical Application

In order to demonstrate the applicability of the HPLC–MS3 method, 42 plasma samples from intensive care unit patients under treatment obtained from the First Hospital of Jilin University in 2021 were analyzed. The analysis of these samples was conducted to quantify the plasma levels of voriconazole. All plasma samples were obtained after centrifugation of blood in K2 EDTA vacutainer tubes which were immediately stored frozen (–20 °C) until sample preparation. The study is approved by the Human Research Ethics Committee of the First Hospital, Jilin University. Written informed consent was obtained from all subjects. The HPLC–MS3 method was compared to the HPLC–MS2 method to measure the concentrations of voriconazole from patients.
For analysis, 20 μL human plasma was added 20 μL IS working solution and 280 μL methanol, then vortexed for 5 min and centrifuged at 15,000 rpm and at 4 °C for 10 min. Then, after three times dilution, the 5 μL of the supernatant was injected into the LC-MS.

3.6. Statistical Analysis

Microsoft Excel 2016 and MedCalc were used to carry out data processing and graphic presentation. Passing–Bablok regression and Bland–Altman plot analyses were applied to evaluate the agreement between the HPLC-MRM and HPLC-MS3 method. Only when more than 67% of the sample pairs deviate within 1.96SD of the mean difference was the method sufficient to be an alternative quantitative method [17,18].

4. Conclusions

In this study, a simple, selective and high throughput LC-MS3 method for quantification of voriconazole in human plasma is developed and validated. The application of this LC-MS3 assay is completed on clinical samples, and it is proved that the developed LC–MS3 method is accurate and reliable. This work verifies that the dosing guidelines for voriconazole have been well implemented in the clinic and patients have received excellent treatment.

Supplementary Materials

The following supporting information can be downloaded at: https://www.mdpi.com/article/10.3390/molecules27175609/s1, The following supporting information contain Table S1: Concentrations of voriconazole in 42 human plasma samples are analyzed by HPLC-MS2 and HPLC-MS3 methods.

Author Contributions

Conceptualization, W.R. and L.Y.; methodology, L.Y.; validation, G.Z. and L.Y.; investigation, W.R.; writing—original draft preparation, W.R.; writing—review and editing, W.R., T.Z. and J.H; visualization, T.Z.; supervision, J.H.; funding acquisition, W.R. and J.H. All authors have read and agreed to the published version of the manuscript.

Funding

This work is supported by the Tenth Youth Fund of the First Hospital of Jilin University (Grant No. JDYY102019019) and Project of Jilin Provincial Department of science and technology (Grant No. 20200404167YY).

Institutional Review Board Statement

The study is conducted in accordance with the Declaration of Helsinki and approved by the Institutional Review Board (or Ethics Committee) of First Hospital of Jilin University (protocol code is 2022-088 and date of approval is 10 February 2022).

Informed Consent Statement

Informed consent was obtained from all subjects involved in the study.

Data Availability Statement

The data presented in this study are available on request from the corresponding author.

Conflicts of Interest

The authors declare that there are no conflicts to declare in this paper.

Sample Availability

Samples of the compounds are available from the authors.

References

  1. Moriyama, B.; Obeng, A.O.; Barbarino, J.; Penzak, S.R.; Henning, S.A.; Scott, S.A.; Agúndez, J.A.G.; Wingard, J.R.; McLeod, H.L.; Klein, T.E.; et al. Clinical pharmacogenetics implementation consortium (CPIC) guidelines for CYP2C19 and voriconazole therapy. Clin. Pharmacol. Ther. 2017, 102, 45–51. [Google Scholar] [CrossRef] [PubMed]
  2. Zhao, Y.C.; Lin, X.B.; Zhang, B.K.; Xiao, Y.W.; Xu, P.; Wang, F.; Xiang, D.X.; Xie, X.B.; Peng, F.H.; Yan, M. Predictors of adverse events and determinants of the voriconazole trough concentration in kidney transplantation recipients. Clin. Transl. Sci. 2020, 14, 702–711. [Google Scholar] [CrossRef] [PubMed]
  3. Cheng, L.; Xiang, R.; Liu, F.; Li, Y.; Chen, H.; Yao, P.; Sun, F.; Xia, P. Therapeutic drug monitoring and safety of voriconazole in elderly patients. Int. Immunopharmacol. 2020, 78, 160678. [Google Scholar] [CrossRef] [PubMed]
  4. Chen, K.; Zhang, X.; Ke, X.; Du, G.; Yang, K.; Zhai, S. Individualized medication of voriconazole: A practice guideline of the division of therapeutic drug monitoring, Chinese pharmacological society. Ther. Drug. Monit. 2018, 40, 12. [Google Scholar] [CrossRef] [PubMed]
  5. Allegra, S.; Fatiguso, G.; De Francia, S.; Favata, F.; Pirro, E.; Carcieri, C.; De Nicolò, A.; Cusato, J.; Di Perri, G.; D’Avolio, A. Therapeutic drug monitoring of voriconazole for treatment and prophylaxis of invasive fungal infection in children. Br. J. Clin. Pharmacol. 2018, 84, 197–203. [Google Scholar] [CrossRef] [PubMed]
  6. Jeon, Y.; Han, M.; Han, E.Y.; Lee, K.; Song, J.; Song, S.H. Performance evaluation of enzyme immunoassay for voriconazole therapeutic drug monitoring with automated clinical chemistry analyzers. Pract. Lab. Med. 2017, 8, 86–94. [Google Scholar] [CrossRef] [PubMed]
  7. Chawla, P.K.; Dherai, A.J.; Ashavaid, T.F. Plasma voriconazole estimation by HPLC. Indian J. Clin. Biochem. 2016, 31, 209–214. [Google Scholar] [CrossRef] [PubMed]
  8. Smith, A.; Leung-Pineda, V. Determination of voriconazole concentrations in serum by GC-MS. J. Clin. Lab. Anal. 2016, 30, 411–417. [Google Scholar] [CrossRef] [PubMed]
  9. Mak, J.; Sujishi, K.K.; French, D. Development and validation of a liquid chromatography-tandem mass spectrometry (LC-MS/MS) assay to quantify serum voriconazole. J. Chromatogr. B Anal. Technol. Biomed. Life Sci. 2015, 986–987, 94–99. [Google Scholar] [CrossRef] [PubMed]
  10. Peña-Lorenzo, D.; Rebollo, N.; Sánchez-Hernández, J.G.; Zarzuelo-Castañeda, A. Comparison of ultra-performance liquid chromatography and ARK immunoassay for therapeutic drug monitoring of voriconazole. Ann. Clin. Biochem. 2021, 58, 657–660. [Google Scholar] [CrossRef] [PubMed]
  11. Li, X.; Li, W.; Li, M.; Zhang, Z.; Liu, S.; Chen, Z. Correlation between enzyme multiplied immunoassay technique and high-performance liquid chromatography in the quantification of voriconazole in a paediatric population. Scand. J. Clin. Lab. Investig. 2021, 81, 121–126. [Google Scholar] [CrossRef] [PubMed]
  12. Yin, L.; Ji, Z.; Cao, H.; Li, Y.; Huang, J. Comparison of LC–MS3 and LC–MRM strategy for quantification of methotrexate in human plasma and its application in therapeutic drug monitoring. J. Pharm. Biomed. Anal. 2021, 205, 114345. [Google Scholar] [CrossRef] [PubMed]
  13. Ma, D.; Ji, Z.; Cao, H.; Huang, J.; Zeng, L.; Yin, L. LC–MS3 Strategy for Quantification of Carbamazepine in Human Plasma and Its Application in Therapeutic Drug Monitoring. Molecules 2022, 27, 1224. [Google Scholar] [CrossRef] [PubMed]
  14. Zhang, Z.; Li, R.; Liu, S.; Yin, L.; Xu, T.; Fawcett, J.P.; Gu, J. Liquid chromatography tandem mass spectrometry with triple stage fragmentation for highly selective analysis and pharmacokinetics of alarelin in rat plasma. J. Sep. Sci. 2019, 42, 3033–3040. [Google Scholar] [CrossRef] [PubMed]
  15. Ren, T.; Zhang, Z.; Fawcett, J.P.; Sun, D.; Gu, J. Micro-solid phase extraction and LC-MS(3) for the determination of triptorelin in rat plasma and application to a pharmacokinetic study. J. Pharm. Biomed. Anal. 2019, 166, 13–19. [Google Scholar] [CrossRef] [PubMed]
  16. Pauwels, S.; Vermeersch, P.; Eldere, J.V.; Desmet, K. Fast and simple LC–MS/MS method for quantifying plasma voriconazole. Clin. Chim. Acta 2012, 413, 740–743. [Google Scholar] [CrossRef] [PubMed]
  17. Kaza, M.; Karaźniewicz-Łada, M.; Kosicka, K.; Siemiątkowska, A.; Rudzki, P.J. Bioanalytical method validation: New FDA guidance vs. EMA guideline. Better or worse? J. Pharm. Biomed. Anal. 2019, 165, 381–385. [Google Scholar] [CrossRef] [PubMed]
  18. MEA/CHMP/EWP/192217/2009. Guideline on Bioanalytical Method Validation. The European Medicines Agency. 21 July 2011. Available online: https://www.ema.europa.eu/en/documents/scientific-guideline/guideline-bioanalytical-method-validation_en.pdf (accessed on 15 July 2022).
Figure 1. Representative product ion (MS2) for (A) voriconazole and (B) carbamazepine-d2,15N and MS3 for (C) voriconazole and (D) carbamazepine-d2,15N.
Molecules 27 05609 g001
Figure 2. The fragmentation of (A) voriconazole and (B) carbamazepine-d2,15N.
Molecules 27 05609 g002
Figure 3. LC-MS3 chromatogram of voriconazole (I) and carbamazepine-d2,15N (II) in (A) blank plasma, (B) at the LOQ with 0.25 μg/mL voriconazole and 5 μg/mL IS, and (C) a plasma sample.
Molecules 27 05609 g003
Figure 4. Representative chromatograms of voriconazole at the LOQ (0.25 μg/mL) analyzed by (A) LC-MRM and (B) LC-MS3. The S/N values are reported on the top of each peak.
Molecules 27 05609 g004
Figure 5. Comparison of voriconazole concentration in patient samples using HPLC-MRM and HPLC-MS3. (A) The solid black lines are the Passing–Bablok regression. (B) Bland–Altman analysis verifies the difference of voriconazole concentration measured using HPLC-MS2 and HPLC-MS3 in 42 human plasma samples.
Molecules 27 05609 g005
Figure 6. The concentration of voriconazole in 42 plasma samples from patients half an hour before drug administration using HPLC-MS3.
Molecules 27 05609 g006
Figure 7. Structures of (A) voriconazole and (B) Carbamazepine-d2,15N.
Molecules 27 05609 g007
Table 1. Optimized parameters for quantitation of voriconazole using LC-MS3.
ParametersMS3
VoriconazoleIS
MS3 transitions350.3→224.3→197.3240.3→196.3→181.3
Declustering potential (V)8080
Entrance potential (V)1010
Collision energy (eV)2320
Excitation energy (AF2) (V)0.10.1
Scan rate (Da/s)10,00010,000
LIT fill time (ms)8080
Excitation time (ms)2525
Turboheater temperature (°)450450
Ionspray voltage (V)55005500
Curtain gas (N2, psi)3030
Nebulizer gas (N2, psi)5050
Heater gas (N2, psi)5050
Table 2. Inter- and intra-day precision and accuracy for voriconazole in human serum (data are based on assay of six replicates on three different days).
DrugQC (μg/mL)Intra-Day Precision
(RSD%)
Inter-Day Precision
(RSD%)
Accuracy
(RE%)
0.58.720.522.63
Voriconazole2.56.642.374.96
103.663.685.45
Table 3. Absolute matrix effects (%) and recoveries (%) for voriconazole (data are mean ± SD for n = 4).
DrugQCMatrix Effects (%)Recovery (%)
Voriconazole0.5
2.5
10
99.6 ± 4.5
100.4 ± 5.6
107.2 ± 2.8
107.2 ± 7.7
103.6 ± 5.7
96.1 ± 6.0
Table 4. Stability of voriconazole under various storage conditions (data are mean ± SD, n = 3).
Low QCMiddle QCHigh QC
Long-term (−80 °C)98.5 ± 12.1101.7 ± 5.898.2 ± 5.1
Three Freeze-thaw100.7 ± 4.2108.0 ± 1.795.1 ± 5.6
Under autosampler conditions (8 °C)95.3 ± 6.7101.9 ± 9.0101.9 ± 3.2
Short-terms (4 h, RT)97.2 ± 5.3102.1 ± 4.0102.9 ± 3.3
Abbreviation: RT, room temperature.
Publisher’s Note: MDPI stays neutral with regard to jurisdictional claims in published maps and institutional affiliations.

