Abstract
This study was performed to investigate the effects of different supplemental light spectra and doses (duration and illuminance) on the essential oil of basil (Ocimum basilicum L.) cultivated in the net-house in Vietnam during four months. Ten samples of basil aerial parts were hydrodistilled to obtain essential oils which had the average yields from 0.88 to 1.30% (v/w, dry). The oils analyzed using GC-FID and GC-MS showed that the main component was methyl chavicol (87.4–90.6%) with the highest values found in the oils of basil under lighting conditions of 6 h/day and 150–200 µmol·m−2·s−1. Additional lighting conditions caused the significant differences (p < 0.001) in basil biomass and oil production with the highest values found in the oils of basil under two conditions of (1) 71% Red: 20% Blue: 9.0% UVA in at 120 μmol·m−2·s−1 in 6 h/day and (2) 43.5% Red: 43.5% Blue: 8.0% Green: 5.0% Far-Red at 100 μmol·m−2·s−1 in 6 h/day. The oils of basil in some formulas showed weak inhibitory effects on only the Bacillus subtilis strain. Different light spectra affect the biomass and essential oil production of basil, as well as the concentrations of the major components in the oil.
1. Introduction
Basil (Ocimum basilicum L.) is an herb, probably native to the tropical and subtropical regions of India, well known for its aromatic and medicinal properties. This herb contains a distinctive essential oil and is used in both fresh and dried culinary dishes, providing a variety of positive health benefits when consumed. Some of the reports demonstrated that basil has pharmacological effects such as anti-inflammatory [1,2,3], antioxidant [4,5], and bronchodilatory properties [6]. In addition, basil has strong immunomodulatory, antibacterial, antimutagenic, and chemopreventive effects [7]. Basil was used in the treatment of obstructive lung diseases, e.g., chronic obstructive pulmonary disease (COPD), asthma, and other respiratory disorders such as bronchitis, aspergillosis, tuberculosis, and lung cancer [8]. Due to the unique properties of smell, taste, and biological activities, Basil is highly appreciated in the world market with a steady increase of 1.3% cumulative average growth rate, which is projected to show an increase from 57 million USD in 2020 to 62 million USD in 2026 [9].
The composition as well as production of essential oils and bioactive compounds in plants are influenced by genetic and environmental factors. Among the environmental factors, light not only provides vital energy for plant growth and development but also acts as an external signal to trigger plant-specific responses [10]. It influences the accumulation of phytochemicals such as flavonoids, ascorbic acid, carotenoids, tocopherols, enzyme antioxidants, and the biosynthesis of essential oils. As chlorophyll pigments absorb mainly in the red (R) and blue (B) regions of light, these wavelengths are the major energy sources for photosynthetic CO2 assimilation [11]. The application of R and B LEDs for indoor cultivating basil has been investigated in many studies. Pennisi et al. (2019) [12] identified the role of the R: B ratio on the resource use efficiency of indoor basil cultivation, linking the physiological response to light with changes in yield and nutritional properties. The ratio of 3R:1B spectral fractions with a photosynthetic photon flux density (PPFD) of 215 ± 5 μmol·m−2·s−1 at a day/night cycle of 16/8 h provided high yield and chlorophyll content as well as improved water and energy use efficiency. It was concluded that the ratio of 3R:1B provided optimal growing conditions for the indoor cultivation of basil, fostering improved performances in terms of growth, physiological and metabolic functions, and resources use efficiency. Other research results reported that the ratio of 7R:3B in treatment with PPFD of 250 ± 10 μmol·m−2·s−1 and a day/night cycle of 16/8 h is optimal for basil [13]. In this light treatment, the highest antiradical activity, as well as the total phenolic and anthocyanin content were obtained. In particular, an amount of total phenolic content of 736.22 μg GAE/g FW that was achieved was 41 times higher compared to that obtained with white (W) light (17.86 μg GAE/g FW). The highest antiradical activity of 97.98% was also observed, much higher than the one (52.67%) recorded under R light. Essential oil compounds were shown to be strongly influenced by spectral light composition. It was reported that light spectra can coordinately change the composition of these compounds in the essential oil. It means that exposure to a specific light spectrum can alter the composition of the bioactive compounds in basil. Another study [14] Lobiuc et al. (2017) using different ratios of R: B illumination for basil showed that higher ratios of blue wavelength in the light treatments resulted in an increase in both chlorophyll a and chlorophyll b. Conversely, total phenolic and flavonoid contents, as well as free radical scavenging capacity, were higher when increasing the R light. At the ratio of 2R: 1B, the phenolic and flavonoid contents increase 1.87 and 2.06-fold, respectively, compared to W light.
Other less-efficient wavelengths such as far-red (FR), green (G), and ultraviolet (UV) lights are also important environmental signals for plants [15]. FR light reversed the effects of phytochrome leading to changes in gene expression, plant structure, and reproductive response [16]. FR-rich light increased stem length; enhanced apical dominance; accelerated flowering; reduced anabolic storage capacity, seed set, branching; shortened fruit development, and reduced seed quality [17,18]. G light has the lowest quantum yield, but it can penetrate deeper into the tree canopy due to its high transmittance and reflectance than other wavelengths, which explains why G light affects vegetative growth, organ growth, and plant tropism [16]. For basil, the addition of G light into the light treatment was reported by Lin et al. (2021) [19]. Results show that the ratio of 4R:1G:1B treatment provided many positive effects on the growth, development, and appearance of basil plants compared to 2:1:1 or 1:1:1 treatment. UV light is one important color that in many cases stimulates the production of secondary metabolites in plants [20], it also increases essential oils and enhances plant defense and protection against UV light [21]. UV-B or combined UV-A and UV-B light with white light were more effective than white light alone in increasing l-menthol and limonene concentrations in Mentha arvensis [22]. UV-A light treatment protects basil microgreens from hypocotyl elongation and enhances antioxidant properties in green-leaf basils increasing the significantly ABTS radical scavenging activity as well as higher ascorbic acid synthesis [23]. The addition of UV spectrum in the background RGB light (at the R: G: B ratio of 30.9:21.6:47.5) for basil treatment was reported by Kang et al. (2022) [24]. UV-A light (365–399 nm) at four dosages of 0, 35, 65 and 97 μmol·m−2·s−1 with the photoperiod of 16 h day/8 h night was added to the background RGB light for 14 days. It was reported that at the mild UV-A radiation (dosages of 35 and 65 μmol·m−2·s−1) supplemented with the main light, both yield and quality (the contents of acids, sugars, anthocyanins, and antioxidants) of sweet basil were increased.
The impact of mixed light based on R and B regions with UV-A, G and FR radiation for basil in terms of enhancing its composition, production, and antimicrobial activity of essential oil of basil planted in Vietnam has not been addressed yet. The rapid development of light-emitting diode (LED) technologies improves the economic output of plant production and quality. Therefore, the growth, composition, production, and antimicrobial activity of essential oils of basil planted in a net-house can be improved by supplemental light. In the present study, we focus on evaluating the effect of supplemental light sources in terms of spectral distribution and daily light dose (duration and illuminance) on the growth, composition, production, and antimicrobial activity of essential oils of basil planted in the net-house in Hanoi, Vietnam.
2. Results and Discussion
In this paper, we report on effects of different supplemental light spectra and doses on the essential oil productivity, composition and antimicrobial activity of basil cultivated in the net-house in Vietnam. The supplemental light conditions used for basil growing during four months were different in (i) ratio of light spectra: R:B:G:UVA:FR:W (that was presented in four groups of R:B:UVA~71:20:9, R:B:G~75:21:4, R:B:G:FR~43.5:43.5:8:5 and control with only natural sunlight, (ii) time of lighting: 4, 6, and 8 h/day, and (iii) intensity of light: 100, 150 and 200 μmol·m−2·s−1. The details of supplemental light conditions are presented later in the section “Materials and Methods” below.
2.1. The Effect of Light Spectra on Biomass and Essential Oil Production of O. basilicum
Under different supplemental light conditions, the biomass and essential oil yield of basil showed differences (Table 1). The highest plant height was found in the lighting formula F9 (118.55 cm/plant), followed by the one in the lighting formula F5 (104.50 cm/plant). These two values were significantly different (p = 0.001) with each other and with the ones in the other 8 formulas that ranged from 89.63 to 97.50 cm/plant. The formula F9 also gave the highest plant fresh weight (513.32 g/plant), followed by the formula F8 (390.65 g/plant) and F2 (399.50 g/plant). While the values varied from 290.40 to 334.62 g/plant from other formulas compared with 295.56 g/plant from the control formula F10.

Table 1.
Biomass and essential oil production of O. basilicum cultivated under different light conditions.
The supplemental light conditions affected the water content of basil fresh biomass. The plant water content of two formulas F8 and F9 was similar to the control formula F10. However, significant reductions (p < 0.001) in the plant water content were observed in all other formulas that varied from 73.30 % (in F2) to 77.04 % (in F1). The essential oil yields of plants in the supplemental light formulas were significantly different (p < 0.001) ranging from 0.88 to 1.30% (v/w), calculated on a dry weight (DW) basis, compared with 1.21% (v/w) in the control formula F10. In line with data of plant height and biomass, the highest essential oil content was found in F9 (1.30%) that indicates the optimal supplemental light condition for basil growth and oil production. The increase in the essential oil content was also found in the formula F4 (1.26%) as well as formula F8 (1.25%).
The estimated production of basil in the supplemental light formulas F2 and F9 showed the significant higher values than the other formulas at 0.05 level (p < 0.001), namely respective productions of fresh biomass (15.58 ton/ha and 20.02 ton/ha), dry biomass (4.16 ton/ha and 3.55 ton/ha), and oil (44.03 L/ha and 46.11 L/ha).
Thus, supplemental light condition of formulas F2 (71% R: 20% B: 9% UVA at 120 µmol·m−2·s−1 in 6 h/day) and F9 (43.5% R:43.5% B:8.0% G:5.0% FR at 100 µmol·m−2·s−1 in 6 h/day) were the most suitable for the growth of basil that produced the highest biomass and essential oil productivity among all supplementary light conditions of the present study (Table 1).
The ranges of basil fresh biomass, dry biomass and oil production in this research are slightly higher than the ones previously reported [25]. It was reported that the fresh and/or dry weight of basil under different lighting conditions can be varying depending on the time of year [26]. Other research indicated a positive relationship between basil biomass and the Daily Light Integrals (DLIs) observed [27,28] when growing basil under DLI conditions from 7.0–17.8 mol·m−2·d−1 that is not clear in the present study with the range of total DLIs (sum of average PPFD value and daily supplemental light) from 11.21–15.53 mol·m−2·d−1.
2.2. The Effect of Light Spectra on Essential Oil Composition of O. basilicum
In addition to the oil yield, the quality of basil is also evaluated by the chemical composition of its essential oil. Hydrodistillation of the shredded aboveground biomass of basil harvested from ten formulas produced pale yellow oils with the average relative densities of the oils d20 ranged from 0.951 to 0.961 g/mL, the refractive indices n20 ranged from 1.509 to 1.512 and the equal optical rotations [α]D20 = [+] 0.26° (Table 2). These values of oil densities are roughly equal to the ones previously reported but the values of refractive indices are slightly higher [29].
Table 2.
Some physical properties of essential oil of O. basilicum cultivated under different light conditions.
The identification of compounds present in the basil essential oils harvested from ten formulas was carried out using mass spectral (MS) and retention index (RI) data. Table 3 presents the identified compounds in order of their elution on the HP-5MS column used for the GC-MS analysis.
Table 3.
Composition of essential oils of O. basilicum cultivated under different light conditions.
A total of 20 to 27 compounds representing from 99.1% to 99.9% (by mass intensity) of the compositions were identified in the essential oils of basil cultivated under 10 different supplemental light conditions. These were comprised of dominant benzenoid aromatics ranging from 88.4 to 91.6% of the oils. While monoterpene hydrocarbons, oxygenated monoterpenes, sesquiterpene hydrocarbons, and oxygenated sesquiterpenes of the oils were at very low concentrations.
The difference between composition of the basil oils in 10 different supplemental lighting formulas is negligible with respect to the concentrations of methyl chavicol (=estragole); the main component ranged from 87.4 to 90.6%. The order of methyl chavicol content in basil oils is as follows: F7 = F8 > F10 > F2 = F5 > F3 > F4 = F9 > F6 > F1 (Table 3). Additional lighting time and light intensity may have influenced the concentration of basil essential oil compounds. Specifically, under the conditions of lighting time of 6 h/day (formulas F2 and F5) and light intensity of 150–200 µmol·m−2·s−1 (formulas F7 and F8), the methyl chavicol concentrations were higher than under the other conditions of lighting time and light intensity (Table 3).
The high content of methyl chavicol in basil in the formulas F2 and F5 could be influenced by both lighting duration and illuminance. Siposs et al. (2021) and Ahmed et al. (2020) [30,31] suggested that the optimal lighting condition for basil is 16–18 h/day at PPFD 200–250 µmol·m−2·s−1, which is comparable to the formulas F2 and F5 in the present study with supplemental lighting conditions of 6 h/day (total lighting duration of 20 h/day) at PPFD 120 µmol·m−2·s−1. In the formulas F7 and F8, the highest methyl chavicol content in basil can be attributed, in addition to lighting duration and illuminance, which is 6 h/day (total lighting duration is 20 h/day) at PPFD 150–200 µmol·m−2·s−1 -equivalent to DLI 14.45–15.53 mol·m−2·d−1, the composition of the light spectra has a higher ratio of B (43.5%). Its value is in agreement with the results reported by Hosseni (2018) [13] where the highest methyl chavicol was obtained under light B at DLI 14.4 mol·m−2·d−1 (16 h/day and PPFD 250 µmol·m−2·s−1).
Basil oil compositions have been divided into 7 chemotypes: (1) high linalool, (2) linalool/eugenol, (3) methyl chavicol without linalool, (4) methyl chavicol/linalool, (5) methyl eugenol/linalool, (6) methyl cinnamate/linalool and (7) bergamotene chemotypes [32]. Many earlier studies reported different major components identified in basil essential oils such as linalool, estragole and 1,8-cineole [33], 1,8-cineole, linalool, and geraniol [34], linalool followed by methyl eugenol and 1,8-cineol [35], methyl chavicol and methyl eugenol [36], linalool and methyl chavicol [7], methyl chavicol = estragole [37,38]. The differences in the main components of basil oil were mainly reported to be due to different varieties and geographical regions and countries. However, it is also revealed from the literature that light spectra affect the contents of some main compounds of basil essential oil [39], especially the content of methyl chavicol. Under condition of W light (intensity of 250 ± 10 µmol·m−2·s−1 PPFD, day/night cycles of 16/8 h after 30 days), methyl chavicol content in purple basil oil was highest (71.87%) [13]. The present study results are also similar to that of the published study. Specifically, the content of methyl chavicol in basil essential oil in formulas F7 and F8 supplemented with W light (additional lighting 3W: 5B: 6R: 1FR, at intensity of 150–200 µmol·m−2·s−1 reached the highest value (90.6%).
2.3. The Effect of Light Spectra on Antimicrobial Activity of Essential Oil of O. basilicum
The essential oils of basil grown in 10 different formulas were evaluated for antimicrobial activity against 7 strains: Staphylococcus aureus, Bacillus subtilis, Lactobacillus fermentum, Salmonella enterica, Escherichia coli, Pseudomonas aeruginosa, and Candida albicans. The essential oils of basil in 6 formulas from F2 to F7 showed weak inhibitory effects on B. subtilis with respective IC50 values of 6223, 6144, 12,698, 13,995, 5660, and 6349 µg/mL. The IC50 values of the oils on other 6 microorganism strains and all the 7 MIC values of the oils exceeded 16,384 µg/mL. Table 4 presents basil oil samples with inhibition activity against tested microbial strains.
Table 4.
Antimicrobial activity of essential oils of O. basilicum cultivated under different light conditions.
The presence of high concentration of methyl chavicol and low concentration of linalool in the Basil oils in the present study may explain for the weak antimicrobial activity of the oils. A previous study showed that methyl chavicol is devoid of antimicrobial activity [40]. Likewise, basil oil with major constituents identified as methyl eugenol (39.3%) and methyl chavicol (38.3%) was found to be active against bacteria and fungi [36]. On the other hand, some other studies demonstrated that higher linalool-containing oils of basil exhibited higher antimicrobial activity [41,42].
No relationship was found between supplemental lighting conditions and the antimicrobial activity of basil essential oil in this study. However, previous studies showed that the antimicrobial activity of essential oils depends on their main compounds. On the other hand, supplemental lighting for basil with different light spectra can alter the content of its oil main compounds. Therefore, in the future, it is possible to find a certain light spectrum/mixture of light spectra that drastically changes the contents of the main compounds in basil essential oil, thereby increasing the oil’s antimicrobial activity.
3. Materials and Methods
3.1. Plant Materials and Growth Conditions
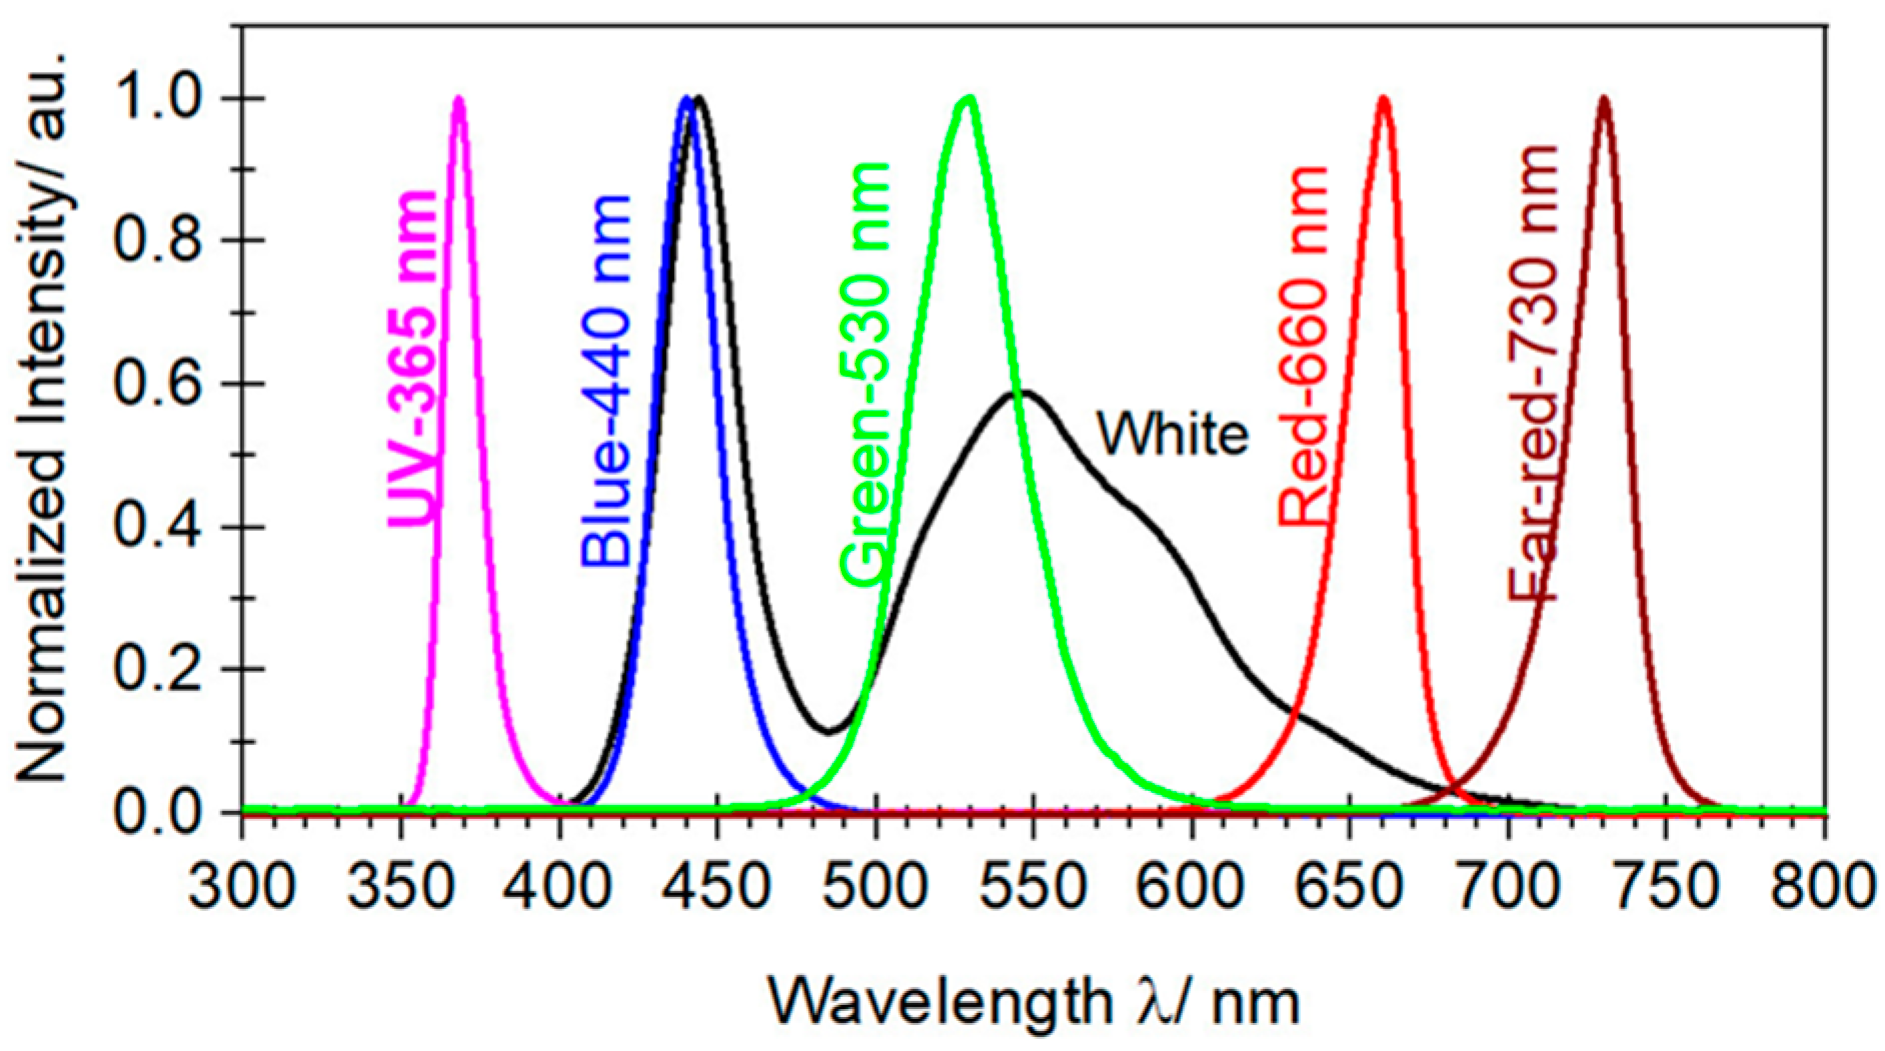
The experiments were set up in a net-house in Hanoi, VN (N 21°04′08′′, E 105°45′50′′) with 40% diffused light transmission being determined using relating photosynthetic photon flux density (PPFD) (400–700 nm) inside to outside the net-house. The basil seeds, purchased from Duc Thang Company in Hanoi, were sown in March 2021, then the seedlings were transplanted in April and a supplemental light experiment was held from May to September 2021. Daylight illuminance in a net-house was measured by the DigiSense Data Logging Light Meter (Model 20250-00), which was converted into Daily Light Integral (DLI) using conversion factors as described in the literature [43,44]. An average PPFD value of 11.21 mol·m−2·d−1 was determined for experimental time (in May 11.34, June: 11.44, July: 12.04, August: 10.92 and September: 10.31 mol·m−2·d−1). The supplemental LED lighting was applied after sunset and before sunrise with ten different light formulations as described in Table 5 with 15 plants in each formula and 3 replications. LED lights generated a wide continuous spectrum with UV (peak at 365 nm), B (peak at 440 nm), G (peak at 530 nm, R (peak at 660 nm), and FR (peak at 730 nm) measured by USB2000+ Fiber Optic Spectrometer, shown in Figure 1. The techniques for planting, caring, fertilizing, and harvesting basil plants were carried out according to the previous document [45].
Table 5.
Supplemental light conditions in cultivation of O. basilicum.

Figure 1.
Normalized spectral distribution of supplemental LEDs lighting.
3.2. Water Content Determination
Each basil sample was determined the water content using A&D Weighing AD-4714A General purpose moisture determination balance.
3.3. Essential Oil Isolation
Each basil sample consisting of aerial biomass of 15 plants (4.3–7.7 kg) was shredded and hydrodistilled for 4 h using a Clevenger type apparatus according to the previously published procedure [46] (Ministry of Health of Vietnam, 2017). The essential oil was then separated and stored at –5 °C for further analysis.
3.4. Determination of Essential Oil Physical Properties
Three physical properties of the essential oil including: relative density, refractive index and optical rotation were determined using the methods from the standards ISO 279:1998, ISO 280:1998 and ISO 592:1998, respectively.
3.5. GC-MS and GC-FID Analysis
The essential oils were analyzed by GC/MS-FID using an Agilent GC7890A system with Mass Selective Detector (Agilent 5975C). An HP-5MS fused silica capillary column (60 m × 0.25 mm i.d. × 0.25 μm film thickness) was used. Helium was the carrier gas with a flow rate of 1.0 mL/min. The inlet temperature was 250 °C and the oven temperature program was as follows: 60 °C to 240 °C at 4 °C/min. The split ratio was 1:100, the detector temperature was 270 °C, and the injection volume was 1 μL. The MS analysis was carried out at interface temperature 270 °C, MS mode, E.I. detector voltage 1258 V, and mass range 35–450 Da at 1.0 scan/s. FID analysis was carried out using the same chromatographic conditions. The FID temperature was 270 °C. Essential oil constituents were identified by their relative retention indices, determined by co-injection of a homologous series of n-alkanes (C5–C30), as well as by comparison of their mass spectral fragmentation patterns with those stored on the MS library NIST08, Wiley09, HPCH1607 [47,48] (Adams, 2017; Linstrom & Mallard, 2021). Data processing software was MassFinder 4.0 [49]. Component relative concentrations were calculated based on the area peak of FID chromatography without standardization.
3.6. Microbial Strains
The MIC and IC50 values of the oils were determined using 3 strains of Gram (+) bacteria including Staphylococcus aureus (ATCC 13709), Bacillus subtilis (ATCC 6633) and Lactobacillus fermentum (VTCC N4), 3 strains of Gram (−) bacteria including Salmonella enterica (VTCC), Escherichia coli (ATCC 25922) and Pseudomonas aeruginosa (ATCC 15442), 1 strain of yeast Candida albicans (ATCC 10231). The ATCC strains were obtained from American Type Culture Collection; the VTCC strains were obtained from Vietnam Type Culture Collection, Institute of Microbiology and Biotechnology, Vietnam National University, Ha Noi.
3.7. Screening of Antimicrobial Activity
MIC and IC50 of the essential oils were measured by the microdilution broth susceptibility assay [50,51]. Stock solutions of the oil were prepared in dimethylsulfoxide (DMSO). Dilution series were prepared from 16,384 μg/mL to 2 μg/mL (214, 213, 212, 211, 210, 29, 27, 25, 23, 21 μg/mL) in sterile distilled water in micro-test tubes, from where they were transferred to 96-well microtiter plates. Bacteria grown in double-strength Mueller-Hinton broth or double-strength tryptic soy broth, and fungi grown in double-strength Sabouraud dextrose broth were standardized to 5 × 10⁵ and 1 × 10³ CFU/mL, respectively. The last row, containing only the serial dilutions of sample without microorganisms, was used as a negative control. Sterile distilled water and medium served as a positive control. After incubation at 37 °C for 24 h, the MIC values were determined at the well with the lowest concentration of agents that completely inhibited the growth of microorganisms. The IC50 values were determined by the percentage of microorganisms inhibited growth based on the turbidity measurement data of EPOCH2C spectrophotometer (BioTeK Instruments, Inc., Highland Park Winooski, VT, USA) and Rawdata computer software (Intercity Business Park Mechelen Noord, Zone L Mechelen, 2800 Belgium) according to the following equations:
where: OD: optical density; control (+): only cells in medium without antimicrobial agent; test agent: corresponds to a known concentration of antimicrobial agent; control (−): culture medium without cells. HighConc/LowConc: voncentration of test agent at high concentration/low concentration; HighInh%/LowInh%: % inhibition at high concentration/% inhibition at low concentration.
Reference materials: Ampicillin for Gram (+) bacteria with IC50 and MIC values in the ranges of 0.02–3.62 µg/mL and of 0.125–32.0 µg/mL, Cefotaxime for Gram (−) bacteria with IC50 and MIC values in the range of 0.07–4.34 µg/mL and of 0.5–32.0 µg/mL, Nystatin for fungal strains with IC50 and MIC values of 1.32 µg/mL and 8.0 µg/mL.
3.8. Statistical Analysis
The measurements of physiological parameters and essential oil contents of basil were analyzed by a single factor completely randomized analysis of variance (ANOVA), which compared the lighting treatments. For the significant values, means were separated by the least significant difference (LSD) test at p ≤ 0.05 using IRRISTAT ver. 5.0 (International Rice Research Institute, Los Baños, Philippines).
4. Conclusions
This is the first study to provide the information on the various aspects of basil cultivated under ten different supplemental light spectra and dosages in Vietnam. The average yields of basil essential oils from 0.88 to 1.30% (v/w), calculated on a DW basis, were obtained. Methyl chavicol (=estragole) was the unique main component of the oils ranging from 87.4 to 90.6%. Additional lighting gave out effects on the growth and essential oil content of basil, as shown by the significant differences (p < 0.001) in biomass, oil yield and oil production between the lighting formulas. Supplemental light conditions of formulas F2 (71% R:20% B:9.0% UVA at 120 µmol·m−2·s−1 in 6 h/day) and F9 (43.5% R:43.5% B:8.0% G:5.0% FR at 100 µmol·m−2·s−1 in 6 h/day) were the most suitable for the growth of basil that produced the highest biomass (fresh: 15.58 ton/ha and 20.02 ton/ha; dry: 4.16 ton/ha and 3.55 ton/ha) and essential oil productivities (44.03 L/ha and 46.11 L/ha) among all supplementary light conditions of the present study. Additional lighting time and light intensity may have influenced the concentration of the major component of basil essential oil with higher contents of methyl chavicol under conditions of 6 h/day (formulas F2 and F5) and 150–200 µmol·m−2·s−1 (formulas F7 and F8) than under the other conditions. The essential oils from basil in formulas from F2 to F7 showed weak inhibitory effects on only Bacillus subtilis. However, no effect of supplemental lighting conditions on the antimicrobial activity of basil essential oil was recorded. The results of present study can be the basis for future research to promote the increase in biomass yield, production and quality of essential oils of plants.
Author Contributions
Conceptualization, H.T.T.C. and T.N.V.; methodology, H.T.T.C., T.N.V., T.Q.T. and Q.C.T.; validation, H.T.T.C. and T.N.V.; formal analysis, H.T.T.C., T.N.V. and T.T.T.D.; investigation, H.T.T.C., T.N.V., M.H.N. and Q.T.H.; resources, H.H.C. and P.T.D. data curation, H.T.T.C. and T.N.V.; writing—original draft preparation, H.T.T.C. and T.N.V.; writing—review and editing, H.H.C., T.Q.T., P.T.D. and W.N.S.; supervision, H.T.T.C., T.N.V. and Q.C.T.; project administration, Q.C.T. All authors have read and agreed to the published version of the manuscript.
Funding
This research was funded by Institute of Materials Science, Grant number CS.05/21-22.
Institutional Review Board Statement
Not applicable.
Informed Consent Statement
Not applicable.
Data Availability Statement
All data are available in this publication.
Acknowledgments
The authors thank Phan Quyen for the technical support.
Conflicts of Interest
The authors declare no conflict of interest.
Sample Availability
Samples of the compounds are available from the authors.
References
- Neamati, A.; Talebi, S.; Hosseini, M.; Boskabady, M.H.; Beheshti, F. Administration of Ethanolic Extract of Ocimum basilicum Leaves Attenuates Depression like Behavior in the Rats Sensitized by Ovalbumin. Curr. Nutr. Food Sci. 2016, 12, 72–78. [Google Scholar] [CrossRef]
- Złotek, U.; Szymanowska, U.; Karaś, M.; Świeca, M. Antioxidative and anti-inflammatory potential of phenolics from purple basil (Ocimum basilicum L.) leaves induced by jasmonic, arachidonic and β-aminobutyric acid elicitation. Int. J. Food Sci. Technol. 2016, 51, 163–170. [Google Scholar] [CrossRef]
- Saeidi, F.; Sajjadi, S.E.; Minaiyan, M. Anti-inflammatory effect of Ocimum basilicum Linn. seeds hydroalcoholic extract and mucilage on acetic acid-induced colitis in rats. J. Rep. Pharm. Sci. 2018, 7, 295–305. [Google Scholar]
- Eftekhar, N.; Moghimi, A.; Boskabady, M.H. The Effects of Ocimum basilicum extract and its constituent, rosmarinic acid on total and differential blood wbc, serum levels of NO, MDA, Thiol, SOD, and CAT in ovalbumin sensitized rats. Iran. J. Pharm. Res. 2018, 17, 1371–1385. [Google Scholar]
- Teofilović, B.; Grujić-Letić, N.; Gligorić, E.; Rašković, A.; Igić, R.; Vastag, G.; Gadžurić, S. Experimental and computational evaluation of extraction procedure and scavenging capacity of sweet basil extracts (Ocimum basilicum L.). Plant Foods Human Nutr. 2021, 76, 240–247. [Google Scholar] [CrossRef] [PubMed]
- Janbaz, K.H.; Hamid, I.; Qadir, M.I. Spasmolytic, bronchodilator and vasodilator activities of aqueous-methanolic extract of Ocimum basilicum. Int. J. Agric. Biol. 2014, 16, 321–327. [Google Scholar]
- Stanojević, L.J.P.; Marjanovic-Balaban, Z.R.; Kalaba, V.D.; Stanojević, J.S.; Cvetkovic, D.J.; Cakic, M.D. Chemical composition, antioxidant and antimicrobial activity of Basil (Ocimum basilicum L.) essential oil. J. Essent. Oil Bear. Plants 2017, 20, 1557–1569. [Google Scholar] [CrossRef]
- Aminian, A.R.; Mohebbati, R.; Boskabady, M.H. The Effect of Ocimum basilicum L. and Its Main Ingredients on Respiratory Disorders: An Experimental, Preclinical, and Clinical Review. Front. Pharmacol. 2022, 12, 805391. [Google Scholar] [CrossRef]
- Absolute Reports Global Basil Leaves Market Research Report. 2020. Available online: https://www.absolutereports.com/global-basil-leaves-market-15756862 (accessed on 6 May 2022).
- Li, Q.; Kubota, C. Effects of supplemental light quality on growth and phytochemicals of baby leaf lettuce. Environ. Exp. Bot. 2009, 67, 59–64. [Google Scholar] [CrossRef]
- Lin, K.H.; Huang, M.Y.; Huang, W.D.; Hsu, M.H.; Yang, Z.W.; Yang, C.M. The effects of red, blue, and white light-emitting diodes on the growth, development, and edible quality of hydroponically grown lettuce (Lactuca sativa L. var. capitata). Sci. Hortic. 2013, 150, 86–91. [Google Scholar] [CrossRef]
- Pennisi, G.; Sanyé-Mengual, E.; Orsini, F.; Crepaldi, A.; Nicola, S.; Ochoa, J.; Fernandez, J.; Gianquinto, G. Modelling environmental burdens of indoor-grown vegetables and herbs as affected by red and blue LED lighting. Sustainability 2019, 11, 4063. [Google Scholar] [CrossRef]
- Hosseini, A.; Mehrjerdi, M.Z.; Aliniaeifard, S. Alteration of bioactive compounds in two varieties of basil (Ocimum basilicum) grown under different light spectra. J. Essent. Oil Bear. Plants 2018, 21, 913–923. [Google Scholar] [CrossRef]
- Lobiuc, A.; Vasilache, V.; Pintilie, O.; Stoleru, T.; Burducea, M.; Oroian, M.; Zamfirache, M.M. Blue and red LED illumination improves growth and bioactive compounds contents in acyanic and cyanic Ocimum basilicum L. microgreens. Molecules 2017, 22, 2111. [Google Scholar] [CrossRef] [PubMed] [Green Version]
- Dou, H.; Niu, G.; Gu, M.; Masabni, J.G. Effects of light quality on growth and phytonutrient accumulation of herbs under controlled environments. Horticulturae 2017, 3, 36. [Google Scholar] [CrossRef]
- Folta, K.M.; Maruhnich, S.A. Green light: A signal to slow down or stop. J. Exp. Bot. 2007, 58, 3099–3111. [Google Scholar] [CrossRef]
- Devlin, P.F.; Yanovsky, M.J.; Kay, S.A. A genomic analysis of the shade avoidance response in arabidopsis. Plant Physiol. 2003, 133, 1617–1629. [Google Scholar] [CrossRef]
- Whitelam, G.C.; Halliday, K.J. Annual Plant Reviews: Light and Plant Development; John Wiley & Sons: Hoboken, NJ, USA, 2008; Volume 30. [Google Scholar]
- Lin, K.H.; Huang, M.Y.; Hsu, M.H. Morphological and physiological response in green and purple basil plants (Ocimum basilicum) under different proportions of red, green, and blue LED lightings. Sci. Hortic. 2021, 275, 109677. [Google Scholar] [CrossRef]
- Zhang, W.J.; Björn, L.O. The effect of ultraviolet radiation on the accumulation of medicinal compounds in plants. Fitoterapia 2009, 80, 207–218. [Google Scholar] [CrossRef]
- Goto, E. Plant production in a closed plant factory with artificial lighting. VII Int. Symp. Light Hortic. Syst. 2012, 956, 37–49. [Google Scholar] [CrossRef]
- Hikosaka, S.; Ito, K.; Goto, E. Effects of ultraviolet light on growth, essential oil concentration, and total antioxidant capacity of Japanese mint. Environ. Control Biol. 2010, 48, 185–190. [Google Scholar] [CrossRef]
- Vaštakaitė, V.; Viršilė, A.; Brazaitytė, A.; Samuolienė, G.; Jankauskienė, J.; Sirtautas, R.; Duchovskis, P. The effect of UV-A supplemental lighting on antioxidant properties of Ocimum basilicum L. microgreens in greenhouse. In Proceedings of the 7th International Scientific Conference Rural Development, Kaunas, Lithuania, 19–20 November 2015; pp. 1–7. [Google Scholar] [CrossRef]
- Kang, S.; Kim, J.E.; Zhen, S.; Kim, J. Mild-intensity UV-A radiation applied over a long duration can improve the growth and phenolic contents of sweet basil. Front. Plant Sci. 2022, 13, 858433. [Google Scholar] [CrossRef] [PubMed]
- Serafini, L.A.; Pauletti, G.F.; Rota, L.D.; Dos Santos, A.C.A.; Agostini, F.; Zattera, F.; Moyna, P. Evaluation of the essential oils from nine Basil (Ocimum basilicum L.) cultivars planted in Southern Brazil. J. Essent. Oil Bear. Plants 2009, 12, 471–475. [Google Scholar] [CrossRef]
- Carvalho, S.D.; Schwieterman, M.L.; Abrahan, C.E.; Colquhoun, T.A.; Folta, K.M. Light quality dependent changes in morphology, antioxidant capacity, and volatile production in sweet basil (Ocimum basilicum). Front. Plant Sci. 2016, 7, 1328. [Google Scholar] [CrossRef]
- Dou, H.; Niu, G.; Gu, M.; Masabni, J.G. Responses of sweet basil to different daily light integrals in photosynthesis, morphology, yield, and nutritional quality. HortScience 2018, 53, 496–503. [Google Scholar] [CrossRef]
- Walters, K.J.; Currey, C.J. Effects of nutrient solution concentration and daily light integral on growth and nutrient concentration of several basil species in hydroponic production. HortScience 2018, 53, 1319–1325. [Google Scholar] [CrossRef]
- Abbas, A.; Anwar, F.; Ahmad, N. Variation in physicochemical composition and biological attributes of common Basil essential oils produced by hydro-distillation and super critical fluid extraction. J. Essent. Oil Bear. Plants 2017, 20, 95–109. [Google Scholar] [CrossRef]
- Sipos, L.; Balázs, L.; Székely, G.; Jung, A.; Sárosi, S.; Radácsi, P.; Csambalik, L. Optimization of basil (Ocimum basilicum L.) production in LED light environments—A review. Sci. Hortic. 2021, 289, 110486. [Google Scholar] [CrossRef]
- Ahmed, H.A.; Yu-Xin, T.; Qi-Chang, Y. Optimal control of environmental conditions affecting lettuce plant growth in a controlled environment with artificial lighting: A review. S. Afr. J. Bot. 2020, 130, 75–89. [Google Scholar] [CrossRef]
- Zheljazkov, V.D.; Callahan, A.; Cantrell, C.L. Yield and oil composition of 38 basil (Ocimum basilicum L.) accessions grown in Mississippi. J. Agric. Food Chem. 2008, 56, 241–245. [Google Scholar] [CrossRef]
- Trevisan, M.T.S.; Silva, M.G.V.; Pfundstein, B.; Spiegelhalder, A.B.; Owen, R.W. Characterization of the volatile pattern and antioxidant capacity of essential oils from different species of the genus Ocimum. J. Agric. Food Chem. 2006, 54, 4378–4382. [Google Scholar] [CrossRef]
- Oliveira, J.S.; Porto, L.A.; Estevam CD, S.; Siqueira RD, S.; Barreto, P.B.; Niculau, E.d.S.; Blank, A.F.; Almeida, R.N.; Marchioro, M.; Quintans-Júnior, L.J. Phytochemical screening and anticonvulsant property of Ocimum basilicum leaf essential oil. Bol. Latinoam. Caribe Plantas Med. Aromat. 2009, 8, 195–202. [Google Scholar]
- Govindarajan, M.; Sivakumar, R.; Rajeswary, M.; Yogalakshmi, K. Chemical composition and larvicidal activity of essential oil from Ocimum basilicum (L.) against Culex tritaeniorhynchus, Aedes albopictus and Anopheles subpictus (Diptera: Culicidae). Exp. Parasitol. 2013, 134, 7–11. [Google Scholar] [CrossRef] [PubMed]
- Joshi, R.K. Chemical composition and antimicrobial activity of the essential oil of Ocimum basilicum L. (sweet Basil) from Western Ghats of NorthWest Karnataka, India. Anc. Sci. Life 2014, 33, 151–156. [Google Scholar] [CrossRef] [PubMed]
- Tran, T.H.; Nguyen, H.H.H.; Nguyen, D.C.; Nguyen, T.Q.; Tan, H.; Nhan, L.T.H.; Nguyen, D.H.; Tran, L.D.; Do, S.T.; Nguyen, T.D. Optimization of microwave-assisted extraction of essential oil from vietnamese basil (Ocimum basilicum L.) using response surface methodology. Processes 2018, 6, 206. [Google Scholar] [CrossRef]
- Chaleshtori, R.S.; Taghizadeh, M.; Arani, N.M.; Chaleshtori, F.S. A comparative study on the antibacterial activity of Artemisia dracunculus and Ocimum basilicum essential oils on multidrug resistant bacteria isolated from ready to eat foods. J. Essent. Oil Bear Plants 2018, 21, 701–712. [Google Scholar] [CrossRef]
- Amaki, W.; Yamazaki, N.; Ichimura, M.; Watanabe, H. Effects of light quality on the growth and essential oil content in sweet basil. VI Int. Symp. Light Hortic. 2011, 907, 91–94. [Google Scholar] [CrossRef]
- Bozin, B.; Mimica-Dukic, N.; Simin, N.; Anackov, G. Characterization of the volatile composition of essential oils of some Lamiaceae spices and the antimicrobial and antioxidant activities of the entire oils. J. Agric. Food Chem. 2006, 54, 1822–1828. [Google Scholar] [CrossRef]
- Hussain, A.I.; Anwar, F.; Sherazi, S.T.H.; Przybylski, R. Chemical composition, antioxidant and antimicrobial activities of basil (Ocimum basilicum) essential oils depends on seasonal variations. Food Chem. 2008, 108, 986–995. [Google Scholar] [CrossRef]
- Carović-Stanko, K.; Orlić, S.; Politeo, O.; Strikić, F.; Kolak, I.; Milos, M.; Satovic, Z. Composition and antibacterial activities of essential oils of seven Ocimum taxa. Food Chem. 2010, 119, 196–201. [Google Scholar] [CrossRef]
- Thimijan, R.W.; Heins, R.D. Photometric, radiometric, and quantum light units of measure: A review of procedures for interconversion. HortScience 1983, 18, 818–822. [Google Scholar]
- Torres, A.P.; Lopez, R.G. Measuring Daily Light Integral in a Greenhouse. Purdue Ext. 2012, 7, HO-238-W. Available online: http://www.extension.purdue.edu/store (accessed on 6 May 2022).
- La, D.M.; Luu, D.C.; Tran, M.H.; Nguyen, T.T.; Nguyen, T.P.T.; Tran, H.T.; Ninh, K.B. Essential—Oil Plants in Vietnam; Agriculture Publishing House: Hanoi, Vietnam, 2001; Volume I, pp. 144–147. [Google Scholar]
- Ministry of Health. Vietnamese Pharmacopoeia V; Medical Publishing House: Hanoi, Vietnam, 2017; pp. PL274–PL275.
- Adams, R.P. Identification of Essential Oil Components by Gas Chromatography, Mass Spectrometry, 4.1th ed.; Allured Publishing Corporation: Carol Stream, IL, USA, 2017; 804p, ISBN 978-1-932633-21-4. [Google Scholar]
- Linstrom, P.J.; Mallard, W.G. NIST Chemistry Webbook, NIST Standard Reference Database Number 69; National Institute of Standards and Technology: Gaithersburg, MD, USA, 2021; p. 20899. [Google Scholar] [CrossRef]
- König, W.A.; Joulain, D.; Hochmuth, D.H. Terpenoids Library—Terpenoids and Related Constituents of Essential Oils. Available online: https://massfinder.com/wiki/Terpenoids_Library (accessed on 15 October 2021).
- Hadacek, F.; Greger, H. Testing of antifungal natural products methodologies, comparability of result and assay choice. Phytochem. Anal. Int. J. Plant Chem. Biochem. Technol. 2000, 11, 137–147. [Google Scholar] [CrossRef]
- Cos, P.; Vlietinck, A.J.; Berghe, D.V.; Maes, L. Anti-infective potential of nature products: How to develop a stronger in vitro ‘proof-of-concept’. J. Ethnopharmacol. 2006, 106, 290–302. [Google Scholar] [CrossRef] [PubMed]
Publisher’s Note: MDPI stays neutral with regard to jurisdictional claims in published maps and institutional affiliations. |
© 2022 by the authors. Licensee MDPI, Basel, Switzerland. This article is an open access article distributed under the terms and conditions of the Creative Commons Attribution (CC BY) license (https://creativecommons.org/licenses/by/4.0/).