
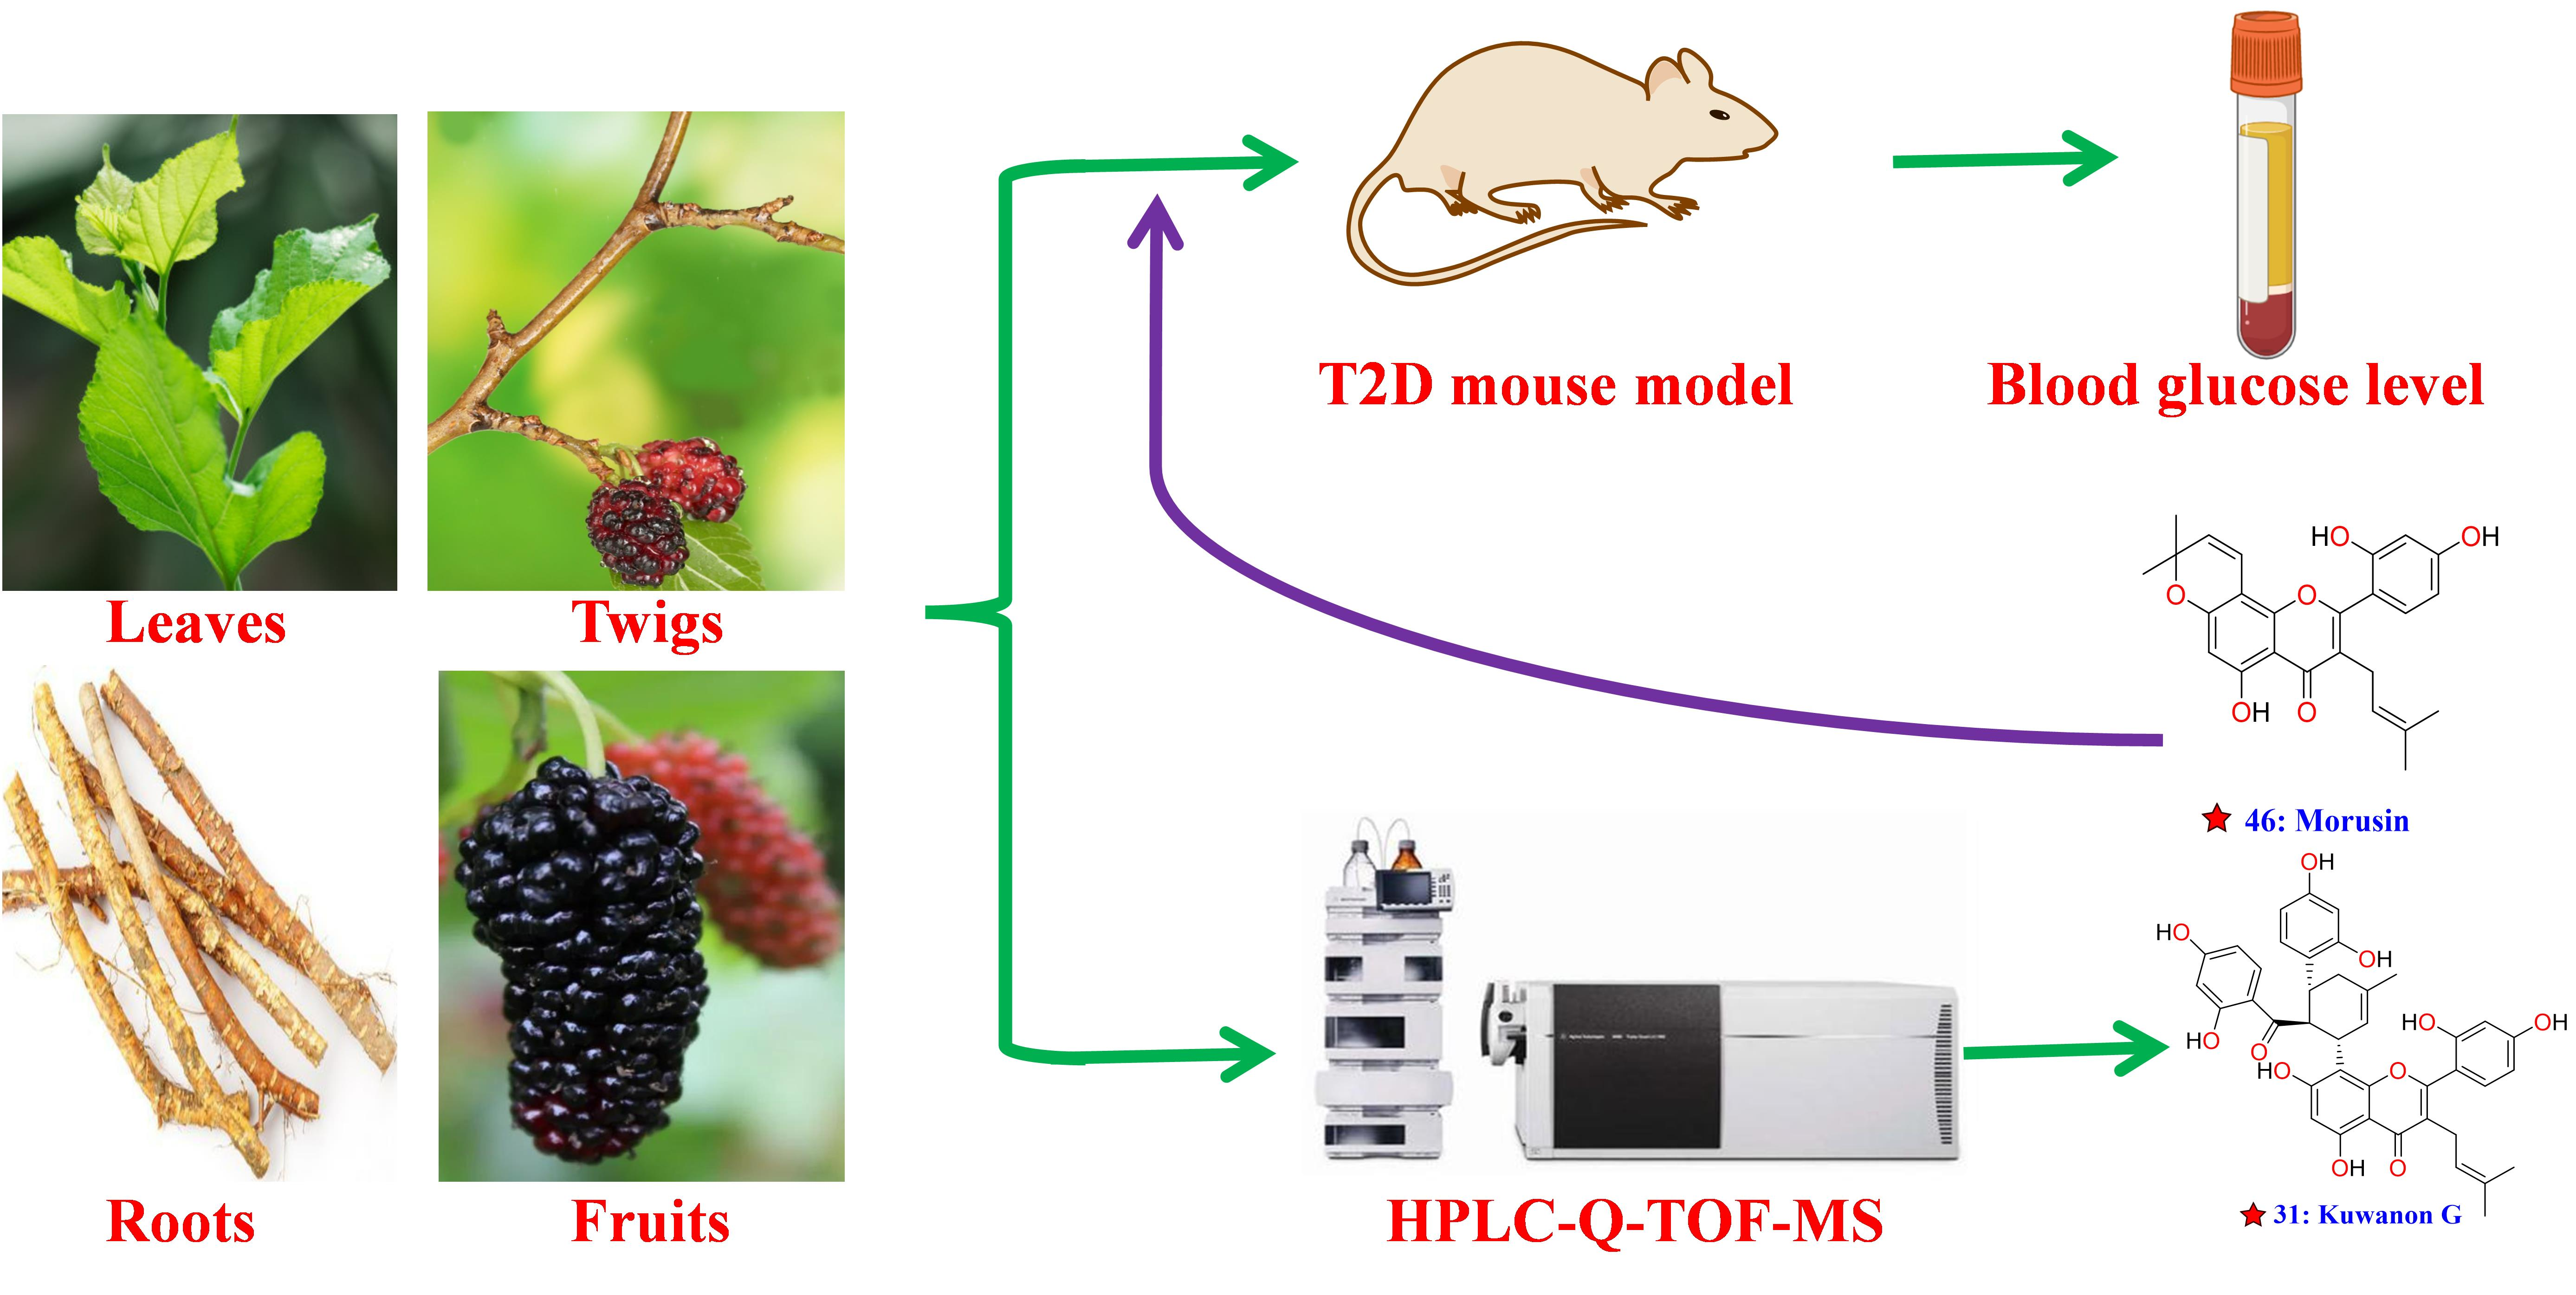
LC-MS Metabolite Profiling and the Hypoglycemic Activity of Morus alba L. Extracts

Abstract
: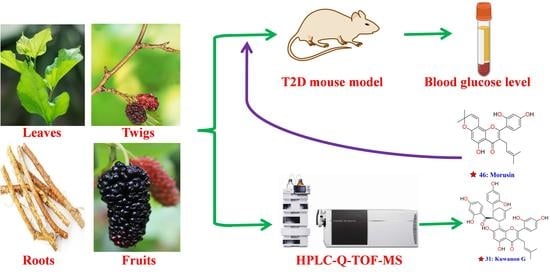
1. Introduction
2. Results and Discussion
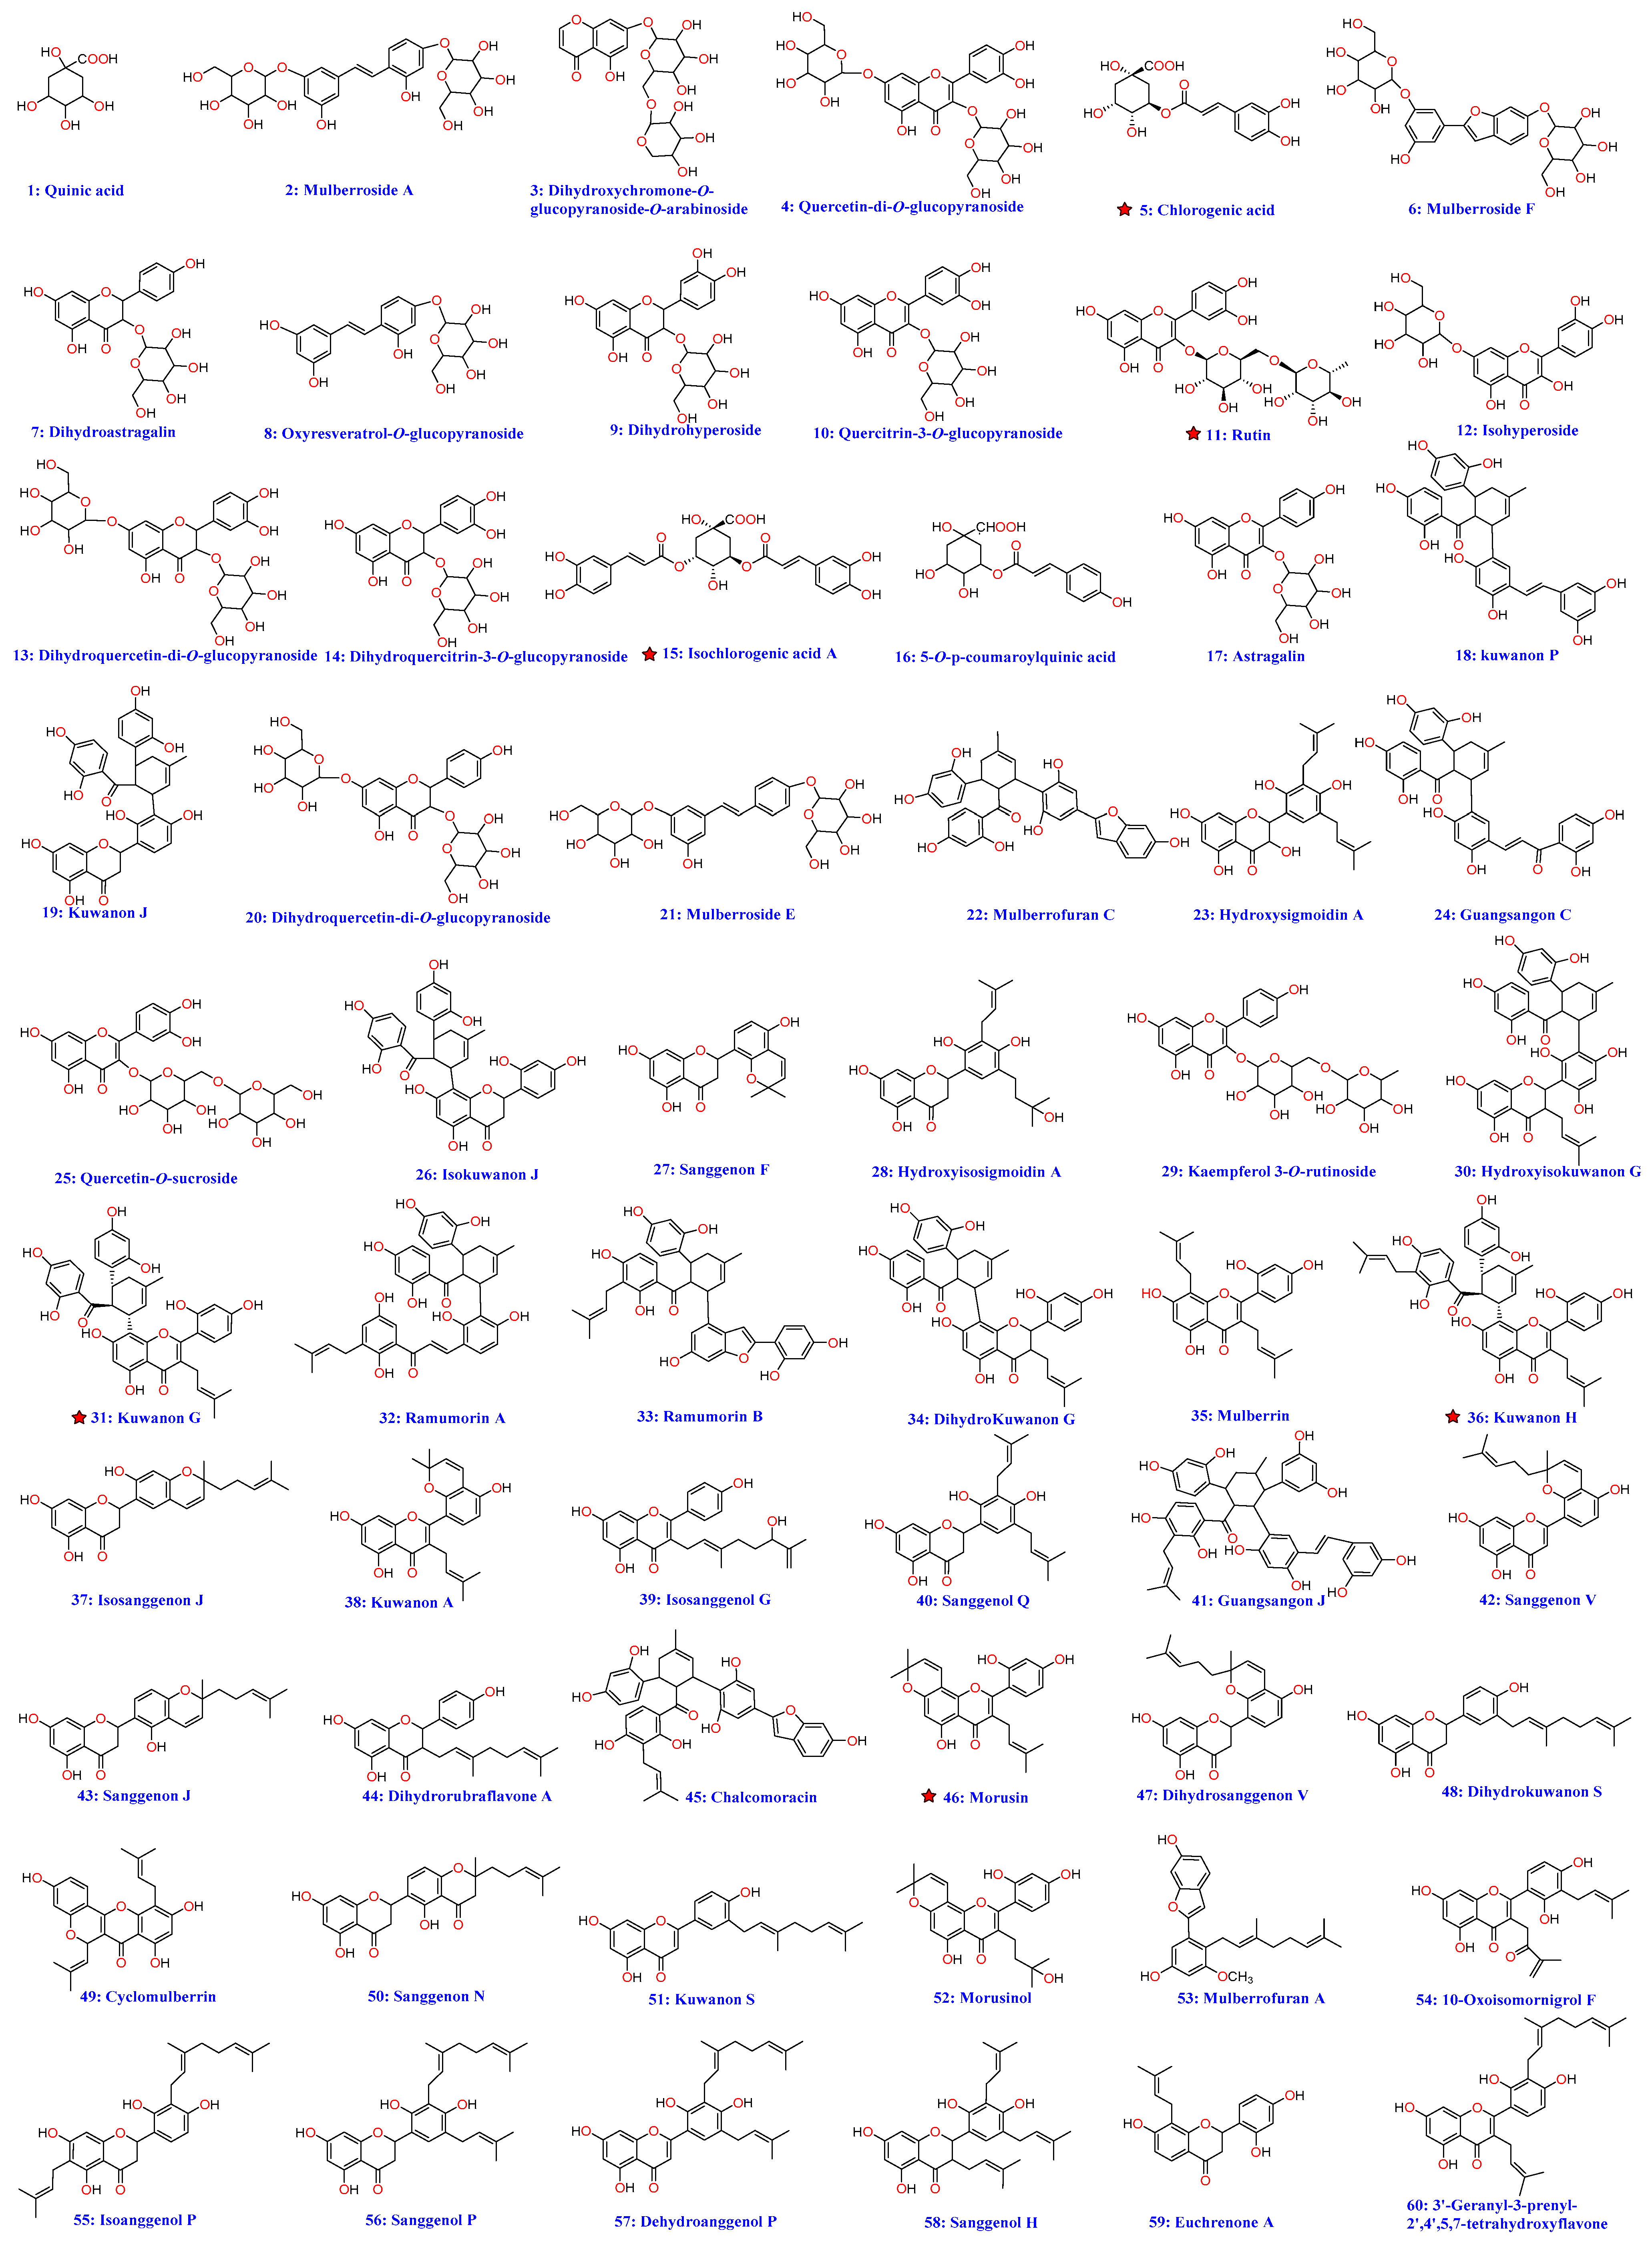
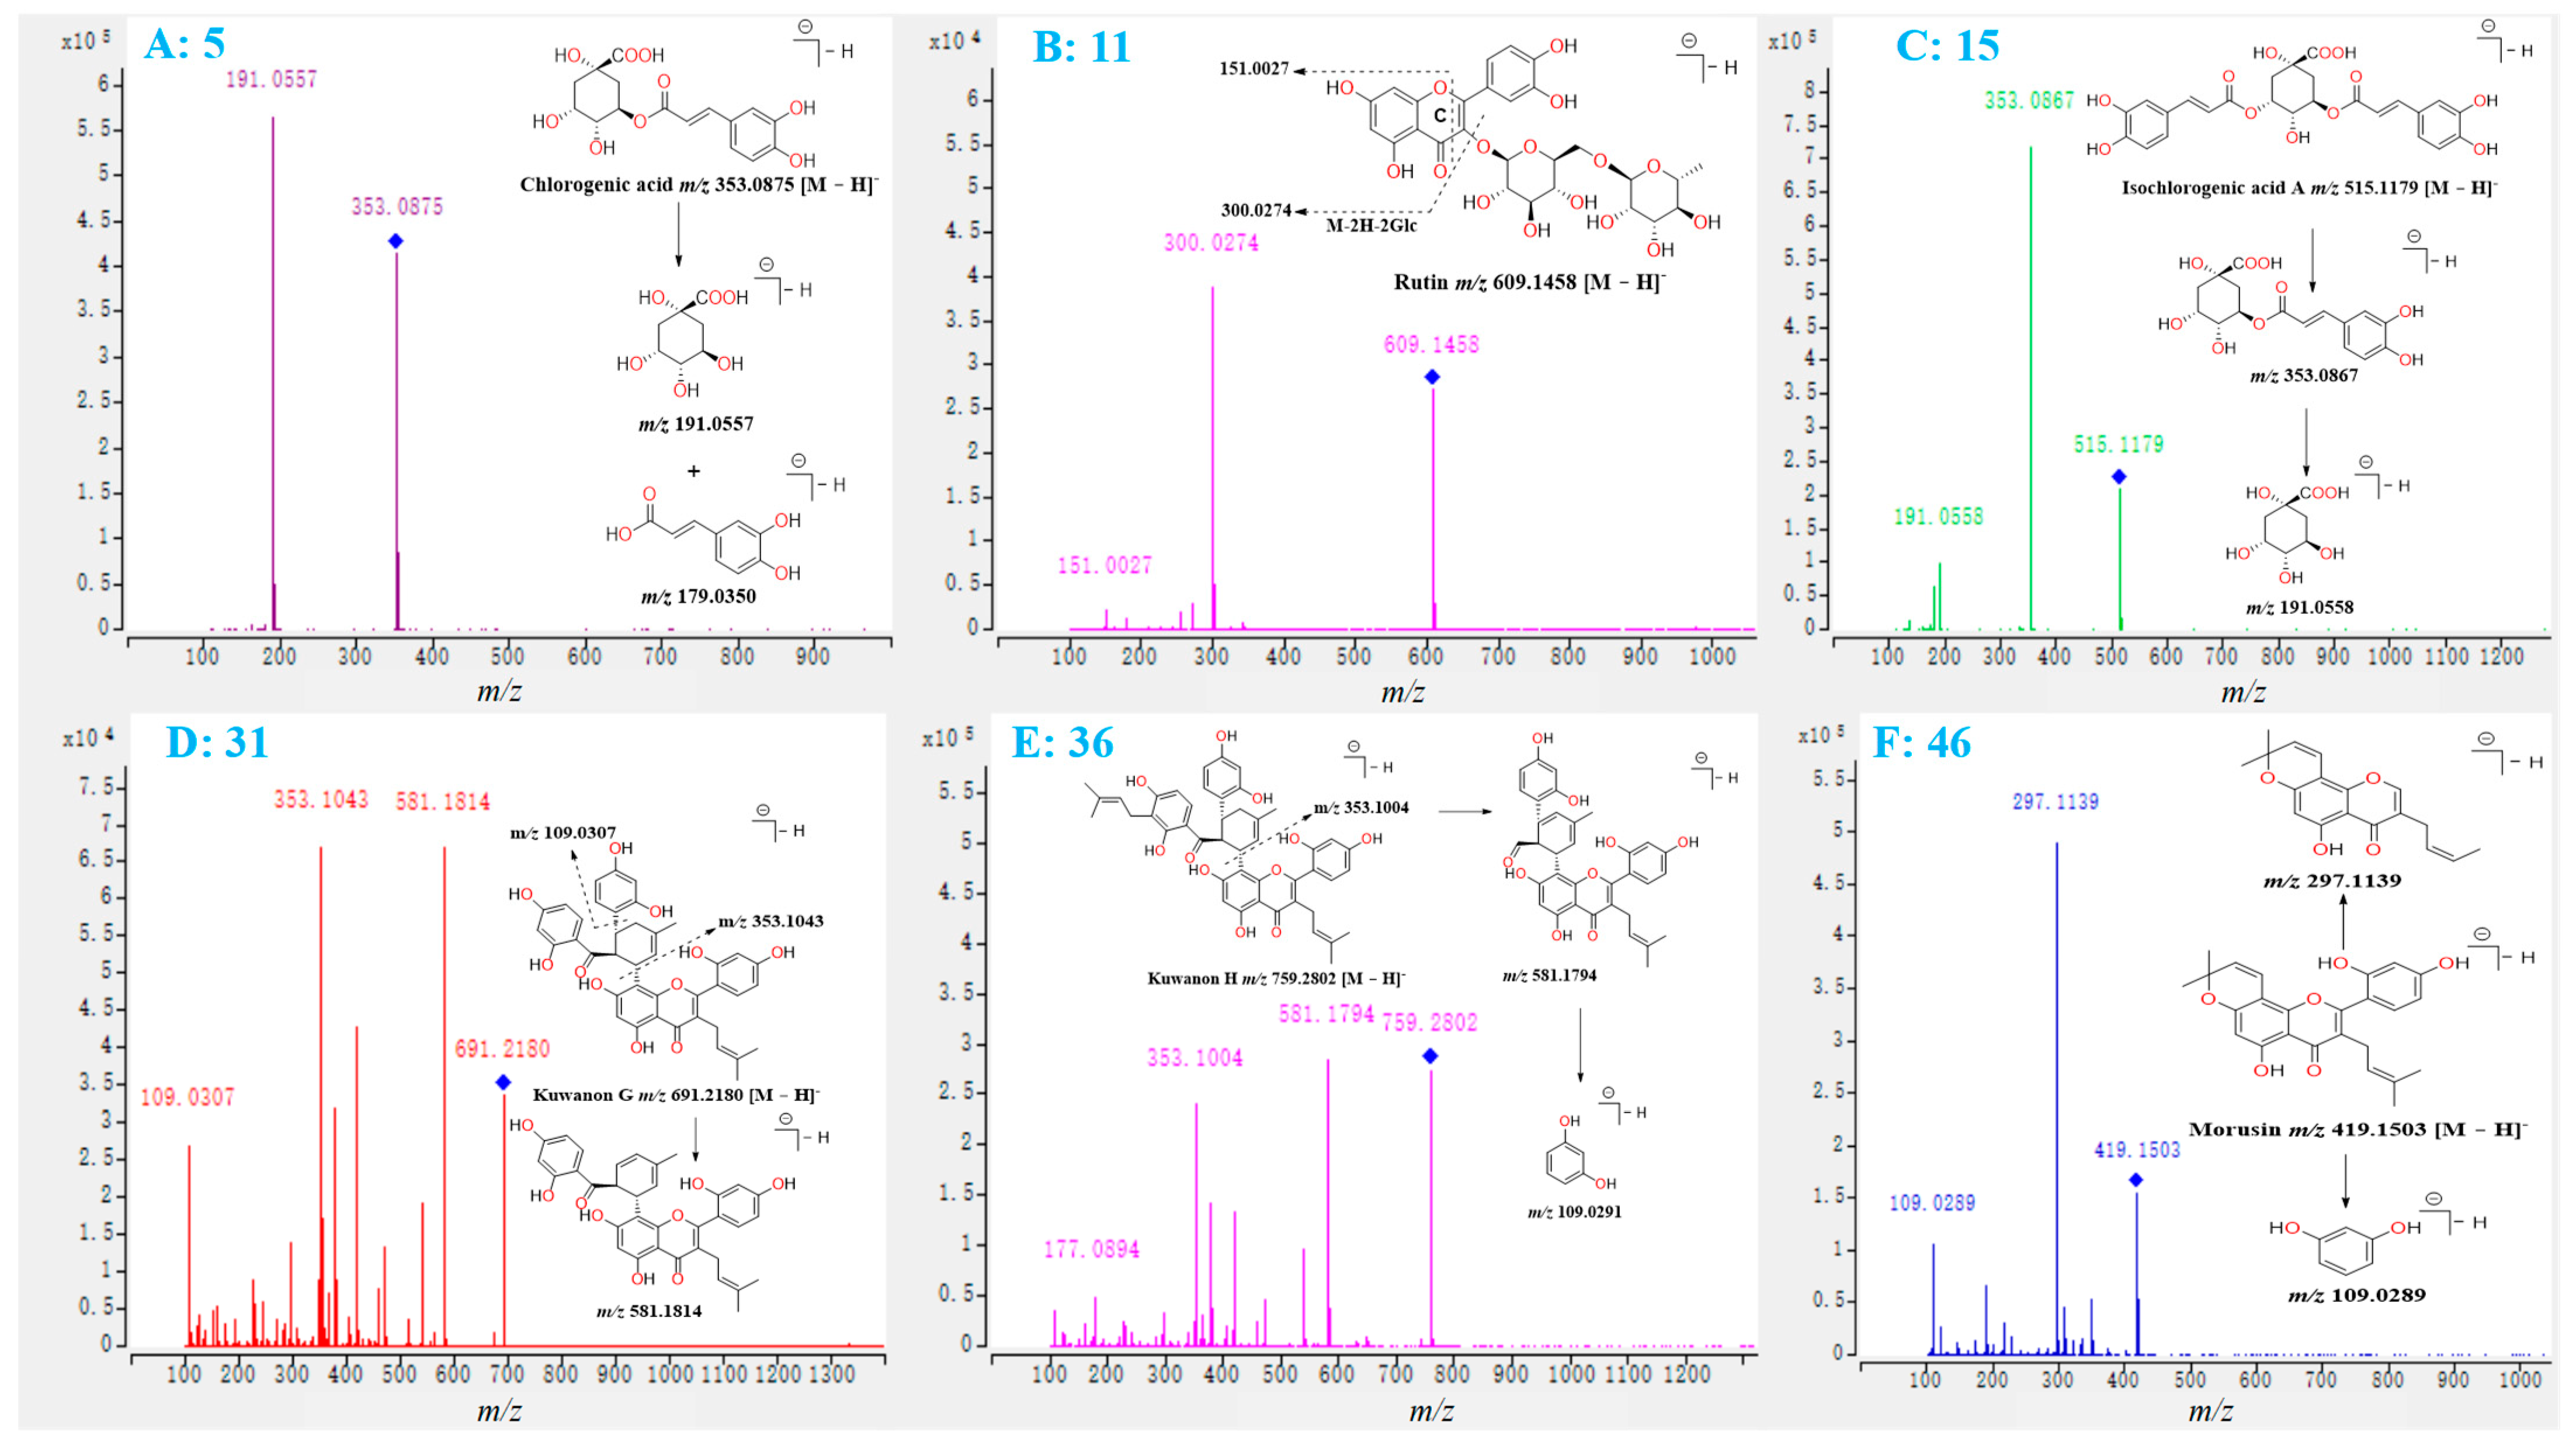
2.1. Investigation of the Fragmentation Pathways of Standards
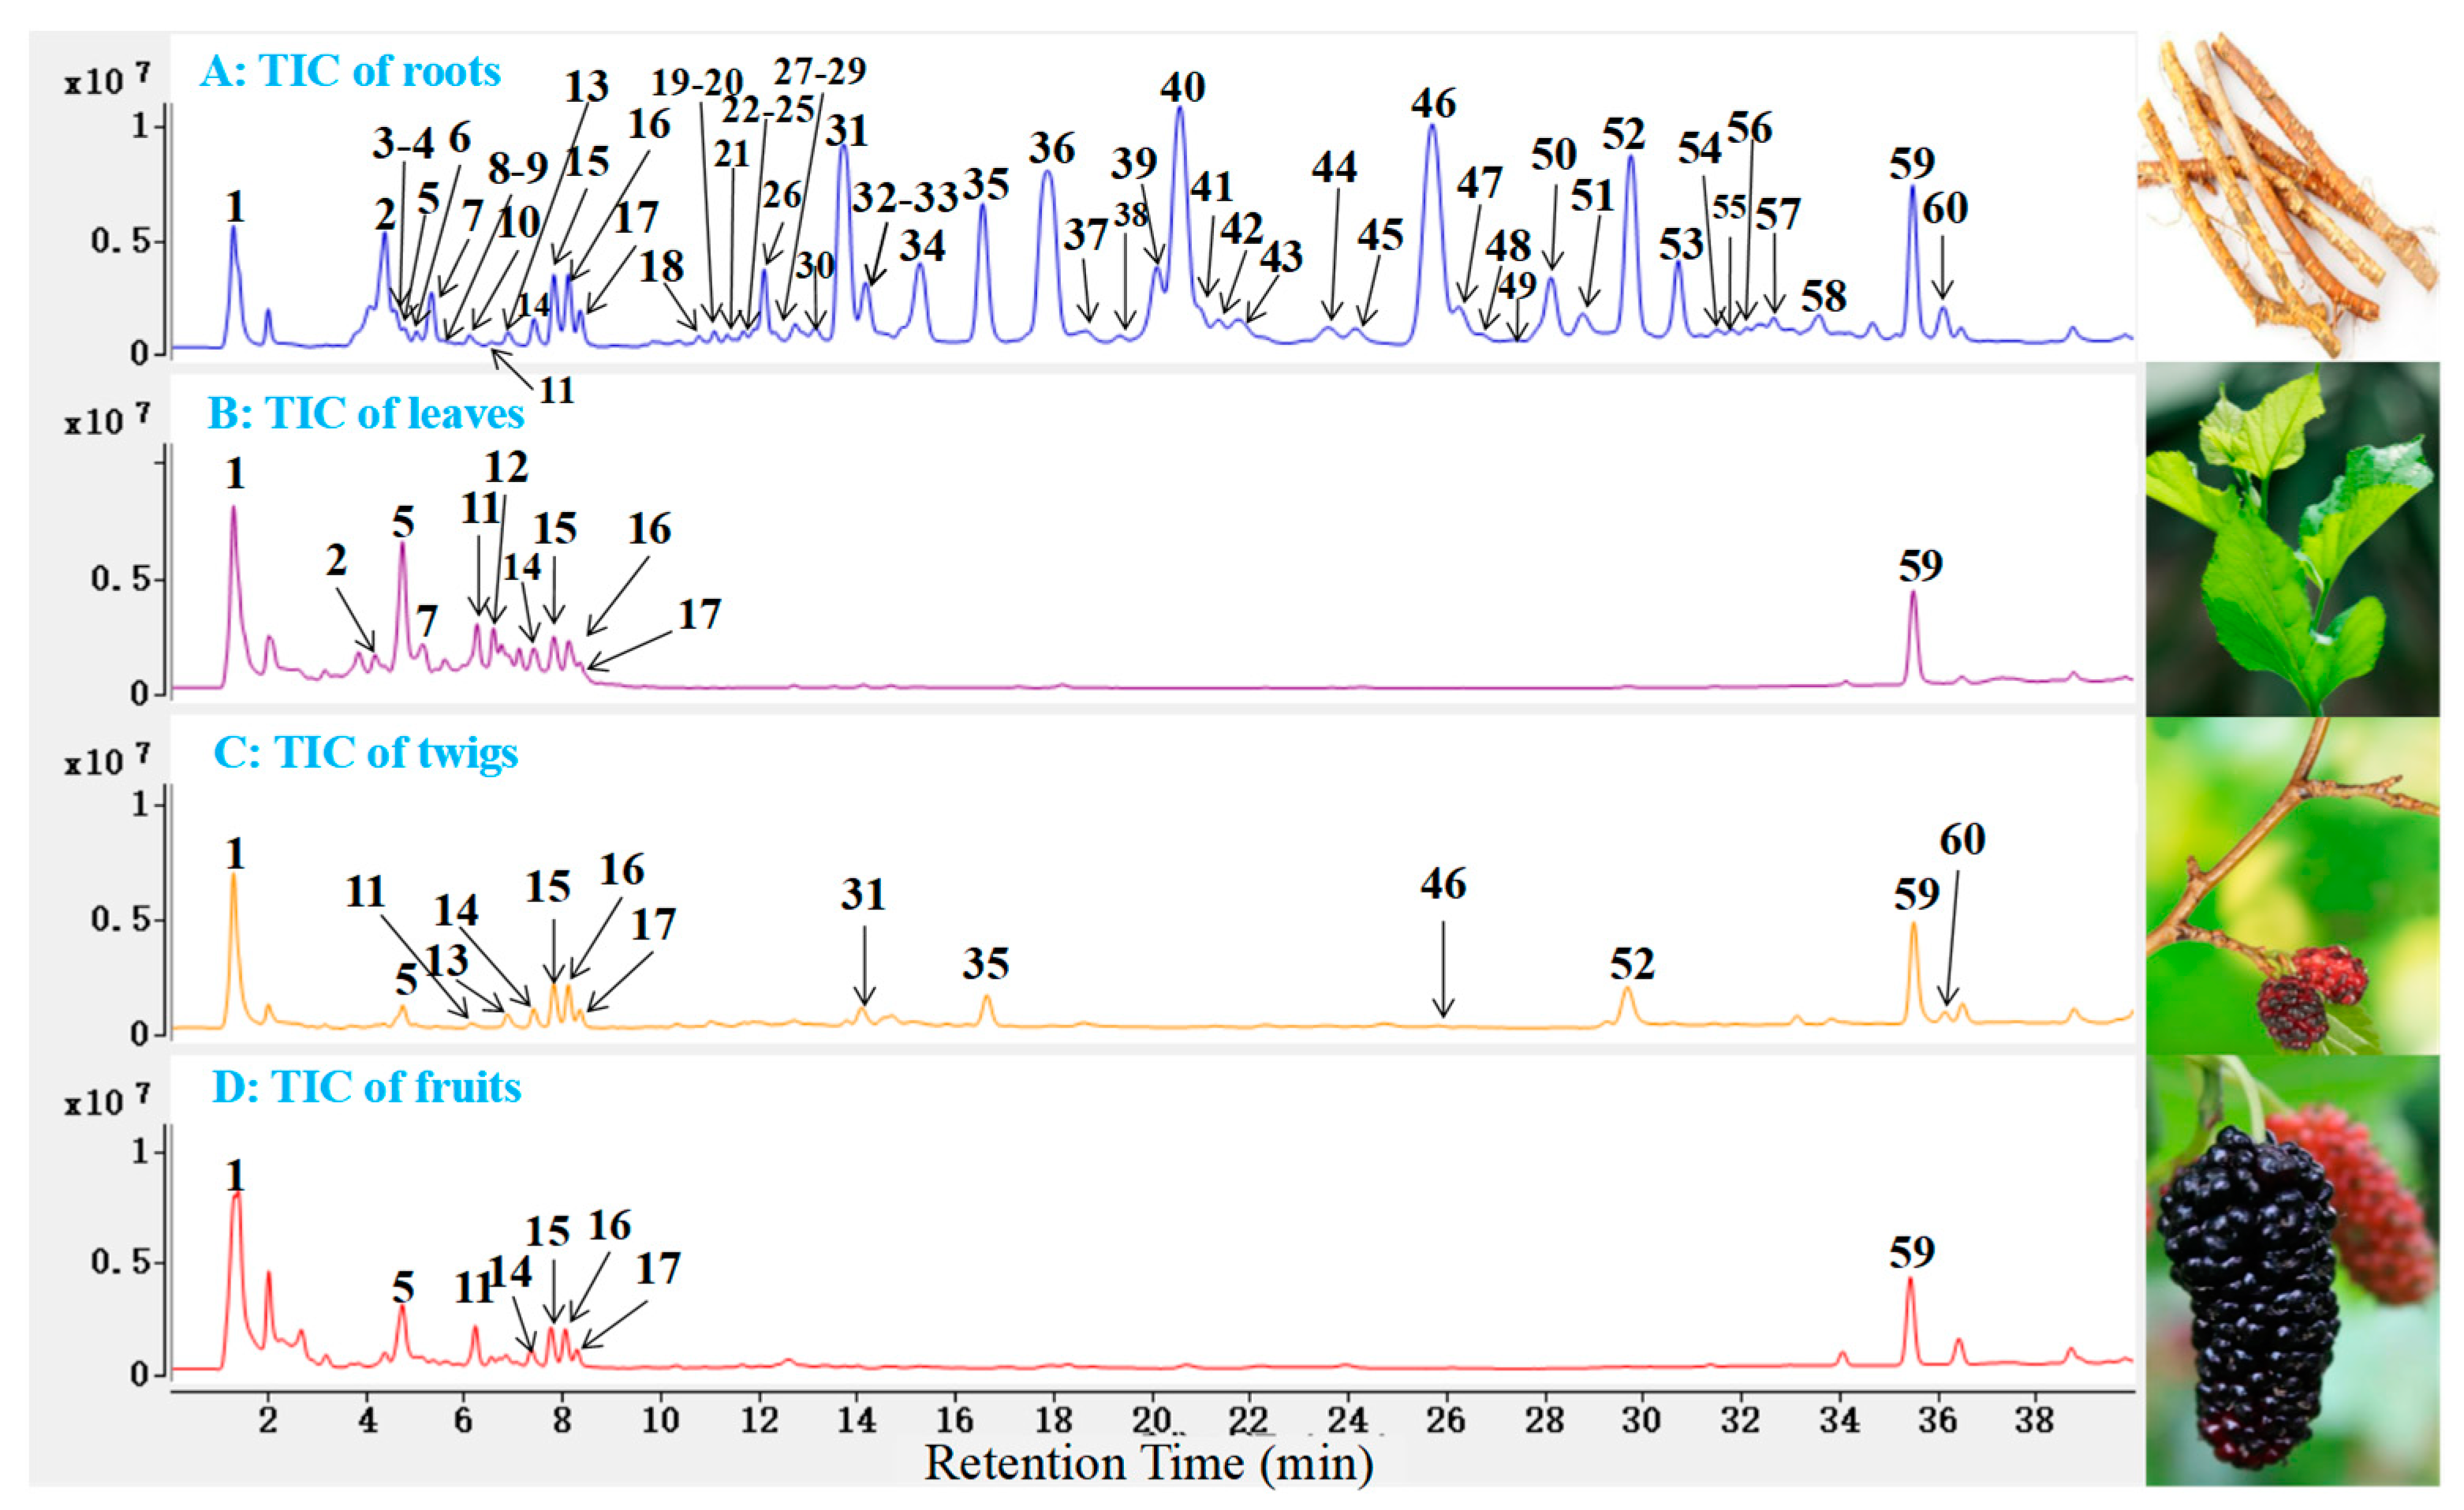
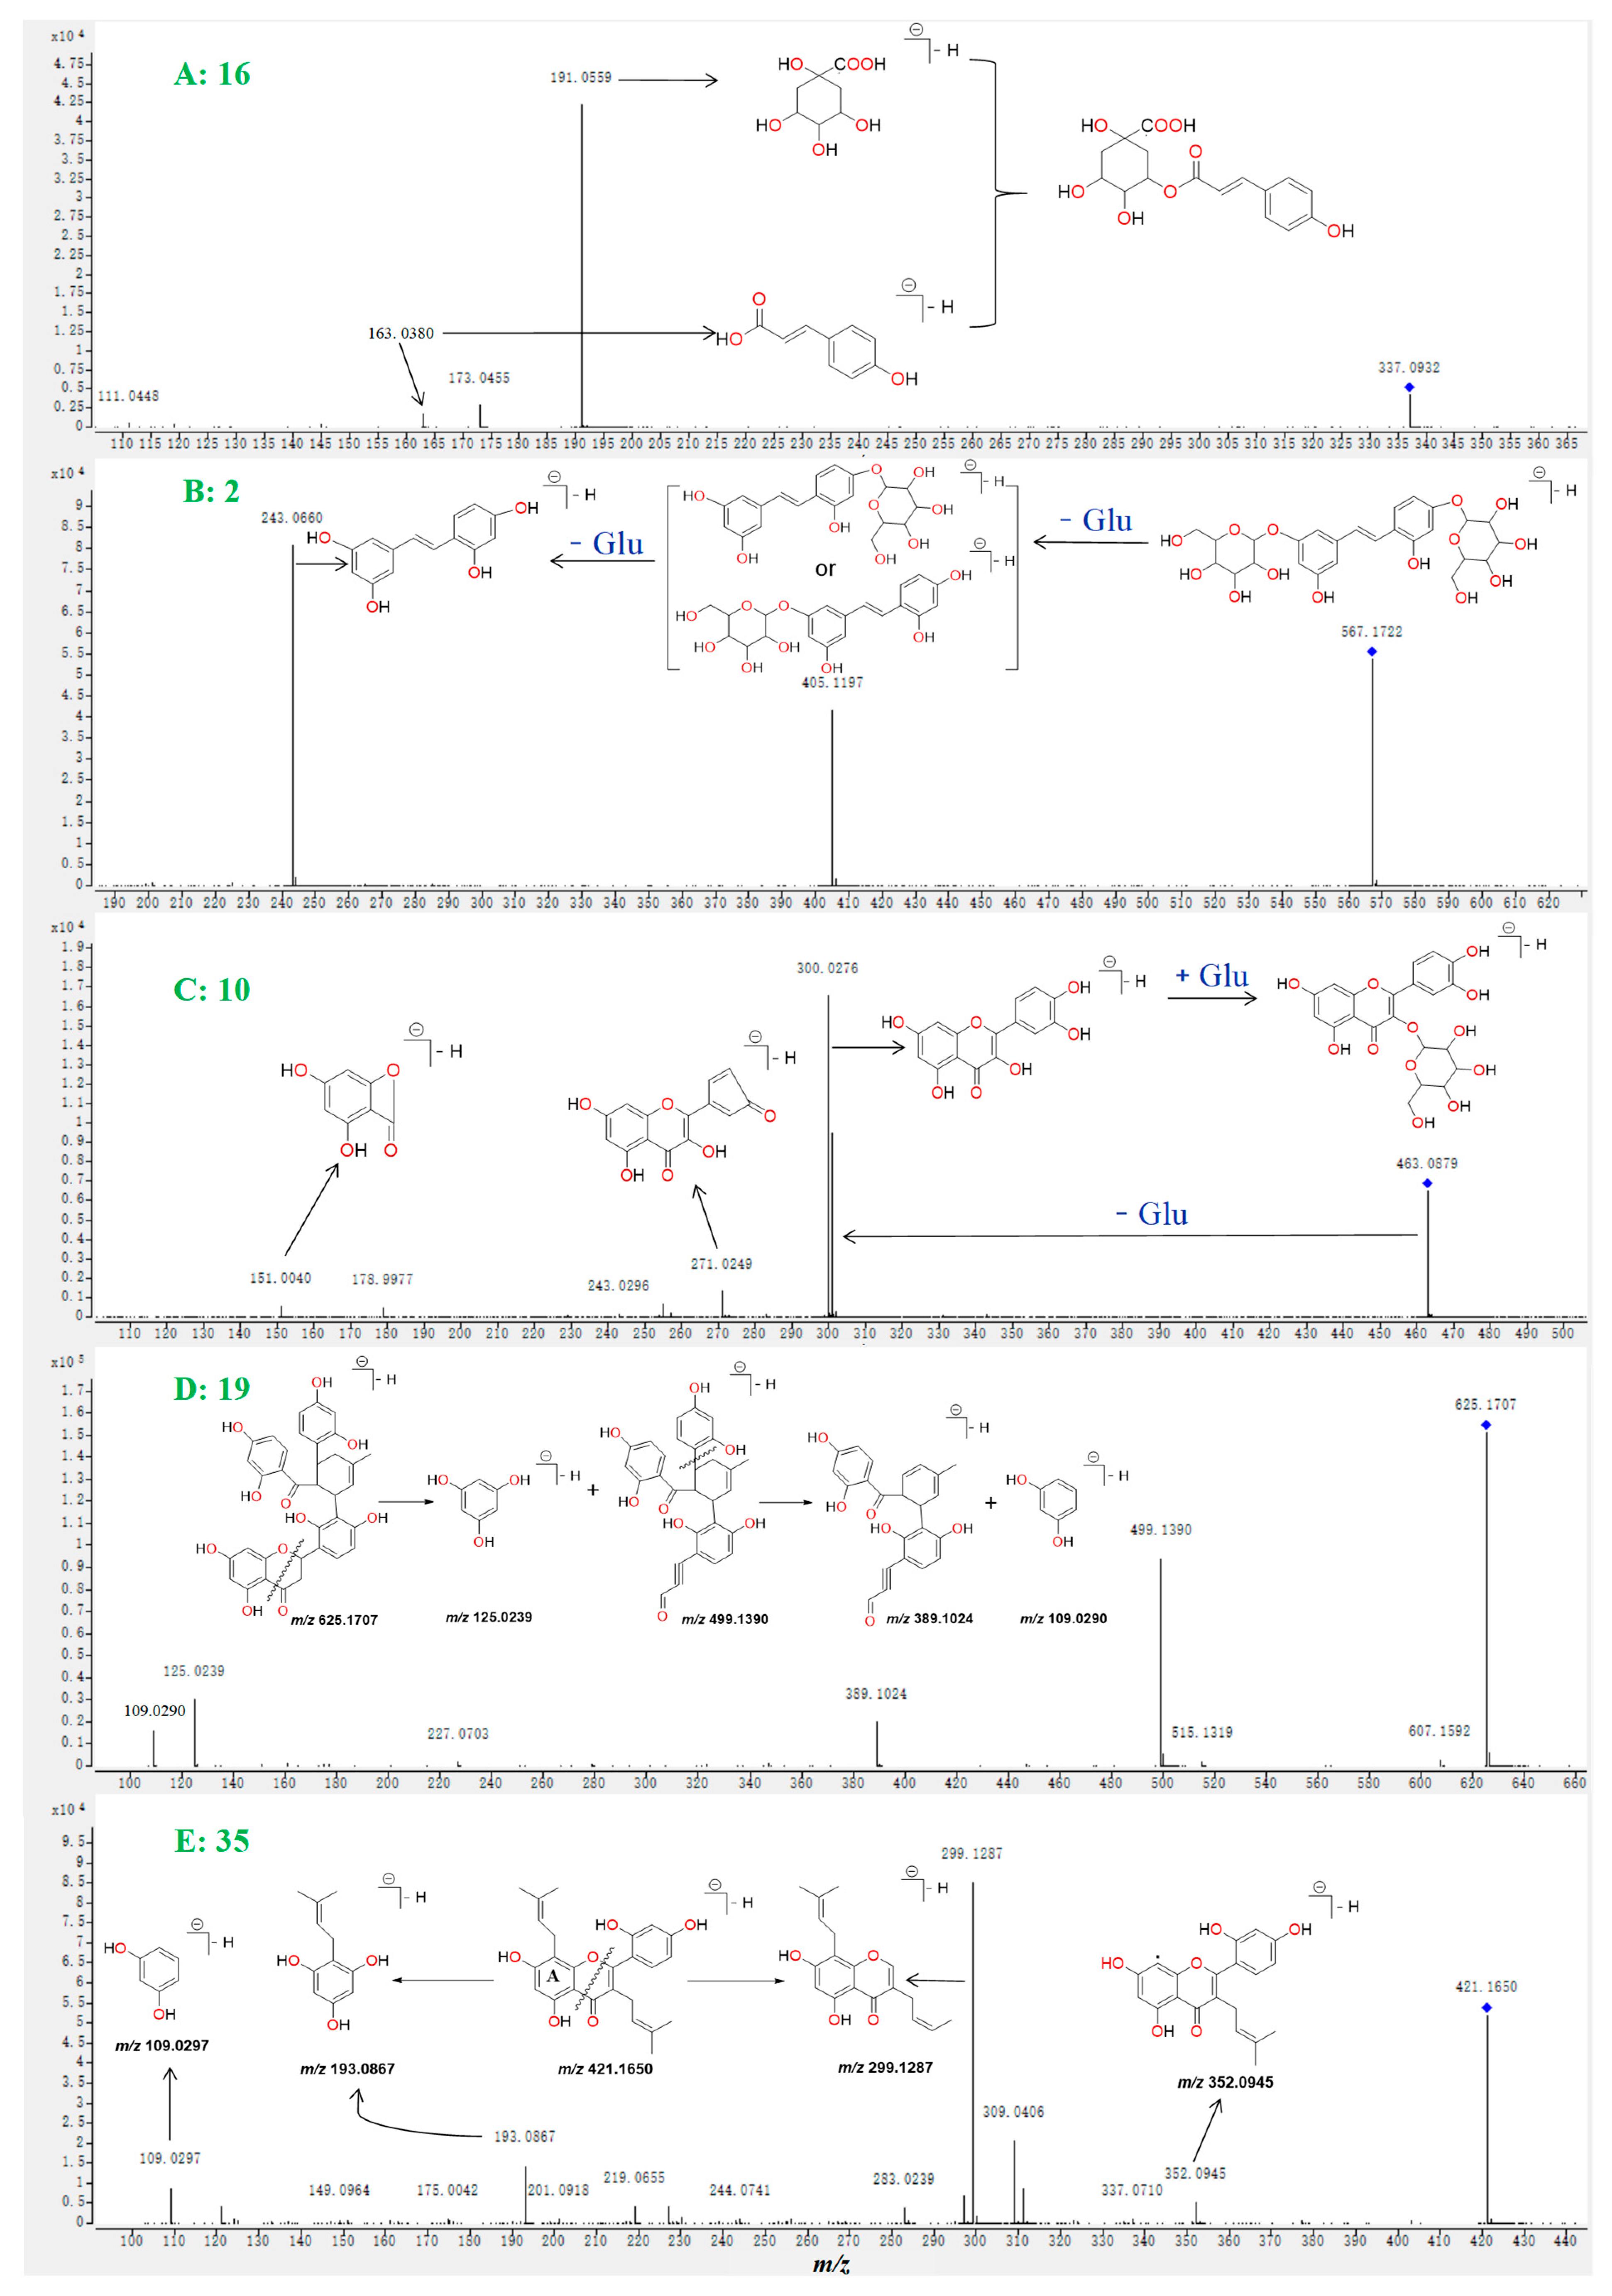
2.2. Identification of Polyphenols and Flavonoids from M. alba
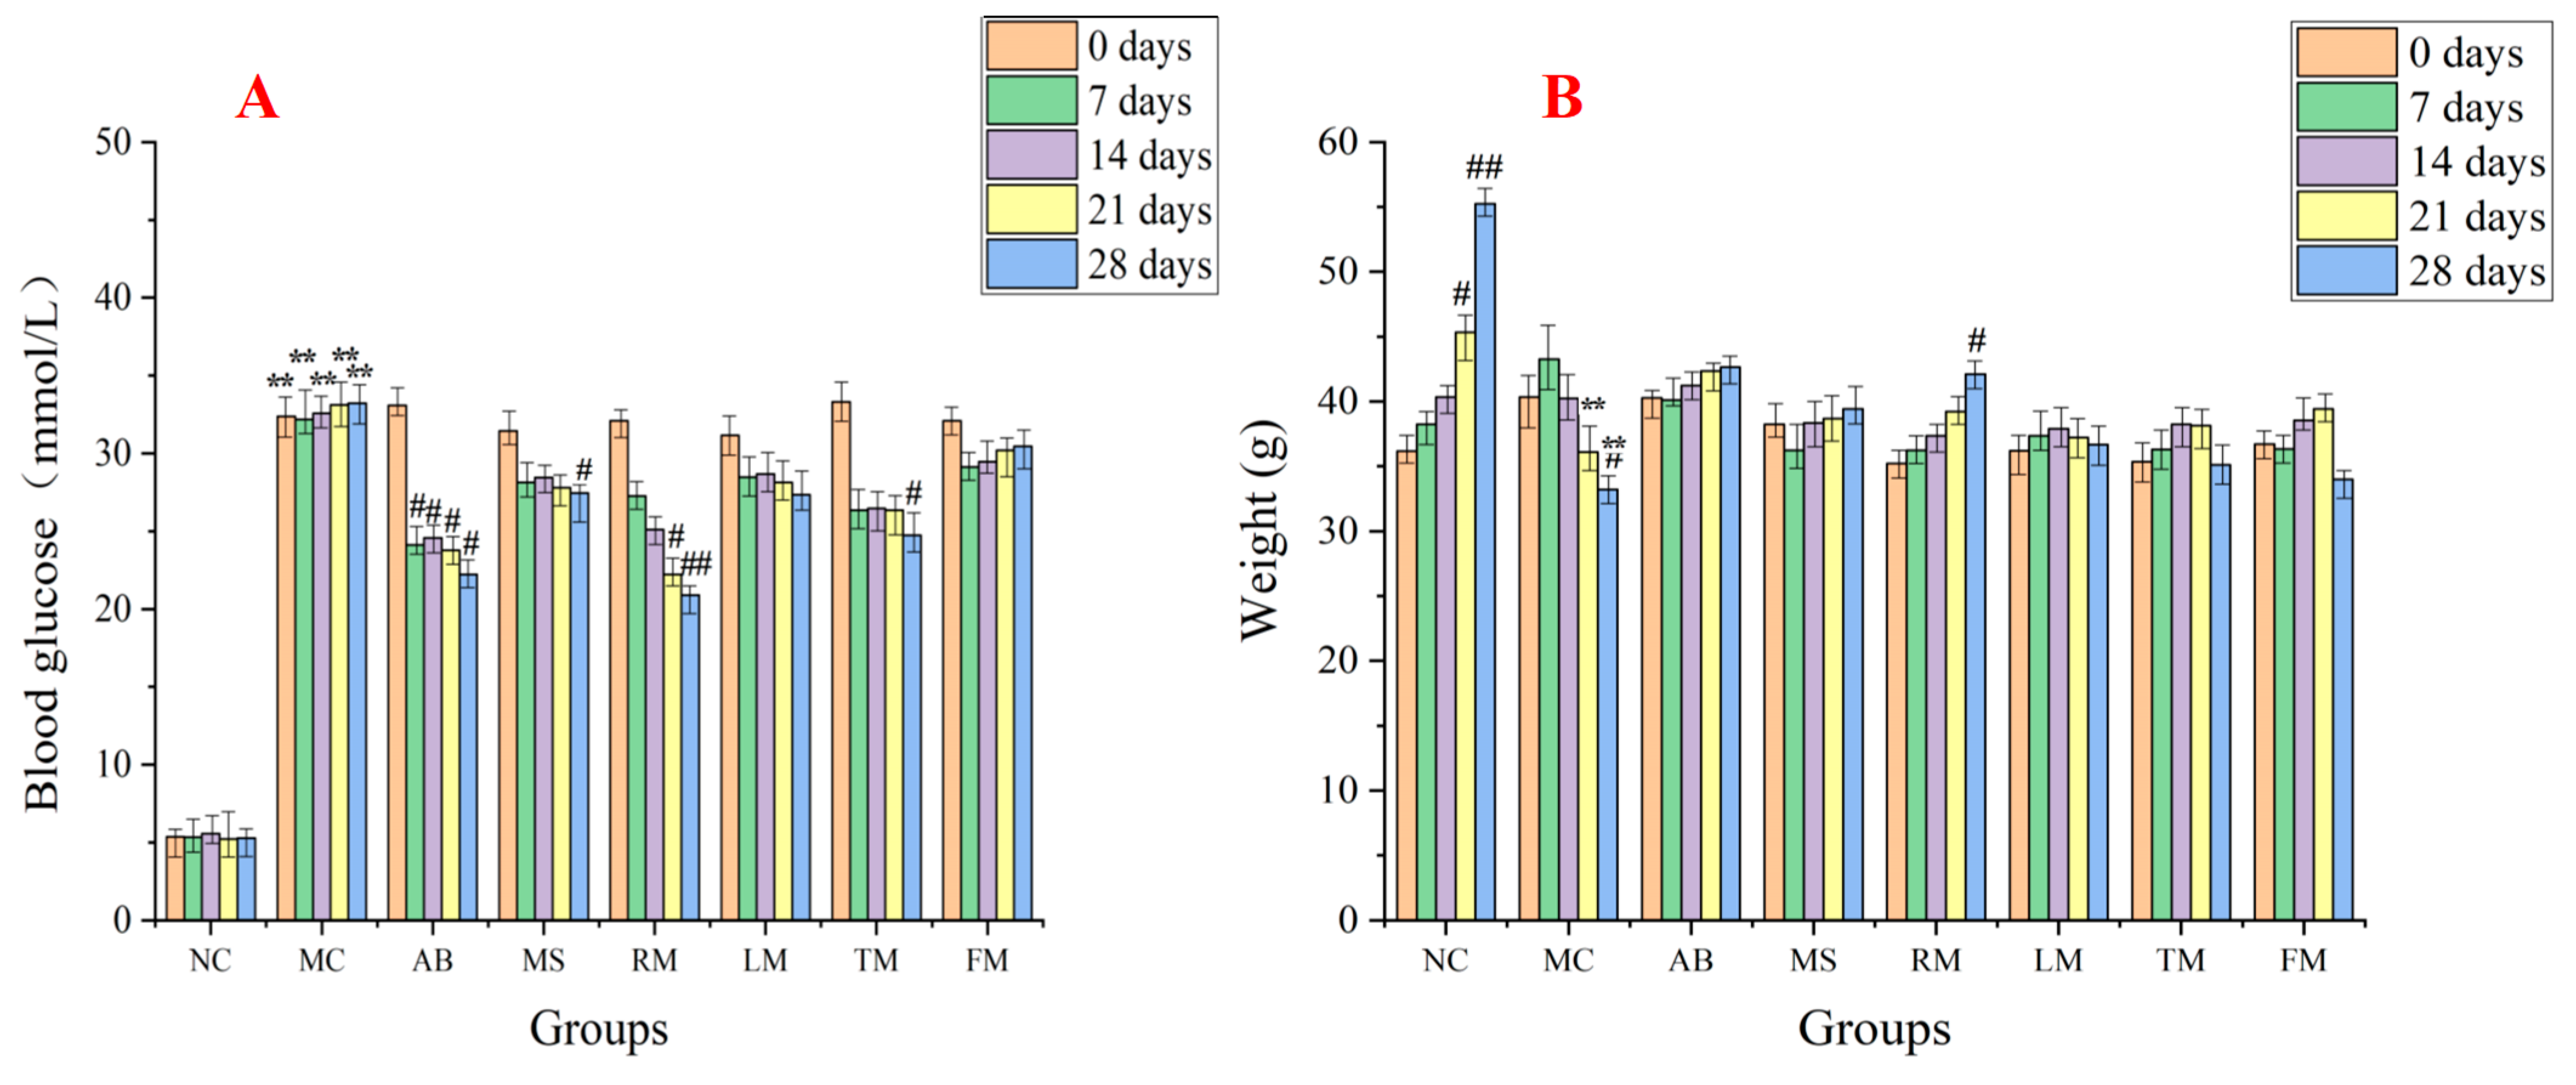
2.3. Evaluation of the Hypoglycemic Activity for Different Extracts of M. alba
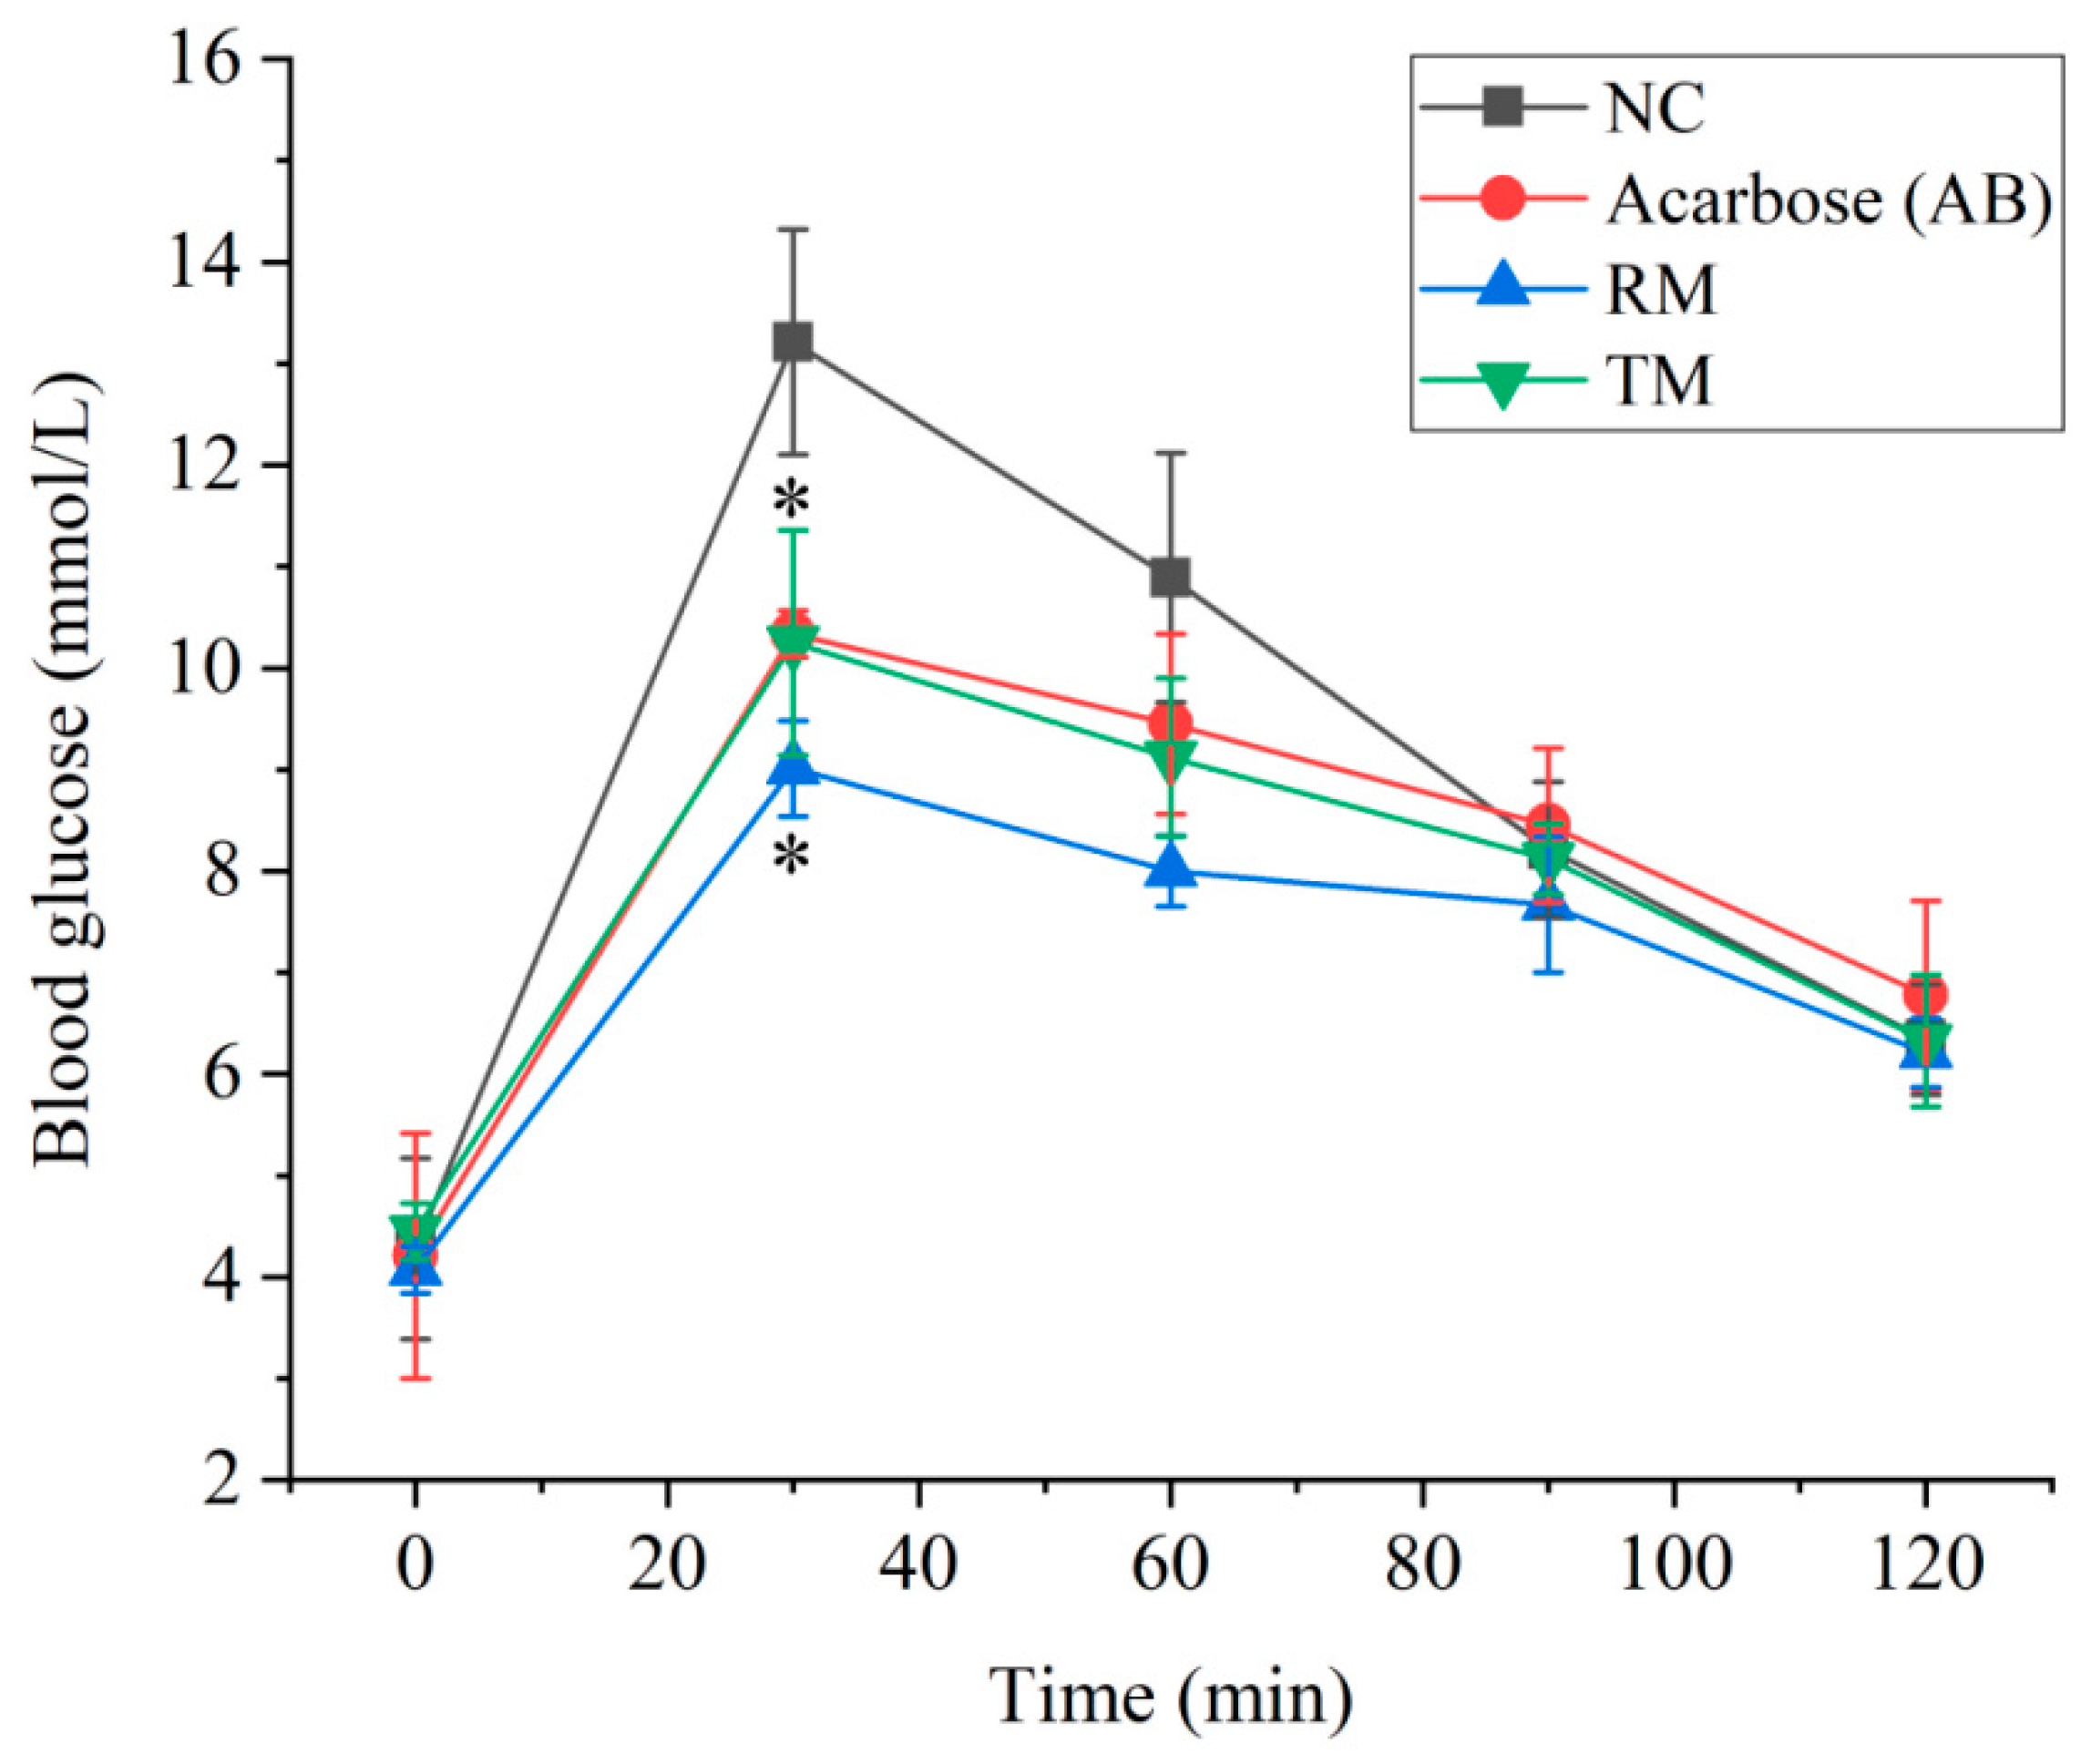
2.4. The Effect of Roots and Twigs Extracts on the Postprandial Glycemia
3. Materials and Methods
3.1. Materials and Chemicals
3.2. Extracts Preparation
3.3. HPLC-Q-TOF-MS Conditions
3.4. Experimental Animal
3.5. Establishment of T2D Mouse Model and Drug Administration
3.6. Postprandial Glycemia of the Normal Mice
3.7. Statistical Method
4. Conclusions
Supplementary Materials
Author Contributions
Funding
Institutional Review Board Statement
Informed Consent Statement
Data Availability Statement
Conflicts of Interest
Sample Availability
References
- Choi, S.Y.; Park, J.; Kim, J.; Lee, J.; Yang, H. Investigation of chemical profiles of different parts of Morus alba using a combination of molecular networking methods with mass spectral data from two ionization modes of LC/MS. Plants 2021, 10, 1711. [Google Scholar] [CrossRef] [PubMed]
- Zhu, M.; Wang, Z.J.; He, Y.J.; Qin, Y.; Zhou, Y.; Qi, Z.H.; Zhou, Z.S.; Zhu, Y.Y.; Jin, D.N.; Chen, S.S.; et al. Bioguided isolation, identification and bioactivity evaluation of anti-MRSA constituents from Morus alba Linn. J. Ethnopharmacol. 2021, 281, 114542. [Google Scholar] [CrossRef] [PubMed]
- Chen, X.Y.; Zhang, T.; Wang, X.; Hamann, M.T.; Kang, J.; Yu, D.Q.; Chen, R.Y. A chemical investigation of the leaves of Morus alba L. Molecules 2018, 23, 1018. [Google Scholar] [CrossRef] [Green Version]
- Jan, B.; Zahiruddin, S.; Basist, P.; Khan, M.U.; Abass, S.; Dewangan, R.P.; Ahmad, S. Separation and identification of antioxidant and antihyperglycemic constituents from Morus alba infusion by TLC-MS-bioautography and UPLC-MS. J. Food Nutr. Res. 2021, 9, 670–690. [Google Scholar] [CrossRef]
- Lee, Y.; Hwang, K.T. Changes in physicochemical properties of mulberry fruits (Morus alba L.) during ripening. Sci. Hortic. 2017, 217, 189–196. [Google Scholar] [CrossRef]
- Lim, S.H.; Yu, J.S.; Lee, H.S.; Choi, C.I.; Kim, K.H. Antidiabetic flavonoids from fruits of Morus alba promoting insulin-stimulated glucose uptake via Akt and AMP-activated protein kinase activation in 3T3-L1 adipocytes. Pharmaceutics 2021, 13, 526. [Google Scholar] [CrossRef]
- Park, C.H.; Park, Y.E.; Yeo, H.J.; Yoon, J.S.; Park, S.Y.; Kim, J.K.; Park, S.U. Comparative analysis of secondary metabolites and metabolic profiling between diploid and tetraploid Morus alba L. J. Agric. Food Chem. 2021, 69, 1300–1307. [Google Scholar] [CrossRef]
- D’urso, G.; Mes, J.J.; Montoro, P.; Hall, R.D.; Vos, R.C. Identification of bioactive phytochemicals in mulberries. Metabolites 2019, 10, 7. [Google Scholar] [CrossRef] [Green Version]
- Li, F.; Zhang, B.; Chen, G.; Fu, X. The novel contributors of anti-diabetic potential in mulberry polyphenols revealed by UHPLC-HR-ESI-TOF-MS/MS. Food Res. Int. 2017, 100, 873–884. [Google Scholar] [CrossRef]
- Polumackanycz, M.; Sledzinski, T.; Goyke, E.; Wesolowski, M.; Viapiana, A. A comparative study on the phenolic composition and biological activities of Morus alba L. commercial samples. Molecules 2019, 24, 3082. [Google Scholar] [CrossRef] [Green Version]
- Liu, J.; Zhong, X.; Jiang, Y.; Yu, L.; Huang, X.; Dong, Z.; Yang, S.; He, W.; Zeng, J.; Qing, Z. Systematic identification metabolites of Hemerocallis citrina Borani by high-performance liquid chromatography/quadrupole-time-of-flight mass spectrometry combined with a screening method. J. Pharm. Biomed. Anal. 2020, 186, 113314. [Google Scholar] [CrossRef] [PubMed]
- Qing, Z.X.; Zhao, H.; Tang, Q.; Mo, C.M.; Huang, P.; Cheng, P.; Yang, P.; Yang, X.Y.; Liu, X.B.; Zheng, Y.J.; et al. Systematic identification of flavonols, flavonol glycosides, triterpene and siraitic acid glycosides from Siraitia grosvenorii using high-performance liquid chromatography/quadrupole-time-of-flight mass spectrometry combined with a screening strategy. J. Pharm. Biomed. Anal. 2017, 138, 240–248. [Google Scholar] [CrossRef] [PubMed]
- Aelenei, P.; Luca, S.V.; Horhogea, C.E.; Rimbu, C.M.; Dimitriu, G.; Macovei, I.; Silion, M.; Aprotosoaie, A.C.; Miron, A. Morus alba leaf extract: Metabolite profiling and interactions with antibiotics against Staphylococcus spp. including MRSA. Phytochem. Lett. 2019, 31, 217–224. [Google Scholar] [CrossRef]
- Sánchez-Salcedo, E.M.; Tassotti, M.; Del, R.D.; Hernández, F.; Martínez, J.J.; Mena, P. (Poly) phenolic fingerprint and chemometric analysis of white (Morus alba L.) and black (Morus nigra L.) mulberry leaves by using a non-targeted UHPLC-MS approach. Food Chem. 2016, 212, 250–255. [Google Scholar] [CrossRef]
- Zhang, W.; Han, F.; He, J.; Duan, C. HPLC-DAD-ESI-MS/MS analysis and antioxidant activities of nonanthocyanin phenolics in mulberry (morus alba L.). J. Food Sci. 2018, 73, C512–C518. [Google Scholar] [CrossRef]
- Gurukar, M.S.A.; Chilkunda, N.D. Morus alba leaf bioactives modulate peroxisome proliferator activated receptor γ in the kidney of diabetic rat and impart beneficial effect. J. Agric. Food Chem. 2018, 66, 7923–7934. [Google Scholar] [CrossRef]
- Kwon, R.H.; Thaku, N.; Timalsina, B.; Park, S.E.; Choi, J.S.; Jung, H.A. Inhibition mechanism of components isolated from Morus alba branches on diabetes and diabetic complications via experimental and molecular docking analyses. Antioxidants 2022, 11, 383. [Google Scholar] [CrossRef]
- Du, Y.; Li, D.X.; Lu, D.Y.; Zhang, R.; Zheng, X.X.; Xu, B.J.; Zhao, Y.L.; Ji, S.; Guo, M.Z.; Wang, L.; et al. Morus alba L. water extract changes gut microbiota and fecal metabolome in mice induced by high-fat and high-sucrose diet plus low-dose streptozotocin. Phytother. Res. 2022, 36, 1241–1257. [Google Scholar] [CrossRef]
- Zhao, Y.; Kongstad, K.T.; Jäger, A.K.; Nielsen, J.; Staerk, D. Quadruple high-resolution α-glucosidase/α-amylase/PTP1B/radical scavenging profiling combined with high-performance liquid chromatography-high-resolution mass spectrometry-solid-phase extraction-nuclear magnetic resonance spectroscopy for identification of antidiabetic constituents in crude root bark of Morus alba L. J. Chromatogr. A 2018, 1556, 55–63. [Google Scholar]
- Jha, S.; Gupta, S.K.; Bhattacharyya, P.; Ghosh, A.; Mandal, P. In vitro antioxidant and antidiabetic activity of oligopeptides derived from different mulberry (Morus alba L.) cultivars. Pharmacogn. Res. 2018, 10, 361–367. [Google Scholar]
- Taghizadeh, M.; Zadeh, A.M.; Asemi, Z.; Farrokhnezhad, A.H.; Memarzadeh, M.R.; Banikazemi, Z.; Shariat, M.; Shafabakhsh, R. Morus Alba leaf extract affects metabolic profiles, biomarkers inflammation and oxidative stress in patients with type 2 diabetes mellitus: A double-blind clinical trial. Clin. Nutr. ESPEN 2022, 49, 68–73. [Google Scholar] [CrossRef]
- Singab, A.N.B.; El-Beshbishy, H.A.; Yonekawa, M.; Nomura, T.; Fukai, T. Hypoglycemic effect of Egyptian Morus alba root bark extract: Effect on diabetes and lipid peroxidation of streptozotocin-induced diabetic rats. J. Ethnopharmacol. 2005, 100, 333–338. [Google Scholar] [CrossRef] [PubMed]
- Lei, L.; Huan, Y.; Liu, Q.; Li, C.; Cao, H.; Ji, W.; Gao, X.; Fu, Y.; Li, P.; Zhang, R.; et al. Morus alba L. (Sangzhi) alkaloids promote insulin secretion, restore diabetic β-cell function by preventing dedifferentiation and apoptosis. Front. Pharmacol. 2022, 13, 841981. [Google Scholar] [CrossRef] [PubMed]
- Suthamwong, P.; Minami, M.; Okada, T.; Shiwaku, N.; Uesugi, M.; Yokode, M.; Kamei, K. Administration of mulberry leaves maintains pancreatic β-cell mass in obese/type 2 diabetes mellitus mouse model. BMC Complement. Med. Ther. 2020, 20, 136. [Google Scholar] [CrossRef] [PubMed]
- Chen, C.; Mohamad, R.U.H.; Saikim, F.H.; Mahyudin, A.; Mohd, N.Q.I. Morusalba L. plant: Bioactive compounds and potential as a functional food ingredient. Foods 2021, 10, 689. [Google Scholar] [CrossRef] [PubMed]
- Kim, G.N.; Kwon, Y.I.; Jang, H.D. Mulberry leaf extract reduces postprandial hyperglycemia with few side effects by inhibiting α-glucosidase in normal rats. J. Med. Food 2011, 14, 712–717. [Google Scholar] [CrossRef]
- Chen, Z.; Du, X.; Yang, Y.; Cui, X.; Zhang, Z.; Li, Y. Comparative study of chemical composition and active components against α-glucosidase of various medicinal parts of Morus alba L. Biomed. Chromatogr. 2018, 32, e4328. [Google Scholar] [CrossRef] [PubMed]
- Paudel, P.; Yu, T.; Seong, S.H.; Kuk, E.B.; Jung, H.A.; Choi, J.S. Protein tyrosine phosphatase 1B inhibition and glucose uptake potentials of mulberrofuran G, albanol B, and kuwanon G from root bark of Morus alba L. in insulin-resistant HepG2 cells: An in vitro and in silico study. Int. J. Mol. Sci. 2018, 19, 1542. [Google Scholar] [CrossRef] [Green Version]
- Mahmoud, A.M.; El-Twab, A.; Sanaa, M.; Abdel-Reheim, E.S. Consumption of polyphenol-rich Morus alba leaves extract attenuates early diabetic retinopathy: The underlying mechanism. Eur. J. Nutr. 2017, 56, 1671–1684. [Google Scholar] [CrossRef]
- Ji, S.; Zhu, C.; Gao, S.; Shao, X.; Chen, X.; Zhang, H.; Tang, D. Morus alba leaves ethanol extract protects pancreatic islet cells against dysfunction and death by inducing autophagy in type 2 diabetes. Phytomedicine 2021, 83, 153478. [Google Scholar] [CrossRef]
- Li, J.S.; Ji, T.; Su, S.L.; Zhu, Y.; Chen, X.L.; Shang, E.X.; Guo, S.; Qian, D.W.; Duan, J.A. Mulberry leaves ameliorate diabetes via regulating metabolic profiling and AGEs/RAGE and p38 MAPK/NF-κB pathway. J. Ethnopharmacol. 2022, 283, 114713. [Google Scholar] [CrossRef] [PubMed]
- Ahn, E.; Lee, J.; Jeon, Y.H.; Choi, S.W.; Kim, E. Anti-diabetic effects of mulberry (Morus alba L.) branches and oxyresveratrol in streptozotocin-induced diabetic mice. Food Sci. Biotechnol. 2017, 26, 1693–1702. [Google Scholar] [CrossRef] [PubMed]
- Pan, Y.; Wang, C.; Chen, Z.; Li, W.; Yuan, G.; Chen, H. Physicochemical properties and antidiabetic effects of a polysaccharide from corn silk in high-fat diet and streptozotocin-induced diabetic mice. Carbohydr. Polym. 2017, 164, 370–378. [Google Scholar] [CrossRef] [PubMed]


| No. | tR (min.) | [M − H] (m/z) | Error (ppm) | Molecular Formula | Belongs | MS/MS Fragment Ions (m/z) | Identification |
|---|---|---|---|---|---|---|---|
| 1a | 1.29 | 191.0562 | 3.4 | C7H12O6 | All | 173.0432, 111.0095 | Quinic acid |
| 2 | 4.38 | 567.1722 | −1.4 | C26H23O14 | All | 405.1197, 243.0660 | Mulberroside A |
| 3a | 4.58 | 471.1170 | 6.5 | C20H24O13 | R, T | 177.0190 | Dihydroxychromone-O-glucopyranoside-O- arabinoside |
| 4 | 4.66 | 625.1460 | 4.8 | C27H29O17 | R, T | 463.0908, 299.0190, 151.0020 | Quercetin-di-O- glucopyranoside |
| 5c | 4.73 | 353.0877 | 1.1 | C16H18O9 | All | 191.0559, 173.0450, 135.0447 | Chlorogenic acid |
| 6 | 5.03 | 565.1577 | 3.5 | C26H30O14 | All | 419.2454, 403.1031, 241.0511 | Mulberroside F |
| 7a | 5.32 | 449.1075 | −2.0 | C21H22O11 | R, L, T | 287.0557, 151.0022, 125.0237 | Dihydroastragalin |
| 8a | 5.61 | 405.1198 | 2.9 | C20H22O9 | R | 243.0661, 175.0754 | Oxyresveratrol-O- glucopyranoside |
| 9a | 5.69 | 465.1024 | −1.9 | C21H22O12 | R | 437.1070, 303.0508, 125.0234 | Dihydrohyperoside |
| 10a | 6.11 | 463.0879 | 0.4 | C21H20O12 | All | 350.0276, 271.0249, 151.0040 | Quercetin-3-O- glucopyranoside |
| 11c | 6.23 | 609.1462 | 0.9 | C27H30O16 | All | 300.0277, 271.0245, 151.0034 | Rutin |
| 12a | 6.58 | 463.0863 | −3.0 | C21H20O12 | All | 301.0347, 151.0030 | Isohyperoside |
| 13 | 6.88 | 627.1557 | −0.6 | C27H32O17 | All | 465.1017, 447.0923, 285.0391 | Dihydrouercetin-di- O-glucopyranoside |
| 14a | 7.34 | 465.1079 | 3.6 | C21H22O12 | All | 437.1108, 303.0511, 125.0245 | Dihydroquercetin- 3-O-glucopyranoside |
| 15a,c | 7.82 | 515.1177 | −2.5 | C25H24O12 | All | 353.0866, 191.0552, 173.0433 | Isochlorogenic acid A |
| 16a | 8.11 | 337.0932 | 3.2 | C16H18O9 | All | 191.0559, 173.0455 | 5-O-p-coumaroylquinic acid |
| 17 | 8.36 | 447.0901 | −6.0 | C21H20O11 | All | 401.1437, 269.1012 | Astragalin |
| 18 | 10.77 | 581.1815 | 0.5 | C34H30O9 | R, T | 471.1815, 361.1074, 109.0294 | kuwanon P |
| 19a | 11.08 | 625.1707 | −0.4 | C35H30O11 | R | 499.1390, 389.1024, 125.0289 | Kuwanon J |
| 20b | 11.10 | 647.1407 | 4.3 | C27H32O16 | All | 611.1599, 449.1100, 125.0248 | Dihydroquercetin-di- O-glucopyranoside |
| 21b | 11.35 | 597.1814 | −0.8 | C26H32O13 | R | 551.1761, 389.1240, 227.0711 | Mulberroside E |
| 22 | 11.68 | 579.1656 | 0.1 | C34H28O9 | R | 469.1274, 359.0919, 109.0290 | Mulberrofuran C |
| 23a | 11.69 | 439.1758 | 0.2 | C25H28O7 | R | 421.1653, 313.1435, 125.1236 | Hydroxysigmoidin A |
| 24 | 11.70 | 609.1758 | −0.4 | C35H30O10 | R | 499.1414,447.1418, 337.1065, 227.0726, 161.0234 | Guangsangon C |
| 25a | 11.82 | 625.1429 | −3.8 | C27H30O17 | All | 463.0882, 299.0183, 125.0234 | Quercetin-O-sucroside |
| 26a | 12.09 | 625.1705 | 0.6 | C35H30O11 | R | 499.1393,389.1025, 279.0661, 125.0232, 109.0292 | Isokuwanon G |
| 27 | 12.30 | 353.1036 | 3.1 | C20H18O6 | R, T | 177.0210, 125.0236 | Sanggenon F |
| 28a | 12.32 | 439.1764 | −2.3 | C26H30O7 | R, T | 287.1600, 151.0014, 125.0243 | Hydroxyisosigmoidin A |
| 29 | 12.4 | 593.1530 | 3.8 | C27H30O15 | All | 284.0333, 125.0236 | Kaempferol 3-O-rutinoside |
| 30a | 13.10 | 709.2278 | −0.9 | C40H38O12 | R | 583.1965,473.1587, 445.1647, 125.0236, 109.0285 | Hydroxyisokuwanon G |
| 31c | 13.71 | 691.2178 | −0.2 | C40H36O11 | R, T | 581.1812, 419.1485, 353.1019 | Kuwanon G |
| 32 | 14.16 | 677.2390 | 0.4 | C40H38O10 | R | 515.2072, 337.1086, 161.0244 | Ramumorin A |
| 33 | 14.20 | 647.2278 | −0.4 | C39H36O9 | R | 537.1910, 427.1505, 109.0290 | Ramumorin B |
| 34a | 15.29 | 693.2328 | −1.1 | C40H38O11 | R, T | 567.2013, 389.1021, 125.0239 | Dihydrokuwanon G |
| 35 | 16.62 | 421.1650 | −0.2 | C25H26O6 | R, T | 352.0945, 299.1287, 109.0297 | Mulberrin |
| 36c | 17.89 | 759.2809 | 0.3 | C45H44O11 | R | 581.1824, 353.1033, 109.0290 | Kuwanon H |
| 37a | 18.62 | 421.1643 | −1.9 | C25H26O6 | R, T | 269.1535, 151.0028, 125.0237 | Isosanggenon J |
| 38c | 19.36 | 419.1496 | 0.2 | C25H24O6 | R | 231.0660, 151.0041, 125.0240 | Kuwanon A |
| 39a | 20.10 | 421.1648 | −0.7 | C25H26O6 | R, T | 309.0400, 231.0659, 125.0240 | Isosanggenol G |
| 40 | 20.57 | 423.1814 | 1.4 | C25H28O6 | R, T | 395.1864, 379.1919, 125.0244 | Sanggenol Q |
| 41 | 20.95 | 759.2812 | 0.7 | C45H44O11 | R | 581.1803, 471.1434, 419.1505 379.1141, 353.1007, 109.0290 | Guangsangon J |
| 42 | 21.34 | 419.1495 | 0.0 | C25H24O6 | R | 231.0659, 151.0027, 125.0233 | Sanggenon V |
| 43 | 21.81 | 421.1643 | −1.9 | C25H26O6 | R | 151.0028, 125.0237 | Sanggenon J |
| 44a | 23.62 | 407.1854 | −1.2 | C25H28O5 | R | 389.1764, 297.1487, 109.0289 | Dihydrorubraflavone A |
| 45 | 24.15 | 647.2296 | −2.3 | C39H36O9 | R | 469.1299, 359.0928, 109.0291 | Chalcomoracin |
| 46 | 25.72 | 419.1500 | 1.1 | C25H24O6 | R, T | 297.1134, 191.0709, 109.0291 | Morusin |
| 47a | 26.25 | 421.1639 | −2.8 | C25H26O6 | R, T | 295.1333, 151.0028, 125.0239 | Dihydrosanggenon V |
| 48a | 26.72 | 407.1883 | 5.8 | C25H28O5 | R | 407.1883, 283.0635, 137.0265 | Dihydrokuwanon S |
| 49 | 27.16 | 419.1505 | 1.4 | C25H24O6 | R, T | 263.0893, 203.0744 | Cyclomulberrin |
| 50 | 28.11 | 437.1599 | −0.4 | C25H26O7 | R | 368.0899, 151.0037, 125.0245 | Sanggenon N |
| 51 | 28.74 | 405.1708 | 1.4 | C25H26O5 | R | 335.0920, 321.0749, 282.0525 | Kuwanon S |
| 52 | 29.73 | 437.1641 | 9.1 | C25H26O7 | R, T | 381.1001, 365.1049, 309.0430 | Morusinol |
| 53 | 30.72 | 391.1943 | −0.2 | C25H28O4 | R | 323.1339, 267.0676, 149.0259 | Mulberrofuran A |
| 54 | 31.48 | 435.1449 | 2.2 | C25H24O7 | R | 366.0742, 151.0032, 125.0242 | 10-oxoisomornigrol F |
| 55 | 32.09 | 491.2400 | −6.9 | C30H36O6 | R | 297.1490, 193.0865 | Isoanggenol P |
| 56 | 32.33 | 491.2388 | 1.4 | C30H36O6 | R | 463.2458, 193.0854, 177.0176 | Sanggenol P |
| 57a | 32.66 | 489.2290 | −2.6 | C33H40O19 | R | 433.1634, 377.1048 | Dehydroanggenol P |
| 58 | 33.58 | 491.2422 | −2.4 | C30H36O6 | R | 473.2317, 365.2116, 125.0236 | Sanggenol H |
| 59 | 35.48 | 339.1235 | 1.5 | C20H20O5 | All | 177.0919, 161.0243, 135.0450 | Euchrenone A |
| 60 | 36.11 | 489.2288 | 2.2 | C30H34O6 | R, T | 231.0656, 216.0383, 179.0587 | 3′-Geranyl-3-prenyl- 2′,4′,5,7-tetrahydro- xyflavone |
Publisher’s Note: MDPI stays neutral with regard to jurisdictional claims in published maps and institutional affiliations. |
© 2022 by the authors. Licensee MDPI, Basel, Switzerland. This article is an open access article distributed under the terms and conditions of the Creative Commons Attribution (CC BY) license (https://creativecommons.org/licenses/by/4.0/).
Share and Cite
Zhou, Q.Y.-J.; Liao, X.; Kuang, H.-M.; Li, J.-Y.; Zhang, S.-H. LC-MS Metabolite Profiling and the Hypoglycemic Activity of Morus alba L. Extracts. Molecules 2022, 27, 5360. https://doi.org/10.3390/molecules27175360
Zhou QY-J, Liao X, Kuang H-M, Li J-Y, Zhang S-H. LC-MS Metabolite Profiling and the Hypoglycemic Activity of Morus alba L. Extracts. Molecules. 2022; 27(17):5360. https://doi.org/10.3390/molecules27175360
Chicago/Turabian StyleZhou, Qing Yi-Jun, Xin Liao, Hao-Ming Kuang, Jia-Yu Li, and Shui-Han Zhang. 2022. "LC-MS Metabolite Profiling and the Hypoglycemic Activity of Morus alba L. Extracts" Molecules 27, no. 17: 5360. https://doi.org/10.3390/molecules27175360
APA StyleZhou, Q. Y.-J., Liao, X., Kuang, H.-M., Li, J.-Y., & Zhang, S.-H. (2022). LC-MS Metabolite Profiling and the Hypoglycemic Activity of Morus alba L. Extracts. Molecules, 27(17), 5360. https://doi.org/10.3390/molecules27175360