
Effects of High Hydrostatic Pressure and Storage Temperature on Fatty Acids and Non-Volatile Taste Active Compounds in Red Claw Crayfish (Cherax quadricarinatus)


Abstract
:1. Introduction
2. Results and Discussion
2.1. Fatty Acid Compositions
2.2. Changes of FAAs and 5′-Nucleotide Contents in Crayfish
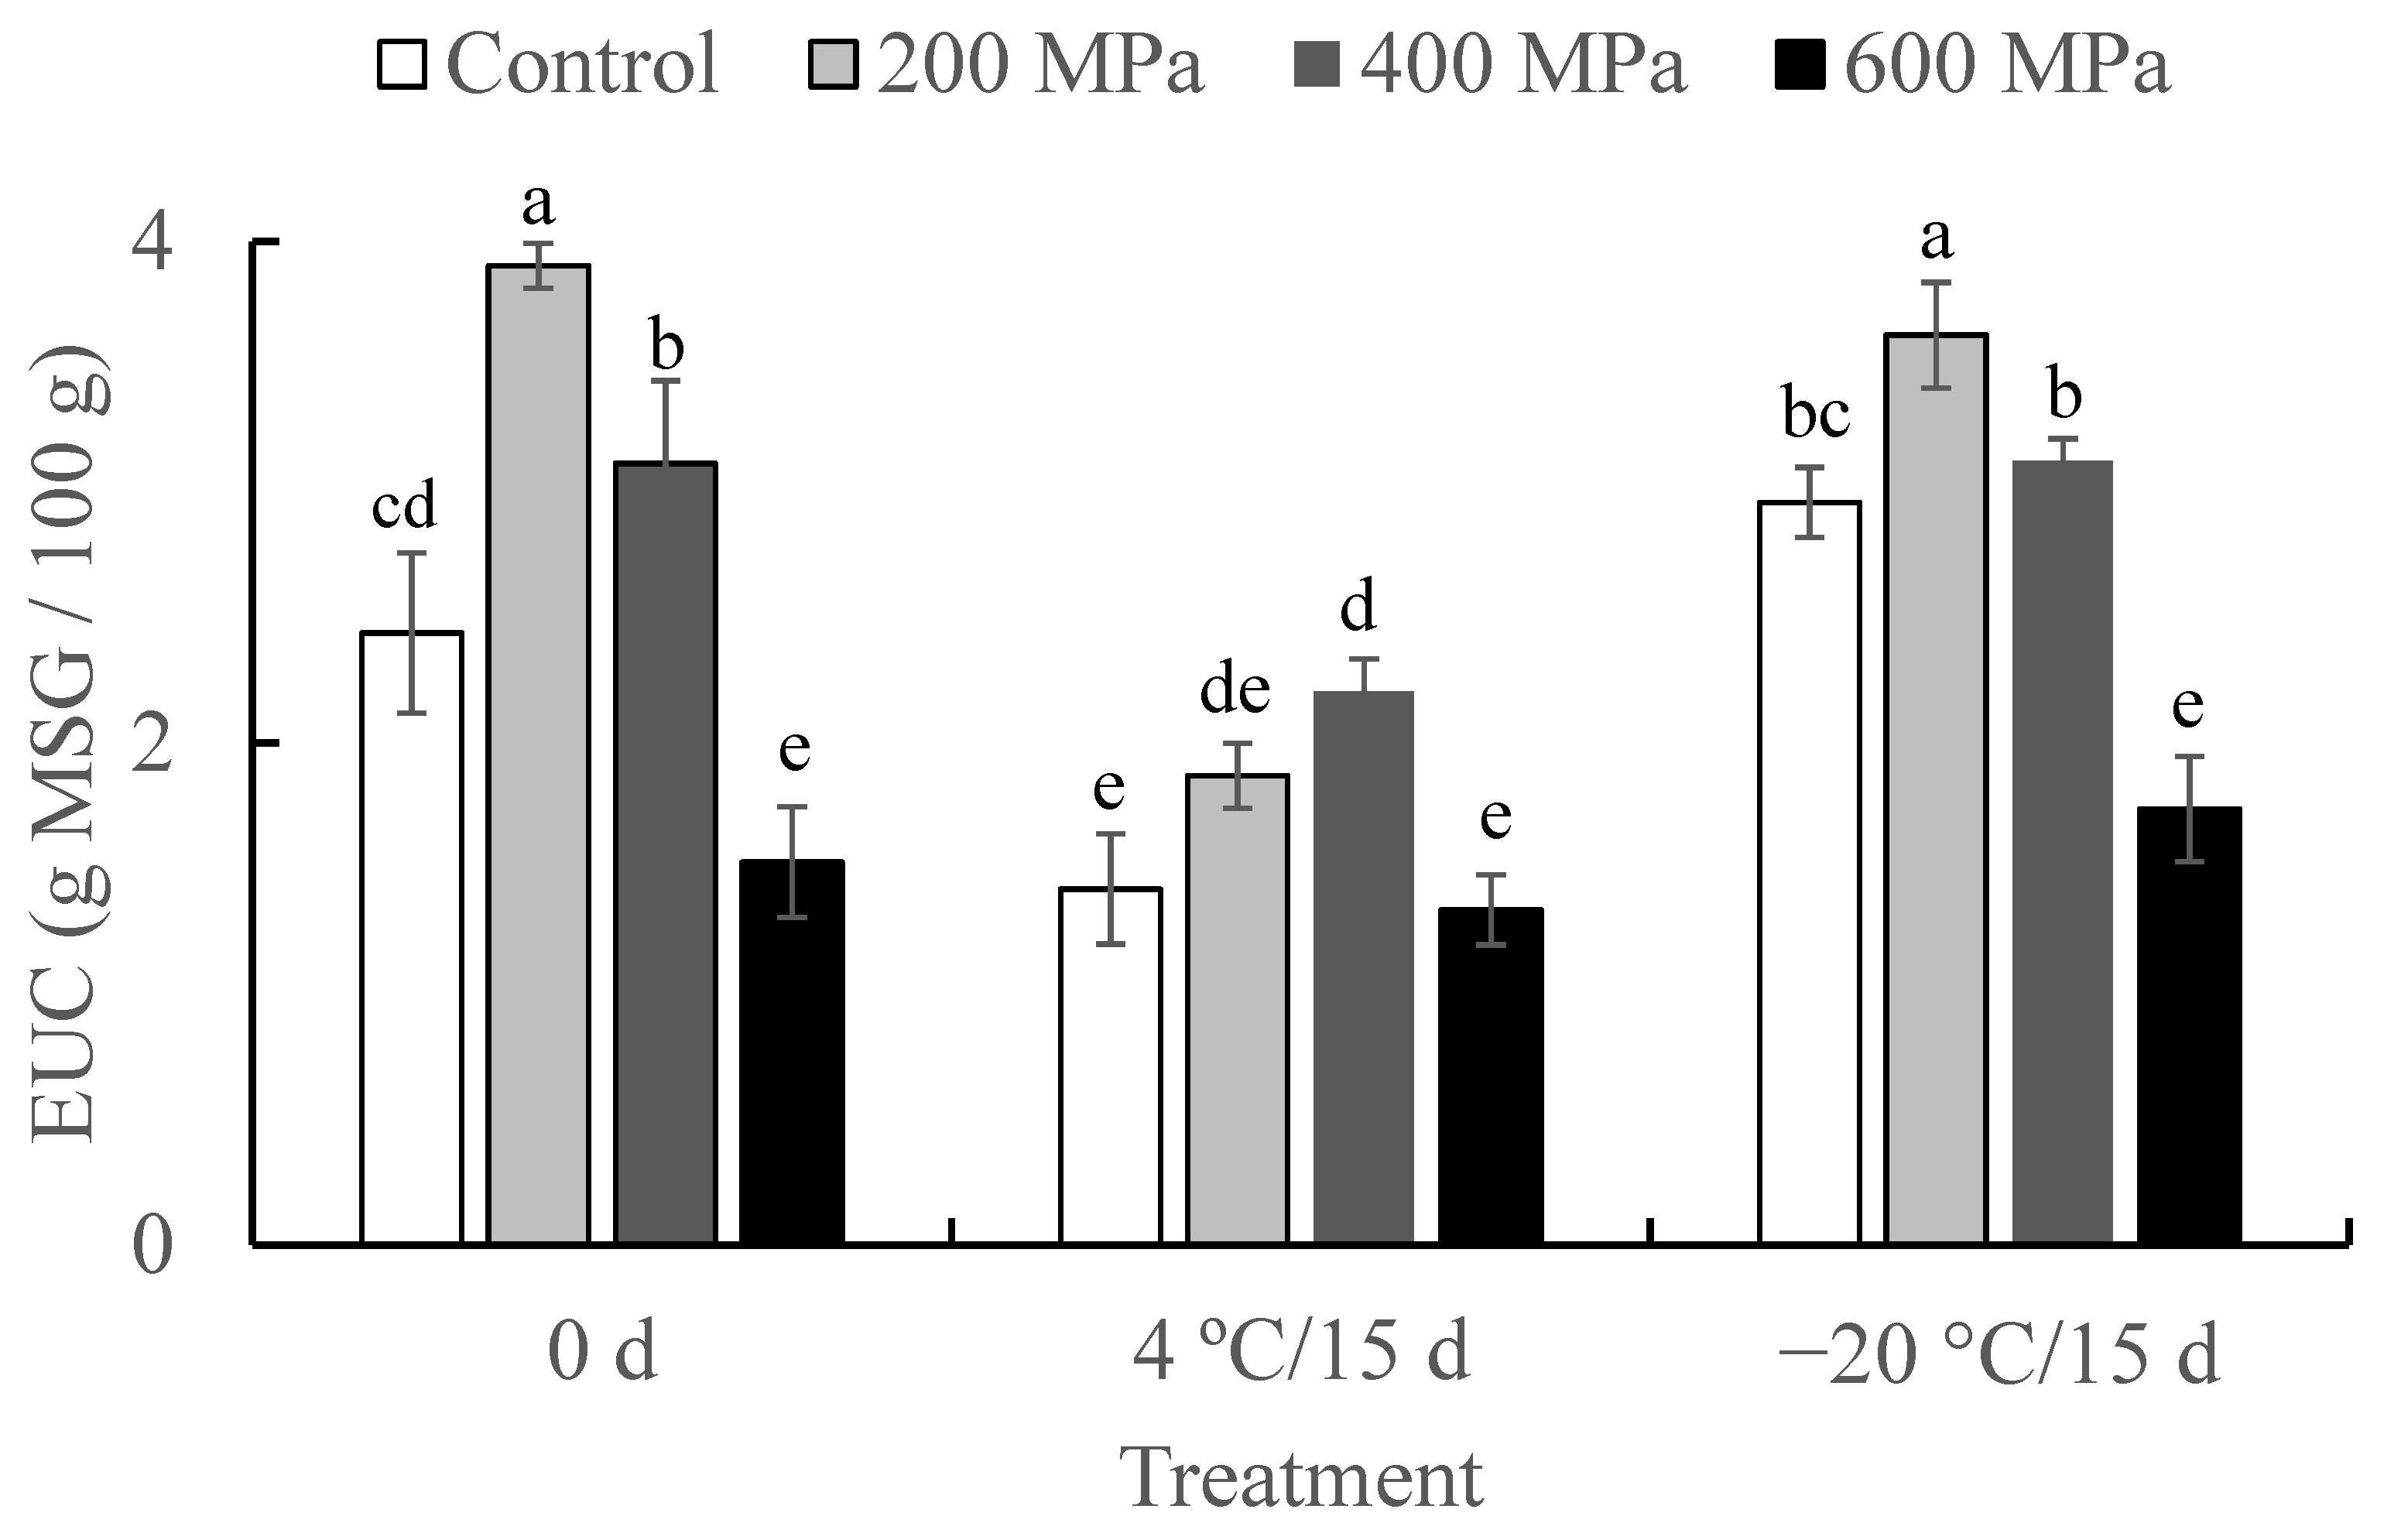
2.3. Effect of HHP on EUC of Crayfish
2.4. Comparison of Organic Acids and Betaine in Crayfish
2.5. Changes of Inorganic Ions in Crayfish
3. Materials and Methods
3.1. Sampling, Packaging, and Pressure Treatment
3.2. Fatty Acid Analysis
3.3. Free Amino Acid Assay
3.4. 5′-Nucleotide Assay
3.5. Equivalent Umami Concentration (EUC)
3.6. Organic Acid and Betaine Assay
3.7. Inorganic Ion Assay
3.8. Statistical Analysis
4. Conclusions
Author Contributions
Funding
Institutional Review Board Statement
Informed Consent Statement
Data Availability Statement
Conflicts of Interest
Sample Availability
References
- Cai, J.; Zhou, X.; Yan, X.; Lucente, D.; Lagana, C. Top 10 Species Groups in Global Aquaculture 2017; FAO Fisheries and Aquaculture Department: Rome, Italy, 2019; CA5224EN/1/06.19. [Google Scholar]
- Jones, C.M. Production of juvenile redclaw crayfish, Cherax quadricarinatus (von Martens) (Decapoda, Parastacidae) I. Development of hatchery and nursery procedures. Aquaculture 1995, 138, 221–238. [Google Scholar] [CrossRef]
- Jones, C.M.; Ruscoe, I.M. Assessment of stocking size and density in the production of redclaw crayfish, Cherax quadricarinatus (von Martens) (Decapoda: Parastacidae), cultured under earthen pond conditions. Aquaculture 2000, 189, 63–71. [Google Scholar] [CrossRef]
- Nunes, A.L.; Zengeya, T.A.; Hoffman, A.C.; Measey, G.J.; Weyl, O.L.F. Distribution and establishment of the alien Australian redclaw crayfish, Cherax quadricarinatus, in South Africa and Swaziland. PeerJ 2017, 5, e3135. [Google Scholar] [CrossRef] [PubMed] [Green Version]
- Liu, S.; Qi, C.; Jia, Y.; Gu, Z.; Li, E. Growth and intestinal health of the red claw crayfish, Cherax quadricarinatus, reared under different salinities. Aquaculture 2020, 524, 735256. [Google Scholar] [CrossRef]
- Yin, Y.; Yan, W.; Zheng, Y.; Peng, G. Research progress and industrial development prospect in Jiangsu province for Cherax quadricarinutus. J. Aquac. 2018, 39, 9–13, (In Chinese with English Abstract). [Google Scholar]
- Yuan, J.; Guo, J.; Wang, H.; Guo, A.; Lian, Q.; Gu, Z. Acute toxicity of cypermethrin on the juvenile of red claw crayfish Cherax quadricarinatus. Chemosphere 2019, 237, 124468. [Google Scholar] [CrossRef]
- Du, S.; Zhang, Z.; Xiao, L.; Lou, Y.; Pan, Y.; Zhao, Y. Acidic electrolyzed water as a novel transmitting medium for high hydrostatic pressure reduction of bacterial loads on shelled fresh shrimp. Front. Microbiol. 2016, 7, 305. [Google Scholar] [CrossRef] [Green Version]
- Liu, C.; Gu, Z.; Lin, X.; Wang, Y.; Wang, A.; Sun, Y.; Shi, Y. Effects of high hydrostatic pressure (HHP) and storage temperature on bacterial counts, color change, fatty acids and non-volatile taste active compounds of oysters (Crassostrea ariakensis). Food Chem. 2022, 372, 1311247. [Google Scholar] [CrossRef]
- Nirmal, N.P.; Benjakul, S. Effect of catechin and ferulic acid on melanosis and quality of Pacific white shrimp subjected to prior freeze–thawing during refrigerated storage. Food Control 2010, 21, 1263–1271. [Google Scholar] [CrossRef]
- Aganovic, K.; Hertel, C.; Vogel, R.F.; Johne, R.; Schlüter, O.; Schwarzenbolz, U.; Jäger, H.; Holzhauser, T.; Bergmair, J.; Roth, A.; et al. Aspects of high hydrostatic pressure food processing: Perspectives on technology and food safety. Compr. Rev. Food Sci. 2021, 20, 3225–3266. [Google Scholar] [CrossRef]
- Rathod, N.B.; Kulawik, P.; Ozogul, Y.; Ozogul, F.; Bekhit, A.E.D.A. Recent developments in non-thermal processing for seafood and seafood products: Cold plasma, pulsed electric field and high hydrostatic pressure. Int. J. Food Sci. Technol. 2022, 57, 774–790. [Google Scholar] [CrossRef]
- Lorido, L.; Estévez, M.; Ventanas, J.; Ventanas, S. Comparative study between Serrano and Iberian dry–cured hams in relation to the application of high hydrostatic pressure and temporal sensory perceptions. LWT Food Sci. Technol. 2015, 64, 1234–1242. [Google Scholar] [CrossRef]
- Liu, C.; Ji, W.; Jiang, H.; Shi, Y.; He, L.; Gu, Z.; Zhu, S. Comparison of biochemical composition and non–volatile taste active compounds in raw, high hydrostatic pressure-treated and steamed oysters Crassostrea hongkongensis. Food Chem. 2021, 344, 128632. [Google Scholar] [CrossRef]
- Xuan, X.; Cui, Y.; Lin, X.; Yu, J.; Liao, X.; Ling, J.; Shang, H. Impact of high hydrostatic pressure on the shelling efficacy, physicochemical properties, and microstructure of fresh razor clam (Sinonovacula constricta). J. Food Sci. 2018, 83, 284–293. [Google Scholar] [CrossRef]
- Yi, J.; Zhang, L.; Ding, G.; Hu, X.; Liao, X.; Zhang, Y. High hydrostatic pressure and thermal treatments for ready-to-eat wine-marinated shrimp: An evaluation of microbiological and physicochemical qualities. Innov. Food Sci. Emerg. 2013, 20, 16–23. [Google Scholar] [CrossRef]
- Campus, M. High pressure processing of meat, meat products and seafood. Food Eng. Rev. 2010, 2, 256–273. [Google Scholar] [CrossRef]
- Ginson, J.; Kamalakanth, C.; Bindu, J.; Venkateswarlu, R.; Das, S.; Chauhan, O.; Gopal, T.K.S. Changes in K value, microbiological and sensory acceptability of high pressure processed Indian white prawn (Fenneropenaeus indicus). Food Bioprocess Technol. 2013, 6, 1175–1180. [Google Scholar] [CrossRef]
- Martínez, M.A.; Velazquez, G.; Cando, D.; Núñez-Flores, R.; Borderías, A.J.; Moreno, H.M. Effects of high pressure processing on protein fractions of blue crab (Callinectes sapidus) meat. Innov. Food Sci. Emerg. 2017, 41, 323–329. [Google Scholar] [CrossRef]
- Yi, J.; Xu, Q.; Hu, X.; Dong, P.; Liao, X.; Zhang, Y. Shucking of bay scallop (Argopecten irradians) using high hydrostatic pressure and its effect on microbiological and physical quality of adductor muscle. Innov. Food Sci. Emerg. 2013, 18, 57–64. [Google Scholar] [CrossRef]
- Yue, J.; Zhang, Y.; Jin, Y.; Deng, Y.; Zhao, Y. Impact of high hydrostatic pressure on non-volatile and volatile compounds of squid muscles. Food Chem. 2016, 194, 12–19. [Google Scholar] [CrossRef]
- Yagiz, Y.; Kristinsson, H.G.; Balaban, M.O.; Welt, B.A.; Ralat, M.; Marshall, M.R. Effect of high pressure processing and cooking treatment on the quality of Atlantic salmon. Food Chem. 2009, 116, 828–835. [Google Scholar] [CrossRef]
- Méndez-Martínez, Y.; Ceseña, C.E.; Luna-González, A.; García-Guerrero, M.U.; Martinez-Porchas, M.; Campa-Cordova, Á.I.; Cortés-Jacinto, E. Effects of different dietary protein energy ratios on growth, carcass amino acid and fatty acid profile of male and female Cherax quadricarinatus (von Martens, 1868) pre-adults. Aquacult. Nutr. 2021, 27, 2481–2496. [Google Scholar] [CrossRef]
- Lin, X.; Liu, C.; Cai, L.; Yang, J.; Zhou, J.; Jiang, H.; Shi, Y.; Gu, Z. Effect of high hydrostatic pressure processing on biochemical characteristics, bacterial counts, and color of the red claw crayfish Cherax quadricarinatus. J. Shell. Res. 2021, 40, 177–184. [Google Scholar] [CrossRef]
- Li, J.; Guo, Z.; Gan, X.; Wang, Q.; Zhao, Y. Biochemical changes during vitellogenesis in the red claw crayfish, Cherax quadricarinatus (von Martens). Aquac. Res. 2010, 41, 446–455. [Google Scholar] [CrossRef]
- Li, J.; Guo, Z.; Gan, X.; Wang, D.; Zhang, M.; Zhao, Y. Effect of different dietary lipid sources on growth and gonad maturation of pre–adult female Cherax quadricarinatus (von Martens). Aquacult. Nutr. 2011, 17, e853–e860. [Google Scholar] [CrossRef]
- MacDonald, G.A.; Hall, B.I.; Vlieg, P.; Fox, S.; Osborne, T. Seasonal Changes in Proximate Composition and Glycogen Content of Greenshell Mussels; Mussel Industry Council Seminar, Crop & Food Research Ltd.: Nelson, New Zealand, 2000. [Google Scholar]
- Šimat, V.; Bogdanović, T.; Poljak, V.; Petričević, S. Changes in fatty acid composition, atherogenic and thrombogenic health lipid indices and lipid stability of bogue (Boops boops Linnaeus, 1758) during storage on ice: Effect of fish farming activities. J. Food Compos. Anal. 2015, 40, 120–125. [Google Scholar] [CrossRef]
- Odeyemi, O.A.; Burke, C.M.; Bolch, C.C.J.; Stanley, R. Seafood spoilage microbiota and associated volatile organic compounds at different storage temperatures and packaging conditions. Int. J. Food Mocrobiol. 2018, 280, 87–99. [Google Scholar] [CrossRef]
- Liu, C.; Meng, F.; Tang, X.; Shi, Y.; Wang, A.; Gu, Z.; Pan, Z. Comparison of nonvolatile taste active compounds of wild and cultured mud crab Scylla paramamosain. Fish. Sci. 2018, 84, 897–907. [Google Scholar] [CrossRef]
- Chen, L.; Zeng, W.; Rong, Y.; Lou, B. Characterisation of taste active compositions, umami attributes and aroma compounds in Chinese shrimp. Int. J. Food Sci. Technol. 2021, 56, 6311–6321. [Google Scholar] [CrossRef]
- Shigematsu, T.; Hayashi, M.; Nakajima, K.; Uno, Y.; Sakano, A.; Murakami, M.; Narahara, Y.; Ueno, S.; Fujii, T. Effects of high hydrostatic pressure on distribution dynamics of free amino acids in water soaked brown rice grain. J. Phys. Confer. Ser. 2010, 215, 012171. [Google Scholar] [CrossRef]
- Zhang, Y.; Wang, Q.; Bi, Y.; Cheng, K.; Chen, F. Nutritional and functional activities of protein from steamed, baked, and high hydrostatic pressure treated cod (Gadus morhua). Food Control 2019, 96, 9–15. [Google Scholar] [CrossRef]
- Ahmed, J.; Habeebullah, S.F.K.; Thomas, L.; Mulla, M.Z.; Jacob, H.; Alagarsamy, S. Effect of high-pressure treatment and refrigerated storage on the amino acid profile, color, and texture of hammour (Epinephelus coioides) fillets. J. Food Process. Pres. 2021, 45, 15977. [Google Scholar] [CrossRef]
- Kong, L.; Cai, C.; Ye, Y.; Chen, D.; Wu, P.; Li, E.; Chen, L.; Song, L. Comparison of non–volatile compounds and sensory characteristics of Chinese mitten crabs (Eriocheir sinensis) reared in lakes and ponds: Potential environmental factors. Aquaculture 2012, 364–365, 96–102. [Google Scholar] [CrossRef]
- Chen, D.; Zhang, M. Non-volatile taste active compounds in the meat of Chinese mitten crab (Eriocheir sinensis). Food Chem. 2007, 104, 1200–1205. [Google Scholar] [CrossRef]
- Zheng, J.; Tao, N.; Gong, J.; Gu, S.; Xu, C. Comparison of non–volatile taste–active compounds between the cooked meats of pre- and post-spawning Yangtze Coilia ectenes. Fish. Sci. 2015, 81, 559–568. [Google Scholar] [CrossRef]
- Sarower, M.G.; Abul, F.M.H.; Biswas, B.; Abe, H. Taste producing components in fish and fisheries products: A review. Int. J. Food Ferm. Technol. 2012, 2, 113–121. [Google Scholar]
- Liu, Y.; Zhang, C.; Chen, S. Comparison of Active Non–volatile Taste Components in the Viscera and Adductor Muscles of Oyster (Ostrea rivularis Gould). Food Sci. Technol. Res. 2013, 19, 417–424. [Google Scholar] [CrossRef] [Green Version]
- Lopez–Garcia, R. Citric acid. In Kirk–Othmer Encyclopedia of Chemical Technology; John Wiley & Sons: Hoboken, NJ, USA, 2000; pp. 1–25. [Google Scholar]
- Guo, Y.; Gu, S.; Wang, X.; Zhuang, K.; Wang, S.; Shi, J. Nutrients and non–volatile taste compounds in Chinese mitten crab by–products. Fish. Sci. 2015, 81, 193–203. [Google Scholar] [CrossRef]
- Rastogi, N.K.; Niranjan, K. Enhanced mass transfer during osmotic dehydration of high pressure treated pineapple. J. Food Sci. 1998, 63, 508–511. [Google Scholar] [CrossRef]
- San Martín, M.F.B.A.; Barbosa-Cánovas, G.V.; Swanson, B.G. Food processing by high hydrostatic pressure. Crit. Rev. Food Sci. 2002, 42, 627–645. [Google Scholar] [CrossRef]
- Folch, J.; Lees, M.; Stanley, G.H.S. A simple method for the isolation and purification of total lipids from animal tissues. J. Biol. Chem. 1957, 226, 497–509. [Google Scholar] [CrossRef]
- Bai, J.; Fan, Y.; Zhu, L.; Wang, Y.; Hou, H. Characteristic flavor of Antarctic krill (Euphausia superba) and white shrimp (Penaeus vannamei) induced by thermal treatment. Food Chem. 2022, 378, 132074. [Google Scholar] [CrossRef]

| Fatty Acid (%) | 0 d | 4 °C /15 d | −20 °C /15 d | |||||||||
|---|---|---|---|---|---|---|---|---|---|---|---|---|
| Control | 200 MPa | 400 MPa | 600 MP | Control | 200 MPa | 400 MPa | 600 MP | Control | 200 MPa | 400 MPa | 600 MP | |
| C12:0 | 0.36 ± 0.02a | 0.28 ± 0.03ab | 0.21 ± 0.05b | 0.33 ± 0.07a | 0.23 ± 0.04b | 0.32 ± 0.05a | 0.25 ± 0.05b | 0.19 ± 0.07b | 0.27 ± 0.02ab | 0.20 ± 0.04 | 0.24 ± 0.02b | 0.20 ± 0.03b |
| C14:0 | 0.43 ± 0.04a | 0.51 ± 0.07a | 0.48 ± 0.05a | 0.58 ± 0.11a | 0.49 ± 0.09a | 0.56 ± 0.08a | 0.51 ± 0.04a | 0.46 ± 0.08a | 0.45 ± 0.02a | 0.47 ± 0.05a | 0.51 ± 0.06a | 0.49 ± 0.04a |
| C15:0 | 0.98 ± 0.04a | 1.01 ± 0.06a | 0.96 ± 0.13a | 1.23 ± 0.09a | 1.13 ± 0.14a | 1.18 ± 0.07a | 0.97 ± 0.09a | 0.97 ± 0.13a | 1.10 ± 0.07a | 1.02 ± 0.05a | 1.12 ± 0.11a | 1.07 ± 0.09a |
| C16:0 | 6.30 ± 0.34c | 7.04 ± 0.45bc | 7.25 ± 0.19bc | 8.01 ± 0.45a | 8.02 ± 0.25a | 7.88 ± 0.61ab | 8.22 ± 0.11a | 7.97 ± 0.29ab | 7.43 ± 0.12b | 7.52 ± 0.22b | 8.04 ± 0.18a | 8.08 ± 0.35a |
| C17:0 | 1.66 ± 0.05a | 1.54 ± 0.11a | 1.35 ± 0.06a | 1.65 ± 0.07a | 1.44 ± 0.05a | 1.70 ± 0.08a | 1.53 ± 0.06a | 1.36 ± 0.06a | 1.58 ± 0.06a | 1.31 ± 0.12a | 1.36 ± 0.09a | 1.51 ± 0.21a |
| C18:0 | 6.26 ± 0.71a | 6.05 ± 0.09a | 6.24 ± 0.22a | 6.54 ± 0.31a | 6.68 ± 0.18a | 6.08 ± 0.25a | 6.04 ± 0.31a | 6.36 ± 0.11a | 5.93 ± 0.26a | 6.51 ± 0.41a | 6.05 ± 0.18a | 5.96 ± 0.25a |
| C20:0 | 1.09 ± 0.04a | 0.88 ± 0.03ab | 0.65 ± 0.07b | 1.02 ± 0.12a | 0.75 ± 0.09ab | 0.94 ± 0.05ab | 0.80 ± 0.07ab | 0.65 ± 0.07b | 0.86 ± 0.05ab | 0.68 ± 0.04b | 0.79 ± 0.08ab | 0.66 ± 0.06b |
| ΣSFA | 17.08 ± 1.03b | 17.30 ± 0.78b | 17.14 ± 0.66b | 19.36 ± 0.98a | 18.74 ± 0.74ab | 18.67 ± 1.15ab | 18.32 ± 0.66ab | 17.96 ± 0.80b | 17.64 ± 0.47b | 17.71 ± 0.93b | 18.11 ± 0.68ab | 17.96 ± 0.93ab |
| C16:1n-7 | 2.98 ± 0.11a | 2.78 ± 0.11a | 2.60 ± 0.09a | 3.14 ± 0.21a | 2.87 ± 0.17a | 3.17 ± 0.22a | 3.25 ± 0.28a | 2.86 ± 0.11a | 3.09 ± 0.09a | 2.71 ± 0.11a | 2.98 ± 0.21a | 2.91 ± 0.25a |
| C16:1n-5 | 0.65 ± 0.08a | 0.51 ± 0.03a | 0.39 ± 0.06a | 0.59 ± 0.04a | 0.44 ± 0.06a | 0.58 ± 0.02a | 0.49 ± 0.04a | 0.40 ± 0.02a | 0.53 ± 0.05a | 0.39 ± 0.03a | 0.48 ± 0.06a | 0.42 ± 0.02a |
| C17:1n-7 | 1.27 ± 0.02a | 1.10 ± 0.03a | 0.93 ± 0.06a | 1.28 ± 0.07a | 1.07 ± 0.05a | 1.23 ± 0.07a | 1.13 ± 0.09a | 1.04 ± 0.07a | 1.16 ± 0.07a | 0.95 ± 0.10a | 1.06 ± 0.06a | 1.03 ± 0.08a |
| C18:1n-9 | 16.59 ± 1.12b | 17.11 ± 0.56b | 18.26 ± 0.66ab | 18.56 ± 1.23ab | 19.07 ± 0.83ab | 18.31 ± 0.79ab | 18.93 ± 1.37ab | 20.64 ± 0.98a | 17.50 ± 1.02ab | 18.00 ± 0.96ab | 18.44 ± 1.17ab | 19.62 ± 0.86a |
| ΣMUFA | 21.49 ± 1.10c | 21.50 ± 0.64c | 22.19 ± 0.75bc | 23.57 ± 0.98ab | 23.44 ± 0.86ab | 23.29 ± 0.84ab | 23.79 ± 1.30ab | 24.94 ± 1.04a | 22.26 ± 1.03bc | 22.06 ± 0.98bc | 22.97 ± 1.26bc | 23.98 ± 0.95ab |
| C18:2n-6 | 13.18 ± 0.78c | 15.18 ± 0.31ab | 15.70 ± 1.13ab | 15.10 ± 0.95ab | 15.86 ± 0.79ab | 15.04 ± 1.01abc | 15.83 ± 0.79ab | 15.80 ± 0.63ab | 14.89 ± 1.04abc | 16.63 ± 0.77a | 16.71 ± 0.83a | 16.56 ± 0.49a |
| C18:3n-6 | 1.36 ± 0.04a | 1.05 ± 0.03ab | 0.79 ± 0.05c | 1.22 ± 0.06a | 0.93 ± 0.07ab | 1.20 ± 0.04a | 1.00 ± 0.11ab | 0.81 ± 0.06c | 1.09 ± 0.07ab | 0.82 ± 0.04 | 0.95 ± 0.07ab | 0.83 ± 0.05ab |
| C18:3n-5 | 1.81 ± 0.05a | 1.36 ± 0.05ab | 0.94 ± 0.08c | 1.53 ± 0.14ab | 1.12 ± 0.05c | 1.53 ± 0.06ab | 1.17 ± 0.09c | 0.92 ± 0.08c | 1.33 ± 0.08ab | 1.12 ± 0.07c | 1.24 ± 0.13c | 0.96 ± 0.08c |
| C18:3n-3 | 2.32 ± 0.10a | 2.11 ± 0.22a | 2.73 ± 0.08a | 2.01 ± 0.25a | 2.01 ± 0.18a | 2.43 ± 0.16a | 2.20 ± 0.26a | 1.76 ± 0.14a | 2.21 ± 0.14a | 1.81 ± 0.12a | 2.07 ± 0.09a | 2.15 ± 0.21a |
| C18:2n-7 | 1.60 ± 0.06a | 1.33 ± 0.05a | 1.01 ± 0.08a | 1.70 ± 0.07a | 1.25 ± 0.09a | 1.59 ± 0.05a | 1.20 ± 0.07a | 1.05 ± 0.08a | 1.32 ± 0.09a | 1.08 ± 0.05a | 1.24 ± 0.11a | 1.00 ± 0.07a |
| C20:2n-6 | 2.76 ± 0.07a | 2.88 ± 0.06a | 2.77 ± 0.11a | 3.05 ± 0.14a | 2.78 ± 0.06a | 3.03 ± 0.21a | 2.82 ± 0.07a | 2.86 ± 0.21a | 2.85 ± 0.08a | 2.88 ± 0.09a | 3.01 ± 0.26a | 2.92 ± 0.17a |
| C20:4n-6 (ARA) | 10.35 ± 0.33a | 9.99 ± 0.23a | 8.06 ± 0.36bc | 7.60 ± 0.27c | 8.00 ± 0.18bc | 8.92 ± 0.31ab | 7.65 ± 0.15c | 8.25 ± 0.22bc | 8.65 ± 0.37bc | 7.92 ± 0.29c | 7.47 ± 0.26c | 8.11 ± 0.19bc |
| C20:5n-3 (EPA) | 22.23 ± 1.09a | 21.22 ± 1.10ab | 22.19 ± 1.16a | 19.06 ± 0.78bc | 20.62 ± 1.22ab | 18.55 ± 0.60c | 20.43 ± 0.75ab | 19.73 ± 1.01bc | 22.40 ± 0.85a | 22.09 ± 0.77a | 20.59 ± 0.82ab | 20.10 ± 0.46abc |
| C22:6n-3 (DHA) | 5.81 ± 0.22a | 6.07 ± 0.18a | 6.37 ± 0.32a | 5.80 ± 0.27a | 5.25 ± 0.18a | 5.75 ± 0.36a | 5.59 ± 0.16a | 5.93 ± 0.31a | 5.36 ± 0.41a | 5.89 ± 0.24a | 5.63 ± 0.19a | 5.44 ± 0.26a |
| ΣPUFA | 61.44 ± 2.26a | 61.19 ± 2.10a | 60.68 ± 2.57ab | 57.07 ± 2.18b | 57.82 ± 1.68b | 58.04 ± 1.96b | 57.90 ± 2.14b | 57.50 ± 2.41b | 60.10 ± 2.51ab | 60.23 ± 2.50ab | 58.92 ± 2.17b | 58.07 ± 1.76b |
| Σn-3 | 30.37 ± 1.23ab | 29.40 ± 1.32ab | 31.39 ± 1.44a | 27.07 ± 1.16c | 27.88 ± 1.37bc | 26.73 ± 1.04c | 28.22 ± 1.13bc | 27.42 ± 1.34bc | 29.97 ± 1.32ab | 29.79 ± 1.08ab | 28.30 ± 1.01bc | 27.69 ± 0.89bc |
| Σn-6 | 27.65 ± 1.19ab | 29.10 ± 0.57a | 27.33 ± 1.36ab | 26.77 ± 1.12b | 27.57 ± 0.97ab | 28.20 ± 1.36ab | 27.30 ± 1.02ab | 27.71 ± 1.12ab | 27.47 ± 1.23ab | 28.24 ± 1.13ab | 28.15 ± 1.23ab | 28.41 ± 0.75ab |
| Σn-3/Σn-6 | 1.10 | 1.01 | 1.15 | 1.01 | 1.01 | 0.95 | 1.03 | 0.99 | 1.09 | 1.05 | 1.01 | 0.97 |
| FAA (mg/g) | 0 d | 4 °C/15 d | −20 °C/15 d | Taste Attribute | |||||||||
|---|---|---|---|---|---|---|---|---|---|---|---|---|---|
| Control | 200 MPa | 400 MPa | 600 MPa | Control | 200 MPa | 400 MPa | 600 MPa | Control | 200 MPa | 400 MPa | 600 MPa | ||
| Aspartic acid | 0.02 ± 0.00c | 0.03 ± 0.01c | 0.06 ± 0.01ab | 0.08 ± 0.02a | 0.03 ± 0.01c | 0.03 ± 0.01c | 0.10 ± 0.01a | 0.09 ± 0.02a | 0.02 ± 0.02c | 0.02 ± 0.01c | 0.04 ± 0.01bc | 0.09 ± 0.01a | Umami (+) |
| Glutamic acid | 0.10 ± 0.01e | 0.23 ± 0.02d | 0.42 ± 0.02bc | 0.28 ± 0.01cd | 0.13 ± 0.02e | 0.21 ± 0.03d | 0.58 ± 0.03a | 0.47 ± 0.02ab | 0.11 ± 0.02e | 0.23 ± 0.03d | 0.34 ± 0.03c | 0.27 ± 0.02cd | Umami (+) |
| ΣUAA | 0.12 ± 0.01f | 0.26 ± 0.03de | 0.48 ± 0.03bc | 0.36 ± 0.02cd | 0.16 ± 0..03ef | 0.24 ± 0.03de | 0.68 ± 0.04a | 0.56 ± 0.03ab | 0.13 ± 0.03f | 0.25 ± 0.04de | 0.38 ± 0.04cd | 0.36 ± 0.03cd | |
| Threonine | 0.12 ± 0.02b | 0.30 ± 0.03a | 0.27 ± 0.04a | 0.41 ± 0.02a | 0.26 ± 0.03a | 0.30 ± 0.04a | 0.18 ± 0.02ab | 0.30 ± 0.03a | 0.23 ± 0.03ab | 0.20 ± 0.02ab | 0.31 ± 0.05a | 0.41 ± 0.03a | Sweet (+) |
| Serine | 0.24 ± 0.02a | 0.29 ± 0.02a | 0.17 ± 0.02a | 0.26 ± 0.03a | 0.25 ± 0.01a | 0.19 ± 0.02a | 0.08 ± 0.03b | 0.08 ± 0.03b | 0.25 ± 0.02a | 0.23 ± 0.03a | 0.25 ± 0.01a | 0.23 ± 0.04a | Sweet (+) |
| Glycine | 2.22 ± 0.11a | 1.07 ± 0.08b | 1.27 ± 0.06b | 1.03 ± 0.09b | 0.98 ± 0.08b | 1.56 ± 0.13ab | 1.47 ± 0.06ab | 1.12 ± 0.07b | 0.96 ± 0.08b | 1.23 ± 0.05b | 1.57 ± 0.06ab | 1.23 ± 0.04b | Sweet (+) |
| Alanine | 0.99 ± 0.12b | 1.73 ± 0.05ab | 1.54 ± 0.05ab | 1.47 ± 0.03ab | 1.60 ± 0.08ab | 1.99 ± 0.06a | 2.00 ± 0.22a | 1.77 ± 0.24ab | 1.09 ± 0.09b | 1.20 ± 0.04b | 1.64 ± 0.22ab | 1.64 ± 0.06ab | Sweet (+) |
| Proline | 0.23 ± 0.03c | 0.48 ± 0.04bc | 0.54 ± 0.03ab | 0.37 ± 0.05bc | 0.55 ± 0.03ab | 0.57 ± 0.05ab | 0.86 ± 0.04a | 0.55 ± 0.05ab | 0.41 ± 0.05bc | 0.42 ± 0.04bc | 0.58 ± 0.06ab | 0.41 ± 0.05bc | Sweet/bitter (+) |
| Glutamine | 0.99 ± 0.14c | 1.56 ± 0.08ab | 1.76 ± 0.06a | 1.52 ± 0.06ab | 0.84 ± 0.07bc | 0.91 ± 0.08c | 1.01 ± 0.05c | 1.33 ± 0.09bc | 1.24 ± 0.12bc | 1.35 ± 0.07bc | 1.87 ± 0.11a | 1.85 ± 0.08a | Sweet (+) |
| Asparagine | 0.24 ± 0.04b | 0.40 ± 0.04ab | 0.53 ± 0.02ab | 0.61 ± 0.05a | 0.24 ± 0.04b | 0.54 ± 0.03ab | 0.38 ± 0.04b | 0.49 ± 0.05ab | 0.35 ± 0.05b | 0.37 ± 0.07b | 0.59 ± 0.05ab | 0.66 ± 0.06a | Sweet (+) |
| ΣSAA | 5.03 ± 0.44c | 5.83 ± 0.37bc | 6.08 ± 0.22ab | 5.67 ± 0.26bc | 4.72 ± 0.34c | 6.06 ± 0.30ab | 5.98 ± 0.42ab | 5.64 ± 0.54bc | 4.53 ± 0.41c | 5.00 ± 0.28c | 6.81 ± 0.51a | 6.52 ± 0.33ab | |
| Valine | 0.10 ± 0.02c | 0.24 ± 0.02ab | 0.21 ± 0.02abc | 0.23 ± 0.03abc | 0.26 ± 0.03ab | 0.36 ± 0.02a | 0.40 ± 0.04a | 0.21 ± 0.02abc | 0.16 ± 0.02bc | 0.17 ± 0.03bc | 0.23 ± 0.04abc | 0.21 ± 0.04abc | Bitter/sweet (−) |
| Methionine | 0.11 ± 0.02b | 0.23 ± 0.04a | 0.20 ± 0.02ab | 0.23 ± 0.01a | 0.18 ± 0.03ab | 0.25 ± 0.01a | 0.28 ± 0.01a | 0.20 ± 0.04ab | 0.12 ± 0.01b | 0.15 ± 0.03b | 0.21 ± 0.04ab | 0.24 ± 0.03a | Bitter/sweet/sulfurous (−) |
| Leucine | 0.11 ± 0.04c | 0.28 ± 0.05ab | 0.21 ± 0.03bc | 0.23 ± 0.05bc | 0.31 ± 0.06ab | 0.49 ± 0.08a | 0.52 ± 0.09a | 0.24 ± 0.07bc | 0.15 ± 0.03c | 0.18 ± 0.06bc | 0.22 ± 0.04bc | 0.23 ± 0.01bc | Bitter (−) |
| Tryptophan | 0.24 ± 0.04e | 1.47 ± 0.06d | 2.36 ± 0.21cd | 0.15 ± 0.05e | 2.01 ± 0.23cd | 3.15 ± 0.31b | 5.94 ± 0.62a | 2.84 ± 0.14c | 0.49 ± 0.05e | 1.32 ± 0.07d | 2.86 ± 0.11c | 0.22 ± 0.06e | Bitter (−) |
| Phenylalanine | 0.16 ± 0.03bc | 0.13 ± 0.02c | 0.24 ± 0.04b | 0.25 ± 0.02b | 0.25 ± 0.04b | 0.39 ± 0.05a | 0.44 ± 0.06a | 0.31 ± 0.04ab | 0.16 ± 0.03bc | 0.19 ± 0.06bc | 0.23 ± 0.05b | 0.25 ± 0.04b | Bitter (−) |
| Lysine | 0.19 ± 0.06c | 0.48 ± 0.03b | 0.44 ± 0.07b | 0.46 ± 0.07b | 0.27 ± 0.05bc | 0.67 ± 0.07a | 0.74 ± 0.04a | 0.45 ± 0.06b | 0.24 ± 0.04bc | 0.30 ± 0.05bc | 0.45 ± 0.06b | 0.58 ± 0.04ab | Bitter/sweet (−) |
| Argnine | 6.26 ± 0.56b | 5.70 ± 0.36bc | 5.83 ± 0.44bc | 8.47 ± 0.48a | 3.00 ± 0.20d | 3.09 ± 0.19d | 2.24 ± 0.22e | 5.16 ± 0.19c | 5.44 ± 0.45bc | 4.98 ± 0.26c | 5.98 ± 0.41b | 8.28 ± 0.59a | Bitter/sweet (−) |
| Isoleucine | 0.06 ± 0.03b | 0.16 ± 0.05ab | 0.13 ± 0.01ab | 0.14 ± 0.04ab | 0.17 ± 0.02ab | 0.26 ± 0.06a | 0.29 ± 0.04a | 0.14 ± 0.04ab | 0.09 ± 0.06b | 0.10 ± 0.04b | 0.15 ± 0.05ab | 0.14 ± 0.03ab | Bitter (−) |
| Histidine | 0.34 ± 0.04b | 0.49 ± 0.02a | 0.32 ± 0.05b | 0.37 ± 0.06ab | 0.26 ± 0.03b | 0.53 ± 0.04a | 0.38 ± 0.03ab | 0.42 ± 0.06ab | 0.31 ± 0.03b | 0.34 ± 0.06b | 0.37 ± 0.03ab | 0.43 ± 0.06ab | Bitter (−) |
| Tyrosine | 0.15 ± 0.03a | 0.24 ± 0.06a | 0.23 ± 0.05a | 0.26 ± 0.06a | 0.24 ± 0.04a | 0.32 ± 0.02a | 0.31 ± 0.06a | 0.21 ± 0.07a | 0.16 ± 0.04a | 0.17 ± 0.06a | 0.15 ± 0.04a | 0.33 ± 0.07a | Bitter (−) |
| Cysteine | 0.03 ± 0.02a | 0.05 ± 0.03a | 0.05 ± 0.01a | ND | 0.03 ± 0.01a | 0.04 ± 0.02a | 0.04 ± 0.03a | 0.03 ± 0.01a | 0.03 ± 0.02a | 0.03 ± 0.02a | 0.04 ± 0.01a | ND | Bitter/sweet/sulfurous (−) |
| ΣBAA | 7.75 ± 0.87d | 9.37 ± 0.70bc | 10.22 ± 0.87ab | 10.79 ± 0.80ab | 6.98 ± 0.66d | 9.55 ± 0.78bc | 11.58 ± 1.01a | 10.21 ± 0.54ab | 7.35 ± 0.36d | 7.93 ± 0.67cd | 10.89 ± 0.76ab | 10.91 ± 0.81ab | |
| ΣFAA | 12.90 ± 1.21d | 15.46 ± 0.94bc | 16.78 ± 1.01ab | 16.82 ± 0.95ab | 11.86 ± 0.89d | 15.85 ± 0.94bc | 18.44 ± 1.23a | 16.41 ± 1.04ab | 12.01 ± 0.72d | 13.06 ± 0.89d | 18.08 ± 1.13a | 17.86 ± 0.99a | |
| Nucleotides (mg/100 g) | 0 d | 4 °C/15 d | −20 °C/15 d | |||||||||
|---|---|---|---|---|---|---|---|---|---|---|---|---|
| Control | 200 MPa | 400 MPa | 600 MPa | Control | 200 MPa | 400 MPa | 600 MPa | Control | 200 MPa | 400 MPa | 600 MPa | |
| CMP | 0.48 ± 0.21b | 0.63 ± 0.51ab | 0.74 ± 0.26ab | 0.68 ± 0.06ab | 0.54 ± 0.16b | 0.54 ± 0.17b | 0.86 ± 0.11ab | 0.48 ± 0.16b | 0.49 ± 0.09b | 0.54 ± 0.13b | 0.71 ± 0.33ab | 1.13 ± 0.09a |
| UMP | ND | 0.39 ± 0.09d | 0.69 ± 0.11cd | 0.80 ± 0.13cd | 1.02 ± 0.11bc | 0.73 ± 0.09cd | 1.32 ± 0.91ab | 0.72 ± 0.22cd | 0.33 ± 0.17d | 0.45 ± 0.16d | 1.25 ± 0.24ab | 2.45 ± 0.91a |
| GMP | 57.15 ± 3.48a | 25.46 ± 3.77b | 16.14 ± 2.97bc | 16.25 ± 2.31bc | 18.10 ± 3.05e | 2.83 ± 1.50e | 4.83 ± 1.04de | 8.91 ± 1.88cd | 50.02 ± 2.48a | 23.24 ± 2.49b | 21.43 ± 2.99b | 17.05 ± 3.67bc |
| IMP | 42.27 ± 3.39b | 69.61 ± 5.08a | 14.31 ± 2.79c | ND | 77.48 ± 4.52a | 61.78 ± 5.11a | 9.75 ± 1.55c | 1.04 ± 0.09d | 76.11 ± 7.32a | 63.40 ± 5.17a | 12.82 ± 3.12c | 1.06 ± 0.55d |
| AMP | 51.80 ± 2.98ab | 40.52 ± 3.61bc | 46.40 ± 7.99bc | 31.68 ± 5.32c | 6.90 ± 3.32d | 3.94 ± 1.57d | 6.80 ± 2.79d | 4.97 ± 3.52d | 65.54 ± 5.48a | 46.26 ± 4.42bc | 64.56 ± 7.41a | 55.15 ± 4.32ab |
| Organic Acid/Betaine (mg/g) | b | 4 °C/15 d | −20 °C/15 d | |||||||||
|---|---|---|---|---|---|---|---|---|---|---|---|---|
| Control | 200 MPa | 400 MPa | 600 MP | Control | 200 MPa | 400 MPa | 600 MP | Control | 200 MPa | 400 MPa | 600 MP | |
| Malic acid | 0.16 ± 0.03ef | 0.09 ± 0.03f | 0.07 ± 0.01f | 0.12 ± 0.02ef | 1.41 ± 0.09a | 0.97 ± 0.06b | 0.63 ± 0.06c | 0.15 ± 0.02ef | 0.32 ± 0.03d | 0.22 ± 0.02de | 0.02 ± 0.02 | 0.15 ± 0.09ef |
| Lactic acid | 2.67 ± 0.12d | 2.53 ± 0.21d | 1.14 ± 0.05e | 1.40 ± 0.08e | 6.24 ± 0.35a | 4.22 ± 0.18c | 0.83 ± 0.08e | 1.35 ± 0.09e | 5.43 ± 0.36b | 6.41 ± 0.28a | 1.22 ± 0.12e | 1.26 ± 0.09e |
| Citric acid | 59.82 ± 2.17a | 11.47 ± 1.04d | 11.69 ± 0.95d | 17.08 ± 4.42cd | 2.78 ± 0.26e | 2.61 ± 0.44e | 2.61 ± 0.28e | 5.88 ± 2.15e | 36.75 ± 3.47b | 12.24 ± 2.17d | 12.74 ± 0.48d | 19.78 ± 2.86c |
| Succinic acid | 9.62 ± 0.22ab | 8.74 ± 0.52bc | 8.32 ± 0.38bc | 7.94 ± 0.53c | 9.75 ± 0.48ab | 11.80 ± 0.73a | 8.87 ± 0.49bc | 7.60 ± 0.43c | 10.47 ± 1.25ab | 11.91 ± 1.39a | 9.69 ± 1.04ab | 7.26 ± 0.59c |
| Betaine | 0.01 ± 0.00a | 0.00 ± 0.00a | 0.00 ± 0.00a | 0.01 ± 0.00a | 0.00 ± 0.00a | 0.00 ± 0.00a | 0.00 ± 0.00a | 0.00 ± 0.00a | 0.00 ± 0.00a | 0.00 ± 0.00a | 0.00 ± 0.00a | 0.00 ± 0.00a |
| Mineral Ions | 0 d | 4 °C/15 d | −20 °C/15 d | |||||||||
|---|---|---|---|---|---|---|---|---|---|---|---|---|
| Control | 200 MPa | 400 MPa | 600 MPa | Control | 200 MPa | 400 MPa | 600 MP | Control | 200 MPa | 400 MPa | 600 MP | |
| Ca2+ (g/kg) | 0.89 ± 0.07d | 1.59 ± 0.36cd | 1.88 ± 0.31c | 1.80 ± 0.09c | 3.57 ± 0.22a | 3.47 ± 0.40a | 2.04 ± 0.27b | 2.29 ± 0.25b | 0.90 ± 0.09d | 1.36 ± 0.08cd | 1.97 ± 0.28c | 1.92 ± 0.16c |
| Na+ (g/kg) | 1.35 ± 0.06b | 1.87 ± 0.09ab | 1.76 ± 0.26ab | 1.58 ± 0.35b | 2.12 ± 024a | 2.01 ± 0.17a | 2.07 ± 0.15a | 2.24 ± 0.33a | 1.53 ± 0.27b | 1.56 ± 0.17b | 1.73 ± 0.09ab | 1.64 ± 0.08ab |
| K+ (g/kg) | 3.29 ± 0.25a | 2.71 ± 0.21ab | 2.88 ± 0.35ab | 3.07 ± 0.27a | 2.43 ± 0.09bc | 2.47 ± 0.14bc | 2.37 ± 0.17bc | 2.17 ± 0.14bc | 3.07 ± 0.27a | 2.86 ± 0.36ab | 2.75 ± 0.09ab | 2.78 ± 0.15ab |
| Mg2+ (g/kg) | 0.31 ± 0.03a | 0.33 ± 0.04a | 0.29 ± 0.03a | 0.32 ± 0.04a | 0.43 ± 0.05a | 0.37 ± 0.05a | 0.33 ± 0.02a | 0.27 ± 0.06a | 0.32 ± 0.04a | 0.34 ± 0.03a | 0.32 ± 0.05a | 0.30 ± 0.03a |
| Zn2+ (mg/kg) | 34.65 ± 1.13c | 39.93 ± 0.68ab | 39.85 ± 1.75ab | 42.01 ± 0.96a | 36.75 ± 1.25bc | 33.06 ± 1.06c | 38.15 ± 0.84bc | 42.24 ± 1.13a | 32.10 ± 1.40c | 36.14 ± 1.22bc | 41.92 ± 0.96a | 42.46 ± 1.04a |
| Cl− (mg/g) | 1.63 ± 0.05c | 2.37 ± 0.06bc | 2.12 ± 0.15bc | 1.73 ± 0.08c | 2.42 ± 0.28ab | 2.53 ± 0.17ab | 2.60 ± 0.09ab | 3.03 ± 0.22a | 1.89 ± 0.10c | 1.99 ± 0.25bc | 2.14 ± 0.08bc | 1.90 ± 0.05c |
| PO43− (mg/g) | 6.83 ± 0.09a | 5.07 ± 0.25b | 4.91 ± 0.12b | 5.34 ± 0.31ab | 0.69 ± 0.07c | 0.77 ± 0.07c | 1.11 ± 0.09c | 0.84 ± 0.08c | 6.15 ± 0.13a | 5.90 ± 0.21a | 5.27 ± 0.31ab | 5.52 ± 0.27ab |
Publisher’s Note: MDPI stays neutral with regard to jurisdictional claims in published maps and institutional affiliations. |
© 2022 by the authors. Licensee MDPI, Basel, Switzerland. This article is an open access article distributed under the terms and conditions of the Creative Commons Attribution (CC BY) license (https://creativecommons.org/licenses/by/4.0/).
Share and Cite
Liu, C.; Li, M.; Wang, Y.; Yang, Y.; Wang, A.; Gu, Z. Effects of High Hydrostatic Pressure and Storage Temperature on Fatty Acids and Non-Volatile Taste Active Compounds in Red Claw Crayfish (Cherax quadricarinatus). Molecules 2022, 27, 5098. https://doi.org/10.3390/molecules27165098
Liu C, Li M, Wang Y, Yang Y, Wang A, Gu Z. Effects of High Hydrostatic Pressure and Storage Temperature on Fatty Acids and Non-Volatile Taste Active Compounds in Red Claw Crayfish (Cherax quadricarinatus). Molecules. 2022; 27(16):5098. https://doi.org/10.3390/molecules27165098
Chicago/Turabian StyleLiu, Chunsheng, Meng Li, Yuanyuan Wang, Yi Yang, Aimin Wang, and Zhifeng Gu. 2022. "Effects of High Hydrostatic Pressure and Storage Temperature on Fatty Acids and Non-Volatile Taste Active Compounds in Red Claw Crayfish (Cherax quadricarinatus)" Molecules 27, no. 16: 5098. https://doi.org/10.3390/molecules27165098
APA StyleLiu, C., Li, M., Wang, Y., Yang, Y., Wang, A., & Gu, Z. (2022). Effects of High Hydrostatic Pressure and Storage Temperature on Fatty Acids and Non-Volatile Taste Active Compounds in Red Claw Crayfish (Cherax quadricarinatus). Molecules, 27(16), 5098. https://doi.org/10.3390/molecules27165098