
Small Molecular Drug Screening Based on Clinical Therapeutic Effect


Abstract
: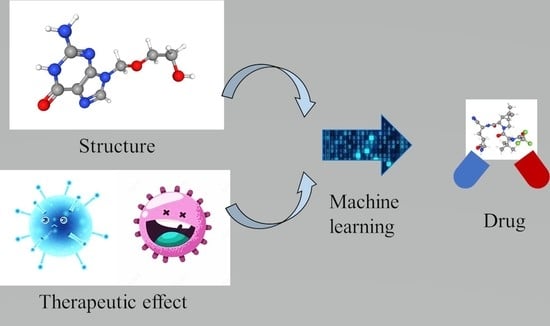
1. Introduction
2. Results and Discussion
2.1. The Comparison of Different Molecular Sets, Description Sets, and Classification Methods
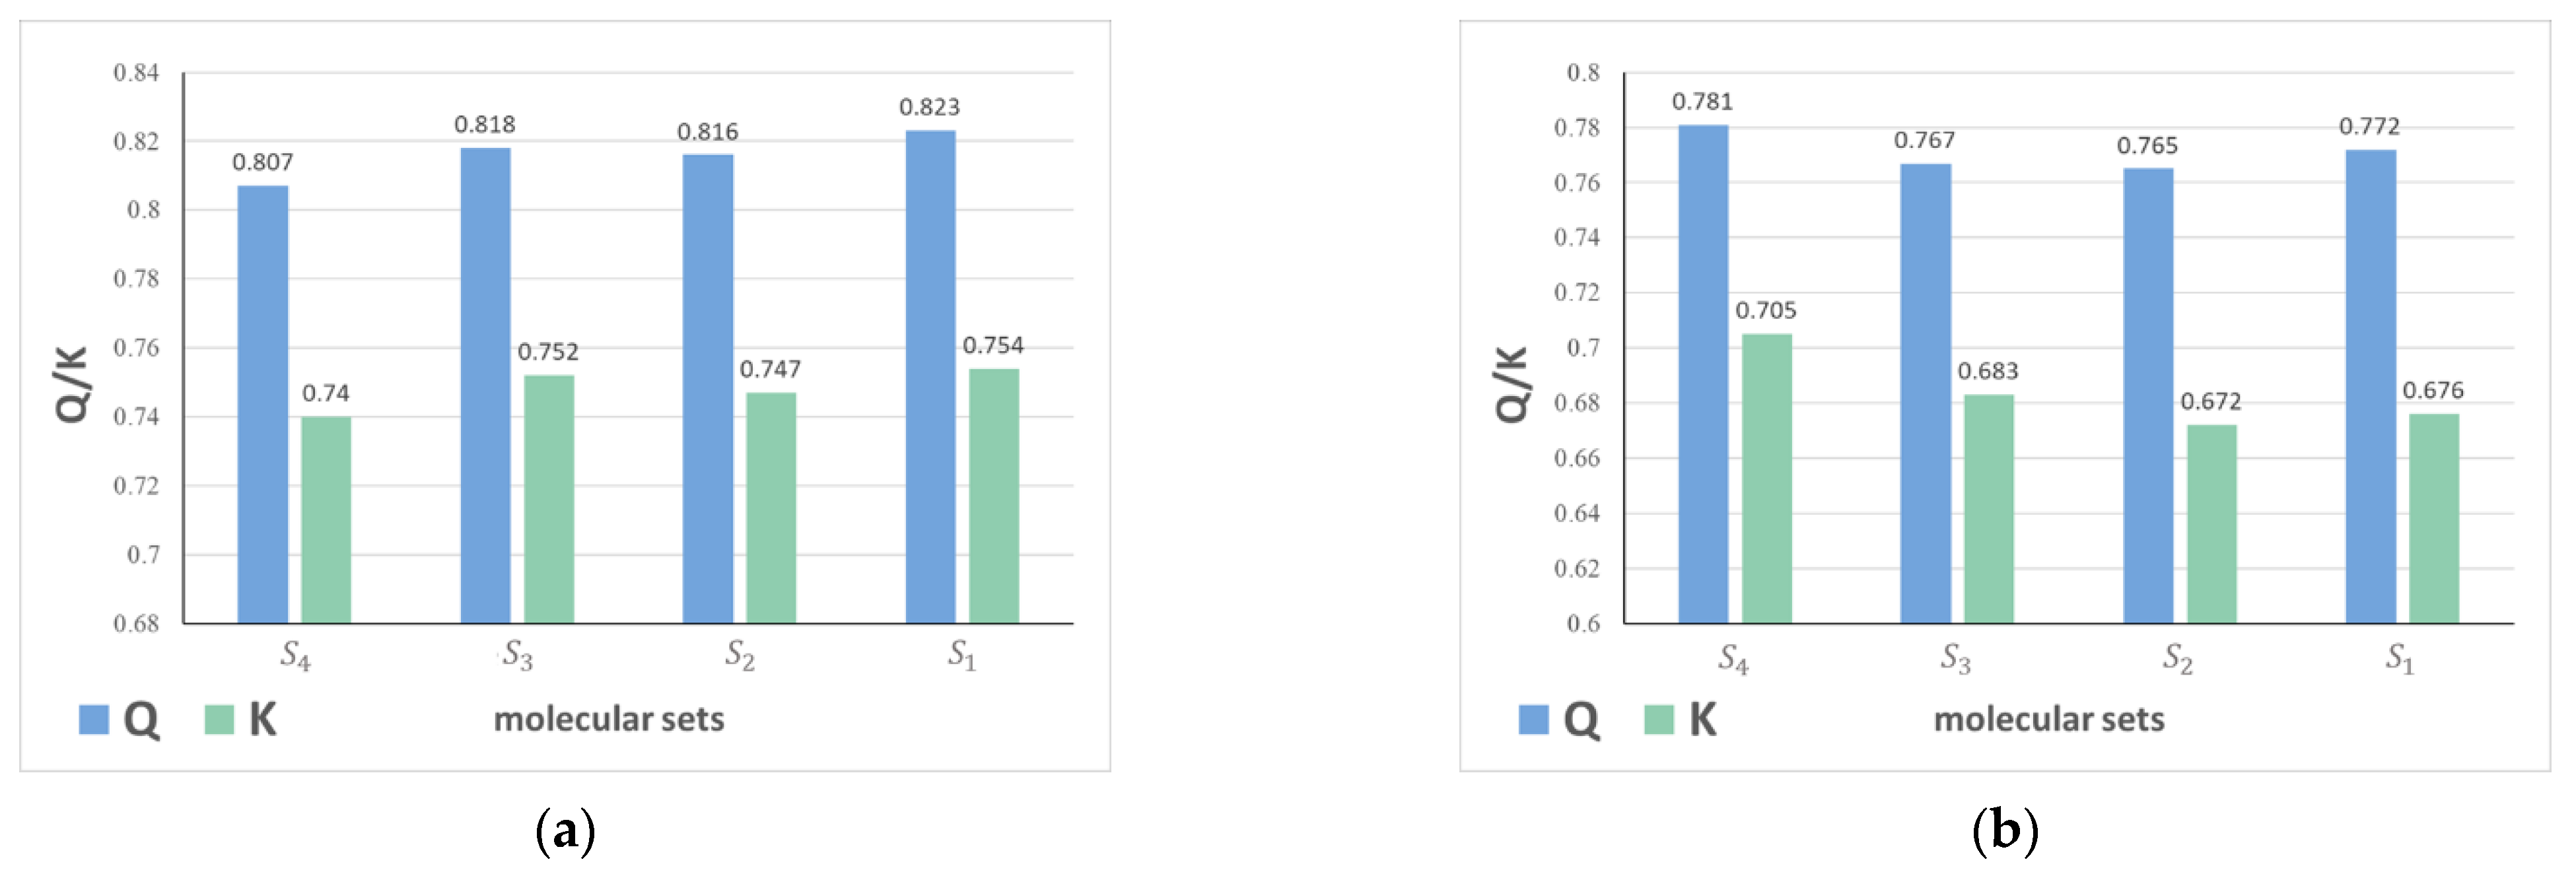
2.1.1. The Impact of Molecular Sets
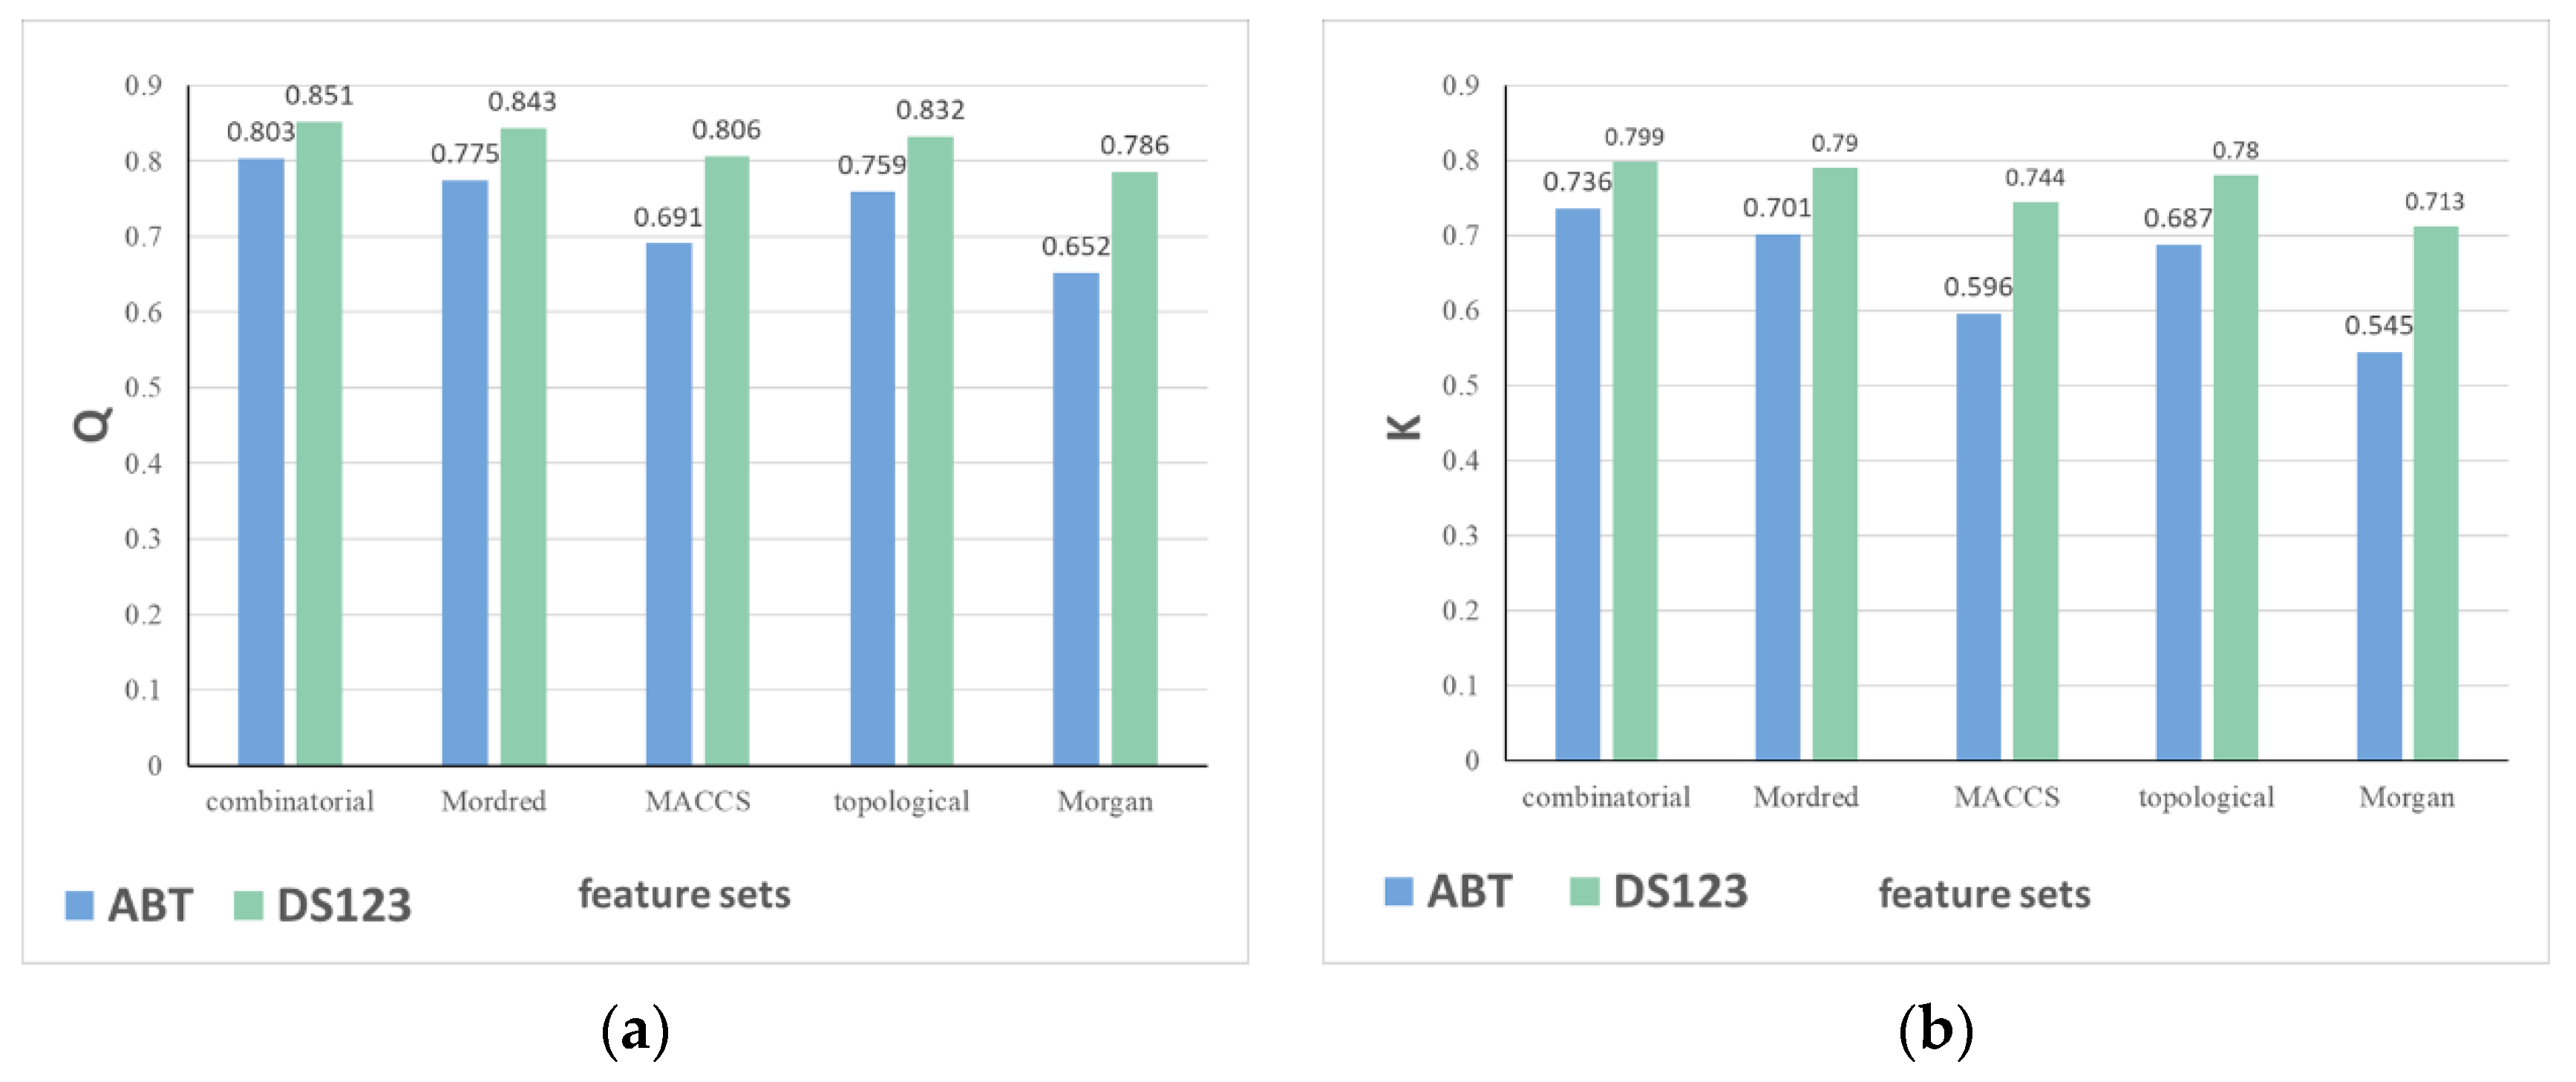
2.1.2. The Impact of Descriptor Sets
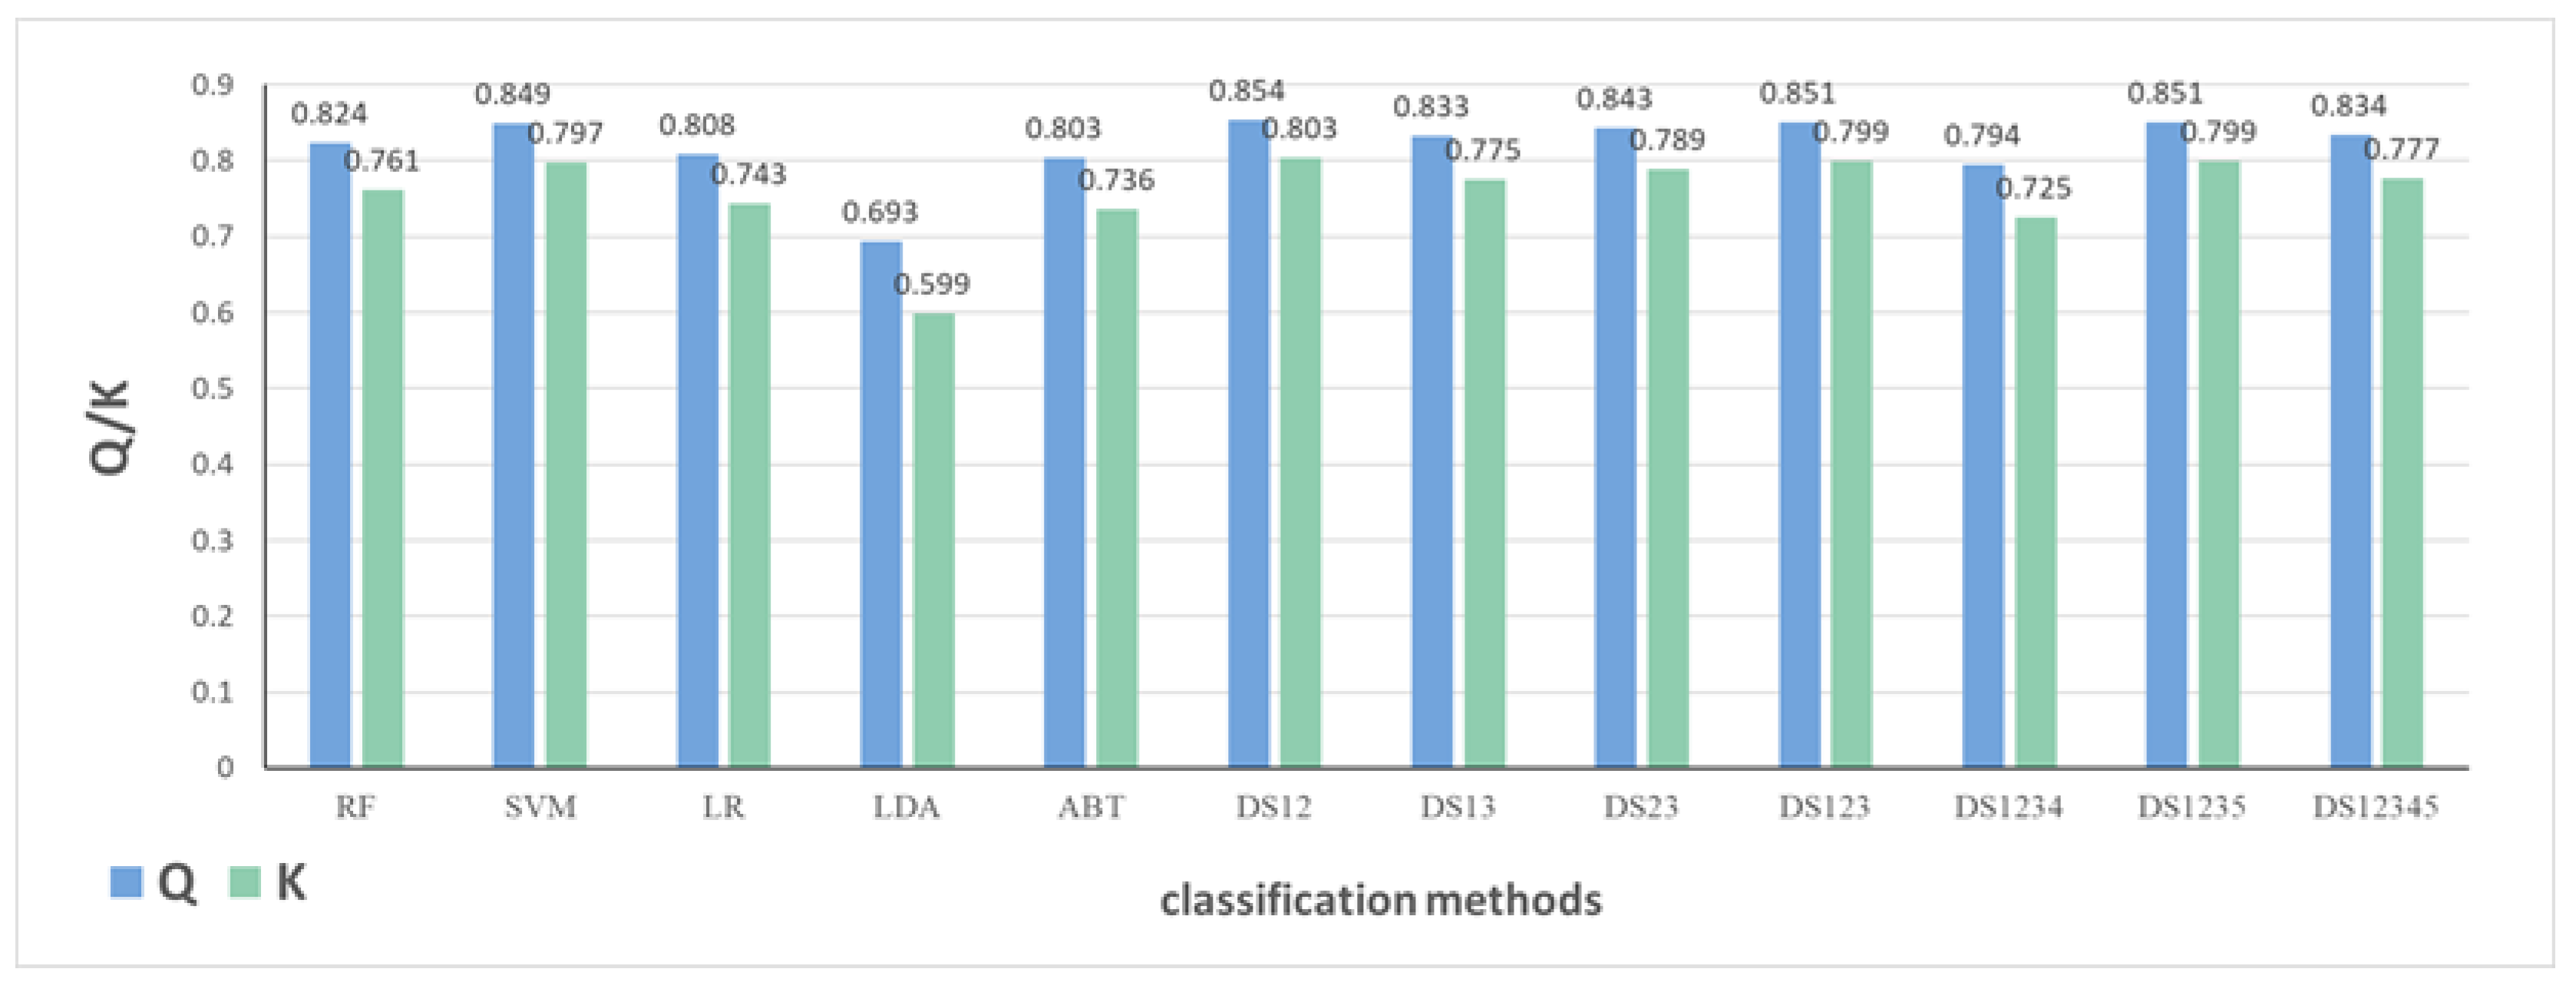
2.1.3. The Impact of Classification Models
2.2. The Analysis on External Validation Set
3. Materials and Methods
3.1. Drug Collection and Corresponding Descriptor Data Set
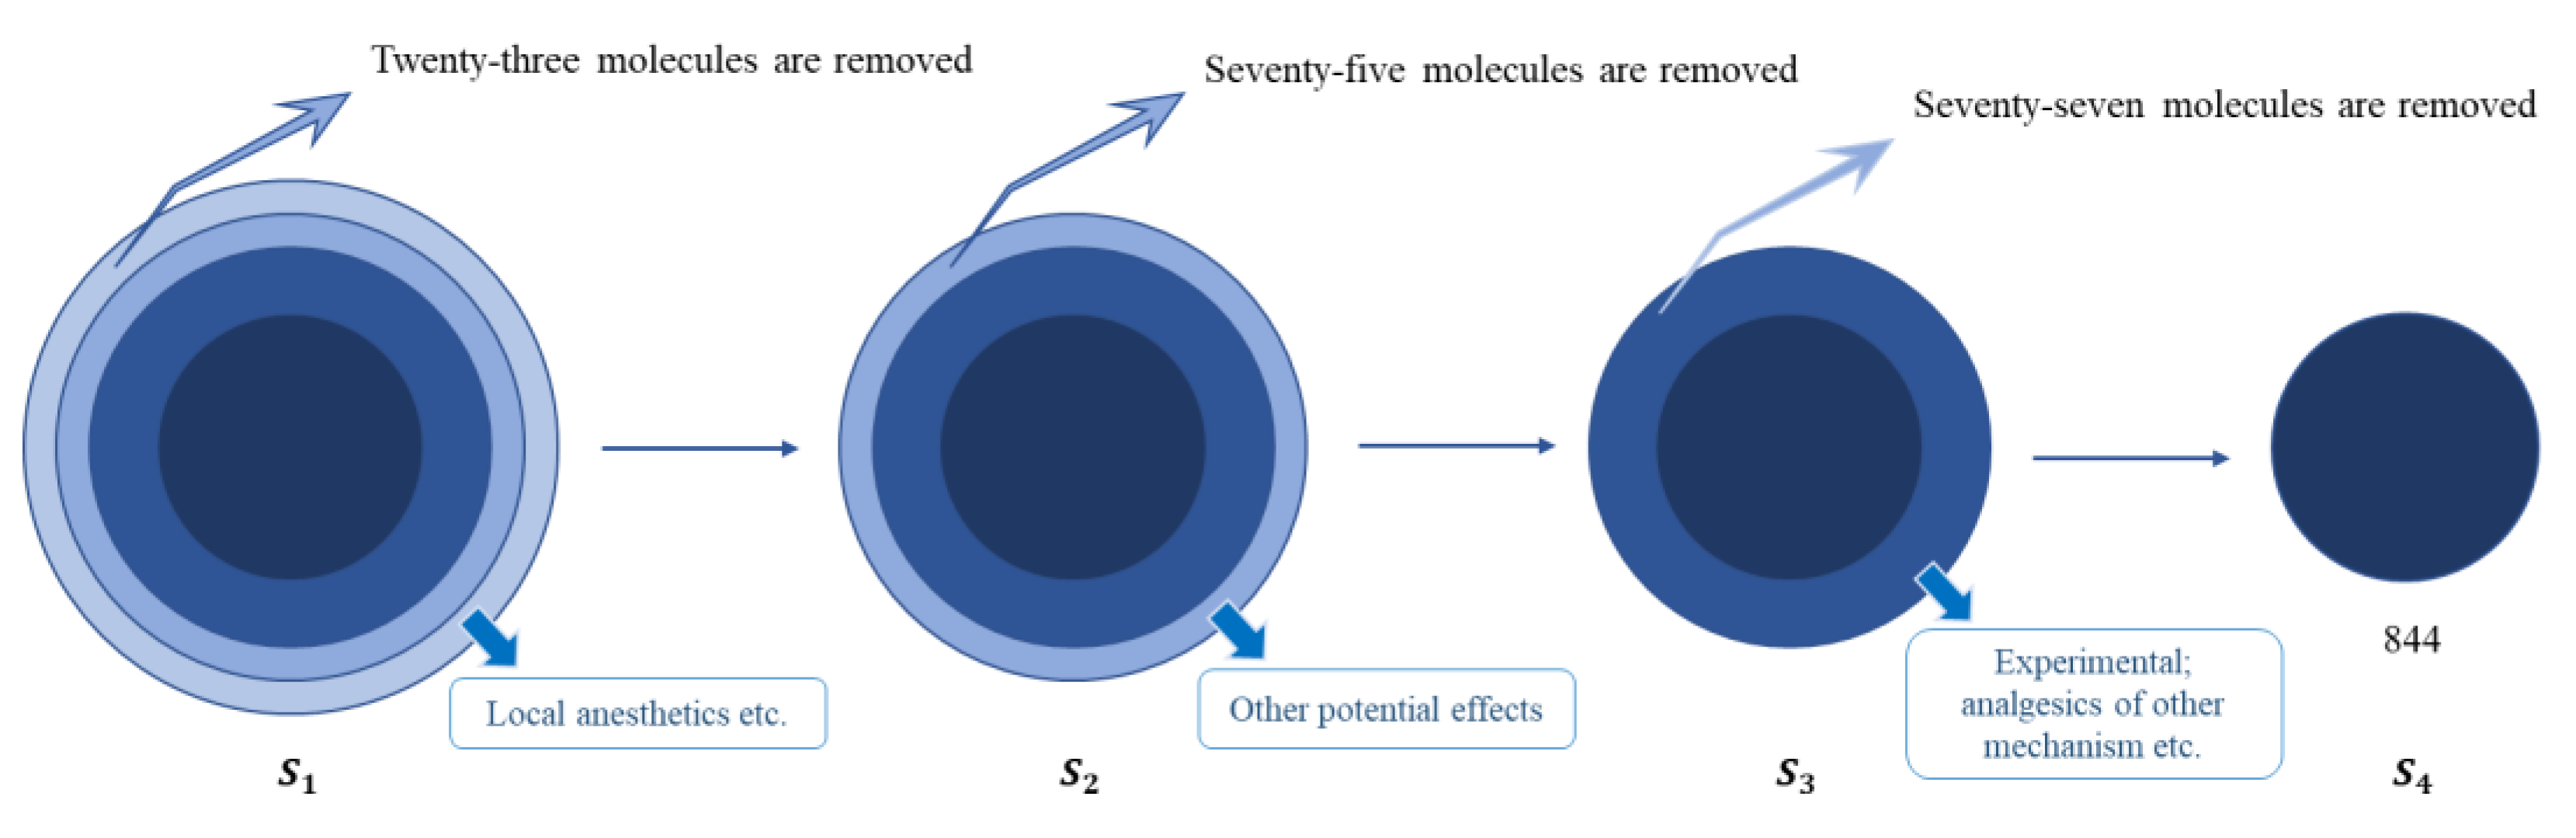
3.1.1. Drug Molecules
3.1.2. Different Descriptors
3.1.3. Final Molecular Set
3.2. Methods for Selection, Combination, and Evaluation
3.2.1. Classification Algorithms
3.2.2. Fusion Methods
3.2.3. The Evaluation of Classification Performance
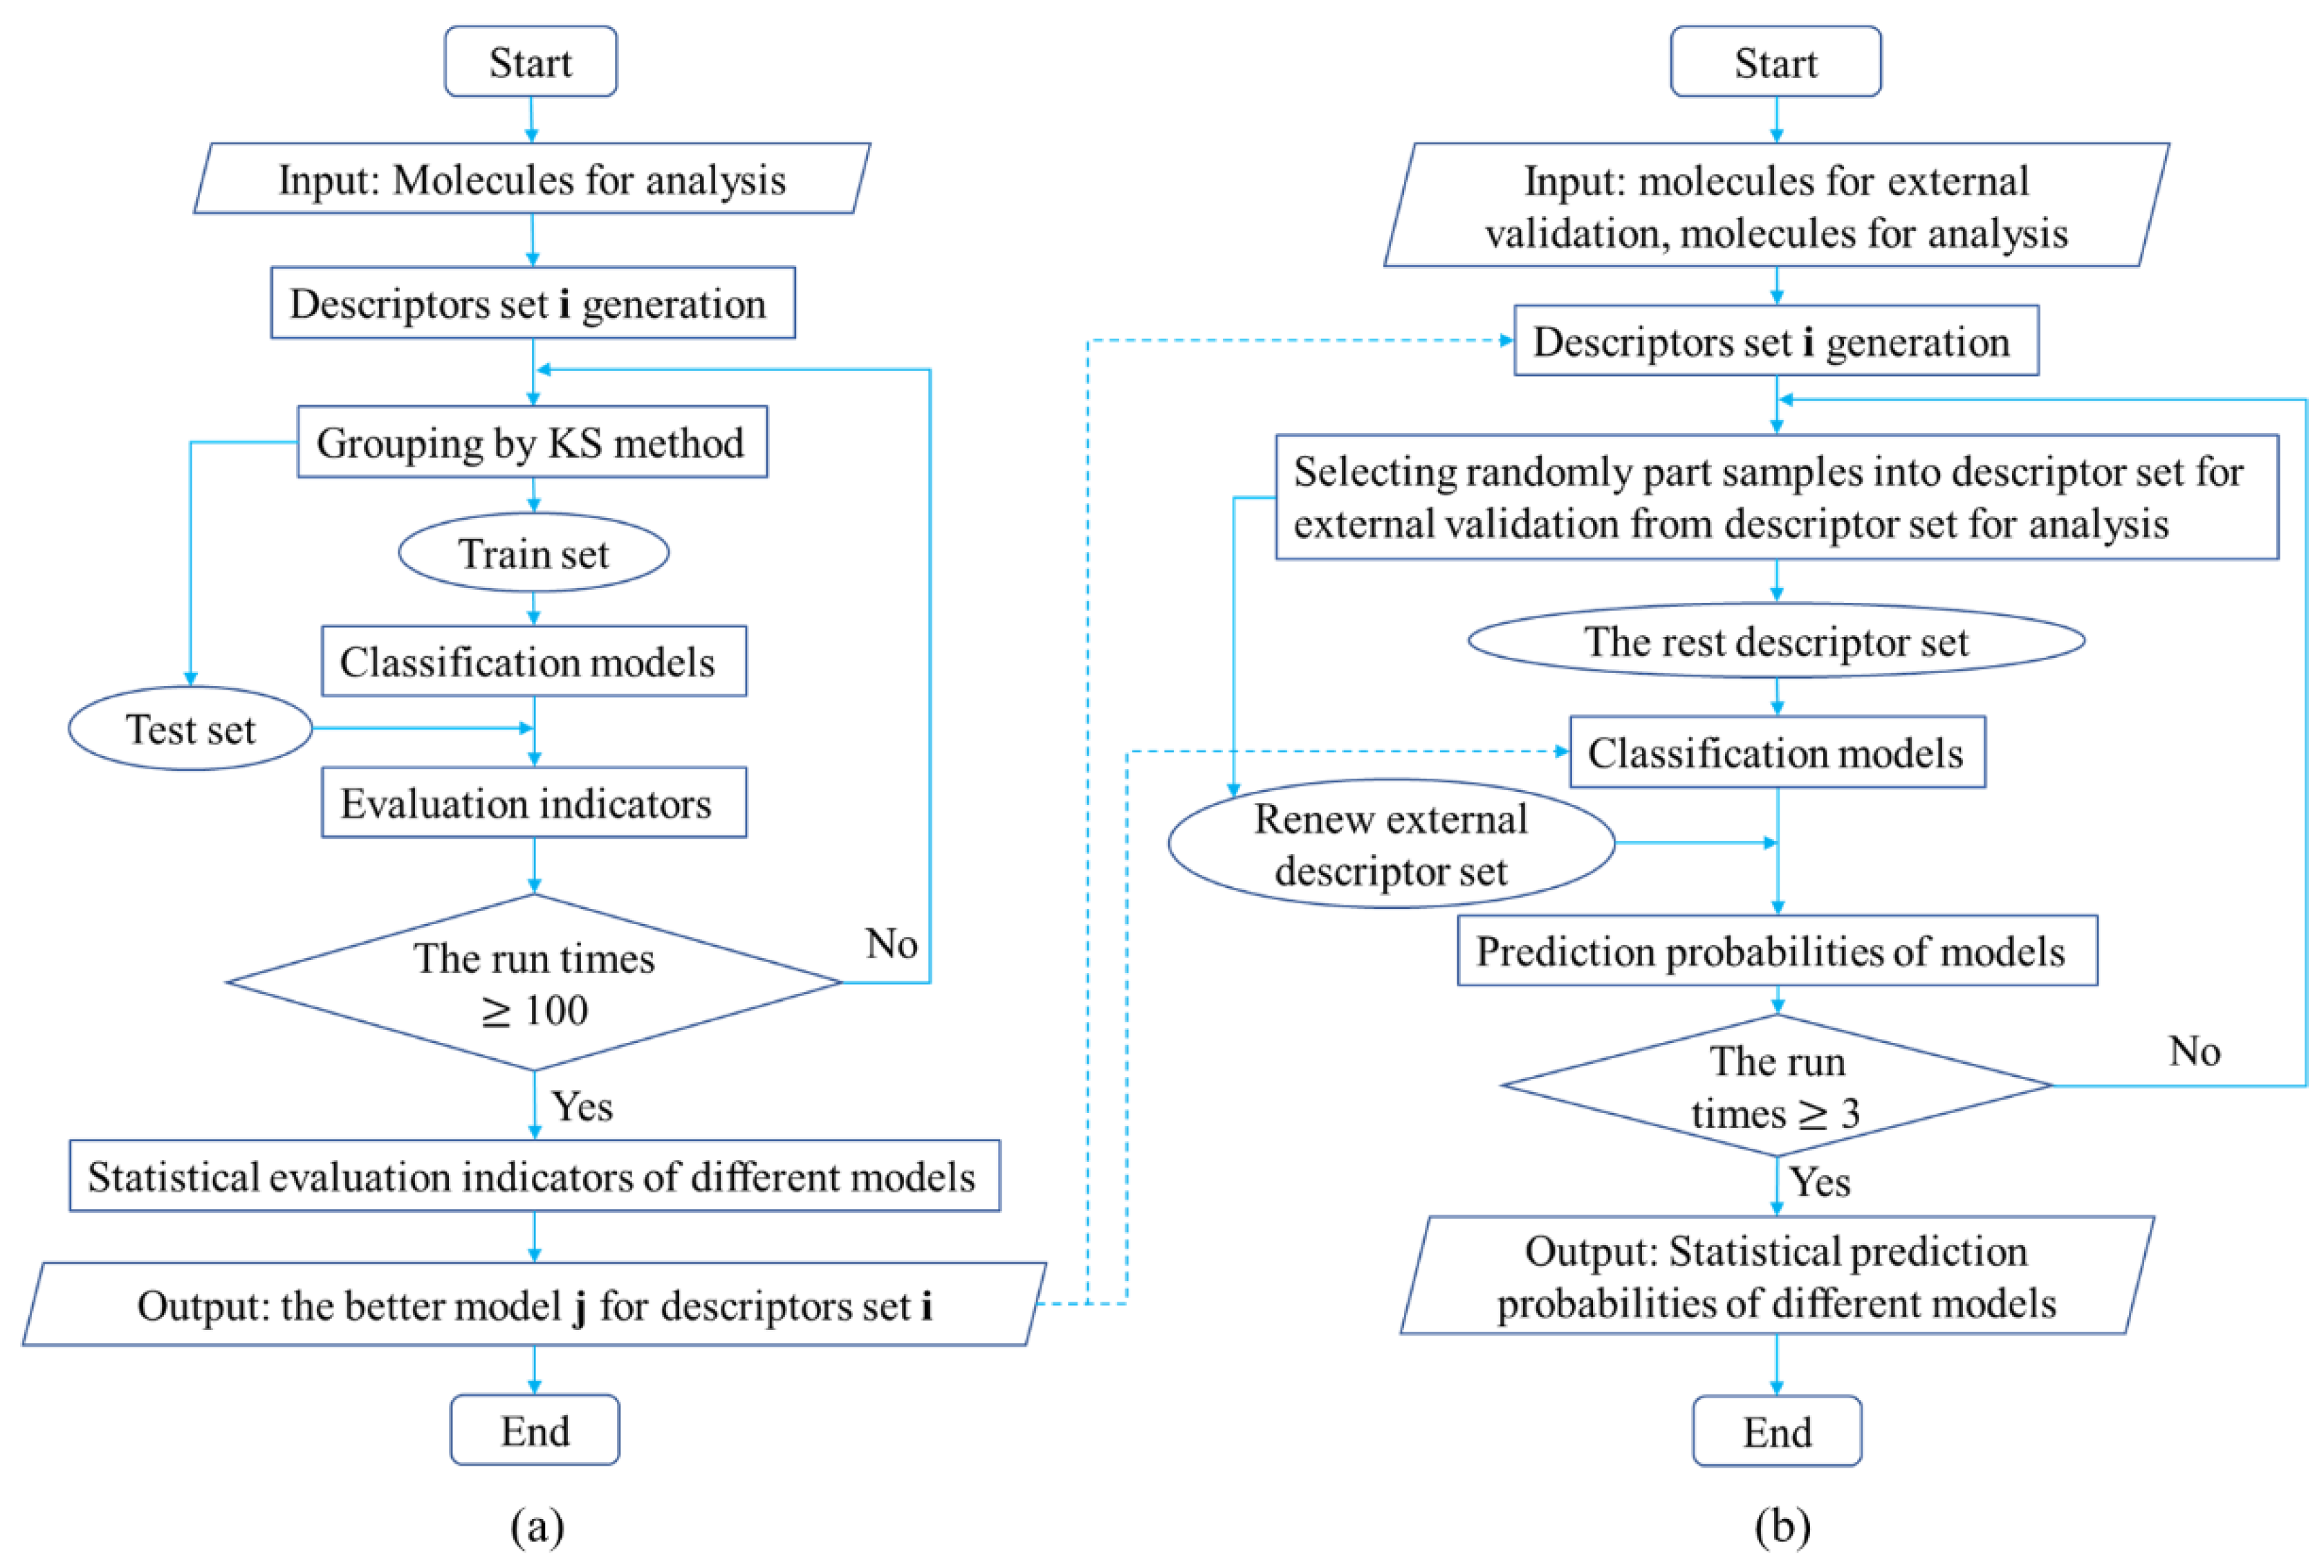
3.2.4. Study Process of Classifying Drugs
4. Conclusions
Supplementary Materials
Author Contributions
Funding
Institutional Review Board Statement
Informed Consent Statement
Data Availability Statement
Acknowledgments
Conflicts of Interest
Sample Availability
Appendix A

| Molecule Sets | Descriptor Sets | Classification Methods |
|---|---|---|
| S1 with 1019 molecules | Combinatorial descriptors (F1) | RF (1) |
| S2 with 996 molecules | Mordred descriptors (F2) | SVM (2) |
| S3 with 921 molecules | MACCS fingerprints (F3) | LR (3) |
| S4 with 844 molecules | Topological fingerprints (F4) | LDA (4) |
| Morgan fingerprints (F5) | ABT (5) | |
| Fusion of RF and SVM (DS12) | ||
| Fusion of RF and LR (DS13) | ||
| Fusion of SVM and LR (DS23) | ||
| Fusion of RF, SVM, and LR (DS123) | ||
| Fusion of RF, SVM, LR, and LDA (DS1234) | ||
| Fusion of RF, SVM, LR, and ABT (DS1235) | ||
| Fusion of five single classifiers (DS12345) |
| Indicators | Algorithms | S4 | S3 | S2 | S1 |
|---|---|---|---|---|---|
| Q | RF | 0.824 ± 0.03 | 0.834 ± 0.023 | 0.828 ± 0.026 | 0.832 ± 0.027 |
| SVM | 0.849 ± 0.025 | 0.856 ± 0.022 | 0.852 ± 0.021 | 0.857 ± 0.024 | |
| LR | 0.808 ± 0.031 | 0.811 ± 0.025 | 0.808 ± 0.025 | 0.811 ± 0.027 | |
| LDA | 0.693 ± 0.029 | 0.736 ± 0.03 | 0.751 ± 0.027 | 0.758 ± 0.029 | |
| ABT | 0.803 ± 0.03 | 0.812 ± 0.03 | 0.807 ± 0.027 | 0.808 ± 0.027 | |
| DS12 | 0.854 ± 0.025 | 0.861 ± 0.021 | 0.858 ± 0.023 | 0.862 ± 0.025 | |
| DS13 | 0.833 ± 0.025 | 0.843 ± 0.023 | 0.837 ± 0.023 | 0.842 ± 0.023 | |
| DS23 | 0.843 ± 0.026 | 0.851 ± 0.021 | 0.845 ± 0.025 | 0.847 ± 0.024 | |
| DS123 | 0.851 ± 0.024 | 0.858 ± 0.021 | 0.853 ± 0.022 | 0.858 ± 0.024 | |
| DS1234 | 0.794 ± 0.028 | 0.808 ± 0.024 | 0.813 ± 0.024 | 0.823 ± 0.027 | |
| DS1235 | 0.851 ± 0.024 | 0.859 ± 0.021 | 0.853 ± 0.022 | 0.858 ± 0.024 | |
| DS12345 | 0.834 ± 0.024 | 0.84 ± 0.022 | 0.84 ± 0.022 | 0.847 ± 0.023 | |
| K | RF | 0.761 ± 0.04 | 0.772 ± 0.03 | 0.761 ± 0.035 | 0.763 ± 0.037 |
| SVM | 0.797 ± 0.032 | 0.804 ± 0.029 | 0.798 ± 0.029 | 0.802 ± 0.033 | |
| LR | 0.743 ± 0.04 | 0.744 ± 0.032 | 0.739 ± 0.033 | 0.74 ± 0.036 | |
| LDA | 0.599 ± 0.037 | 0.649 ± 0.038 | 0.667 ± 0.035 | 0.673 ± 0.039 | |
| ABT | 0.736 ± 0.039 | 0.746 ± 0.039 | 0.737 ± 0.035 | 0.736 ± 0.036 | |
| DS12 | 0.803 ± 0.033 | 0.81 ± 0.028 | 0.805 ± 0.031 | 0.808 ± 0.035 | |
| DS13 | 0.775 ± 0.032 | 0.786 ± 0.03 | 0.776 ± 0.032 | 0.78 ± 0.032 | |
| DS23 | 0.789 ± 0.033 | 0.797 ± 0.028 | 0.789 ± 0.033 | 0.789 ± 0.033 | |
| DS123 | 0.799 ± 0.032 | 0.807 ± 0.028 | 0.799 ± 0.03 | 0.802 ± 0.033 | |
| DS1234 | 0.725 ± 0.035 | 0.741 ± 0.031 | 0.746 ± 0.032 | 0.756 ± 0.036 | |
| DS1235 | 0.799 ± 0.031 | 0.808 ± 0.029 | 0.799 ± 0.03 | 0.803 ± 0.033 | |
| DS12345 | 0.777 ± 0.031 | 0.782 ± 0.029 | 0.781 ± 0.029 | 0.787 ± 0.032 |
| Indicators | Algorithms | S4 | S3 | S2 | S1 |
|---|---|---|---|---|---|
| Q | RF | 0.807 ± 0.027 | 0.818 ± 0.025 | 0.816 ± 0.03 | 0.823 ± 0.025 |
| SVM | 0.841 ± 0.024 | 0.852 ± 0.023 | 0.847 ± 0.025 | 0.853 ± 0.021 | |
| LR | 0.811 ± 0.024 | 0.82 ± 0.024 | 0.811 ± 0.026 | 0.818 ± 0.024 | |
| LDA | 0.555 ± 0.045 | 0.609 ± 0.043 | 0.637 ± 0.033 | 0.656 ± 0.031 | |
| ABT | 0.775 ± 0.032 | 0.781 ± 0.03 | 0.777 ± 0.028 | 0.784 ± 0.029 | |
| DS12 | 0.843 ± 0.025 | 0.855 ± 0.024 | 0.85 ± 0.025 | 0.857 ± 0.023 | |
| DS13 | 0.831 ± 0.024 | 0.841 ± 0.025 | 0.834 ± 0.026 | 0.845 ± 0.024 | |
| DS23 | 0.834 ± 0.021 | 0.844 ± 0.023 | 0.839 ± 0.025 | 0.846 ± 0.022 | |
| DS123 | 0.843 ± 0.023 | 0.851 ± 0.024 | 0.845 ± 0.027 | 0.855 ± 0.022 | |
| DS1234 | 0.769 ± 0.031 | 0.779 ± 0.033 | 0.781 ± 0.031 | 0.791 ± 0.028 | |
| DS1235 | 0.844 ± 0.023 | 0.851 ± 0.023 | 0.846 ± 0.027 | 0.855 ± 0.022 | |
| DS12345 | 0.828 ± 0.025 | 0.833 ± 0.027 | 0.83 ± 0.027 | 0.841 ± 0.024 | |
| K | RF | 0.74 ± 0.035 | 0.752 ± 0.033 | 0.747 ± 0.039 | 0.754 ± 0.034 |
| SVM | 0.787 ± 0.031 | 0.8 ± 0.03 | 0.791 ± 0.033 | 0.796 ± 0.029 | |
| LR | 0.748 ± 0.031 | 0.757 ± 0.032 | 0.744 ± 0.033 | 0.751 ± 0.031 | |
| LDA | 0.435 ± 0.054 | 0.495 ± 0.052 | 0.527 ± 0.039 | 0.548 ± 0.039 | |
| ABT | 0.701 ± 0.041 | 0.706 ± 0.04 | 0.699 ± 0.036 | 0.705 ± 0.038 | |
| DS12 | 0.789 ± 0.033 | 0.804 ± 0.031 | 0.794 ± 0.033 | 0.801 ± 0.03 | |
| DS13 | 0.774 ± 0.031 | 0.784 ± 0.033 | 0.774 ± 0.034 | 0.786 ± 0.032 | |
| DS23 | 0.779 ± 0.027 | 0.789 ± 0.031 | 0.781 ± 0.033 | 0.789 ± 0.03 | |
| DS123 | 0.79 ± 0.03 | 0.798 ± 0.031 | 0.789 ± 0.035 | 0.799 ± 0.029 | |
| DS1234 | 0.694 ± 0.039 | 0.705 ± 0.043 | 0.705 ± 0.04 | 0.716 ± 0.036 | |
| DS1235 | 0.791 ± 0.03 | 0.798 ± 0.031 | 0.789 ± 0.036 | 0.8 ± 0.029 | |
| DS12345 | 0.77 ± 0.033 | 0.775 ± 0.037 | 0.77 ± 0.035 | 0.781 ± 0.033 |
| Indicators | Algorithms | S4 | S3 | S2 | S1 |
|---|---|---|---|---|---|
| Q | RF | 0.812 ± 0.026 | 0.816 ± 0.027 | 0.81 ± 0.023 | 0.819 ± 0.022 |
| SVM | 0.807 ± 0.027 | 0.808 ± 0.025 | 0.806 ± 0.026 | 0.815 ± 0.023 | |
| LR | 0.716 ± 0.031 | 0.722 ± 0.029 | 0.718 ± 0.026 | 0.727 ± 0.027 | |
| LDA | 0.711 ± 0.033 | 0.719 ± 0.029 | 0.715 ± 0.025 | 0.727 ± 0.027 | |
| ABT | 0.691 ± 0.034 | 0.689 ± 0.034 | 0.673 ± 0.027 | 0.686 ± 0.028 | |
| DS12 | 0.819 ± 0.029 | 0.819 ± 0.026 | 0.819 ± 0.023 | 0.822 ± 0.022 | |
| DS13 | 0.78 ± 0.029 | 0.787 ± 0.027 | 0.785 ± 0.026 | 0.793 ± 0.025 | |
| DS23 | 0.791 ± 0.032 | 0.791 ± 0.027 | 0.789 ± 0.027 | 0.8 ± 0.024 | |
| DS123 | 0.806 ± 0.03 | 0.807 ± 0.027 | 0.806 ± 0.027 | 0.812 ± 0.022 | |
| DS1234 | 0.774 ± 0.03 | 0.78 ± 0.025 | 0.78 ± 0.023 | 0.79 ± 0.025 | |
| DS1235 | 0.806 ± 0.029 | 0.806 ± 0.027 | 0.805 ± 0.027 | 0.811 ± 0.022 | |
| DS12345 | 0.774 ± 0.03 | 0.78 ± 0.025 | 0.78 ± 0.024 | 0.79 ± 0.025 | |
| K | RF | 0.75 ± 0.035 | 0.753 ± 0.036 | 0.742 ± 0.031 | 0.751 ± 0.029 |
| SVM | 0.745 ± 0.035 | 0.745 ± 0.032 | 0.739 ± 0.034 | 0.749 ± 0.03 | |
| LR | 0.627 ± 0.04 | 0.632 ± 0.037 | 0.622 ± 0.034 | 0.631 ± 0.035 | |
| LDA | 0.623 ± 0.041 | 0.63 ± 0.037 | 0.621 ± 0.033 | 0.633 ± 0.035 | |
| ABT | 0.596 ± 0.042 | 0.59 ± 0.042 | 0.566 ± 0.035 | 0.579 ± 0.037 | |
| DS12 | 0.761 ± 0.038 | 0.759 ± 0.033 | 0.755 ± 0.031 | 0.758 ± 0.028 | |
| DS13 | 0.709 ± 0.038 | 0.716 ± 0.035 | 0.709 ± 0.034 | 0.717 ± 0.032 | |
| DS23 | 0.725 ± 0.041 | 0.723 ± 0.035 | 0.717 ± 0.036 | 0.728 ± 0.031 | |
| DS123 | 0.744 ± 0.038 | 0.742 ± 0.035 | 0.737 ± 0.035 | 0.743 ± 0.029 | |
| DS1234 | 0.703 ± 0.039 | 0.708 ± 0.032 | 0.703 ± 0.031 | 0.714 ± 0.032 | |
| DS1235 | 0.744 ± 0.038 | 0.742 ± 0.035 | 0.737 ± 0.035 | 0.743 ± 0.029 | |
| DS12345 | 0.703 ± 0.039 | 0.708 ± 0.032 | 0.703 ± 0.031 | 0.714 ± 0.032 |
| Indicators | Algorithms | S4 | S3 | S2 | S1 |
|---|---|---|---|---|---|
| Q | RF | 0.813 ± 0.029 | 0.821 ± 0.029 | 0.819 ± 0.024 | 0.821 ± 0.029 |
| SVM | 0.837 ± 0.026 | 0.835 ± 0.029 | 0.827 ± 0.028 | 0.828 ± 0.028 | |
| LR | 0.796 ± 0.027 | 0.804 ± 0.028 | 0.795 ± 0.025 | 0.797 ± 0.024 | |
| LDA | 0.599 ± 0.064 | 0.588 ± 0.065 | 0.571 ± 0.059 | 0.577 ± 0.059 | |
| ABT | 0.759 ± 0.034 | 0.761 ± 0.031 | 0.753 ± 0.03 | 0.755 ± 0.032 | |
| DS12 | 0.832 ± 0.027 | 0.834 ± 0.026 | 0.833 ± 0.025 | 0.834 ± 0.024 | |
| DS13 | 0.816 ± 0.027 | 0.825 ± 0.028 | 0.825 ± 0.025 | 0.827 ± 0.025 | |
| DS23 | 0.828 ± 0.029 | 0.825 ± 0.027 | 0.818 ± 0.026 | 0.822 ± 0.025 | |
| DS123 | 0.832 ± 0.026 | 0.829 ± 0.027 | 0.828 ± 0.025 | 0.829 ± 0.025 | |
| DS1234 | 0.774 ± 0.031 | 0.771 ± 0.032 | 0.751 ± 0.029 | 0.752 ± 0.029 | |
| DS1235 | 0.832 ± 0.027 | 0.829 ± 0.028 | 0.828 ± 0.025 | 0.829 ± 0.025 | |
| DS12345 | 0.794 ± 0.029 | 0.796 ± 0.03 | 0.777 ± 0.026 | 0.779 ± 0.027 | |
| K | RF | 0.753 ± 0.037 | 0.761 ± 0.038 | 0.756 ± 0.033 | 0.759 ± 0.039 |
| SVM | 0.786 ± 0.034 | 0.781 ± 0.036 | 0.77 ± 0.037 | 0.771 ± 0.036 | |
| LR | 0.736 ± 0.034 | 0.745 ± 0.035 | 0.731 ± 0.033 | 0.735 ± 0.032 | |
| LDA | 0.5 ± 0.07 | 0.483 ± 0.072 | 0.459 ± 0.066 | 0.464 ± 0.067 | |
| ABT | 0.687 ± 0.043 | 0.686 ± 0.039 | 0.676 ± 0.039 | 0.678 ± 0.04 | |
| DS12 | 0.78 ± 0.034 | 0.781 ± 0.034 | 0.778 ± 0.034 | 0.779 ± 0.032 | |
| DS13 | 0.76 ± 0.034 | 0.769 ± 0.036 | 0.768 ± 0.033 | 0.77 ± 0.032 | |
| DS23 | 0.776 ± 0.036 | 0.77 ± 0.034 | 0.76 ± 0.035 | 0.765 ± 0.032 | |
| DS123 | 0.78 ± 0.034 | 0.775 ± 0.034 | 0.772 ± 0.033 | 0.774 ± 0.032 | |
| DS1234 | 0.707 ± 0.039 | 0.7 ± 0.04 | 0.673 ± 0.038 | 0.674 ± 0.038 | |
| DS1235 | 0.78 ± 0.034 | 0.775 ± 0.035 | 0.772 ± 0.033 | 0.774 ± 0.032 | |
| DS12345 | 0.732 ± 0.036 | 0.733 ± 0.037 | 0.706 ± 0.035 | 0.709 ± 0.036 |
| Indicators | Algorithms | S4 | S3 | S2 | S1 |
|---|---|---|---|---|---|
| Q | RF | 0.781 ± 0.028 | 0.767 ± 0.026 | 0.765 ± 0.028 | 0.772 ± 0.029 |
| SVM | 0.775 ± 0.034 | 0.766 ± 0.029 | 0.763 ± 0.029 | 0.772 ± 0.031 | |
| LR | 0.753 ± 0.03 | 0.73 ± 0.031 | 0.725 ± 0.026 | 0.732 ± 0.031 | |
| LDA | 0.586 ± 0.051 | 0.563 ± 0.038 | 0.505 ± 0.041 | 0.513 ± 0.042 | |
| ABT | 0.652 ± 0.035 | 0.645 ± 0.036 | 0.642 ± 0.034 | 0.646 ± 0.033 | |
| DS12 | 0.788 ± 0.029 | 0.774 ± 0.028 | 0.773 ± 0.028 | 0.78 ± 0.028 | |
| DS13 | 0.785 ± 0.026 | 0.767 ± 0.027 | 0.763 ± 0.026 | 0.773 ± 0.03 | |
| DS23 | 0.771 ± 0.033 | 0.76 ± 0.028 | 0.757 ± 0.029 | 0.764 ± 0.029 | |
| DS123 | 0.786 ± 0.03 | 0.771 ± 0.027 | 0.771 ± 0.027 | 0.778 ± 0.029 | |
| DS1234 | 0.696 ± 0.034 | 0.681 ± 0.032 | 0.66 ± 0.028 | 0.666 ± 0.035 | |
| DS1235 | 0.785 ± 0.03 | 0.77 ± 0.026 | 0.771 ± 0.028 | 0.777 ± 0.028 | |
| DS12345 | 0.725 ± 0.033 | 0.714 ± 0.032 | 0.699 ± 0.027 | 0.705 ± 0.03 | |
| K | RF | 0.705 ± 0.036 | 0.683 ± 0.034 | 0.672 ± 0.038 | 0.676 ± 0.04 |
| SVM | 0.698 ± 0.044 | 0.683 ± 0.037 | 0.672 ± 0.038 | 0.679 ± 0.041 | |
| LR | 0.671 ± 0.039 | 0.636 ± 0.04 | 0.622 ± 0.036 | 0.623 ± 0.044 | |
| LDA | 0.466 ± 0.061 | 0.433 ± 0.047 | 0.363 ± 0.046 | 0.371 ± 0.049 | |
| ABT | 0.545 ± 0.044 | 0.531 ± 0.043 | 0.522 ± 0.044 | 0.522 ± 0.044 | |
| DS12 | 0.716 ± 0.038 | 0.695 ± 0.036 | 0.687 ± 0.037 | 0.69 ± 0.038 | |
| DS13 | 0.711 ± 0.033 | 0.682 ± 0.036 | 0.67 ± 0.035 | 0.677 ± 0.041 | |
| DS23 | 0.697 ± 0.043 | 0.679 ± 0.036 | 0.668 ± 0.038 | 0.673 ± 0.04 | |
| DS123 | 0.713 ± 0.039 | 0.691 ± 0.035 | 0.683 ± 0.037 | 0.688 ± 0.038 | |
| DS1234 | 0.599 ± 0.043 | 0.576 ± 0.041 | 0.542 ± 0.034 | 0.547 ± 0.046 | |
| DS1235 | 0.713 ± 0.039 | 0.69 ± 0.034 | 0.684 ± 0.037 | 0.687 ± 0.038 | |
| DS12345 | 0.635 ± 0.041 | 0.618 ± 0.041 | 0.591 ± 0.033 | 0.596 ± 0.04 |
| Drugs | True Categories | Predicted Categories |
|---|---|---|
| Oliceridine | analgesics | antineoplastic drugs |
| Cyproheptadine | analgesics | analgesics |
| Methylergometrine | analgesics | analgesics |
| Ubrogepant | analgesics | antineoplastic drugs |
| Lasmiditan | analgesics | antineoplastic drugs |
| Talaporfin | antineoplastic drugs | antineoplastic drugs |
| Avapritinib | antineoplastic drugs | antineoplastic drugs |
| Tazemetostat | antineoplastic drugs | antineoplastic drugs |
| Capmatinib | antineoplastic drugs | antineoplastic drugs |
| Lurbinectedin | antineoplastic drugs | antineoplastic drugs |
| Abiraterone acetate | antineoplastic drugs | antineoplastic drugs |
| Sotorasib | antineoplastic drugs | antineoplastic drugs |
| Tamoxifen | antineoplastic drugs | analgesics |
| Fulvestrant | antineoplastic drugs | antineoplastic drugs |
| Anastrozole | antineoplastic drugs | antiviral drugs |
| Letrozole | antineoplastic drugs | antifungals |
| Exemestane | antineoplastic drugs | antineoplastic drugs |
| Zanubrutinib | antineoplastic drugs | antineoplastic drugs |
| Apalutamide | antineoplastic drugs | antineoplastic drugs |
| Darolutamide | antineoplastic drugs | antineoplastic drugs |
| Glasdegib | antineoplastic drugs | antineoplastic drugs |
| Duvelisib | antineoplastic drugs | antineoplastic drugs |
| Tofacitinib | antineoplastic drugs | antineoplastic drugs |
| Enzalutamide | antineoplastic drugs | antineoplastic drugs |
| Berzosertib | antineoplastic drugs | antineoplastic drugs |
| Mobocertinib | antineoplastic drugs | antineoplastic drugs |
| Vebicorvir | antiviral drugs | antineoplastic drugs |
| Rifampicin | antineoplastic drugs, antibacterial drugs | antibacterial drugs |
| Cytarabine | antineoplastic drugs, antiviral drugs | antineoplastic drugs |
| Seliciclib | antineoplastic drugs, antiviral drugs | antineoplastic drugs |
| Celecoxib | analgesics, antineoplastic drugs | antidiabetic drugs |
| Pomalidomide | analgesics, antineoplastic drugs | analgesics |
| Acetylcysteine | analgesics, antineoplastic drugs, antiviral drugs | antineoplastic drugs |
| Salicylic acid | analgesics, antineoplastic drugs, antifungals | analgesics |
| Suxibuzone | analgesics, antineoplastic drugs | analgesics |
| Promethazine | analgesics, antiviral drugs | analgesics |
References
- Chan, H.C.S.; Shan, H.; Dahoun, T.; Vogel, H.; Yuan, S. Advancing drug discovery via artificial intelligence. Trends Pharmacol. Sci. 2019, 40, 592–604. [Google Scholar] [CrossRef]
- Kumar, A.; Zhang, K.Y.J. Hierarchical virtual screening approaches in small molecule drug discovery. Methods 2015, 71, 26–37. [Google Scholar] [CrossRef] [PubMed]
- Mak, K.K.; Pichika, M.R. Artificial intelligence in drug development: Present status and future prospects. Drug Discov. Today 2019, 24, 773–780. [Google Scholar] [CrossRef] [PubMed]
- Ekins, S.; Mestres, J.; Testa, B. In silico pharmacology for drug discovery: Applications to targets and beyond. Br. J. Pharmacol. 2007, 152, 21–37. [Google Scholar] [CrossRef] [PubMed] [Green Version]
- Andricopulo, A.D.; Guido, R.V.C.; Oliva, G. Virtual screening and its integration with modern drug design technologies. Curr. Med. Chem. 2008, 15, 37–46. [Google Scholar] [CrossRef] [Green Version]
- Yuriev, E. Challenges and advances in structure-based virtual screening. Future Med. Chem. 2014, 6, 5–7. [Google Scholar] [CrossRef] [PubMed]
- Scior, T.; Bender, A.; Tresadern, G.; Medina-Franco, J.L.; Martínez-Mayorga, K.; Langer, T.; Cuanalo-Contreras, K.; Agrafiotis, D.K. Recognizing pitfalls in virtual screening: A critical review. J. Chem. Inf. Modeling 2012, 52, 867–881. [Google Scholar] [CrossRef]
- Kanehisa, M.; Furumichi, M.; Tanabe, M.; Sato, Y.; Morishima, K. KEGG: New perspectives on genomes, pathways, diseases and drugs. Nucleic Acids Res. 2017, 45, D353–D361. [Google Scholar] [CrossRef] [Green Version]
- Wishart, D.S.; Knox, C.; Guo, A.C.; Cheng, D.; Shrivastava, S.; Tzur, D.; Gautam, B.; Hassanali, M. DrugBank: A knowledgebase for drugs, drug actions and drug targets. Nucleic Acids Res. 2008, 36, D901–D906. [Google Scholar] [CrossRef]
- Talevi, A.; Morales, J.F.; Hather, G.; Podichetty, J.T.; Kim, S.; Bloomingdale, P.C.; Kim, S.; Burton, J.; Brown, J.D.; Winterstein, A.G.; et al. Machine Learning in Drug Discovery and Development Part 1: A Primer. CPT Pharmacomet. Syst. Pharmacol. 2020, 9, 129–142. [Google Scholar] [CrossRef]
- Heikamp, K.; Bajorath, J. Support vector machines for drug discovery. Expert Opin. Drug Discov. 2014, 9, 93–104. [Google Scholar] [CrossRef] [PubMed]
- Müller, K.R.; Rätsch, G.; Sonnenburg, S.; Mika, S.; Grimm, M.; Heinrich, N. Classifying ‘drug-likeness’ with kernel-based learning methods. J. Chem. Inf. Modeling 2005, 45, 249–253. [Google Scholar] [CrossRef] [Green Version]
- Li, X.; Chen, Y.; Song, X.; Zhang, Y.; Li, H.; Zhao, Y. The development and application of in silico models for drug induced liver injury. RSC Adv. 2018, 8, 8101–8111. [Google Scholar] [CrossRef] [PubMed] [Green Version]
- Gupta, V.K.; Rana, P.S. Toxicity prediction of small drug molecules of androgen receptor using multilevel ensemble model. J. Bioinform. Comput. Biol. 2019, 17, 1950033. [Google Scholar] [CrossRef] [PubMed]
- Lee, J.; Kumar, S.; Lee, S.Y.; Park, S.J.; Kim, M. Development of predictive models for identifying potential S100A9 inhibitors based on machine learning methods. Front. Chem. 2019, 7, 779. [Google Scholar] [CrossRef]
- Liu, M.; Zhang, L.; Li, S.; Yang, T.; Liu, L.; Zhao, J.; Liu, K. Prediction of hERG potassium channel blockage using ensemble learning methods and molecular fingerprints. Toxicol. Lett. 2020, 332, 88–96. [Google Scholar] [CrossRef]
- Loetsch, J.; Ultsch, A. A machine-learned computational functional genomics-based approach to drug classification. Eur. J. Clin. Pharmacol. 2016, 72, 1449–1461. [Google Scholar] [CrossRef]
- Kim, E.; Choi, A.; Nam, H. Drug repositioning of herbal compounds via a machine-learning approach. BMC Bioinform. 2019, 20, 33–43. [Google Scholar] [CrossRef] [Green Version]
- Liang, X.; Zhang, P.; Yan, L.; Fu, Y.; Peng, F.; Qu, L.; Shao, M.; Chen, Y.; Chen, Z. LRSSL: Predict and interpret drug–disease associations based on data integration using sparse subspace learning. Bioinformatics 2017, 33, 1187–1196. [Google Scholar] [CrossRef] [Green Version]
- Hurle, M.R.; Yang, L.; Xie, Q.; Rajpal, D.K.; Sanseau, P.; Agarwal, P. Computational drug repositioning: From data to therapeutics. Clin. Pharmacol. Ther. 2013, 93, 335–341. [Google Scholar] [CrossRef]
- Liu, Z.; Guo, F.; Gu, J.; Wang, Y.; Li, Y.; Wang, Y.; Lu, L.; Li, D.; He, F. Similarity-based prediction for anatomical therapeutic chemical classification of drugs by integrating multiple data sources. Bioinformatics 2015, 31, 1788–1795. [Google Scholar] [CrossRef] [PubMed]
- Wang, X.; Wang, Y.; Xu, Z.; Wang, Y.; Li, Y.; Wang, D.; Lu, L.; Li, D.; He, F. ATC-NLSP: Prediction of the classes of anatomical therapeuticchemicals using a network-based label space partition method. Front. Pharmacol. 2019, 10, 971. [Google Scholar] [CrossRef] [PubMed] [Green Version]
- Woźniak, M.; Grana, M.; Corchado, E. A survey of multiple classifier systems as hybrid systems. Inf. Fusion 2014, 16, 3–17. [Google Scholar] [CrossRef] [Green Version]
- Xiao, Z.; Yang, X.; Pang, Y.; Dang, X. The prediction for listed companies’ financial distress by using multiple prediction methods with rough set and Dempster–Shafer evidence theory. Knowl.-Based Syst. 2012, 26, 196–206. [Google Scholar] [CrossRef]
- Galar, M.; Fernández, A.; Barrenechea, E.; Bustince, H.; Herrera, F. An overview of ensemble methods for binary classifiers in multi-class problems: Experimental study on one-vs-one and one-vs-all schemes. Pattern Recognit. 2011, 44, 1761–1776. [Google Scholar] [CrossRef]
- Kennard, R.W.; Stone, L.A. Computer aided design of experiments. Technometrics 1969, 11, 137–148. [Google Scholar] [CrossRef]
- Jiang, W.; Xie, C.; Zhuang, M.; Tang, Y.C. Failure mode and effects analysis based on a novel fuzzy evidential method. Appl. Soft Comput. 2017, 57, 672–683. [Google Scholar] [CrossRef]
- Pan, Y.; Zhang, L.; Wu, X.; Skibniewski, M.J. Multi-classifier information fusion in risk analysis. Inf. Fusion 2020, 60, 121–136. [Google Scholar] [CrossRef]
- Chakraborty, A.; Panda, A.K.; Ghosh, R.; Roy, R.; Biswas, A. Depicting the DNA binding and photo-nuclease ability of anti-mycobacterial drug rifampicin: A biophysical and molecular docking perspective. Int. J. Biol. Macromol. 2019, 127, 187–196. [Google Scholar] [CrossRef]
- Küçükgüzel, Ş.G.; Coşkun, İ.; Aydın, S.; Aktay, G.; Gürsoy, Ş.; Çevik, Ö.; Özakpınar, Ö.B.; Özsavcı, D.; Şener, A.; Kaushik-Basu, N.; et al. Synthesis and characterization of celecoxib derivatives as possible anti-inflammatory, analgesic, antioxidant, anticancer and anti-HCV agents. Molecules 2013, 18, 3595–3614. [Google Scholar] [CrossRef] [PubMed] [Green Version]
- Chen, J.; Jiang, L.; Lan, K.; Chen, X. Celecoxib inhibits the lytic activation of Kaposi’s Sarcoma-Associated Herpesvirus through down-regulation of RTA expression by inhibiting the activation of p38 MAPK. Viruses 2015, 7, 2268–2287. [Google Scholar] [CrossRef] [PubMed] [Green Version]
- Risner, K.; Ahmed, A.; Bakovic, A.; Kortchak, S.; Bhalla, N.; Narayanan, A. Efficacy of FDA-approved anti-inflammatory drugs against Venezuelan equine encephalitis virus infection. Viruses 2019, 11, 1151. [Google Scholar] [CrossRef] [Green Version]
- Cao, D.S.; Xu, Q.S.; Hu, Q.N.; Liang, Y.Z. ChemoPy: Freely available python package for computational biology and chemoinformatics. Bioinformatics 2013, 29, 1092–1094. [Google Scholar] [CrossRef]
- Moriwaki, H.; Tian, Y.S.; Kawashita, N.; Takagi, T. Mordred: A molecular descriptor calculator. J. Cheminform. 2018, 10, 4. [Google Scholar] [CrossRef] [Green Version]
- Landrum, G. RDKit: A Software Suite for Cheminformatics, Computational Chemistry, and Predictive Modeling. 2013. Available online: https://www.rdkit.org/RDKit_Overview.pdf (accessed on 10 March 2022).
- Kim, S.; Thiessen, P.A.; Bolton, E.E.; Chen, J.; Fu, G.; Gindulyte, A.; Han, L.; He, J.; He, S.; Shoemaker, B.A.; et al. PubChem substance and compound databases. Nucleic Acids Res. 2016, 44, D1202–D1213. [Google Scholar] [CrossRef]
- Todeschini, R.; Consonni, V. Molecular Descriptors for Chemoinformatics; Volume I: Alphabetical Listing/volume II: Appendices, References; John Wiley & Sons: Hoboken, NJ, USA, 2009. [Google Scholar]
- Xu, J.; Hagler, A. Chemoinformatics and drug discovery. Molecules 2002, 7, 566–600. [Google Scholar] [CrossRef]
- Dong, J.; Cao, D.S.; Miao, H.Y.; Liu, S.; Deng, B.C.; Yun, Y.H.; Wang, N.N.; Lu, A.P.; Zeng, W.B.; Chen, A.F. ChemDes: An integrated web-based platform for molecular descriptor and fingerprint computation. J. Cheminform. 2015, 7, 60. [Google Scholar] [CrossRef] [Green Version]
- Rogers, D.; Hahn, M. Extended-connectivity fingerprints. J. Chem. Inf. Modeling 2010, 50, 742–754. [Google Scholar] [CrossRef]
- Durant, J.L.; Leland, B.A.; Henry, D.R.; Nourse, J.G. Reoptimization of MDL keys for use in drug discovery. J. Chem. Inf. Comput. Sci. 2002, 42, 1273–1280. [Google Scholar] [CrossRef] [Green Version]
- Roy, P.P.; Roy, K. QSAR studies of CYP2D6 inhibitor aryloxypropanolamines using 2D and 3D descriptors. Chem. Biol. Drug Des. 2009, 73, 442–455. [Google Scholar] [CrossRef]
- Ricchi, P.; Zarrilli, R.; Di Palma, A.; Acquaviva, A.M. Nonsteroidal anti-inflammatory drugs in colorectal cancer: From prevention to therapy. Br. J. Cancer 2003, 88, 803–807. [Google Scholar] [CrossRef] [PubMed]
- Tołoczko-Iwaniuk, N.; Dziemiańczyk-Pakieła, D.; Nowaszewska, B.K.; Celińska-Janowicz, K.; Miltyk, W. Celecoxib in cancer therapy and prevention—review. Curr. Drug Targets 2019, 20, 302–315. [Google Scholar] [CrossRef]
- Canese, K.; Weis, S. PubMed: The Bibliographic Database; The NCBI Handbook: Bethesda, MD, USA, 2013; Volume 2, p. 1. [Google Scholar]
- Pedregosa, F.; Varoquaux, G.; Gramfort, A.; Michel, V.; Thirion, B.; Grisel, O.; Blondel, M.; Prettenhofer, P. Scikit-learn: Machine learning in Python. J. Mach. Learn. Res. 2011, 12, 2825–2830. [Google Scholar]
- Shalev-Shwartz, S.; Ben-David, S. Understanding Machine Learning: From Theory to Algorithms; Cambridge University Press: Cambridge, MA, USA, 2014. [Google Scholar]
- Dempster, A.P. Upper and Lower Probabilities Induced by a Multivalued Mapping. Classic Works of the Dempster-Shafer Theory of Belief Functions; Springer: Berlin/Heidelberg, Germany, 2008; pp. 57–72. [Google Scholar]
- Shafer, G. A Mathematical Theory of Evidence; Princeton University Press: Princeton, NJ, USA, 1976. [Google Scholar]
- Martin, T.M.; Harten, P.; Young, D.M.; Muratov, E.N.; Golbraikh, A.; Zhu, H.; Tropsha, A. Does rational selection of training and test sets improve the outcome of QSAR modeling? J. Chem. Inf. Modeling 2012, 52, 2570–2578. [Google Scholar] [CrossRef] [PubMed]

| Descriptor Sets | S4 | S3 | S2 | S1 |
|---|---|---|---|---|
| Combinatorial descriptor | 73 | 76 | 73 | 70 |
| Mordred descriptor | 74 | 74 | 75 | 72 |
| MACCS fingerprint | 70 | 74 | 74 | 71 |
| Topological fingerprint | 74 | 75 | 74 | 75 |
| Morgan fingerprint | 73 | 69 | 75 | 70 |
| Models | Single-Role | Multi-role/10 | Total/87 | |||||||
|---|---|---|---|---|---|---|---|---|---|---|
| C1/7 | C2/21 | C3/26 | C4/10 | C5/5 | C6/6 | C7/2 | Total/77 | |||
| F1—DS12 on S3 | 4 | 18 | 26 | 8 | 5 | 6 | 0 | 67 | 9 | 76 |
| F1—DS12 on S4 | 4 | 16 | 25 | 8 | 4 | 5 | 2 | 64 | 7 | 71 |
| F2—SVM on S2 | 4 | 16 | 26 | 6 | 5 | 6 | 2 | 65 | 10 | 75 |
| F2—DS12 on S3 | 4 | 17 | 26 | 7 | 4 | 3 | 1 | 62 | 10 | 72 |
| F2—DS12 on S4 | 4 | 14 | 25 | 8 | 5 | 5 | 2 | 63 | 10 | 73 |
| F3—SVM on S3 | 4 | 15 | 26 | 7 | 5 | 5 | 2 | 64 | 10 | 74 |
| F3—DS12 on S4 | 3 | 15 | 26 | 5 | 5 | 4 | 2 | 60 | 8 | 68 |
| F4—DS123 on S3 | 5 | 16 | 25 | 6 | 5 | 6 | 2 | 65 | 10 | 75 |
| F4—DS12 on S3 | 5 | 17 | 25 | 5 | 5 | 5 | 2 | 64 | 10 | 74 |
| F4—DS12 on S4 | 4 | 16 | 26 | 5 | 5 | 5 | 2 | 63 | 10 | 73 |
| F5—SVM on S2 | 6 | 13 | 26 | 4 | 3 | 4 | 0 | 56 | 9 | 65 |
| F5—DS12 on S4 | 5 | 15 | 26 | 7 | 3 | 6 | 2 | 64 | 9 | 73 |
| Drugs | Models | Classes | ||||||
|---|---|---|---|---|---|---|---|---|
| C1 | C2 | C3 | C4 | C5 | C6 | C7 | ||
| Rifampicin | F1—DS12 on S3 | 0 | 0.005 | 0.994 | 0 | 0 | 0 | 0 |
| F2—SVM on S2 | 0.028 | 0.079 | 0.833 | 0.012 | 0.023 | 0.008 | 0.017 | |
| F4—DS123 on S3 | 0.002 | 0.005 | 0.991 | 0.001 | 0 | 0 | 0 | |
| F4—DS12 on S3 | 0 | 0.001 | 0.998 | 0 | 0 | 0 | 0 | |
| Celecoxib | F1—DS12 on S3 | 0.395 | 0.1 | 0.003 | 0.046 | 0.008 | 0.447 | 0 |
| F2—SVM on S2 | 0.387 | 0.08 | 0.15 | 0.117 | 0.025 | 0.236 | 0.005 | |
| F4—DS123 on S3 | 0.535 | 0.321 | 0.053 | 0.038 | 0.009 | 0.041 | 0.002 | |
| F4—DS12 on S3 | 0.609 | 0.318 | 0.021 | 0.012 | 0.004 | 0.035 | 0.001 | |
| Drug Classes | Molecular Set S1 | Molecular Set S2 | Molecular Set S3 | Molecular Set S4 |
|---|---|---|---|---|
| Analgesics | 228 | 209 | 183 | 164 |
| Antineoplastic | 211 | 209 | 189 | 165 |
| Antibacterial drugs | 296 | 294 | 285 | 261 |
| Antiviral drugs | 108 | 108 | 102 | 99 |
| Antifungals | 64 | 64 | 57 | 54 |
| Antidiabetic drugs | 70 | 70 | 66 | 63 |
| Antiarrhythmics | 42 | 42 | 39 | 38 |
| Total | 1019 | 996 | 921 | 844 |
Publisher’s Note: MDPI stays neutral with regard to jurisdictional claims in published maps and institutional affiliations. |
© 2022 by the authors. Licensee MDPI, Basel, Switzerland. This article is an open access article distributed under the terms and conditions of the Creative Commons Attribution (CC BY) license (https://creativecommons.org/licenses/by/4.0/).
Share and Cite
Zhong, C.; Ai, J.; Yang, Y.; Ma, F.; Sun, W. Small Molecular Drug Screening Based on Clinical Therapeutic Effect. Molecules 2022, 27, 4807. https://doi.org/10.3390/molecules27154807
Zhong C, Ai J, Yang Y, Ma F, Sun W. Small Molecular Drug Screening Based on Clinical Therapeutic Effect. Molecules. 2022; 27(15):4807. https://doi.org/10.3390/molecules27154807
Chicago/Turabian StyleZhong, Cai, Jiali Ai, Yaxin Yang, Fangyuan Ma, and Wei Sun. 2022. "Small Molecular Drug Screening Based on Clinical Therapeutic Effect" Molecules 27, no. 15: 4807. https://doi.org/10.3390/molecules27154807
APA StyleZhong, C., Ai, J., Yang, Y., Ma, F., & Sun, W. (2022). Small Molecular Drug Screening Based on Clinical Therapeutic Effect. Molecules, 27(15), 4807. https://doi.org/10.3390/molecules27154807