Article

Cancer-Associated Mutations of the Adenosine A2A Receptor Have Diverse Influences on Ligand Binding and Receptor Functions

by
Chenlin Feng
1,2,
Xuesong Wang
1,
Willem Jespers
1,
Rongfang Liu
1,
Sofía Denise Zamarbide Losada
1,
Marina Gorostiola González
1,2,
Gerard J. P. van Westen
1,
Erik H. J. Danen
1 and
Laura H. Heitman
1,2,*
1
Division of Drug Discovery & Safety, Leiden Academic Centre for Drug Research, Leiden University, 2333 CC Leiden, The Netherlands
2
Oncode Institute, 2333 CC Leiden, The Netherlands
*
Author to whom correspondence should be addressed.
Molecules 2022, 27(15), 4676; https://doi.org/10.3390/molecules27154676
Submission received: 28 April 2022 / Revised: 14 July 2022 / Accepted: 20 July 2022 / Published: 22 July 2022

Abstract

:
The adenosine A2A receptor (A2AAR) is a class A G-protein-coupled receptor (GPCR). It is an immune checkpoint in the tumor micro-environment and has become an emerging target for cancer treatment. In this study, we aimed to explore the effects of cancer-patient-derived A2AAR mutations on ligand binding and receptor functions. The wild-type A2AAR and 15 mutants identified by Genomic Data Commons (GDC) in human cancers were expressed in HEK293T cells. Firstly, we found that the binding affinity for agonist NECA was decreased in six mutants but increased for the V275A mutant. Mutations A165V and A265V decreased the binding affinity for antagonist ZM241385. Secondly, we found that the potency of NECA (EC50) in an impedance-based cell-morphology assay was mostly correlated with the binding affinity for the different mutants. Moreover, S132L and H278N were found to shift the A2AAR towards the inactive state. Importantly, we found that ZM241385 could not inhibit the activation of V275A and P285L stimulated by NECA. Taken together, the cancer-associated mutations of A2AAR modulated ligand binding and receptor functions. This study provides fundamental insights into the structure–activity relationship of the A2AAR and provides insights for A2AAR-related personalized treatment in cancer.

1. Introduction

The adenosine A2A receptor (A2AAR), together with the other three subtypes of adenosine receptors (A1AR, A2BAR, and A3AR), belongs to the class A G-protein-coupled receptors (GPCRs) [1]. As common features of the GPCRs, the A2AAR has an extracellular N terminus, seven trans-membrane helices (TM1-TM7) connected by three intracellular loops (ICL1-ICL3) and three extracellular loops (ECL1-ECL3), and an intracellular C terminus [2]. When stimulated by its endogenous agonist, adenosine, or blocked by exogenous antagonists caffeine and theophylline, the A2AAR is involved in many physiological and pathological activities, including neurotransmission, blood-flow regulation, inflammation, and cancer [3].
The role of the A2AAR in cancer development has raised much interest in recent years and is highlighted by its immunosuppressive effects in the tumor micro-environment (TME). Adenosine is normally present at very low extracellular levels in healthy tissue [4], while in the TME, high levels of adenosine are present because more ATP is secreted due to cell damage and hypoxia and is further metabolized to AMP and adenosine [5]. The activation of the A2AAR on immune cells was found to suppress their anti-tumor responses, such as the inhibition of CD8+ T-cell activity [6], the inhibition of antigen presentation by dendritic cells [7], and the suppression of the cytotoxic function of NK cells [8]. Several in vivo studies have demonstrated the potential of small-molecule inhibitors as well as blocking antibodies targeting the A2AAR to treat cancer [9,10,11]. Thus, the A2AAR is an emerging immune checkpoint and a promising target for cancer treatment [12].
Thus far, several crystal structures of the A2AAR in complex with either an agonist or antagonist have been resolved [13,14,15]. However, most knowledge on the structure and function of the A2AAR, as well as drug discovery, is based on the wild-type receptor. Mutagenetic studies have been widely performed on the A2AAR and many other GPCRs, where residues in the ligand binding site were often replaced by alanine to identify key interactions of ligands with the wild-type receptor [16,17]. In previous research studies conducted by our group, we also used mutagenetic experiments to reveal the mechanism of antagonist dissociation from the A2AAR [18,19]. Nevertheless, we still lack knowledge on the ligand binding and functions of mutant A2AARs, especially when these mutations occur in physiological conditions as natural variants or in pathological conditions as potential disease-driving factors. As for cancer, nearly 20% of human tumors contain mutations in genes encoding GPCRs [20], and many genes are statistically more frequently mutated relatively to the background mutation rate [21]. Therefore, further investigation on cancer-associated mutations would help to better understand the phenotypical and biological outcome of these mutations and could promote personalized drug discovery.
In this study, by exploring the sequencing data from the Genomic Data Commons data portal (GDC), we selected 15 A2AAR mutations found in cancer tissue and investigated their effects on ligand binding and receptor functions. Our results showed that six mutations decreased the binding affinity for agonist NECA compared with the wild-type A2AAR, while only one mutation increased the affinity. Two mutations were found to decrease the affinity for antagonist ZM241385. Besides, several mutations could alter the potency of NECA for receptor activation (EC50) or of ZM241385 for receptor inhibition (IC50), which was mostly correlated with changes in the binding affinity. This study is the first to systematically characterize the cancer-associated mutations of the A2AAR, and it pinpoints mutations that impact receptor activity and that may influence therapeutic strategies targeting the A2AAR.

2. Results

2.1. Selection of Cancer-Associated A2AAR Mutations

From the Genomic Data Commons database (version 22.0; as collected by Bongers et al.) [22,23], a total of 58 A2AAR single-site missense mutations were identified in patients of different cancer types. As shown in Figure 1, these mutations were distributed all over the receptor. Among them, 15 mutations were located towards the extracellular region, as seen from the most conserved *. 50 residues (Ballesteros–Weinstein numbering system) [24], and the other mutations were in the lower part of the receptor. Since most A2AAR agonists and antagonists are extracellular ligands, it was inferred that mutations in the upper part were relatively close to the binding pocket and potentially involved in ligand binding or entry. Therefore, these 15 mutations were selected for further investigation. Of note, A265TECL3 and S281L7.46 have also been identified as natural variants (The 1000 Genomes Project Consortium, as collected by Bongers et al.) [23,25], while the other mutations could be considered cancer specific (Table S1).

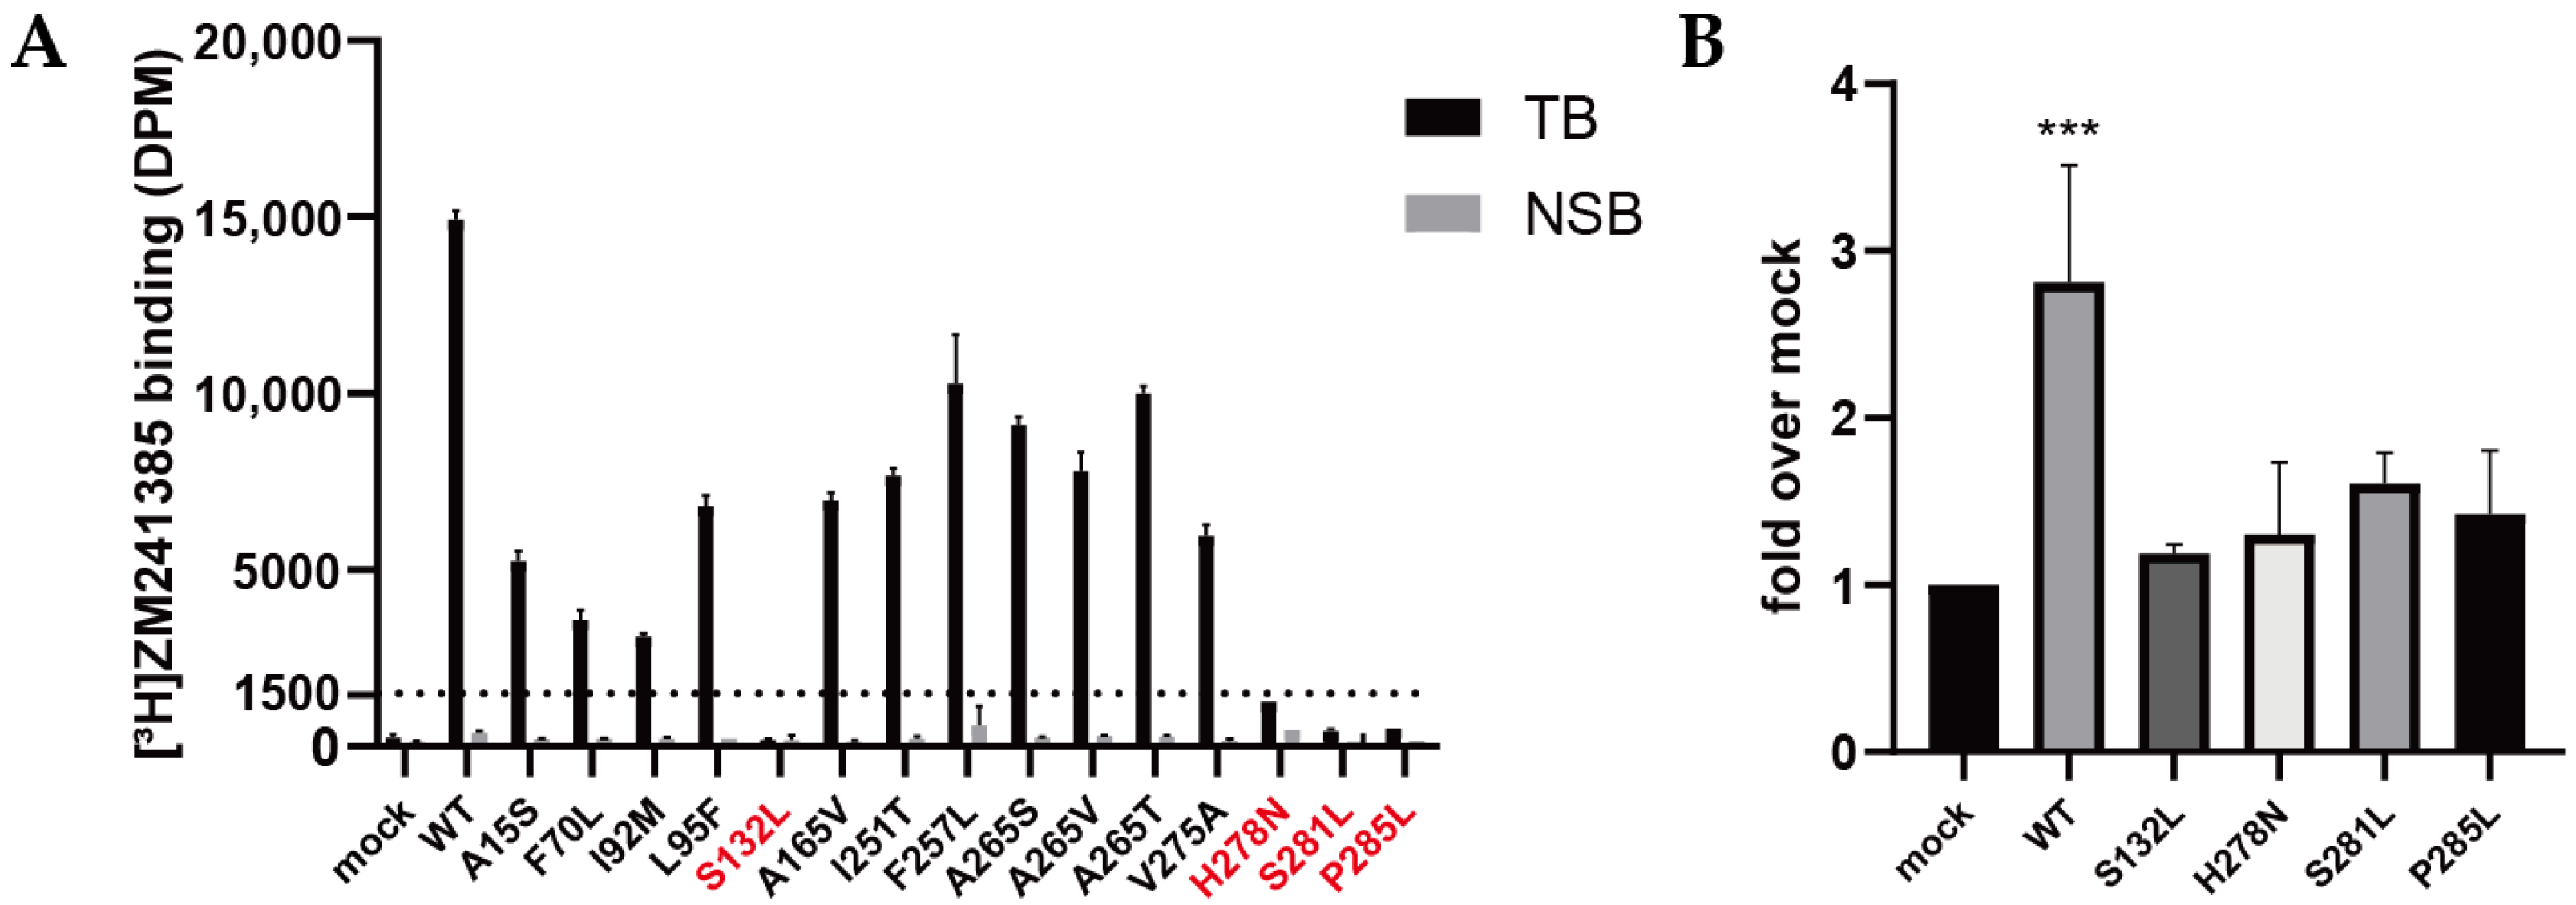
2.2. Validation of Expression and Radioligand Binding of Wild-Type and Mutant A2AARs

To validate the expression and radioligand-binding ability of A2AARs, 2.5 nM [3H]ZM241385 was first applied for the wild-type and 15 mutant receptors of interest. The binding window was defined as the difference between total binding (TB) and non-specific binding (NSB), thus representing the specific binding of the radioligand to the (mutant) A2AARs. As shown in Figure 2A, [3H]ZM241385 did not bind specifically to HEK293T membranes transfected with empty plasmids (mock), indicating that the endogenous expression of A2AAR was negligible compared with A2AAR-transfected samples (WT). All mutants displayed a lower specific binding of [3H]ZM241385 than the wild-type receptor, which suggested that they either had a lower expression level or [3H]ZM241385 bound to them with lower affinity. Of note, especially for S132L, H278N, S281L, and P285L mutants, a significantly decreased binding of [3H]ZM241385 was observed.
With an N-terminal FLAG-tagged construction of the receptors, an ELISA was performed to determine the expression level of the four mutants that displayed the lowest radioligand binding capacity, as shown in Figure 2B. The average expression level of the wild-type A2AAR was significantly higher (~2.8 fold) than that of mock HEK293T cells, while the expression levels of all four mutants were not significantly different from that of mock cells. These results indicated that the low expression of S132L, H278N, S281L, and P285L might have been the main reason why little binding of [3H]ZM241385 was observed. Consequently, the affinities for ZM241385 and NECA could not be determined for these mutants.

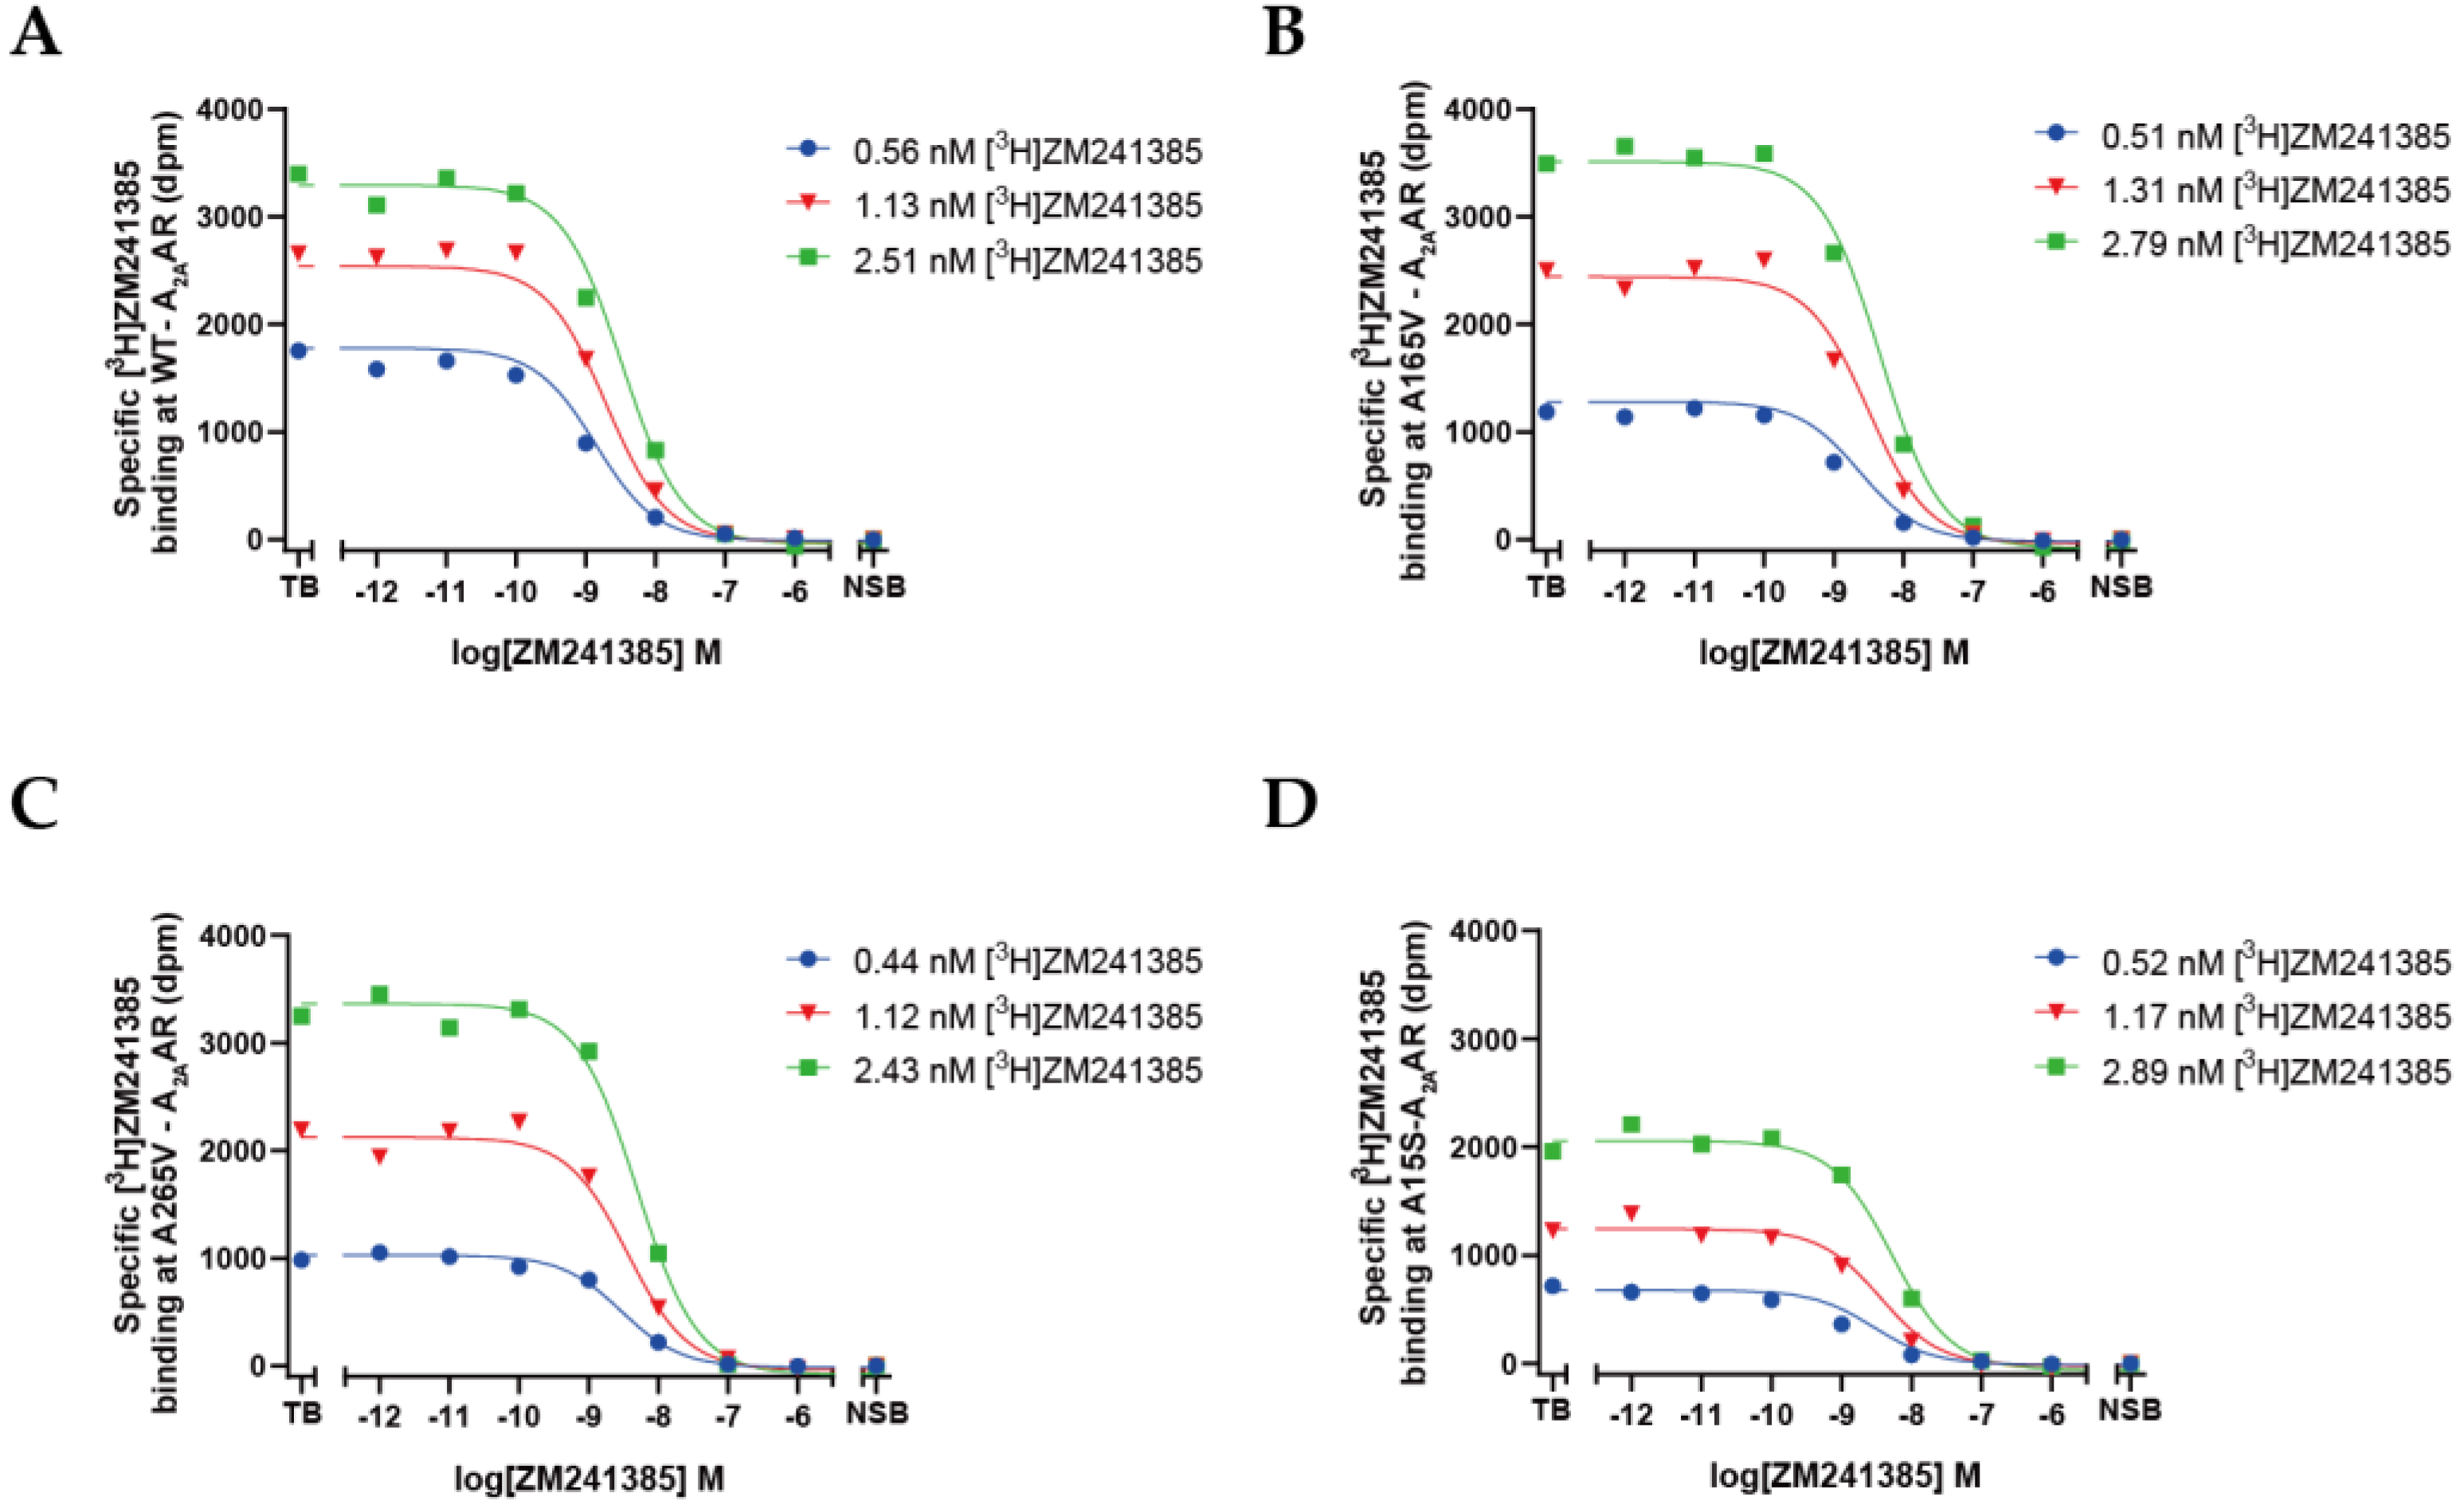
2.3. Quantification of Expression Levels (Bmax) and ZM241385 Binding Affinity (KD) for A2AARs

Radioligand-homologous-displacement experiments were performed to determine the affinity of ZM241385 and the receptor expression levels of wild-type and 11 mutant A2AARs (Table 1). It was shown that ZM241385 bound to A165V (KD = 2.2 nM; Figure 3B) and A265V (KD = 3.1 nM; Figure 3C) with a lower affinity than that for the wild-type receptor (KD = 0.98 nM; Figure 3A), while the pKD values of the other nine mutants were not significantly different from that of the wild-type (Figure 3D and Figure S1), indicating that these mutations did not affect the binding affinity for ZM241385 (p > 0.05; ordinary one-way ANOVAs).
The expression levels of A2AARs in transiently transfected HEK293T cells was presented as Bmax (Table 1). Although all mutants were expressed at high levels after transient transfection, seven mutants showed significantly lower expression levels than that of the wild-type A2AAR (Bmax = 37 pmol/mg), i.e., A15S (12 pmol/mg; Figure 3D), F70L (8 pmol/mg), I92M (9 pmol/mg), L95F (10 pmol/mg), A165V (17 pmol/mg), I251T (14 pmol/mg), and V275A (20 pmol/mg). The other four mutants (F275L, A265S, A265V, and A265T) showed expression levels similar to that of the wild-type receptor.

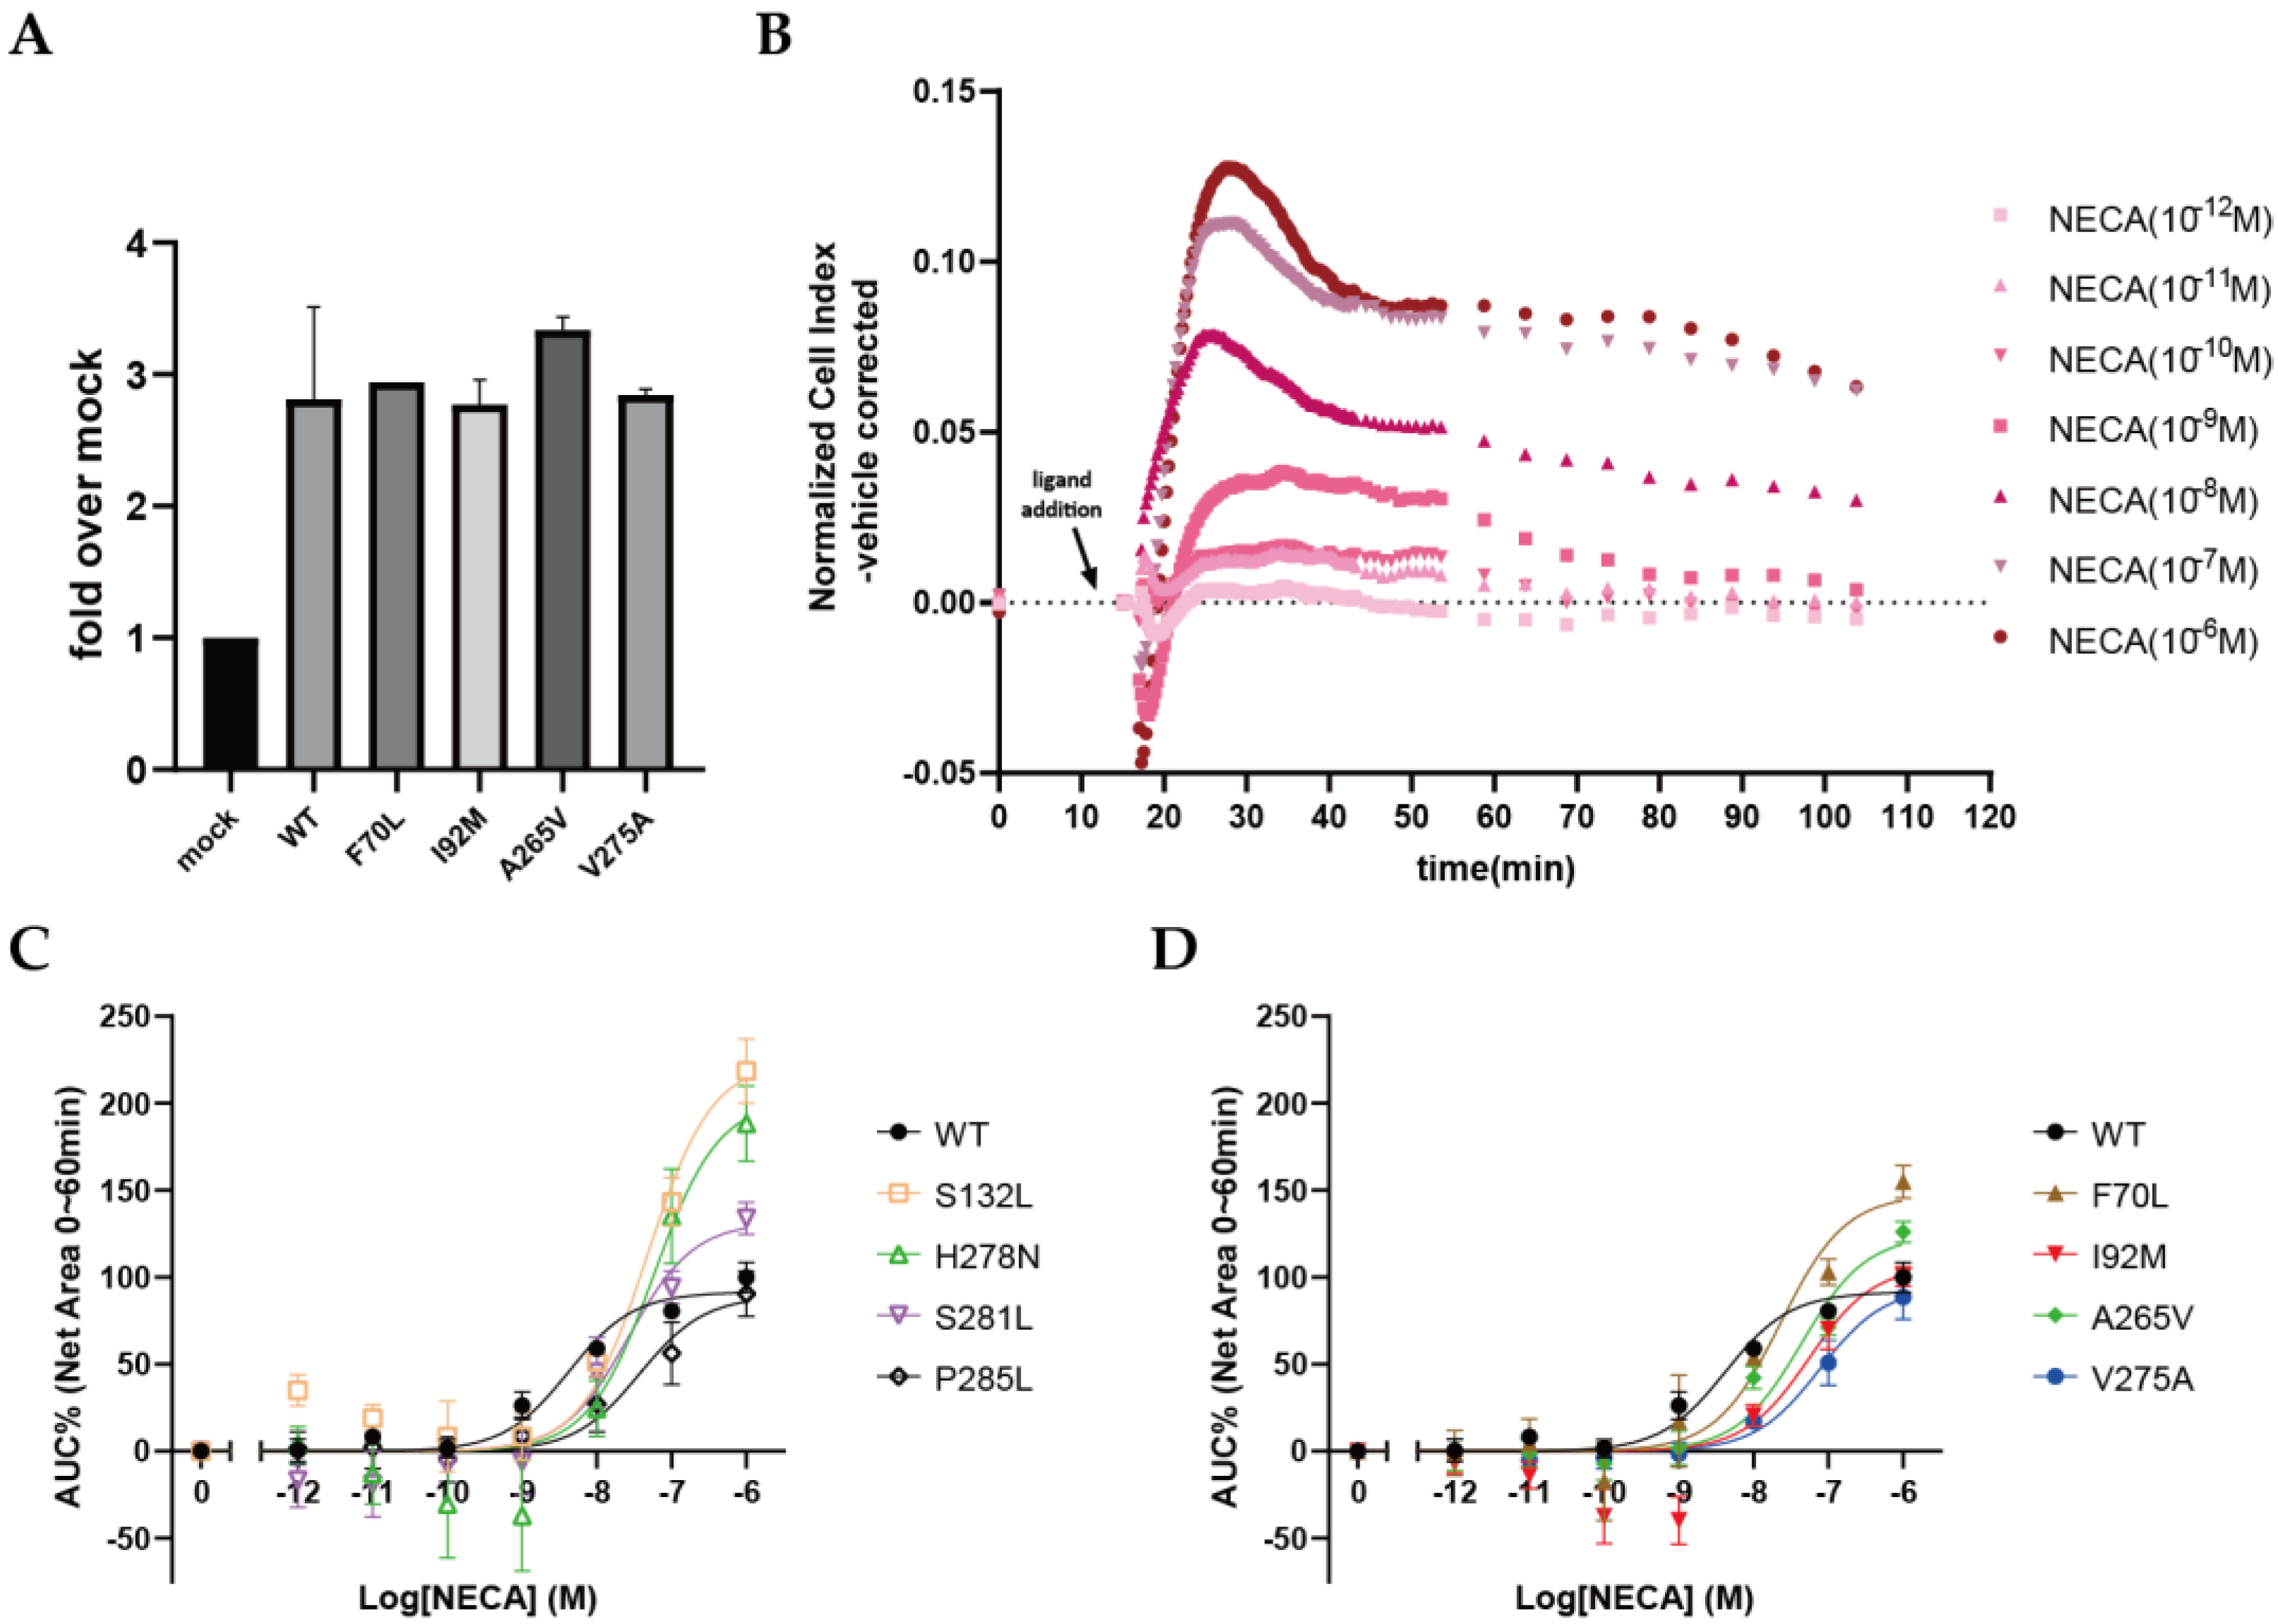
2.4. Quantification of NECA Binding Affinity (Ki) for A2AARs

The binding affinity of NECA for the wild-type and 11 mutant A2AARs was determined with radioligand-heterologous-displacement experiments. Based on the results shown in Figure 4A and Table 1, F70L (Ki = 595 nM), I92M (Ki = 606 nM), and A265V (Ki = 632 nM) drastically decreased the binding affinity for NECA compared with the wild-type A2AAR (Ki = 134 nM). Besides, A15S, A265S, and A265T slightly but significantly decreased the binding affinity for NECA by approximately two-fold (Figure 4C). Interestingly, V275A (Ki = 42 nM; Figure 4B) was the only mutation that increased the affinity of NECA for the A2AAR.

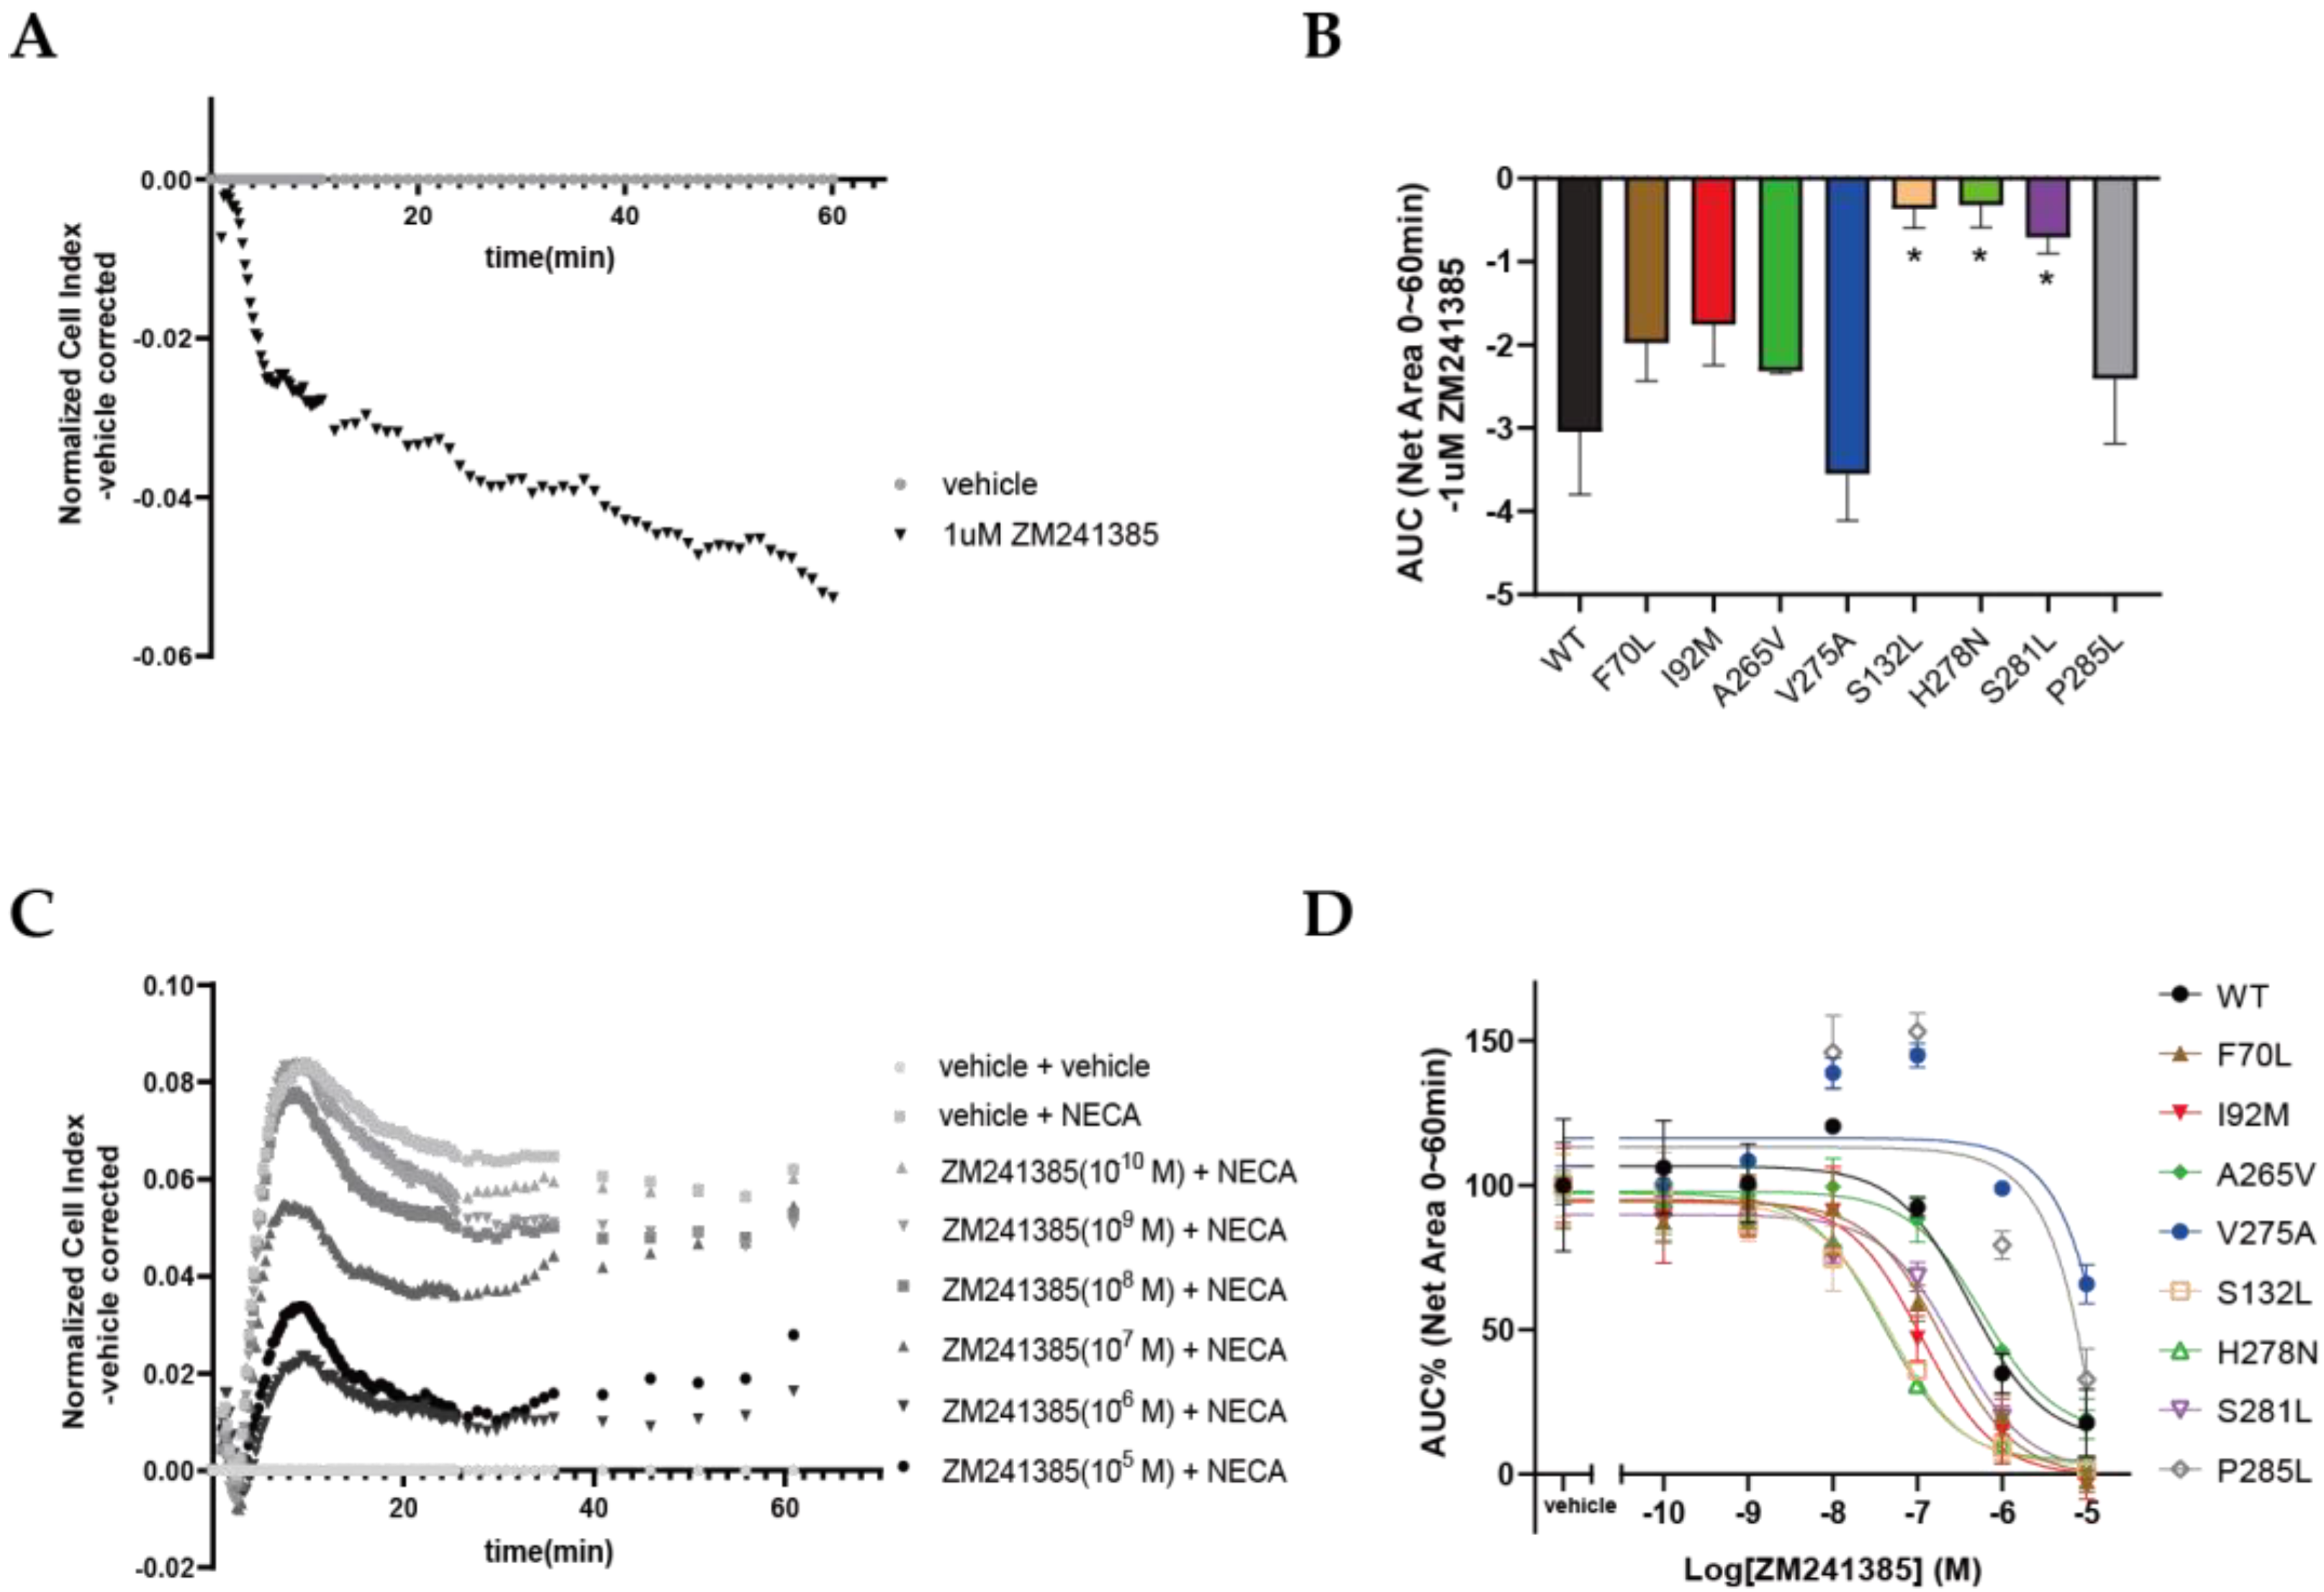
2.5. Functional Effects of Cancer-Associated Mutations on A2AAR in a Label-Free Whole-Cell Assay

To investigate the functional consequence of A2AAR mutations, HEK293T cells transiently transfected with either wild-type or mutant A2AARs were used in the cell-morphology assay. Here, we used a label-free detection system (xCELLigence RTCA system), which was applied in our lab to quantify the activation level of the wild-type A2AAR in real-time, where we found that it was correlated to the more classic cAMP accumulation assay [26]. In total, eight mutants were selected for functional characterization, as these mutants either displayed over three-fold changes in the binding affinity for NECA (F70L, I92M, A265V, and V275A) or could not be assessed with binding experiments due to their low expression levels (S132L, H278N, S281L, and P285L; Figure 2). For the first set of four mutants, ELISA experiments were also performed, and the results indicated that they expressed mutant receptors at levels similar to that of the wild-type A2AAR (Figure 5A).
Next, the changes in cell morphology were monitored in real time after the stimulation of the cells with agonist NECA for the wild type and the selected eight mutants. In this label-free assay, cell-morphology changes affected the electronic readout of cell–sensor impedance, which was displayed as the cell index (CI). It is shown in Figure 5B that the CI of wild-type-A2AAR-transfected cells slightly decreased upon the addition of NECA and then sharply increased and reached a peak response within 10~15 min. Thereafter, the CI gradually decreased towards a plateau within 60 min and continued to slowly decrease towards baseline levels. The NECA-induced response was dose dependent (Figure 5B), with a potency of 8.4 ± 0.2 with respect to the wild-type A2AAR (Table 2).
Having established a wild-type A2AAR response for NECA in transiently transfected HEK293T cells, the above eight mutants were characterized following the same procedure. All eight mutants could be activated by NECA, resulting in a CI trace shape similar to that of the wild-type receptor (data not shown). The potency (EC50), intrinsic efficacy (Emax), and relative efficacy (τ) of NECA for each A2AAR mutant were determined and are detailed in Table 2. NECA displayed a significantly decreased potency for almost all mutants when compared with the wild-type A2AAR (pEC50 = 8.4 ± 0.2), except for F70L (pEC50 = 7.6 ± 0.2) and S281L (pEC50 = 7.7 ± 0.3), for which the potencies were modestly decreased but not statistically different (p > 0.05; ordinary one-way ANOVAs). Notably, V275A, the only mutant with an increased binding affinity for NECA (Table 1), displayed the lowest potency (pEC50 = 7.1 ± 0.1). Moreover, S132L and H278N, which had much lower expression levels than the wild-type receptor (Figure 2B), both showed a significant increase in efficacy (Emax% = 248 ± 30 for S132L, Emax% = 223 ± 33 for H278N, and Emax% = 100 ± 5 for WT). The intrinsic efficacies of the other mutants were not significantly different from that of the wild-type receptor. The relative efficacy was also calculated for each mutant receptor, where the affinity of NECA was taken into consideration. This resulted in a different ranking of NECA with respect to the different receptors compared with the intrinsic efficacy (Table 2). The wild-type A2AAR showed the highest relative efficacy (τ = 37 ± 13), followed by F70L (τ = 28 ± 11), A265V (τ = 21 ± 8), and I92M (τ = 10 ± 3), while V275A (τ = 1 ± 0) showed the lowest relative efficacy, indicating that this mutation caused a loss in coupling efficiency.
Besides agonist-dependent activation, the inhibition of A2AARs by antagonist ZM241385 was also investigated. Since ZM241385 often shows inverse agonism on A2AAR, we first studied this pharmacological feature with an impedance-based assay. As shown in Figure 6A, after the addition of 1 µM ZM241385 to HEK293T cells transfected with wild-type A2AAR, the cell index first slightly increased; then, it sharply decreased within 5 min and further decreased slowly over time. Upon the normalization of the response to the vehicle, the area-under-curve value was thus negative, indicating that ZM241385 exhibited an opposite pharmacological effect towards agonist NECA (Figure 5B). The responses of wild-type and mutant A2AARs to 1 μM ZM241385 were quantified and are displayed in Figure 6B and Table 3. Most mutants showed levels of inverse agonism similar to that of the wild-type A2AAR. However, mutants S132L, H278N, and S281L displayed a much lower level of inverse agonism than the wild-type A2AAR. Interestingly, NECA induced a higher level of activation in these mutants (Table 2), indicating that these mutations induced a conformation of the receptor that had less basal activity but was prone to higher levels of agonist-induced activation.
Lastly, we compared the inhibitory effects of ZM241385 on NECA-induced activation of the wild-type and different A2AAR mutant receptors. A dose-dependent inhibition of ZM241385 in wild-type A2AAR was observed, as shown in Figure 6C. Dose–response curves are depicted for all mutants in Figure 6D, and pIC50 values are shown in Table 3. Compared with wild-type A2AAR (pIC50 = 6.4 ± 0.3), ZM241385 displayed significantly higher potency with respect to S132L (pIC50 = 7.3 ± 0.1) and H278N (pIC50 = 7.4 ± 0.1). In addition, a small but significant increase in potency was found for F70L (pIC50 = 6.7 ± 0.2), I92M (pIC50 = 6.9 ± 0.1), and S281L (pIC50 = 6.6 ± 0.1), whereas the potency with respect to A265V (pIC50 = 6.3 ± 0.2) was similar to that with respect to the wild-type A2AAR. However, ZM241385 was not able to inhibit the NECA-induced activation of V275A and P285L, unless high concentrations were used. Of note, its affinity was not affected for V275A (and could not be determined for P285L; Table 1), indicating that its potency was negatively impacted by these mutations.

2.6. Mapping of Cancer-Associated Mutations in the Crystal Structures of A2AAR

To provide insight into the structure–activity relationship observed in the introduced mutants, we mapped each of the mutations on the available experimentally determined structures of the A2AAR, for which we used the inactive (PDB ID: 4EIY), active-like (PDB ID: 2YDV), and fully active (PDB ID: 5G53) structures. As shown in Figure 7A, the mutations were scattered around the binding pocket, though some clustering of residues could be observed, for instance, in TM7. We focused on mutations that abominated binding and were either in direct contact with the ligand in the binding pocket, i.e., H278N, or introduced large changes in the amino acid composition that might have influenced the activation of the receptor, e.g., S132L and P285L. H278 formed an extensive hydrogen-bond network with the ribose moiety of the agonist (Figure 7B). These hydrogen-bond patterns might have been impaired by the H278N mutation, which explains why the potency of NECA was significantly reduced for this mutant (Table 2). Residue P285 was located close to the center of TM7, which moved inward during the activation process of the A2AAR. As shown in Figure 7, TM7 was in a similar overall position both in the active-like state and fully active state, while the center of TM7 moved further inward in the active-like state, and the orientation of the helix in the fully active structure was closer to the inactive structure. It is well known that Pro residues introduce alpha-helical kinks, which might facilitate this movement. Therefore, in the P285L mutant, the substitution of Pro with Leu might have abrogated this conformational rearrangement of TM7, thus resulting in the decrease in the potency of both NECA and ZM241385 observed in the impedance-based assay (Table 2 and Table 3). Although mutation S132L was also shown to greatly decrease the potency of NECA, it did not undergo any structural rearrangements when comparing the different states of the crystal structure (Figure 7D) and was relatively far away from the binding site. Thus, the mechanism of the pharmacological effects of S132L remains to be revealed.

3. Discussion

Mutagenetic studies of the A2AAR have been performed since the 1990s and were later on complemented by computational modeling and crystallography [27]. From these studies, numerous A2AAR mutations are known to alter ligand binding and receptor activation [28,29]. In addition, it has been reported that impaired receptor expression is the most common defect caused by GPCR mutations, often combined with receptor instability and malfunction [30]. However, as A2AAR is emerging as a novel therapeutic target for cancer, little attention has been given to the cancer-associated mutations of the receptor and their potential pharmacological effects in the context of cancer biology and targeting. Therefore, in this study, 15 single-site mutations of A2AAR were retrieved from the Genomic Data Commons data portal [31]. These mutations were characterized for their expression levels and effects on ligand binding and receptor functions.

3.1. Some Cancer-Associated Mutations Cause a Conformational Change in A2AAR

Mutations S132L4.53 and H278N7.43 decreased the potency of NECA by over 10-fold, whereas Emax was increased by more than two-fold (Figure 5C). The decreased potency could have been caused by lower receptor expression, as higher agonist concentrations were required for exerting a certain level of biological activity [32]. In addition, residue His2787.43 was in direct contact with NECA via extensive hydrogen bonding (Figure 7B), and the mutation to Asn might have impaired this interaction. It was reported in a previous study that substitution of His2787.43 with either Ala, Lys, or Asn abolished the binding of agonists NECA and CGS21680 and antagonist XAC [29]. On the other hand, in this study, we observed that H278N7.43 could be activated by NECA in a dose-dependent manner, albeit at lower potencies than for the wild-type receptor. Hence, we infer that the binding of NECA with H278N7.43 occurs with a lower affinity but is not abolished. Different from this, S132L4.53 was located relatively far away from the binding site (Figure 7A); thus, the decreased potency may not have resulted from a change in ligand binding. Moreover, the effect of this mutation might have been caused by an overall destabilization of the receptor, as suggested by a much lower receptor expression. Further studies are needed to clarify the structural basis of altered receptor functions caused by S132L4.53, which is currently the mutation with the highest incidence among all cancer-associated A2AAR mutations in the GDC data portal. Interestingly, these two mutations not only increased Emax but also drastically decreased the level of inverse agonism via ZM241385 (Figure 6B, Table 3), showing less constitutive activity of the receptor, thus suggesting a more inactive conformation of the receptor. The constitutive activity of the A2AAR was previously reported, with A2AAR being found to display a native level of activation in the absence of any agonist and inverse agonists being preferentially bound to the inactive state to reduce the activity [33,34]. In addition, in comparison with the wild-type receptor, the potency of ZM241385 with respect to S132L4.53 and H278N7.43 was not impaired but increased (Figure 6, Table 3). Therefore, it seems that S132L4.53 and H278N7.43 shifted the conformational equilibrium of A2AAR towards the inactive state. However, this shift could not be observed in our static-structure analysis, but it could be modeled with more advanced methods, for example, free-energy simulation [35]. Of note, Gao et al. reported a sodium binding pocket in the A2AAR formed by His2787.43 and Glu131.39 and showed that mutation H278Y7.43 reduced the negative allosteric effect of sodium ions on agonist binding [36]. Although a physiological concentration of NaCl was found to be sufficient to stabilize the inactive conformation of the A2AAR [37], it remains unknown whether the substitution of His2787.43 with Asn instead of Tyr would augment the allosteric effect of sodium ions to achieve this effect.
S2817.46 was also investigated in other mutagenetic studies; for instance, Kim et al. found that the substitution of Ser with Ala abolished the binding of agonist GGS21680 and antagonist XAC, while the substitution with Thr increased the affinity for NECA, GGS21680, and XAC [28]. Besides, Jiang et al. reported that the substitution of Ser2814.53 with Asn increased the affinity for NECA and CGS21680 but decreased the affinity for ZM241385 [38]. These studies suggested that the hydrophilic side chain of S2817.46 is beneficial to ligand recognition. Although we could not determine the binding affinity values for this mutant due to its low expression level, it is inferred that hydrophobic mutation S281L7.46 could cause a decrease in the affinity for NECA, which would be consistent with the slightly decreased potency observed in the cell-morphology assay. Moreover, we observed that mutation S281L7.46 decreased the inverse agonism induced by ZM241385, indicating a more inactive conformation of the receptor. This might be explained by the fact that S2817.46 is positioned in the allosteric sodium binding site of the A2AAR (D522.50, S913.39, T883.36, W2466.48, N2807.45, and S2817.46) [15,37].
P2857.50 is located in the highly conserved NPxxY motif that is known to be involved in GPCR activation [2,39]. Massink et al. found that mutation N284A7.49 in the A2AAR completely abolished receptor activation [40]. However, in our study, mutation P285L7.50 caused a 10-fold decrease in the potency of NECA but similar efficacy with respect to the wild-type A2AAR, indicating that the activation of the receptor was also impaired albeit not abolished. Based on structural mapping (Figure 7C), P2857.50 showed a drastic conformational rearrangement during the receptor activation process, which might be impeded if Pro were substituted with Leu. Interestingly, ZM241385 could only inhibit the activation of the P285L7.50 mutant at concentrations above 1 μM (Figure 6D). Although the affinity of ligands for P285L7.50 could not be determined, it was reported that mutation P285C7.50 in A1AR slightly increased the affinity for its antagonist DPCPX [41]. Considering the significantly decreased potency of antagonist ZM241385, we speculate that P285L7.50 may increase the affinity for NECA; thus, the competitive binding between the agonist and the antagonist would result in altered receptor inhibition. However, P2857.50 was located about 15 Å below the orthosteric binding site of NECA in the sampled conformational states. As this large distance could not allow this residue to interact with the bound ligand independently, further studies are needed to interpret its pharmacological effects. At last, compared with wild-type A2AAR, P285L7.50 displayed similar Emax of NECA and similar inverse agonism of ZM241385, so the conformational equilibrium did not seem to be influenced.

3.2. Some Cancer-Associated Mutations Affect Ligand Binding and Functioning of A2AAR

Looking into the structural features of these mutations and their effects on ligand binding, we found that all mutations located in the extracellular loops played a role. For example, F70LECL1 decreased the affinity for NECA by around four-fold, and A165VECL2 slightly decreased the affinity for ZM241385 and NECA, while A265VECL3 drastically decreased the affinity for both ligands. Besides, although these three mutations all preserved the hydrophobic side chain, they still showed a considerable impact on the affinity, possibly due to an increase in the steric hindrance during ligand entry. Note that three different mutations were found in Ala265ECL3, i.e., A265S, A265V and A265T, which was located next to His264ECL3. His264ECL3 is part of the orthosteric binding pocket of A2AAR, and was found to have an aromatic interaction with the 4-hydroxyphenyl ring of ZM241385 [42]. Guo et al. also reported a hydrogen-bond network formed by His264ECL3, Glu169ECL2, and Thr2566.58 with ZM241385, and the disruption of this network by the mutation of either of these residues decreased the binding affinity for ZM241385 due to a faster dissociation rate of the antagonist from the receptor [18]. These studies are in line with our findings that the introduction of a bulkier hydrophobic side chain into Ala265 by substitution with Valine might cause stronger steric hindrance to His264 and thus a loss in the affinity for both the agonist and antagonist.
Of further interest is the mutations’ effects on receptor functions. For F70LECL1, I92M3.40, and A265VECL3, a decreased potency with respect to NECA was observed (Figure 5D, Table 2), which was correlated to a decreased binding affinity for this agonist (Figure 4A, Table 1). To be noted, residue I923.40 constitutes the highly conserved PIF motif, which is an important micro-switch in class-A-GPCR activation [43]. Consistently, the decrease in the potency of I92M3.40 was larger than those of F70LECL1 and A265VECL3, resulting in a lower relative efficacy. The relative efficacy, τ, reflects the ability of a specific agonist to activate the receptor in relation to its receptor occupancy level (so more system independent) [44]. When τ is large, resulting from an agonist with a much higher potency than its affinity and with 100% Emax, this indicates full agonism. Vice versa, small τ or lower Emax indicates partial agonism. As such, although the apparent maximal response to NECA of V275A7.40 was similar to that of the wild-type A2AAR (Figure 5D, Table 2), when calculating its relative efficacy, NECA seemed to act as a partial agonist. V275A7.40 was the only mutation that increased the affinity for NECA but decreased its potency. In other words, the activation of this mutant receptor by NECA was dependent on a larger proportion of receptor occupancy; thus, this indicated a loss in the coupling efficiency of the intracellular signaling pathways. Similar effects were described for VEGFR and β adrenergic receptors, whereby agonists may show “pluridimensional efficacy” depending on the level of receptor expression, the cell background, and the observed signaling pathway [45,46]. This and our data substantiate the importance of calculating the relative efficacies when comparing agonists and receptor variants, especially when using (transient) heterologous expression systems. In addition, ZM241385 could only exert inhibitory effects on V275A7.40 at high concentrations (Figure 6D, Table 3), resulting from the increased affinity for NECA and unaffected affinity for ZM241385 (Figure 4B, Table 1), which followed the same pattern observed in P285L7.50. Importantly, the lost potency of prototypic drug ZM241385 with respect to these two mutations indicates that they could be problematic in cancer treatment and deserve follow-up studies.

3.3. Potential Effects of A2AAR Mutations on Cancer Development and Treatment

Besides acting as an important checkpoint in immune cells, the antagonism of A2AAR signaling in tumor cells was also found to inhibit their growth [47,48]. This indicates that mutations influencing the ligand binding affinity or receptor activation level could change cancer cell growth or sensitivity to A2AAR-targeted treatment. For example, S132L4.53 and H278N7.43, which were observed to stabilize the inactive state of A2AAR, could inhibit the cell growth brought forth by the constitutive activation. However, considering the high concentrations of adenosine present in the TME [12] and the increased efficacy of agonist NECA with respect to these two mutants, cell growth could eventually be promoted, which means that these mutations could be oncogenic drivers. To be noted, the activation of these two mutants could still be inhibited by ZM241385 even with a higher potency (Table 3) and could render the cells more sensitive to the antagonism of the A2AAR. On the contrary, cells bearing the V275A7.40 or P285L7.50 mutation were likely to be resistant to prototype drug ZM241385 (Table 3); thus, a higher dose or more potent antagonists are needed when targeting these mutant receptors.

3.4. Conclusions

In this study, we characterized 15 cancer-associated mutations of the human adenosine A2A receptor to study their effects on ligand binding and receptor functions in HEK293T cells. Several mutations were found to affect the binding affinity for an agonist or antagonist, the receptor expression level, and the constitutive activity of the receptor, as well as receptor activation and inhibition by a reference agonist and antagonist, respectively. This study provides novel fundamental insights into the structure–activity relationship of the adenosine A2A receptor. Based on these findings, further studies in cancer-cell models are required to reveal the role of these A2AAR mutations in cancer progression. Moreover, identifying antagonists that affect wild-type as well as mutant receptors may lead to optimized therapeutic strategies targeting the A2AAR.

4. Materials and Methods

4.1. Chemicals and Reagents

[3H]ZM241385 (specific activity of 50 Ci/mmol) was purchased from American Radiolabeled Chemicals Inc. (St. Louis, MO, USA). Unlabeled ZM241385, 5′-Nethylcarboxamidoadenosine (NECA), and adenosine deaminase (ADA) were purchased from Merck Life Science N.V. (Amsterdam, The Netherlands). The BCA protein assay reagent was obtained from Fisher Scientific (Landsmeer, The Netherlands). Quick Change II Site-Directed Mutagenesis Kit was purchased from Agilent Technologies Netherlands B.V. (Amstelveen, The Netherlands). All other chemicals were of analytical grade and obtained from standard commercial sources.

4.2. Site-Directed Mutagenesis

Plasmid DNA of A2AAR mutants were constructed using polymerase chain reaction (PCR) based on pcDNA3.1(-)-A2AAR-wt with N-terminal FLAG tag and C-terminal His tag as template, using Quick Change II Site-Directed Mutagenesis Kit. Mutagenesis primers for PCR cloning were designed using the online Quickchange primer design tool (Agilent Technologies) and synthesized by Integrated DNA Technologies (Coralville, CA, USA). All DNA sequences were verified using Sanger sequencing at Leiden Genome Technology Center (Leiden, The Netherlands).

4.3. Cell Culture and Transfection

Human embryonic kidney 293T (HEK293T) cells were grown in Dulbecco’s modified Eagle medium (high glucose) supplemented with 10% fetal calf serum, 200 μg/mL penicillin and 200 μg/mL streptomycin, at 37 °C and 5% CO2. Cells were subcultured at a ratio of 1:15 twice a week on 10 cm ø plates. Before transfection, cells were subcultured at a ratio of 1:8, and after 24 h of proliferation, they could reach ~50% confluency. Cells were transfected with wild-type or mutant pcDNA3.1(-)-A2AAR plasmid DNA (1 μg/plate) using the calcium phosphate precipitation method [49]. In short, 1 μg of plasmid DNA was dissolved in 365 μL of water and then mixed with 135 μL of 1M CaCl2 solution. The mixture was added dropwise to a HBSS buffer under aeration to form a fine precipitate, which was applied at 1 mL/plate to HEK293T cells. The HBSS buffer contained 280 mM NaCl, 10 mM KCl, 1.5 mM Na2HPO4 and 50 mM HEPES, pH 7.05.

4.4. Enzyme-Linked Immunosorbent Assay (ELISA)

To determine the expression level of wild-type or mutant A2AARs on HEK293T-cell membranes, 24 h after transfection, cells were detached with PBS/EDTA and resuspended in culture medium. Cells were then seeded in poly-D-lysine coated 96-well plates at a density of 1 × 10⁶ cells/well in quintuplicate. After 24 h of incubation at 37 °C and 5% CO2, the medium was removed, and cells were washed with PBS and subsequently fixed with 100 μL/well 4% formaldehyde for 10 min. Cells were washed with TBS (20 mM Tris-HCl, 150 mM NaCl (pH 7.5)) twice before 100 μL/well blocking buffer (2% w/v bovine serum albumin in TBST) was added, and they were incubated for 30 min at room temperature. After that, the blocking buffer was removed, and cells were incubated with 100 μL/well primary antibody (mouse anti-FLAG monoclonal antibody; Sigma F3165, Merck Life Science NV, Amsterdam, Netherlands; 1:4000) for 2 h at room temperature while being shaken at 300 rpm. Next, the primary antibody was removed, and cells were washed with TBST (TBS with 0.1% Tween-20) three times before the addition of 100 μL/well secondary antibody (goat anti-mouse IgG HRP conjugated; Jackson ImmunoResearch Laboratories 115-035-003; 1:10,000) and were incubated for 1 h at room temperature while being shaken. After the removal of the secondary antibody, cells were washed three times with TBS. Next, cells were treated with 100 μL/well 3, 3′, 5, 5′-tetramethylbenzidine (TMB; Sigma T0440) for 5 min in the dark; then, the reaction was stopped with the addition of 100 μL/well 1 M H3PO4 solution. Immediately after that, the absorbance was measured at 450 nm using an EnVision™ (Menlo Park, CA, USA) microplate reader. HEK293T cells transfected with vector pcDNA3.1 plasmid were used as a control (mock), the absorbance value of which was normalized to 1 for data analyses.

4.5. Membrane Preparation and Determination of Specific [3H]ZM241385 Binding

The preparation of cell membranes over-expressing A2AARs for radioligand-binding assays was performed as previously reported [18]. Briefly, HEK293T transiently expressing the wild-type or mutant A2AAR were detached by scraping into PBS. Cell pellets were collected by centrifugation at 1000 rpm for 10 min to remove PBS and re-suspended in ice-cold Tris-HCl buffer (50 mM; pH = 7.4) prior to homogenization. The homogenized suspensions were centrifuged at 100,000× g for 20 min at 4 °C and re-suspended in Tris-HCl buffer to repeat the homogenization–centrifugation cycle again. At last, membranes from ten 10 cm ø plates were re-suspended in 1 mL of assay buffer (50 mM Tris-HCl, 5 mM MgCl2, 0.1% CHAPS) as used in radioligand-binding assays, homogenized, and treated with adenosine deaminase (0.8 IU/mL) to degrade endogenous adenosine. Membranes were stored in 100–250 μL aliquots at −80 °C. Membrane protein concentrations were determined using the BCA method [50].
To determine the binding capacity of [3H]ZM241385 with A2AARs, 25 μL of membrane (10 μg protein/well) was mixed in a total volume of 100 μL, with the presence of 2.5 nM [3H]ZM241385, with 100 μM NECA to determine non-specific binding (NSB) or without NECA to determine total binding (TB). The mixtures were incubated at 4 °C for 2 h while being shaken at 200 rpm. Incubation was terminated with rapid vacuum filtration to separate the bound and free radioligands with a 96-well GF/C filter using Filtermate-harvester (PerkinElmer, Groningen, The Netherlands). Filters were washed ten times with ice-cold wash buffer (50 mM Tris-HCl, 5 mM MgCl2) before drying at 55 °C in an oven for 30 min. To measure the membrane-bound radioactivity, 25ul MicroScint™-20 cocktail was added to each well, and the filter was measured with MicroBeta2 Microplate Counter (PerkinElmer, Groningen, The Netherlands).

4.6. Radioligand-Homologous- and -Heterologous-Displacement Assays

For the homologous-displacement assay, increasing concentrations (from 1012 M to 106 M) of unlabeled ZM241385 were used to displace the binding of three concentrations of [3H]ZM241385, i.e., 0.5 nM, 1 nM, and 2.5 nM, which were distributed around the estimated KD of ZM241385 with A2AAR. For the heterologous-displacement assay, increasing concentrations (from 1011 M to 105) of NECA were used to displace the binding of 2.5 nM [3H]ZM241385. Based on the pre-determined [3H]ZM241385 binding capacity for the different mutants, 25 μL of membrane aliquots containing 1~20 μg protein was used to adjust the total binding with 2.5 nM [3H]ZM241385 to approximately 2000 dpm and non-specific binding less than 10% of total binding. Membranes were incubated with the radioligand and the compound of interest in a total volume of 100 μL of assay buffer (50 mM Tris-HCl, 5 mM MgCl2, 0.1% CHAPS), as described above.

4.7. Label-Free Whole-Cell Assay (xCELLigence RTCA System)

The functional characterization of transiently transfected wild-type and mutant A2AARs was performed on HEK293T cells with the xCELLigence RTCA system, as previously described [51]. Briefly, an arrayed microelectrode was embedded at the bottom of each well of a 96-well E-plate (Roche Applied Science, Mannheim, Germany). During cell spreading and proliferation, the cell-morphology changes affected the electronic readout of cell–sensor impedance (Z), which was monitored in real time by the xCELLigence RTCA system and displayed as the cell index (CI). If the cells were stimulated by a ligand, the changes in the CI reflected the overall cellular response upon the activation of GPCR-mediated signaling.
To study the stimulation of A2AARs with NECA, HEK293T cells were transfected with the wild-type or mutant A2AAR following the methods described above. A total of 24 h after transfection, cells were detached with PBS/EDTA and suspended in culture medium. The cell suspension was centrifuged at 1000 rpm for 5 min to remove the supernatant; then, cell pellets were re-suspended in culture medium to adjust the concentration to 1 × 10⁶ cells/mL. First, 50 μL of culture medium was added to each well of a 96-well E-plate to measure the background (Z0). Next, 40 μL of cell suspension containing 40,000 cells was added to each well, and the E-plate was left at room temperature for 30 min before being placed on the recording device station in the incubator at 37 °C and 5% CO2. The cells were cultured for 17~20 h until the end of the log phase, during which the CI was continuously measured every 15 min. After that, 5 μL adenosine deaminase solution (ADA; 2.5 IU/mL) was added to each well and incubated for 1.5 h to remove the adenosine present in the culture medium. Subsequently, cells were stimulated with 5 μL of NECA (final concentration ranges from 1012 M to 106 M) or vehicle control (final concentration of 0.1% DMSO). The changes in the CI after agonist addition were measured every 15 s within the first 30 min, followed by every 5 min up to 120 min. For data analyses, the CI of each group was normalized by subtracting the baseline (vehicle control) to correct for any non-specific signals. Dose–response curves were generated from the area under the curve (AUC) within the first 60 min after agonist addition, and parameters including EC50, EC80, and Emax were calculated to describe the potency and efficacy of NECA stimulation of wild-type or mutant A2AARs.
To characterize the pharmacological effects of ZM241385 on wild-type or mutant A2AARs, the experiments were performed similarly to those described above. Cells were then treated with 5 μL of ZM241385 (final concentration ranges from 1010 M to 105 M) or vehicle control (final concentration of 0.05% DMSO), and the changes in the CI were measured every 15 s within the first 10 min and every 1 min up to 90 min. After that, 5 μL of NECA (final concentration equals to the EC80 of NECA for each A2AAR variant) or vehicle control (final concentration of 0.05% DMSO) was added to each well. For data analyses, the CI of each group was normalized by subtracting the baseline (vehicle control) to correct for any non-specific signals. The AUC within 60 min after compound addition was used to describe the initial response of ZM241385 itself and the inhibitory effects of ZM241385 upon NECA stimulation.

4.8. Data Analysis

All experimental data were analyzed using GraphPad Prism 9.0 (GraphPad Software Inc., San Diego, CA, USA), and the values obtained were means of two or three independent experiments. SD values were calculated for the results of two independent experiments (radioligand binding window check and ELISA), and SEM values were calculated for three independent experiments.
KD values of [3H]ZM241385 obtained from homologous-displacement assays were calculated using nonlinear-regression curve fitting (Binding-Competitive-One site-Homologous), where 3 concentrations of [3H]ZM241385 were input and KD was obtained with global fitting. Bmax values were obtained from homologous-displacement assays in “dpm”, and converted to pmol/mg using the following equations:
B m a x   ( C i ) = B m a x   ( d p m ) 2.22   ×   10 12
B m a x   ( m m o l ) = B m a x   ( C i ) / S p e c i f i c   a c t i v i t y   ( C i / m m o l )
S p e c i f i c   a c t i v i t y = S p e c i f i c   a c t i v i t y   a t   t 0 ×   0.5 t i m e   l a p s e   s i n c e   p r o d e c t i o n   d a t e h a l f   l i f e   o f   r a d i o   l a b e l
B m a x   ( p m o l / m g ) = B m a x   ( m m o l )   ×   10 9 A m o u t   o f   m e m b r a n e   p r o t e i n   p e r   w e l l   ( m g )
IC50 values obtained from heterologous-displacement assays were calculated by nonlinear-regression curve fitting using a one-site competitive binding model, where KD values were taken from the homologous-displacement assays for each receptor variant, and Ki were converted from IC50 following the Cheng–Prusoff equation [52]:
K i = I C 50 1 + [ R a d i o l i g a n d ] K D
EC50 and Emax values in the cell-morphology assay were obtained by plotting the normalized CI traces using RTCA Software 2.0 (Agilent Technologies Netherlands BV, Amstelveen, Netherlands). Dose–response curves were generated by calculating the area under curve over the first 60 min after compound addition and were analyzed using nonlinear-regression fitting (three-parameter model) to determine EC50 and Emax. The relative efficacies (τ) of the agonist on each receptor variant were obtained by fitting the data to the operational model by Black and Leff [53], which correlates the biological effect, E, with agonist concentration [A]:
E = E m a x · τ · [ A ] K D + ( τ + 1 ) · [ A ]

4.9. Structural Mapping

Figures were created based on the experimentally determined structures for the A2AAR crystal structures, with PDB codes 4EIY [15] for the inactive structure, 2YDV [14] for the active-like structure and 5G53 [54] for the fully active structure. Figures were generated using PyMOL Molecular Graphics System version 2.0 (Schrödinger, LLC., New York, NY, USA).

Supplementary Materials

The following supporting information can be downloaded at: https://www.mdpi.com/article/10.3390/molecules27154676/s1. Table S1: List of cancer-associated A2AAR mutations investigated in this study, Figure S1: Homologous displacement of three concentrations of [3H]ZM241385 conducted by increasing the concentrations of ZM241385 in mutant A2AARs, Figure S2: Representative graph of vehicle-normalized cell indices after stimulation with different concentrations of NECA of the mutant A2AARs in a label-free impedance-based cell-morphology assay.

Author Contributions

Conceptualization, C.F., X.W., W.J., M.G.G., G.J.P.v.W., E.H.J.D. and L.H.H.; Methodology, C.F., X.W., W.J., R.L., M.G.G. and S.D.Z.L.; Software, C.F., X.W. and W.J.; Validation, C.F., X.W., W.J. and R.L.; Formal analysis, C.F., W.J. and R.L.; Investigation, C.F., X.W., W.J., R.L. and S.D.Z.L.; Resources, C.F., X.W., W.J., R.L., M.G.G., G.J.P.v.W., E.H.J.D. and L.H.H.; Data curation, C.F., R.L. and W.J.; Writing—original draft preparation, C.F. and W.J.; Writing—review and editing, E.H.J.D. and L.H.H.; Visualization, C.F. and W.J.; Supervision, G.J.P.v.W., E.H.J.D. and L.H.H.; Project administration, G.J.P.v.W., E.H.J.D. and L.H.H.; Funding acquisition, L.H.H. and E.H.J.D. All authors have read and agreed to the published version of the manuscript.

Funding

This research study was funded by China Scholarship Council (CSC), through funding given to Chenlin Feng (funding number 201906210052), and by Oncode Institute, through funding given to Laura H. Heitman.

Institutional Review Board Statement

Not applicable.

Informed Consent Statement

Not applicable.

Data Availability Statement

The data that support the finding of this study are available on request from the corresponding author, upon reasonable request.

Acknowledgments

The results published here are in whole (or part) based on data generated by The Cancer Genome Atlas Program: https://www.cancer.gov/tcga (accessed on 27 April 2022).

Conflicts of Interest

The authors declare no conflict of interest.

Sample Availability

Not applicable.

References

  1. Fredholm, B.B.; IJzerman, A.P.; Jacobson, K.A.; Klotz, K.N.; Linden, J. International union of pharmacology. XXV. Nomenclature and classification of adenosine receptors. Pharmacol. Rev. 2001, 53, 527–552. [Google Scholar] [PubMed]
  2. Trzaskowski, B.; Latek, D.; Yuan, S.; Ghoshdastider, U.; Debinski, A.; Filipek, S. Action of molecular switches in GPCRs—Theoretical and experimental studies. Curr. Med. Chem. 2012, 19, 1090–1109. [Google Scholar] [CrossRef] [PubMed]
  3. de Lera Ruiz, M.; Lim, Y.H.; Zheng, J. Adenosine A2A receptor as a drug discovery target. J. Med. Chem. 2014, 57, 3623–3650. [Google Scholar] [CrossRef] [PubMed]
  4. Blay, J.; White, T.D.; Hoskin, D.W. The extracellular fluid of solid carcinomas contains immunosuppressive concentrations of adenosine. Cancer Res. 1997, 57, 2602–2605. [Google Scholar]
  5. Kroemer, G.; Galluzzi, L.; Kepp, O.; Zitvogel, L. Immunogenic cell death in cancer therapy. Ann. Rev. Immunol. 2013, 31, 51–72. [Google Scholar] [CrossRef] [PubMed]
  6. Cekic, C.; Linden, J. Adenosine A2A receptors intrinsically regulate CD8+ T cells in the tumor microenvironment. Cancer Res. 2014, 74, 7239–7249. [Google Scholar] [CrossRef] [Green Version]
  7. Novitskiy, S.V.; Ryzhov, S.; Zaynagetdinov, R.; Goldstein, A.E.; Huang, Y.; Tikhomirov, O.Y.; Blackburn, M.R.; Biaggioni, I.; Carbone, D.P.; Feoktistov, I. Adenosine receptors in regulation of dendritic cell differentiation and function. Blood J. Am. Soc. Hematol. 2008, 112, 1822–1831. [Google Scholar] [CrossRef]
  8. Young, A.; Ngiow, S.F.; Gao, Y.; Patch, A.-M.; Barkauskas, D.S.; Messaoudene, M.; Lin, G.; Coudert, J.D.; Stannard, K.A.; Zitvogel, L. A2AR adenosine signaling suppresses natural killer cell maturation in the tumor microenvironment. Cancer Res. 2018, 78, 1003–1016. [Google Scholar] [CrossRef] [Green Version]
  9. Ohta, A.; Gorelik, E.; Prasad, S.J.; Ronchese, F.; Lukashev, D.; Wong, M.K.; Huang, X.; Caldwell, S.; Liu, K.; Smith, P. A2A adenosine receptor protects tumors from antitumor T cells. Proc. Natl. Acad. Sci. USA 2006, 103, 13132–13137. [Google Scholar] [CrossRef] [Green Version]
  10. Beavis, P.A.; Divisekera, U.; Paget, C.; Chow, M.T.; John, L.B.; Devaud, C.; Dwyer, K.; Stagg, J.; Smyth, M.J.; Darcy, P.K. Blockade of A2A receptors potently suppresses the metastasis of CD73+ tumors. Proc. Natl. Acad. Sci. USA 2013, 110, 14711–14716. [Google Scholar] [CrossRef] [Green Version]
  11. Young, A.; Ngiow, S.F.; Barkauskas, D.S.; Sult, E.; Hay, C.; Blake, S.J.; Huang, Q.; Liu, J.; Takeda, K.; Teng, M.W. Co-inhibition of CD73 and A2AR adenosine signaling improves anti-tumor immune responses. Cancer Cell 2016, 30, 391–403. [Google Scholar] [CrossRef] [PubMed] [Green Version]
  12. Congreve, M.; Brown, G.A.; Borodovsky, A.; Lamb, M.L. Targeting adenosine A2A receptor antagonism for treatment of cancer. Expert Opin. Drug Discov. 2018, 13, 997–1003. [Google Scholar] [CrossRef] [PubMed]
  13. Jaakola, V.-P.; Griffith, M.T.; Hanson, M.A.; Cherezov, V.; Chien, E.Y.; Lane, J.R.; IJzerman, A.P.; Stevens, R.C. The 2.6 angstrom crystal structure of a human A2A adenosine receptor bound to an antagonist. Science 2008, 322, 1211–1217. [Google Scholar] [CrossRef] [PubMed] [Green Version]
  14. Lebon, G.; Warne, T.; Edwards, P.C.; Bennett, K.; Langmead, C.J.; Leslie, A.G.; Tate, C.G. Agonist-bound adenosine A 2A receptor structures reveal common features of GPCR activation. Nature 2011, 474, 521–525. [Google Scholar] [CrossRef] [Green Version]
  15. Liu, W.; Chun, E.; Thompson, A.A.; Chubukov, P.; Xu, F.; Katritch, V.; Han, G.W.; Roth, C.B.; Heitman, L.H.; IJzerman, A.P. Structural basis for allosteric regulation of GPCRs by sodium ions. Science 2012, 337, 232–236. [Google Scholar] [CrossRef] [Green Version]
  16. Zhukov, A.; Andrews, S.P.; Errey, J.C.; Robertson, N.; Tehan, B.; Mason, J.S.; Marshall, F.H.; Weir, M.; Congreve, M. Biophysical mapping of the adenosine A2A receptor. J. Med. Chem. 2011, 54, 4312–4323. [Google Scholar] [CrossRef]
  17. Kooistra, A.J.; Mordalski, S.; Pándy-Szekeres, G.; Esguerra, M.; Mamyrbekov, A.; Munk, C.; Keserű, G.M.; Gloriam, D.E. GPCRdb in 2021: Integrating GPCR sequence, structure and function. Nucleic Acids Res. 2021, 49, D335–D343. [Google Scholar] [CrossRef]
  18. Guo, D.; Pan, A.C.; Dror, R.O.; Mocking, T.; Liu, R.; Heitman, L.H.; Shaw, D.E.; IJzerman, A.P. Molecular basis of ligand dissociation from the adenosine A2A receptor. Mol. Pharmacol. 2016, 89, 485–491. [Google Scholar] [CrossRef] [Green Version]
  19. Segala, E.; Guo, D.; Cheng, R.K.; Bortolato, A.; Deflorian, F.; Dore, A.S.; Errey, J.C.; Heitman, L.H.; IJzerman, A.P.; Marshall, F.H.; et al. Controlling the dissociation of ligands from the adenosine A2A receptor through modulation of salt bridge strength. J. Med. Chem. 2016, 59, 6470–6479. [Google Scholar] [CrossRef]
  20. O’Hayre, M.; Vazquez-Prado, J.; Kufareva, I.; Stawiski, E.W.; Handel, T.M.; Seshagiri, S.; Gutkind, J.S. The emerging mutational landscape of G proteins and G-protein-coupled receptors in cancer. Nat. Rev. Cancer 2013, 13, 412–424. [Google Scholar] [CrossRef]
  21. Wu, V.; Yeerna, H.; Nohata, N.; Chiou, J.; Harismendy, O.; Raimondi, F.; Inoue, A.; Russell, R.B.; Tamayo, P.; Gutkind, J.S. Illuminating the Onco-GPCRome: Novel G protein-coupled receptor-driven oncocrine networks and targets for cancer immunotherapy. J. Biol. Chem. 2019, 294, 11062–11086. [Google Scholar] [CrossRef] [PubMed] [Green Version]
  22. Jensen, M.A.; Ferretti, V.; Grossman, R.L.; Staudt, L.M. The NCI genomic data commons as an engine for precision medicine. Blood 2017, 130, 453–459. [Google Scholar] [CrossRef] [PubMed]
  23. Bongers, B.J.; González, M.G.; Wang, X.; van Vlijmen, H.W.T.; Jespers, W.; Gutiérrez-de-Terán, H.; Ye, K.; IJzerman, A.P.; Heitman, L.H.; van Westen, G.J.P. Pan-cancer in silico analysis of somatic mutations in G-protein coupled receptors: The effect of evolutionary conservation and natural variance. bioRxiv 2010. [Google Scholar] [CrossRef]
  24. Ballesteros, J.A.; Weinstein, H. Integrated methods for the construction of three-dimensional models and computational probing of structure-function relations in G protein-coupled receptors. In Receptor Molecular Biology; Sealfon, S.C., Ed.; Methods in Neurosciences; Academic Press: Cambridge, MA, USA, 1995; Volume 25, pp. 366–428. [Google Scholar]
  25. Consortium, G.P. A global reference for human genetic variation. Nature 2015, 526, 68. [Google Scholar] [CrossRef] [Green Version]
  26. Guo, D.; Mulder-Krieger, T.; IJzerman, A.P.; Heitman, L.H. Functional efficacy of adenosine A2A receptor agonists is positively correlated to their receptor residence time. Br. J. Pharmacol. 2012, 166, 1846–1859. [Google Scholar] [CrossRef] [Green Version]
  27. Jespers, W.; Schiedel, A.C.; Heitman, L.H.; Cooke, R.M.; Kleene, L.; van Westen, G.J.; Gloriam, D.E.; Müller, C.E.; Sotelo, E.; Gutiérrez-de-Terán, H. Structural mapping of adenosine receptor mutations: Ligand binding and signaling mechanisms. Trends Pharmacol. Sci. 2018, 39, 75–89. [Google Scholar] [CrossRef] [Green Version]
  28. Kim, J.; Wess, J.; van Rhee, A.M.; Schöneberg, T.; Jacobson, K.A. Site-directed mutagenesis identifies residues involved in ligand recognition in the human A2a adenosine receptor. J. Biol. Chem. 1995, 270, 13987–13997. [Google Scholar] [CrossRef] [Green Version]
  29. Jiang, Q.; Lee, B.X.; Glashofer, M.; van Rhee, A.M.; Jacobson, K.A. Mutagenesis reveals structure—Activity parallels between human A2A adenosine receptors and biogenic amine G protein-coupled receptors. J. Med. Chem. 1997, 40, 2588–2595. [Google Scholar] [CrossRef] [Green Version]
  30. Stoy, H.; Gurevich, V.V. How genetic errors in GPCRs affect their function: Possible therapeutic strategies. Genes Dis. 2015, 2, 108–132. [Google Scholar] [CrossRef] [Green Version]
  31. Grossman, R.L.; Heath, A.P.; Ferretti, V.; Varmus, H.E.; Lowy, D.R.; Kibbe, W.A.; Staudt, L.M. Toward a shared vision for cancer genomic data. N. Engl. J. Med. 2016, 375, 1109–1112. [Google Scholar] [CrossRef]
  32. Jakubík, J.; Randáková, A.; Rudajev, V.; Zimčík, P.; El-Fakahany, E.E.; Doležal, V. Applications and limitations of fitting of the operational model to determine relative efficacies of agonists. Sci. Rep. 2019, 9, 4637. [Google Scholar] [CrossRef] [PubMed] [Green Version]
  33. Bennett, K.A.; Tehan, B.; Lebon, G.; Tate, C.G.; Weir, M.; Marshall, F.H.; Langmead, C.J. Pharmacology and structure of isolated conformations of the adenosine A2A receptor define ligand efficacy. Mol. Pharmacol. 2013, 83, 949–958. [Google Scholar] [CrossRef] [PubMed] [Green Version]
  34. Ibrisimovic, E.; Drobny, H.; Yang, Q.; Höfer, T.; Boehm, S.; Nanoff, C.; Schicker, K. Constitutive activity of the A2A adenosine receptor and compartmentalised cyclic AMP signalling fine-tune noradrenaline release. Purinergic Signal. 2012, 8, 677–692. [Google Scholar] [CrossRef] [PubMed] [Green Version]
  35. Jespers, W.; Heitman, L.H.; IJzerman, A.P.; Sotelo, E.; van Westen, G.J.; Åqvist, J.; Gutiérrez-de-Terán, H. Deciphering conformational selectivity in the A2A adenosine G protein-coupled receptor by free energy simulations. PLoS Comput. Biol. 2021, 17, e1009152. [Google Scholar] [CrossRef] [PubMed]
  36. Gao, Z.-G.; Jiang, Q.; Jacobson, K.A.; IJzerman, A.P. Site-directed mutagenesis studies of human A2A adenosine receptors: Involvement of glu13 and his278 in ligand binding and sodium modulation. Biochem. Pharmacol. 2000, 60, 661–668. [Google Scholar] [CrossRef]
  37. Gutiérrez-de-Terán, H.; Massink, A.; Rodríguez, D.; Liu, W.; Han, G.W.; Joseph, J.S.; Katritch, I.; Heitman, L.H.; Xia, L.; Ijzerman, A.P.; et al. The role of a sodium ion binding site in the allosteric modulation of the A(2A) adenosine G protein-coupled receptor. Structure 2013, 21, 2175–2185. [Google Scholar] [CrossRef] [Green Version]
  38. Jiang, Q.; Van Rhee, A.M.; Kim, J.; Yehle, S.; Wess, J.; Jacobson, K.A. Hydrophilic side chains in the third and seventh transmembrane helical domains of human A2A adenosine receptors are required for ligand recognition. Mol. Pharmacol. 1996, 50, 512–521. [Google Scholar]
  39. Nygaard, R.; Frimurer, T.M.; Holst, B.; Rosenkilde, M.M.; Schwartz, T.W. Ligand binding and micro-switches in 7TM receptor structures. Trends Pharmacol. Sci. 2009, 30, 249–259. [Google Scholar] [CrossRef]
  40. Massink, A.; Gutiérrez-de-Terán, H.; Lenselink, E.B.; Zacarías, N.V.O.; Xia, L.; Heitman, L.H.; Katritch, V.; Stevens, R.C.; IJzerman, A.P. Sodium ion binding pocket mutations and adenosine A2A receptor function. Mol. Pharmacol. 2015, 87, 305–313. [Google Scholar] [CrossRef] [Green Version]
  41. Dawson, E.S.; Wells, J.N. Determination of amino acid residues that are accessible from the ligand binding crevice in the seventh transmembrane-spanning region of the human A1 adenosine receptor. Mol. Pharmacol. 2001, 59, 1187–1195. [Google Scholar] [CrossRef] [Green Version]
  42. Jaakola, V.P.; Lane, J.R.; Lin, J.Y.; Katritch, V.; IJzerman, A.P.; Stevens, R.C. Ligand binding and subtype selectivity of the human A(2A) adenosine receptor: Identification and characterization of essential amino acid residues. J. Biol. Chem. 2010, 285, 13032–13044. [Google Scholar] [CrossRef] [PubMed] [Green Version]
  43. Wang, J.; Hua, T.; Liu, Z.-J. Structural features of activated GPCR signaling complexes. Curr. Opin. Struct. Biol. 2020, 63, 82–89. [Google Scholar] [CrossRef] [PubMed]
  44. Black, J.W.; Leff, P.; Shankley, N.P.; Wood, J. An operational model of pharmacological agonism: The effect of E/[A] curve shape on agonist dissociation constant estimation. Br. J. Pharmacol. 1985, 84, 561–571. [Google Scholar] [CrossRef] [PubMed] [Green Version]
  45. Peach, C.J.; Mignone, V.W.; Arruda, M.A.; Alcobia, D.C.; Hill, S.J.; Kilpatrick, L.E.; Woolard, J. Molecular pharmacology of VEGF-A isoforms: Binding and signalling at VEGFR2. Int. J. Mol. Sci. 2018, 19, 1264. [Google Scholar] [CrossRef] [Green Version]
  46. Galandrin, S.; Bouvier, M. Distinct signaling profiles of β1 and β2 adrenergic receptor ligands toward adenylyl cyclase and mitogen-activated protein kinase reveals the pluridimensionality of efficacy. Mol. Pharmacol. 2006, 70, 1575–1584. [Google Scholar] [CrossRef] [Green Version]
  47. Mediavilla-Varela, M.; Luddy, K.; Noyes, D.; Khalil, F.K.; Neuger, A.M.; Soliman, H.; Antonia, S.J. Antagonism of adenosine A2A receptor expressed by lung adenocarcinoma tumor cells and cancer associated fibroblasts inhibits their growth. Cancer Biol. Ther. 2013, 14, 860–868. [Google Scholar] [CrossRef] [Green Version]
  48. Gessi, S.; Bencivenni, S.; Battistello, E.; Vincenzi, F.; Colotta, V.; Catarzi, D.; Varano, F.; Merighi, S.; Borea, P.A.; Varani, K. Inhibition of A2A adenosine receptor signaling in cancer cells proliferation by the novel antagonist TP455. Front. Pharmacol. 2017, 8, 888. [Google Scholar] [CrossRef] [Green Version]
  49. Sambrook, J. Molecular Cloning: A Laboratory Manual, 2nd ed.; Cold Spring Harbor Laboratory Press: Cold Spring Harbor, NY, USA, 1989. [Google Scholar]
  50. Smith, P.K.; Krohn, R.I.; Hermanson, G.T.; Mallia, A.K.; Gartner, F.H.; Provenzano, M.D.; Fujimoto, E.K.; Goeke, N.M.; Olson, B.J.; Klenk, D.C. Measurement of protein using bicinchoninic acid. Anal. Biochem. 1985, 150, 76–85. [Google Scholar] [CrossRef]
  51. Yu, N.; Atienza, J.M.; Bernard, J.; Blanc, S.; Zhu, J.; Wang, X.; Xu, X.; Abassi, Y.A. Real-time monitoring of morphological changes in living cells by electronic cell sensor arrays: An approach to study G protein-coupled receptors. Anal. Chem. 2006, 78, 35–43. [Google Scholar] [CrossRef]
  52. Yung-Chi, C.; Prusoff, W.H. Relationship between the inhibition constant (KI) and the concentration of inhibitor which causes 50 per cent inhibition (I50) of an enzymatic reaction. Biochem. Pharmacol. 1973, 22, 3099–3108. [Google Scholar] [CrossRef]
  53. Black, J.W.; Leff, P. Operational models of pharmacological agonism. Proc. R. Soc. Lond. Ser. B Biol. Sci. 1983, 220, 141–162. [Google Scholar] [CrossRef]
  54. Carpenter, B.; Nehmé, R.; Warne, T.; Leslie, A.G.W.; Tate, C.G. Structure of the adenosine A2A receptor bound to an engineered G protein. Nature 2016, 536, 104–107. [Google Scholar] [CrossRef] [PubMed]
Figure 1. Snake plot showing the primary structure of wild-type human A2AAR. Blue: the most conserved *. 50 residues at each helix (Ballesteros–Weinstein numbering system). Red: residues with cancer-associated mutations in the upper part of the receptor (P7.50 is labeled in blue, where mutation P285L7.50 was identified). Magenta: residues with cancer-associated mutations in the lower part of the receptor. This figure was derived from GPCRdb.org [17].
Molecules 27 04676 g001
Figure 2. Radioligand binding and expression of wild-type and mutant A2AARs. (A) Radioligand binding of 2.5 nM [3H]ZM241385 with 10 µg of membrane protein of HEK293T cells transiently transfected with wild-type or mutant A2AAR. Specific binding was defined as the difference between total binding (TB) and non-specific binding (NSB). NSB was determined with 100 μM NECA as displacer. Data are shown as mean ± SD of two independent experiments performed in duplicate. (B) Expression levels of transiently transfected WT and mutant A2AARs on HEK293T-cell membrane, measured with an enzyme-linked immunosorbent assay. Mock values were measured with HEK293T cells transfected with a pcDNA3.1 empty vector as negative control. Data are shown as mean ± SD of two independent experiments performed in quintuplicate. (*** p < 0.001; ordinary one-way ANOVAs with Dunnett’s multiple comparisons tests; mock as control).
Molecules 27 04676 g002
Figure 3. Homologous displacement of three concentrations of [3H]ZM241385 performed by increasing the concentrations of ZM241385 in WT-A2AAR (A), A165V-A2AAR (B), A265V-A2AAR (C), and A15S-A2AAR (D). Note that different concentrations of membranes were used depending on receptor expression levels, i.e., WT-A2AAR (1 μg), A165V-A2AAR (3 μg), A265V-A2AAR (1.5 μg), and A15S-A2AAR (3 μg). Three independent experiments were performed in duplicate, and representative curves from one experiment are shown above. Compared with WT-A2AAR, A165V and A265V displayed different affinity for ZM241385, and A15S displayed similar affinity but different Bmax. Graphs for other mutants can be found in Figure S1.
Molecules 27 04676 g003
Figure 4. Displacement of [3H]ZM241385 performed by increasing the concentrations of NECA in wild-type and mutant A2AARs. Compared with wild-type A2AAR, three mutants displayed lower affinity for NECA (A), V275A-A2AAR displayed higher affinity for NECA (B), three mutants displayed slightly different affinity for NECA (C), and four mutants displayed similar affinity for NECA (D). Data are shown as mean ± SEM of three independent experiments, each performed in duplicate.
Molecules 27 04676 g004
Figure 5. Functional characterization of wild-type and mutant A2AARs via NECA stimulation of transiently transfected HEK293T cells, using a label-free impedance-based cell-morphology assay. (A) Expression levels of transiently transfected WT and mutant A2AARs on HEK293T cells, measured with an enzyme-linked immunosorbent assay. Data are shown as mean ± SD of two independent experiments performed in quintuplicate. (B) Representative graph of vehicle-normalized cell index after stimulation with different concentrations of NECA of the wild-type A2AAR. Graphs of mutant A2AARs are shown in Figure S2. (C,D) Concentration–response curves of NECA for wild-type and mutant A2AARs derived from the area under the curve within 60 min after ligand addition. The response to vehicle was normalized to 0%, and the response to 1 μM NECA of the wild-type receptor was set to 100%. Data are shown as mean ± SEM of three independent experiments, each performed in duplicate.
Molecules 27 04676 g005
Figure 6. Functional characterization of wild-type and mutant A2AARs with inverse agonist ZM241385 in transiently transfected HEK293T cells, using a label-free impedance-based cell-morphology assay. (A) Representative time trace of the normalized cell index of WT-A2AAR-expressing HEK293T cells stimulated with 1 μM ZM241385. (B) Area under the curve within 60 min after ZM241385 treatment was used to quantify its inverse agonism for A2AARs. Data are shown as mean ± SEM of three independent experiments performed in duplicate. Significant difference from the WT-A2AAR is shown as * p < 0.05; ordinary one-way ANOVAs with Dunnett’s multiple comparisons tests. (C) Representative graph of normalized cell index of different concentrations of ZM241385 with respect to NECA-stimulated wild-type A2AAR. Vehicle was used for baseline correction. (D) Concentration–response curves of ZM241385 for wild-type and mutant A2AARs derived from the area under the curve within 60 min after NECA addition. Response to vehicle was normalized to 0%, and response to EC80 of NECA after pretreatment with vehicle was normalized to 100%. Data are shown as mean ± SEM of three independent experiments, each performed in duplicate.
Molecules 27 04676 g006
Figure 7. (A) Overview of all mutations investigated in this work, mapped on the inactive structure of the receptor (blue); antagonist ZM241385 is shown in orange. (B) Residue H278 was involved in agonist binding (NECA; orange), forming hydrogen bonds (dashed lines) with the ribose moiety. (C) P285 underwent extensive conformational rearrangement in the active-like structure (light orange). The active structure (orange) was closer to the inactive structure. (D) Residue S132 did not undergo extensive rearrangement when comparing inactive, active-like, and active structures.
Molecules 27 04676 g007
Table 1. Affinity values of ligands for wild-type (WT) and mutant A2AARs and their expression levels (Bmax).
MutantZM241385
pKD a (KD (nM))
NECA
pKi b (Ki (nM))
Bmax a
(pmol/mg)
WT9.0 ± 0.1 (0.98)6.9 ± 0.0 (134)37 ± 5
A15S1.418.9 ± 0.1 (1.5)6.6 ± 0.1 ** (277)12 ± 2 ****
F70LECL18.8 ± 0.1 (1.7)6.2 ± 0.1 **** (595)8 ± 1 ****
I92M3.408.9 ± 0.1 (1.3)6.2 ± 0.1 **** (606)9 ± 1 ****
L95F3.439.1 ± 0.0 (0.83)6.9 ± 0.1 (144)10 ± 1 ****
A165VECL28.7 ± 0.1 ** (2.2)6.7 ± 0.0 (210)17 ± 1 ***
I251T6.538.8 ± 0.1 (1.9)6.9 ± 0.1 (134)14 ± 1 ***
F257L6.598.8 ± 0.0 (1.8)6.8 ± 0.0 (151)27 ± 1
A265SECL38.9 ± 0.0 (1.3)6.6 ± 0.1 * (246)27 ± 6
A265VECL38.5 ± 0.1 *** (3.1)6.2 ± 0.0 **** (632)39 ± 1
A265TECL38.9 ± 0.0 (1.2)6.6 ± 0.0 ** (266)37 ± 6
V275A7.408.9 ± 0.1 (1.4)7.4 ± 0.0 **** (42)20 ± 2 **
a pKD and Bmax were determined with a homologous displacement assay, where three concentrations of [3H]ZM241385 were displaced by increasing the concentrations of ZM241385. b pKi values were determined with a heterologous displacement assay, where [3H]ZM241385 was displaced by increasing the concentrations of NECA. Values for S132L4.53, H278N7.43, S281L7.46, and P285L7.50 were not determined because little binding of [3H]ZM241385 was observed. Data are represented as mean ± SEM of three independent experiments performed in duplicate. (Significant difference from the wild type is shown as * p < 0.05, ** p < 0.01, *** p < 0.001, **** p < 0.0001; ordinary one-way ANOVAs with Dunnett’s multiple comparisons tests.)
Table 2. Potency and efficacy of NECA stimulation of the wild-type (WT) and mutant A2AARs derived from cell-morphology-assay results.
MutantPotency
pEC50 a
Efficacy Emax%
(AUC-1 μM) a
Relative Efficacy
τ b
WT8.4 ± 0.2100 ± 5 (5.7)37 ± 13
F70LECL17.6 ± 0.2164 ± 19 (8.9)28 ± 11
I92M3.407.2 ± 0.2 **119 ± 4 (5.8)10 ± 3
A265VECL37.4 ± 0.2 *135 ± 2 (7.2)21 ± 8
V275A7.407.1 ± 0.1 **106 ± 19 (5.1)1 ± 0 *
S132L4.537.3 ± 0.0 *248 ± 30 *** (12.6)n.a.
H278N7.437.3 ± 0.2 **223 ± 33 ** (10.8)n.a.
S281L7.467.7 ± 0.3146 ± 25 (7.7)n.a.
P285L7.507.4 ± 0.5 *101 ± 8 (5.2)n.a.
a Log potency (pEC50) and efficacy (Emax%) of NECA were calculated from concentration–response curves derived from the area under the curve of CI changes within 60 min after stimulation. The AUC of CI changes within 60 min after 1 μM NECA addition is shown in brackets. b Relative efficacy was analyzed with the operational model by Black and Leff (1983) using global fitting. n.a. = not applicable; relative efficacy could not be determined as no affinity was obtained for NECA in these mutants. Data are represented as mean ± SEM of three independent experiments performed in duplicate. (Significant difference from the wild type is shown as * p < 0.05, ** p < 0.01, *** p < 0.001; ordinary one-way ANOVAs with Dunnett’s multiple comparisons tests.)
Table 3. Quantification of the inverse agonism of ZM241385 on A2AARs and the inhibitory potency of ZM241385 on NECA stimulation.
MutantInverse Agonism of Inhibition
ZM241385-1 μM apIC50 b
WT−3.0 ± 0.86.4 ± 0.3
F70LECL1−2.0 ± 0.56.7 ± 0.2
I92M3.40−1.8 ± 0.56.9 ± 0.1
A265VECL3−2.3 ± 0.06.3 ± 0.2
V275A7.40−3.6 ± 0.6n.d.
S132L4.53−0.4 ± 0.2 **7.3 ± 0.1 **
H278N7.43−0.3 ± 0.3 **7.4 ± 0.1 **
S281L7.46−0.7 ± 0.2 *6.6 ± 0.1
P285L7.50−2.4 ± 0.8n.d.
a In the whole-cell-based cell-morphology assay, inverse agonism was calculated from the AUC of CI changes within 60 min after ZM241385 addition. b Cells were pretreated with increasing concentrations of ZM241385 before stimulating with EC80 of NECA. The inhibitory potency of ZM241385 (pIC50) was calculated from concentration–response curves derived from the area under the curve of CI changes within 60 min after NECA addition. n.d. = not determined, as no sigmoidal inhibition curve could be observed for the mutants. Data are represented as mean ± SEM of three independent experiments performed in duplicate. (Significant difference from the wild type is shown as * p < 0.05, ** p < 0.01; ordinary one-way ANOVAs with Dunnett’s multiple comparisons tests.)
Publisher’s Note: MDPI stays neutral with regard to jurisdictional claims in published maps and institutional affiliations.

