
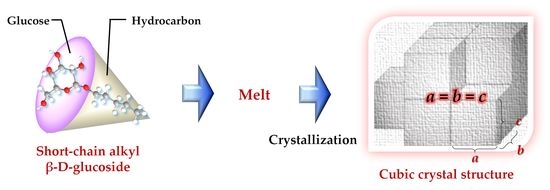
Short-Chain Mono-Alkyl β-D-Glucoside Crystals—Do They Form a Cubic Crystal Structure?


Abstract
1. Introduction
2. Results
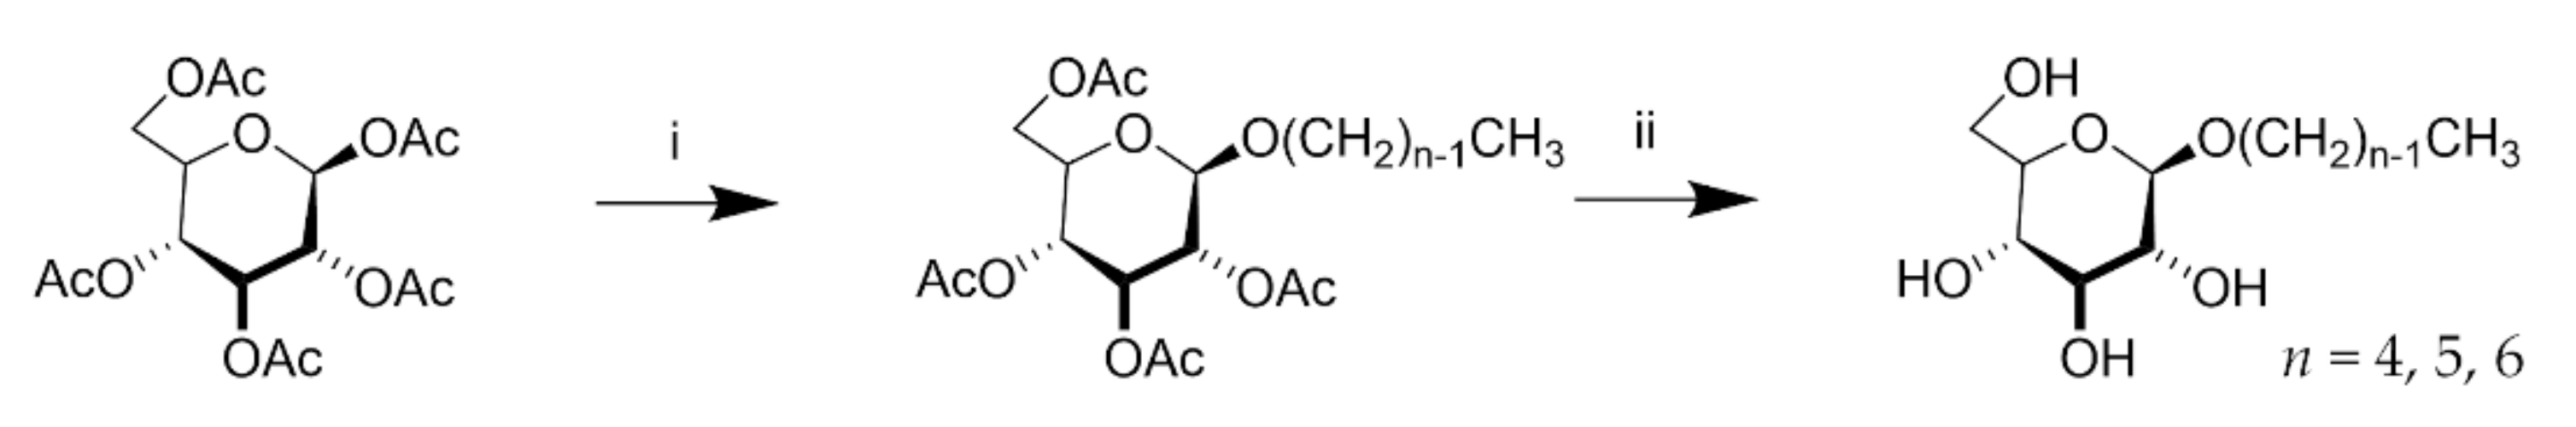
2.1. Sample Preparation
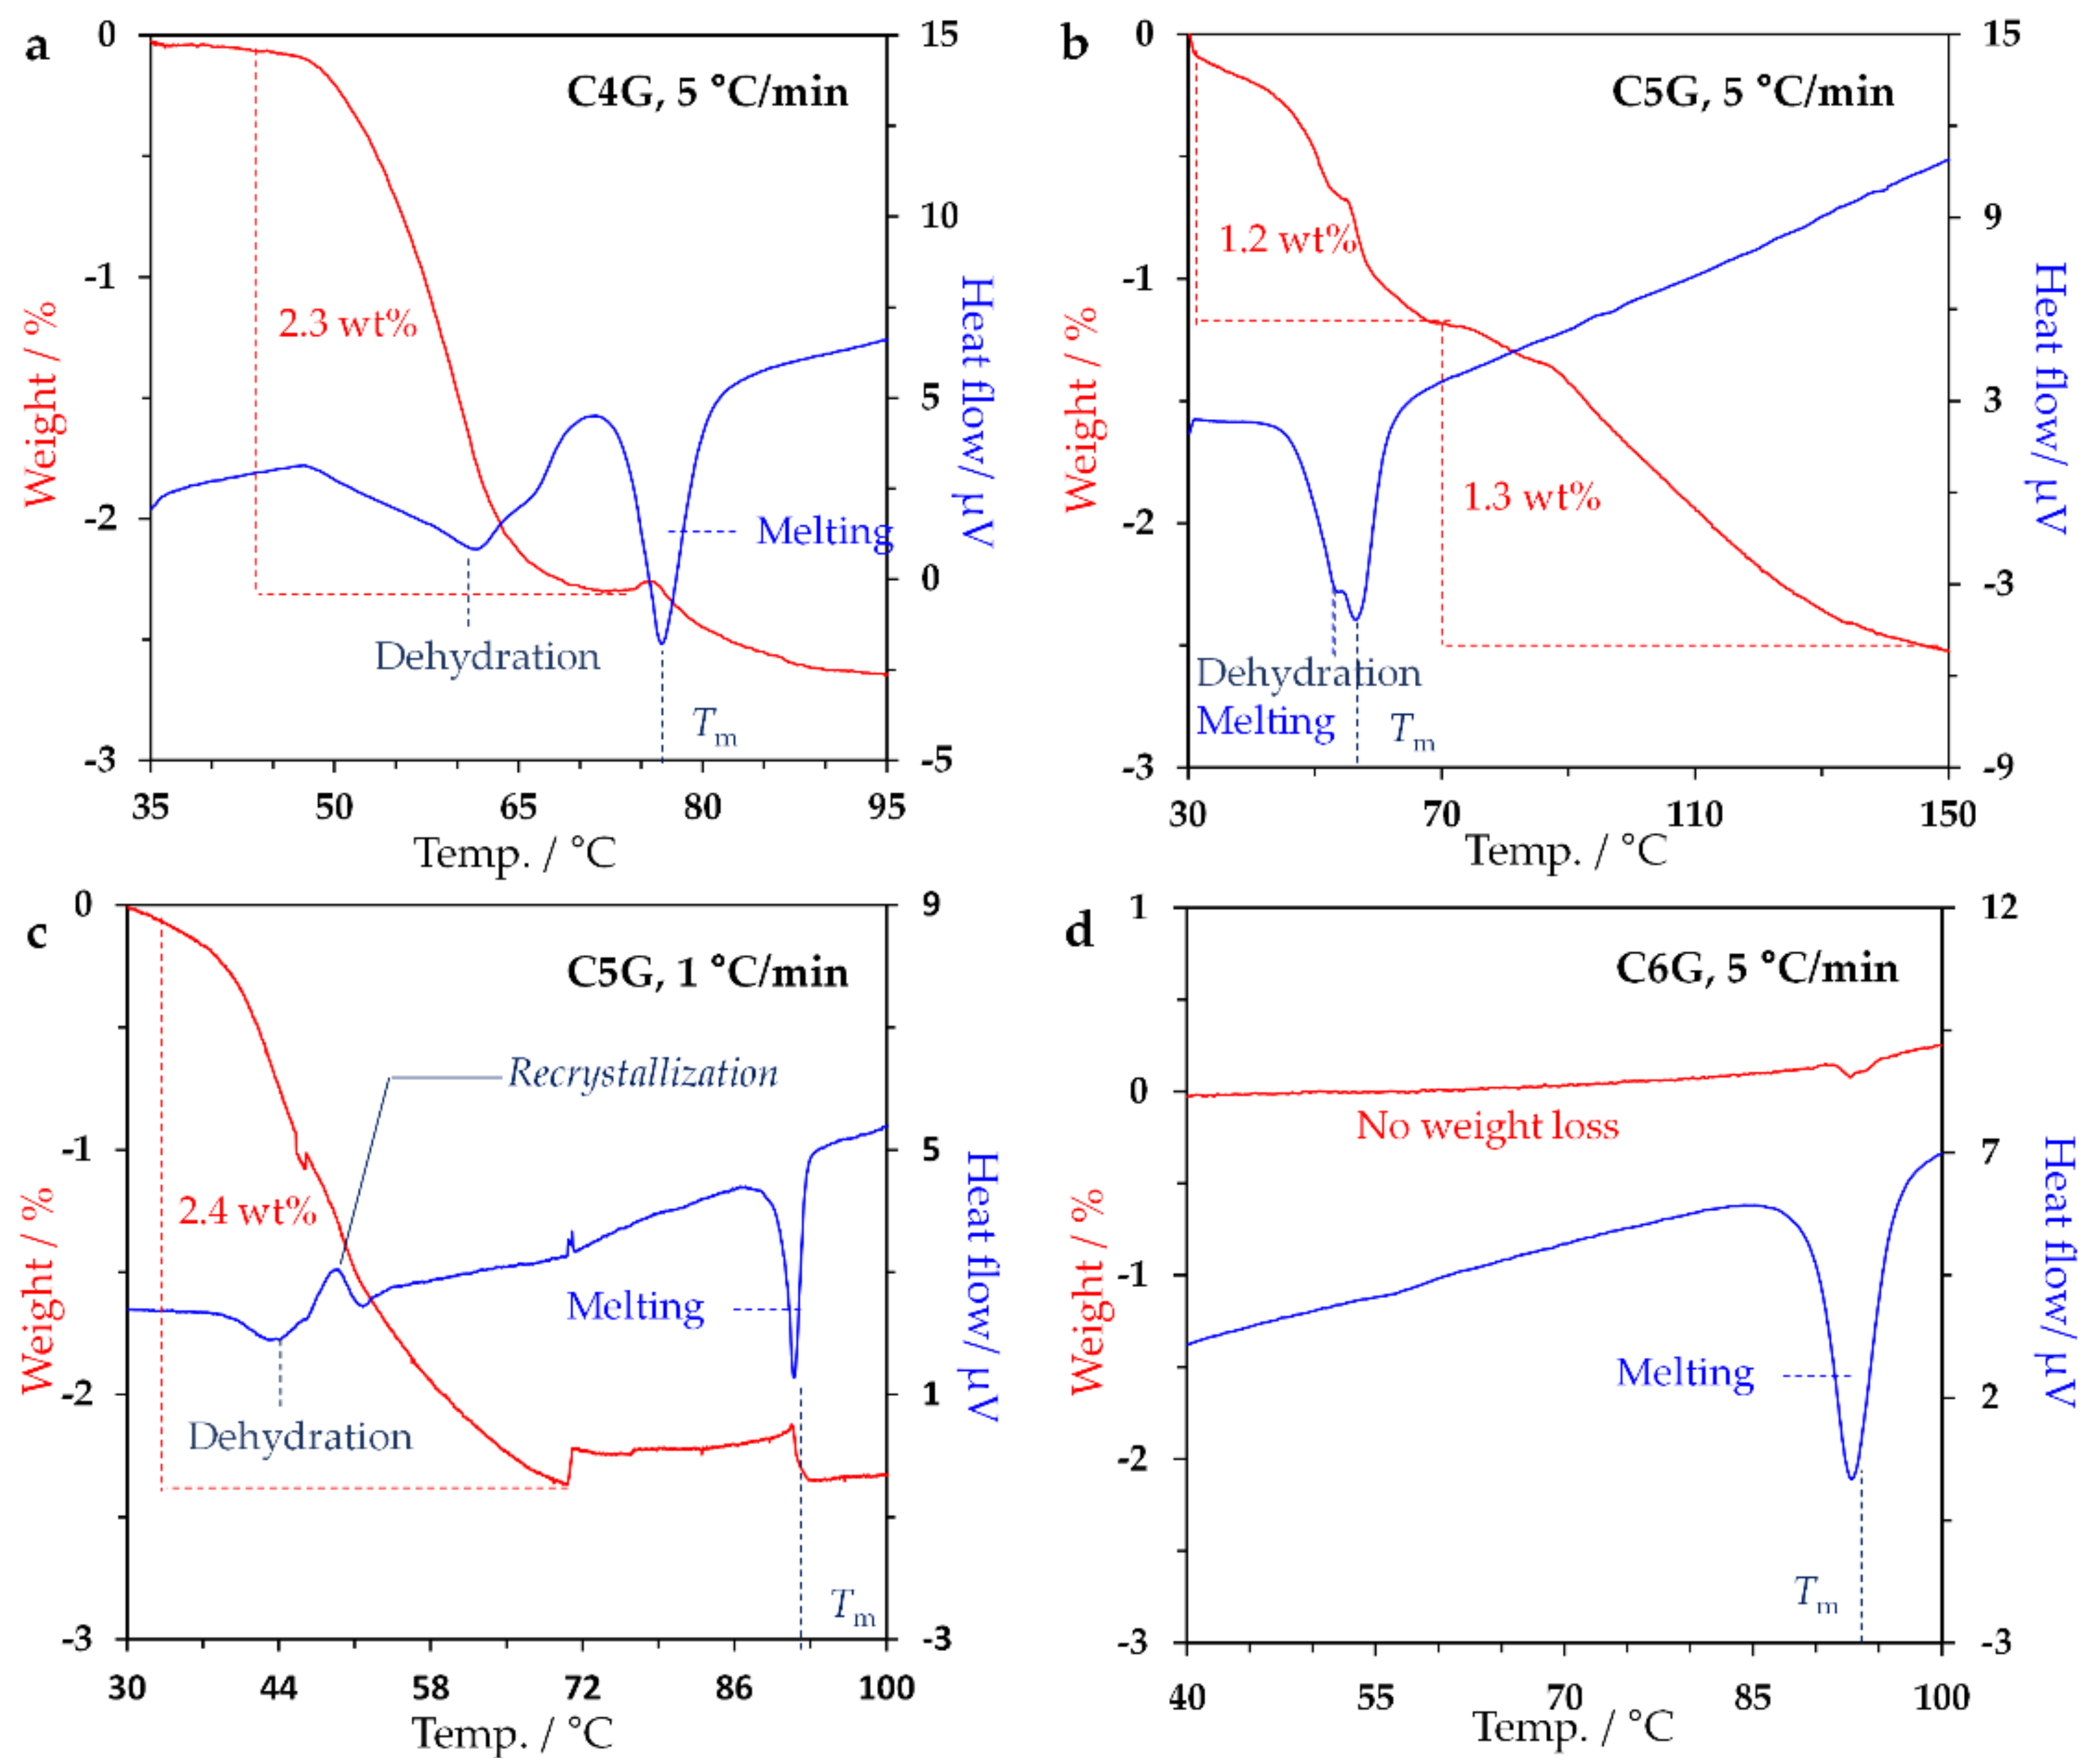
2.2. Study on Hydrate State
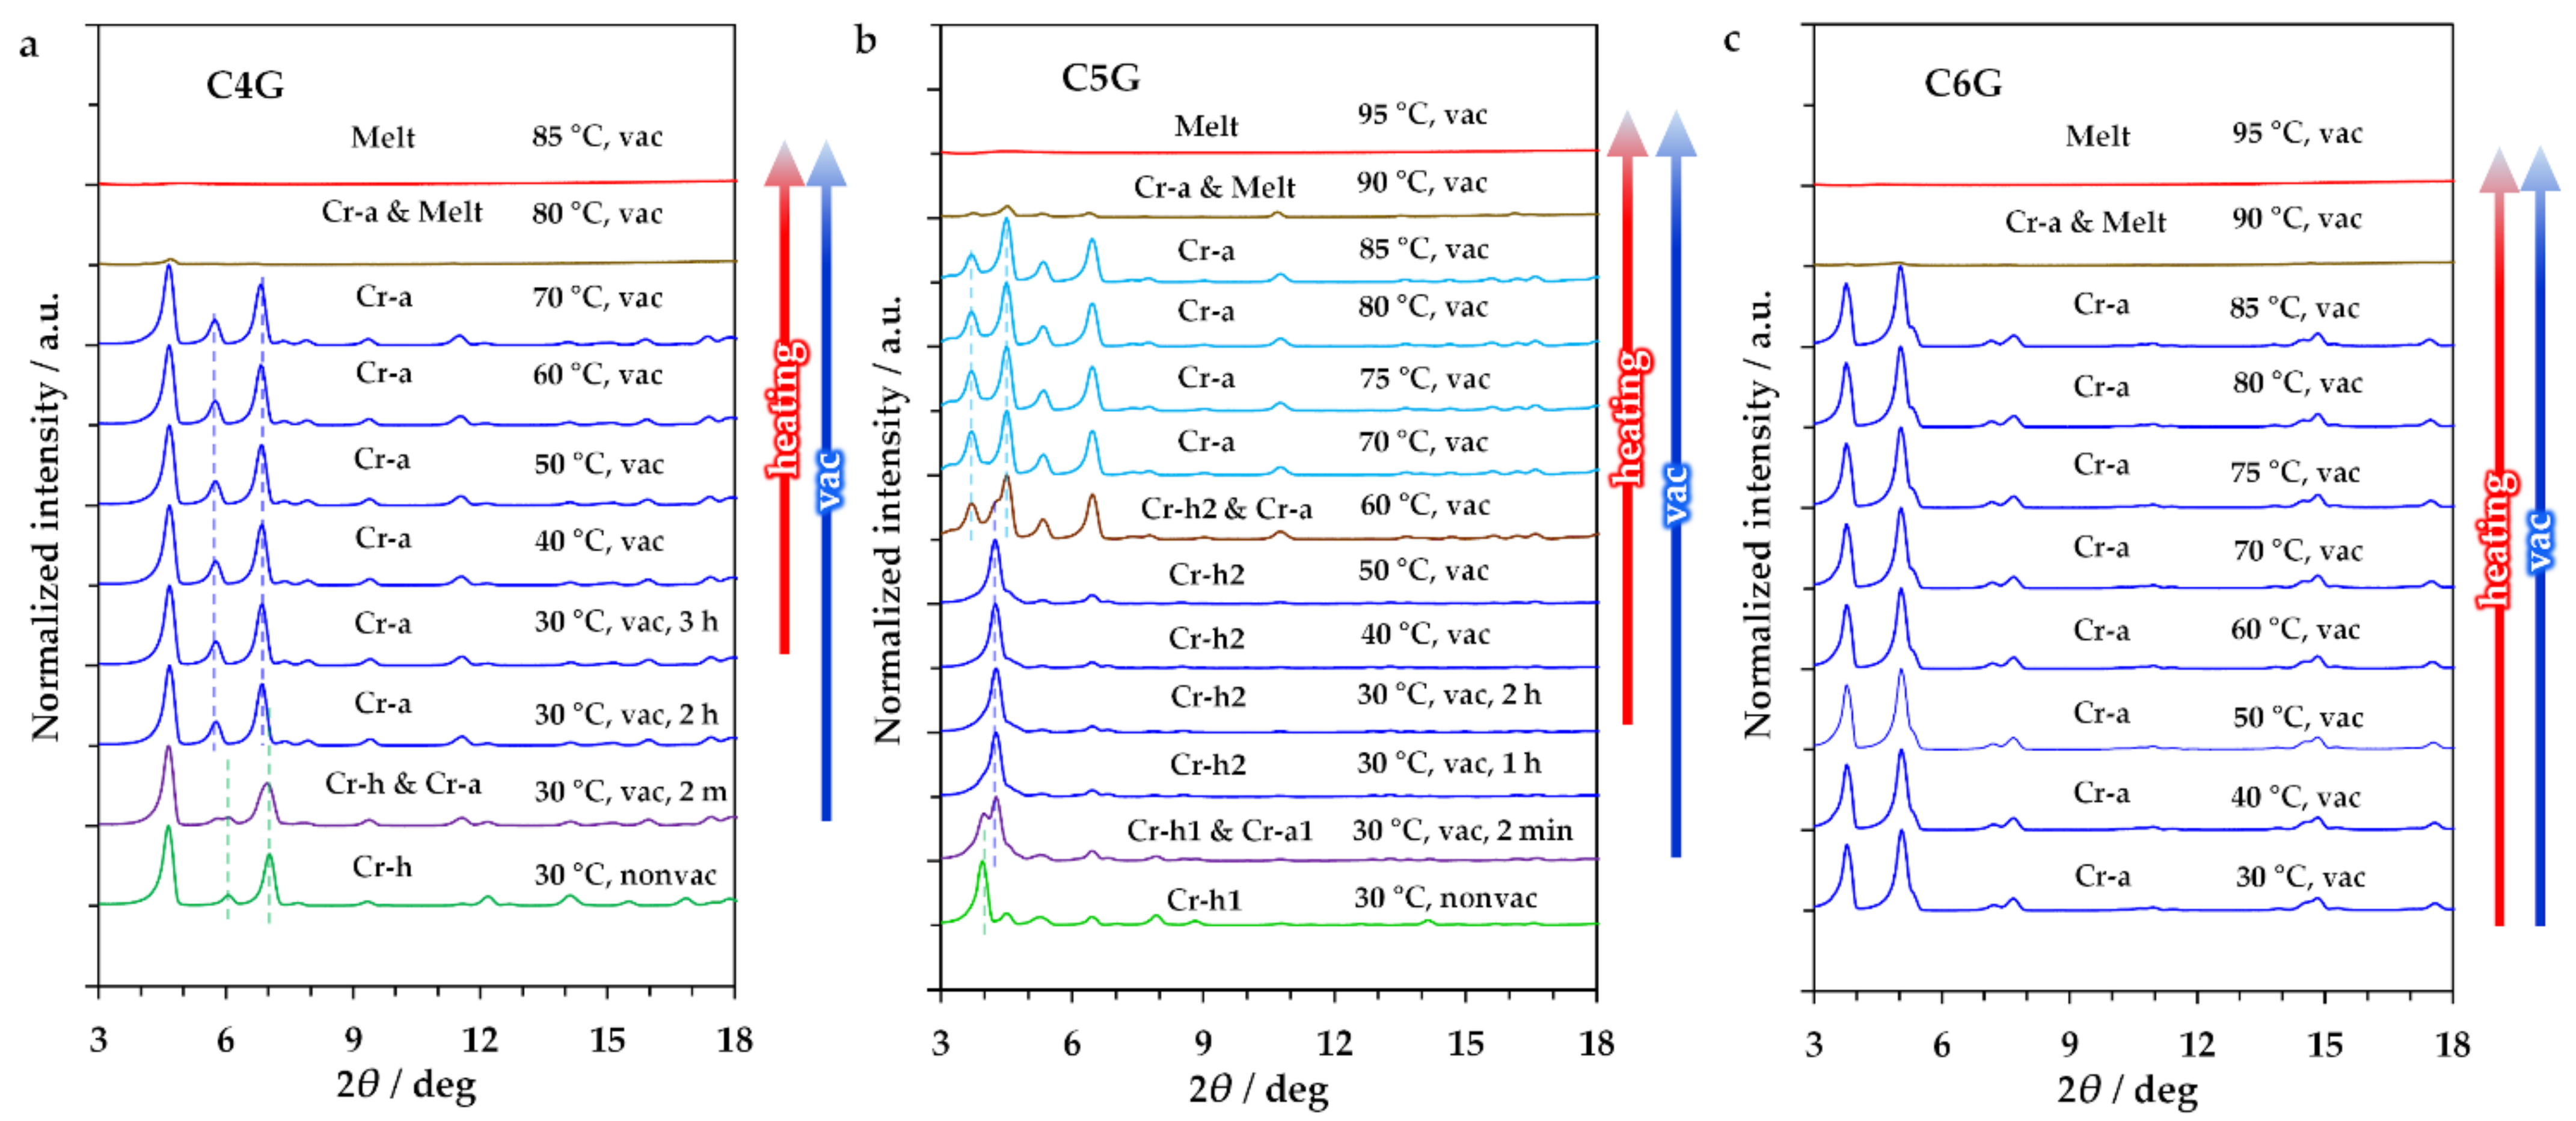
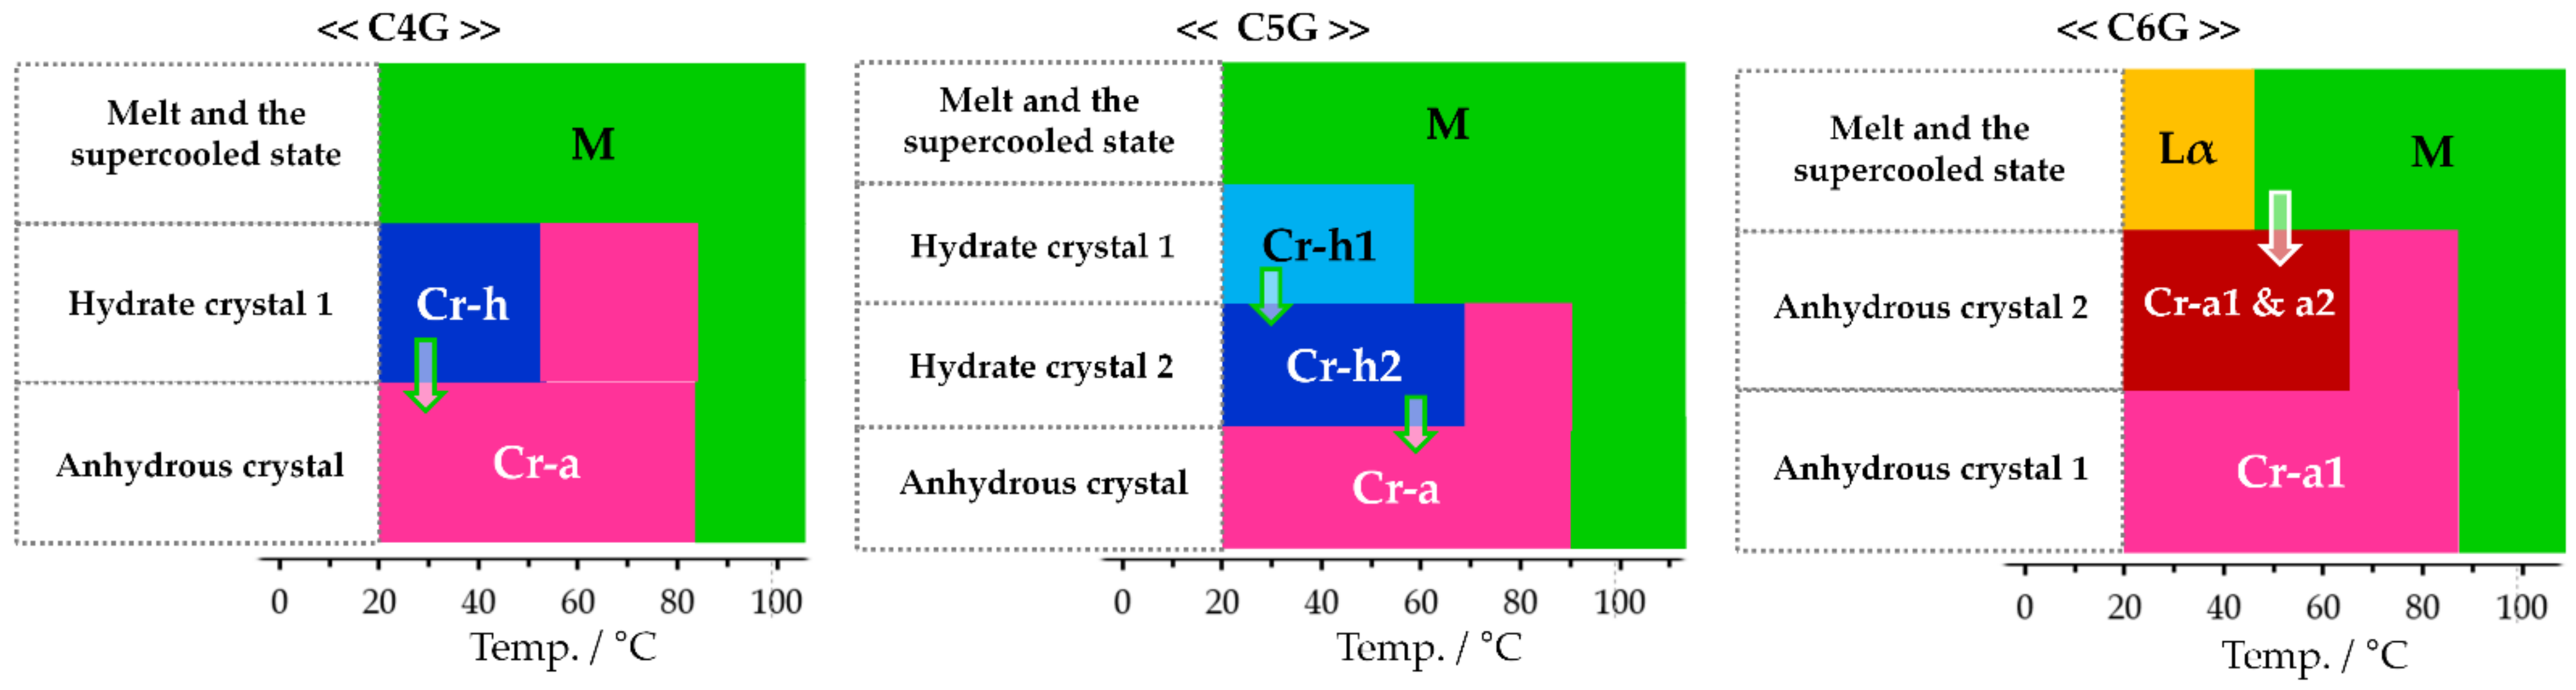
2.3. Investigation on Phase Transition Behaviour
3. Discussion
4. Materials and Methods
4.1. Sample Preparation and Characterisation
4.2. Simultaneously DTA–TG Measurements
4.3. X-ray Diffraction Measurements
5. Conclusions
Supplementary Materials
Author Contributions
Funding
Data Availability Statement
Acknowledgments
Conflicts of Interest
Sample Availability
References
- Tiddy, G.J. Surfactant-water liquid crystal phases. Phys. Rep. 1980, 57, 1–46. [Google Scholar] [CrossRef]
- Seddon, J.M.; Templer, R.H. Chapter 3—Polymorphism of Lipid-Water Systems. In Handbook of Biological Physics; Lipowsky, R., Sackmann, E., Eds.; Elsevier B.V.: Amsterdam, The Netherlands, 1995; Volume 1, pp. 97–160. [Google Scholar]
- Hyde, S. Chapter 16 Identification of lyotropic liquid crystalline mesophases. In Handbook of Applied Surface and Colloid Chemistry; Holmberg, K., Ed.; John Wiley & Sons, Ltd.: New York, NY, USA, 2001; pp. 299–332. [Google Scholar]
- Latypova, L.; Góźdź, W.; Pieranski, P. Symmetry, topology and faceting in bicontinuous lyotropic crystals. Eur. Phys. J. E 2013, 36, 88. [Google Scholar] [CrossRef]
- Fontell, K. Cubic phases in surfactant and surfactant-like lipid systems. Colloid Polym. Sci. 1990, 268, 264–285. [Google Scholar] [CrossRef]
- Takahashi, H.; Hatta, I.; Quinn, P.J. Cubic phases in hydrated 1: 1 and 1: 2 dipalmitoylphosphatidylcholine-dipalmitoylglycerol mixtures. Biophys. J. 1996, 70, 1407–1411. [Google Scholar] [CrossRef]
- Manni, L.S.; Fong, W.K.; Mezzenga, R. Lipid-based mesophases as matrices for nanoscale reactions. Nanoscale Horiz. 2020, 5, 914–927. [Google Scholar] [CrossRef] [PubMed]
- Huang, Y.; Gui, S. Factors affecting the structure of lyotropic liquid crystals and the correlation between structure and drug diffusion. RSC Adv. 2018, 8, 6978–6987. [Google Scholar] [CrossRef] [PubMed]
- Seddon, J.M.; Robins, J.; Gulik-Krzywicki, T.; Delacroix, H. Inverse micellar phases of phospholipids and glycolipids. Invited Lecture. Phys. Chem. Chem. Phys. 2000, 2, 4485–4493. [Google Scholar] [CrossRef]
- Goodby, J.W.; Görtz, V.; Cowling, S.J.; Mackenzie, G.; Martin, P.; Plusquellec, D.; Benvegnu, T.; Boullanger, P.; Lafont, D.; Queneau, Y.; et al. Thermotropic liquid crystalline glycolipids. Chem. Soc. Rev. 2007, 36, 1971–2032. [Google Scholar] [CrossRef]
- Vill, V.; Hashim, R. Carbohydrate liquid crystals: Structure–property relationship of thermotropic and lyotropic glycolipids. Curr. Opin. Colloid Interface Sci. 2002, 7, 395–409. [Google Scholar] [CrossRef]
- Hashim, R.; Zahid, N.I.; Aripin, N.F.K.; Ogawa, S.; Sugimura, A. Dry thermotropic glycolipid self-assembly: A review. J. Oleo Sci. 2018, 67, 651–668. [Google Scholar] [CrossRef]
- Andersson, S.T.E.N.; Jacob, M.; Lidin, S.; Larsson, K. Structure of the cubosome–a closed lipid bilayer aggregate. Z. Krist. Cryst. Mater. 1995, 210, 315–318. [Google Scholar] [CrossRef]
- Zhai, J.; Fong, C.; Tran, N.; Drummond, C.J. Non-lamellar lyotropic liquid crystalline lipid nanoparticles for the next generation of nanomedicine. ACS Nano 2019, 13, 6178–6206. [Google Scholar] [CrossRef] [PubMed]
- Yaghmur, A.; Glatter, O. Characterization and potential applications of nanostructured aqueous dispersions. Adv. Colloid Interface Sci. 2009, 147, 333–342. [Google Scholar] [CrossRef] [PubMed]
- Mertins, O.; Mathews, P.D.; Angelova, A. Advances in the design of ph-sensitive cubosome liquid crystalline nanocarriers for drug delivery applications. Nanomaterials 2020, 10, 963. [Google Scholar] [CrossRef]
- Feng, Y.; Yu, Z.W.; Quinn, P.J. Stable cubic phases in codispersions of glucocerebroside and palmitoyloleoylphosphatidylethanolamine. Chem. Phys. Lipids 2003, 126, 141–148. [Google Scholar] [CrossRef]
- Salim, M.; Zahid, N.I.; Liew, C.Y.; Hashim, R. Cubosome particles of a novel Guerbet branched chain glycolipid. Liq. Cryst. 2016, 43, 168–174. [Google Scholar] [CrossRef]
- Johnsson, M.; Barauskas, J.; Norlin, A.; Tiberg, F. Physicochemical and drug delivery aspects of lipid-based liquid crystalline nanoparticles: A case study of intravenously administered propofol. J. Nanosci. Nanotechnol. 2006, 6, 3017–3024. [Google Scholar] [CrossRef]
- Pascher, I.; Sundell, S. Molecular arrangements in sphingolipids. The crystal structure of cerebroside. Chem. Phys. Lipids 1977, 20, 175–191. [Google Scholar] [CrossRef]
- Abrahamsson, S.; Dahlén, B.; Pascher, I. Molecular arrangements in glycosphingolipids: The crystal structure of glucosylphytosphingosine hydrochloride. Acta Cryst. B 1977, B33, 2008–2013. [Google Scholar] [CrossRef]
- Jeffrey, G.A. Carbohydrate liquid crystals. Acc. Chem. Res. 1986, 19, 168–173. [Google Scholar] [CrossRef]
- Jeffrey, G.A.; Wingert, L.M. Carbohydrate liquid crystals. Liq. Cryst. 1992, 12, 179–202. [Google Scholar] [CrossRef]
- Adasch, V.; Hoffmann, B.; Milius, W.; Platz, G.; Voss, G. Preparation of alkyl α- and β-glucopyranosides, thermotropic properties and X-ray analysis. Carbohydr. Res. 1998, 314, 177–187. [Google Scholar] [CrossRef]
- Abe, Y.; Harata, K. Crystal structures of glycolipids. In Polysaccharides Structural Diversity and Functional Versatility, 2nd ed.; Dumitriu, S., Ed.; CRC Press: Boca Raton, FL, USA, 2004; pp. 743–771. ISBN 978-0-8247-5480-8. [Google Scholar] [CrossRef]
- Zhang, W.; Oliver, A.G.; Vu, H.M.; Duman, J.G.; Serianni, A.S. Methyl 4-O-β-D-xylopyranosyl β-D-mannopyranoside, a core disaccharide of an antifreeze glycolipid. Acta Cryst. C 2013, C69, 1047–1050. [Google Scholar] [CrossRef] [PubMed]
- Ogawa, S.; Takahashi, I. Unveiling the Uniqueness of crystal structure and crystalline phase behavior of anhydrous octyl β-D-glucoside using aligned assembly on a Surface. Polymers 2020, 12, 671. [Google Scholar] [CrossRef]
- Israelachvili, J.N.; Mitchell, D.J.; Ninham, B.W. Theory of self-assembly of hydrocarbon amphiphiles into micelles and bilayers. J. Chem. Soc. Faraday Trans. 2 1976, 72, 1525–1568. [Google Scholar] [CrossRef]
- Ogawa, S.; Asakura, K.; Osanai, S. Thermotropic and glass transition behaviors of n-alkyl β-D-glucosides. RSC Adv. 2013, 3, 21439–21446. [Google Scholar] [CrossRef]
- Ogawa, S.; Takahashi, I. Structural characterization of perpendicularly aligned submicrometer-thick synthetic glycolipid polycrystalline films using conventional X-ray diffraction. Crystals 2017, 7, 356. [Google Scholar] [CrossRef]
- Sagalowicz, L.; Acquistapace, S.; Watzke, H.J.; Michel, M. Study of liquid crystal space groups using controlled tilting with cryogenic transmission electron microscopy. Langmuir 2007, 23, 12003–12009. [Google Scholar] [CrossRef]
- Dunphy, D.R.; Garcia, F.L.; Kaehr, B.; Khripin, C.Y.; Collord, A.D.; Baca, H.K.; Tate, M.P.; Hullhouse, H.W.; Strzalka, J.W.; Jiang, Z.; et al. Tricontinuous cubic nanostructure and pore size patterning in mesostructured silica films templated with glycerol monooleate. Chem. Mater. 2011, 23, 2107–2112. [Google Scholar] [CrossRef][Green Version]
- Sakya, P.; Seddon, J.M.; Templer, R.H. Lyotropic phase behaviour of n-octyl-1-O-β-D-glucopyranoside and its thio derivative n-octyl-1-S-β-D-glucopyranoside. J. Phys. II 1994, 4, 1311–1331. [Google Scholar] [CrossRef]
- Nilsson, F.; Söderman, O.; Johansson, I. Physical−chemical properties of the n-octyl β-d-glucoside/water system. A phase diagram, self-diffusion NMR, and SAXS study. Langmuir 1996, 12, 902–908. [Google Scholar] [CrossRef]
- Ogawa, S.; Asakura, K.; Osanai, S. Glass transition behavior of octyl β-D-glucoside and octyl β-D-thioglucoside/water binary mixtures. Carbohydr. Res. 2010, 345, 2534–2541. [Google Scholar] [CrossRef] [PubMed]
- Guruge, A.G.; Warren, D.B.; Benameur, H.; Pouton, C.W.; Chalmers, D.K. Aqueous phase behavior of the PEO-containing non-ionic surfactant C12E6: A molecular dynamics simulation study. J. Colloid Interface Sci. 2021, 588, 257–268. [Google Scholar] [CrossRef] [PubMed]
- Ogawa, S.; Ozaki, Y.; Takahashi, I. Structural insights into solid-to-solid phase transition and modulated crystal formation in octyl-β-D-galactoside crystals. ChemPhysChem 2016, 17, 2808–2812. [Google Scholar] [CrossRef]
- Masunaga, H.; Ogawa, H.; Takano, T.; Sasaki, S.; Goto, S.; Tanaka, T.; Seike, T.; Takahashi, S.; Takeshita, K.; Nariyama, N.; et al. Multipurpose soft-material SAXS/WAXS/GISAXS beamline at SPring-8. Polym. J. 2011, 43, 471–477. [Google Scholar] [CrossRef]


| CnG | State | Peak Angle [2θ]/° | Periodicity, c/Å |
|---|---|---|---|
| C4G (85 °C) | Isotropic melt | 4.98 | 18.0 |
| C5G (95 °C) | Isotropic melt | 4.56 | 19.4 |
| C6G (95 °C) | Isotropic melt | 4.48 | 19.7 |
| C6G (30 °C) | Lα LC | 3.98, 7.80, 11.9, 15.9 | 22.2, 11.3, 7.46, 5.59 |
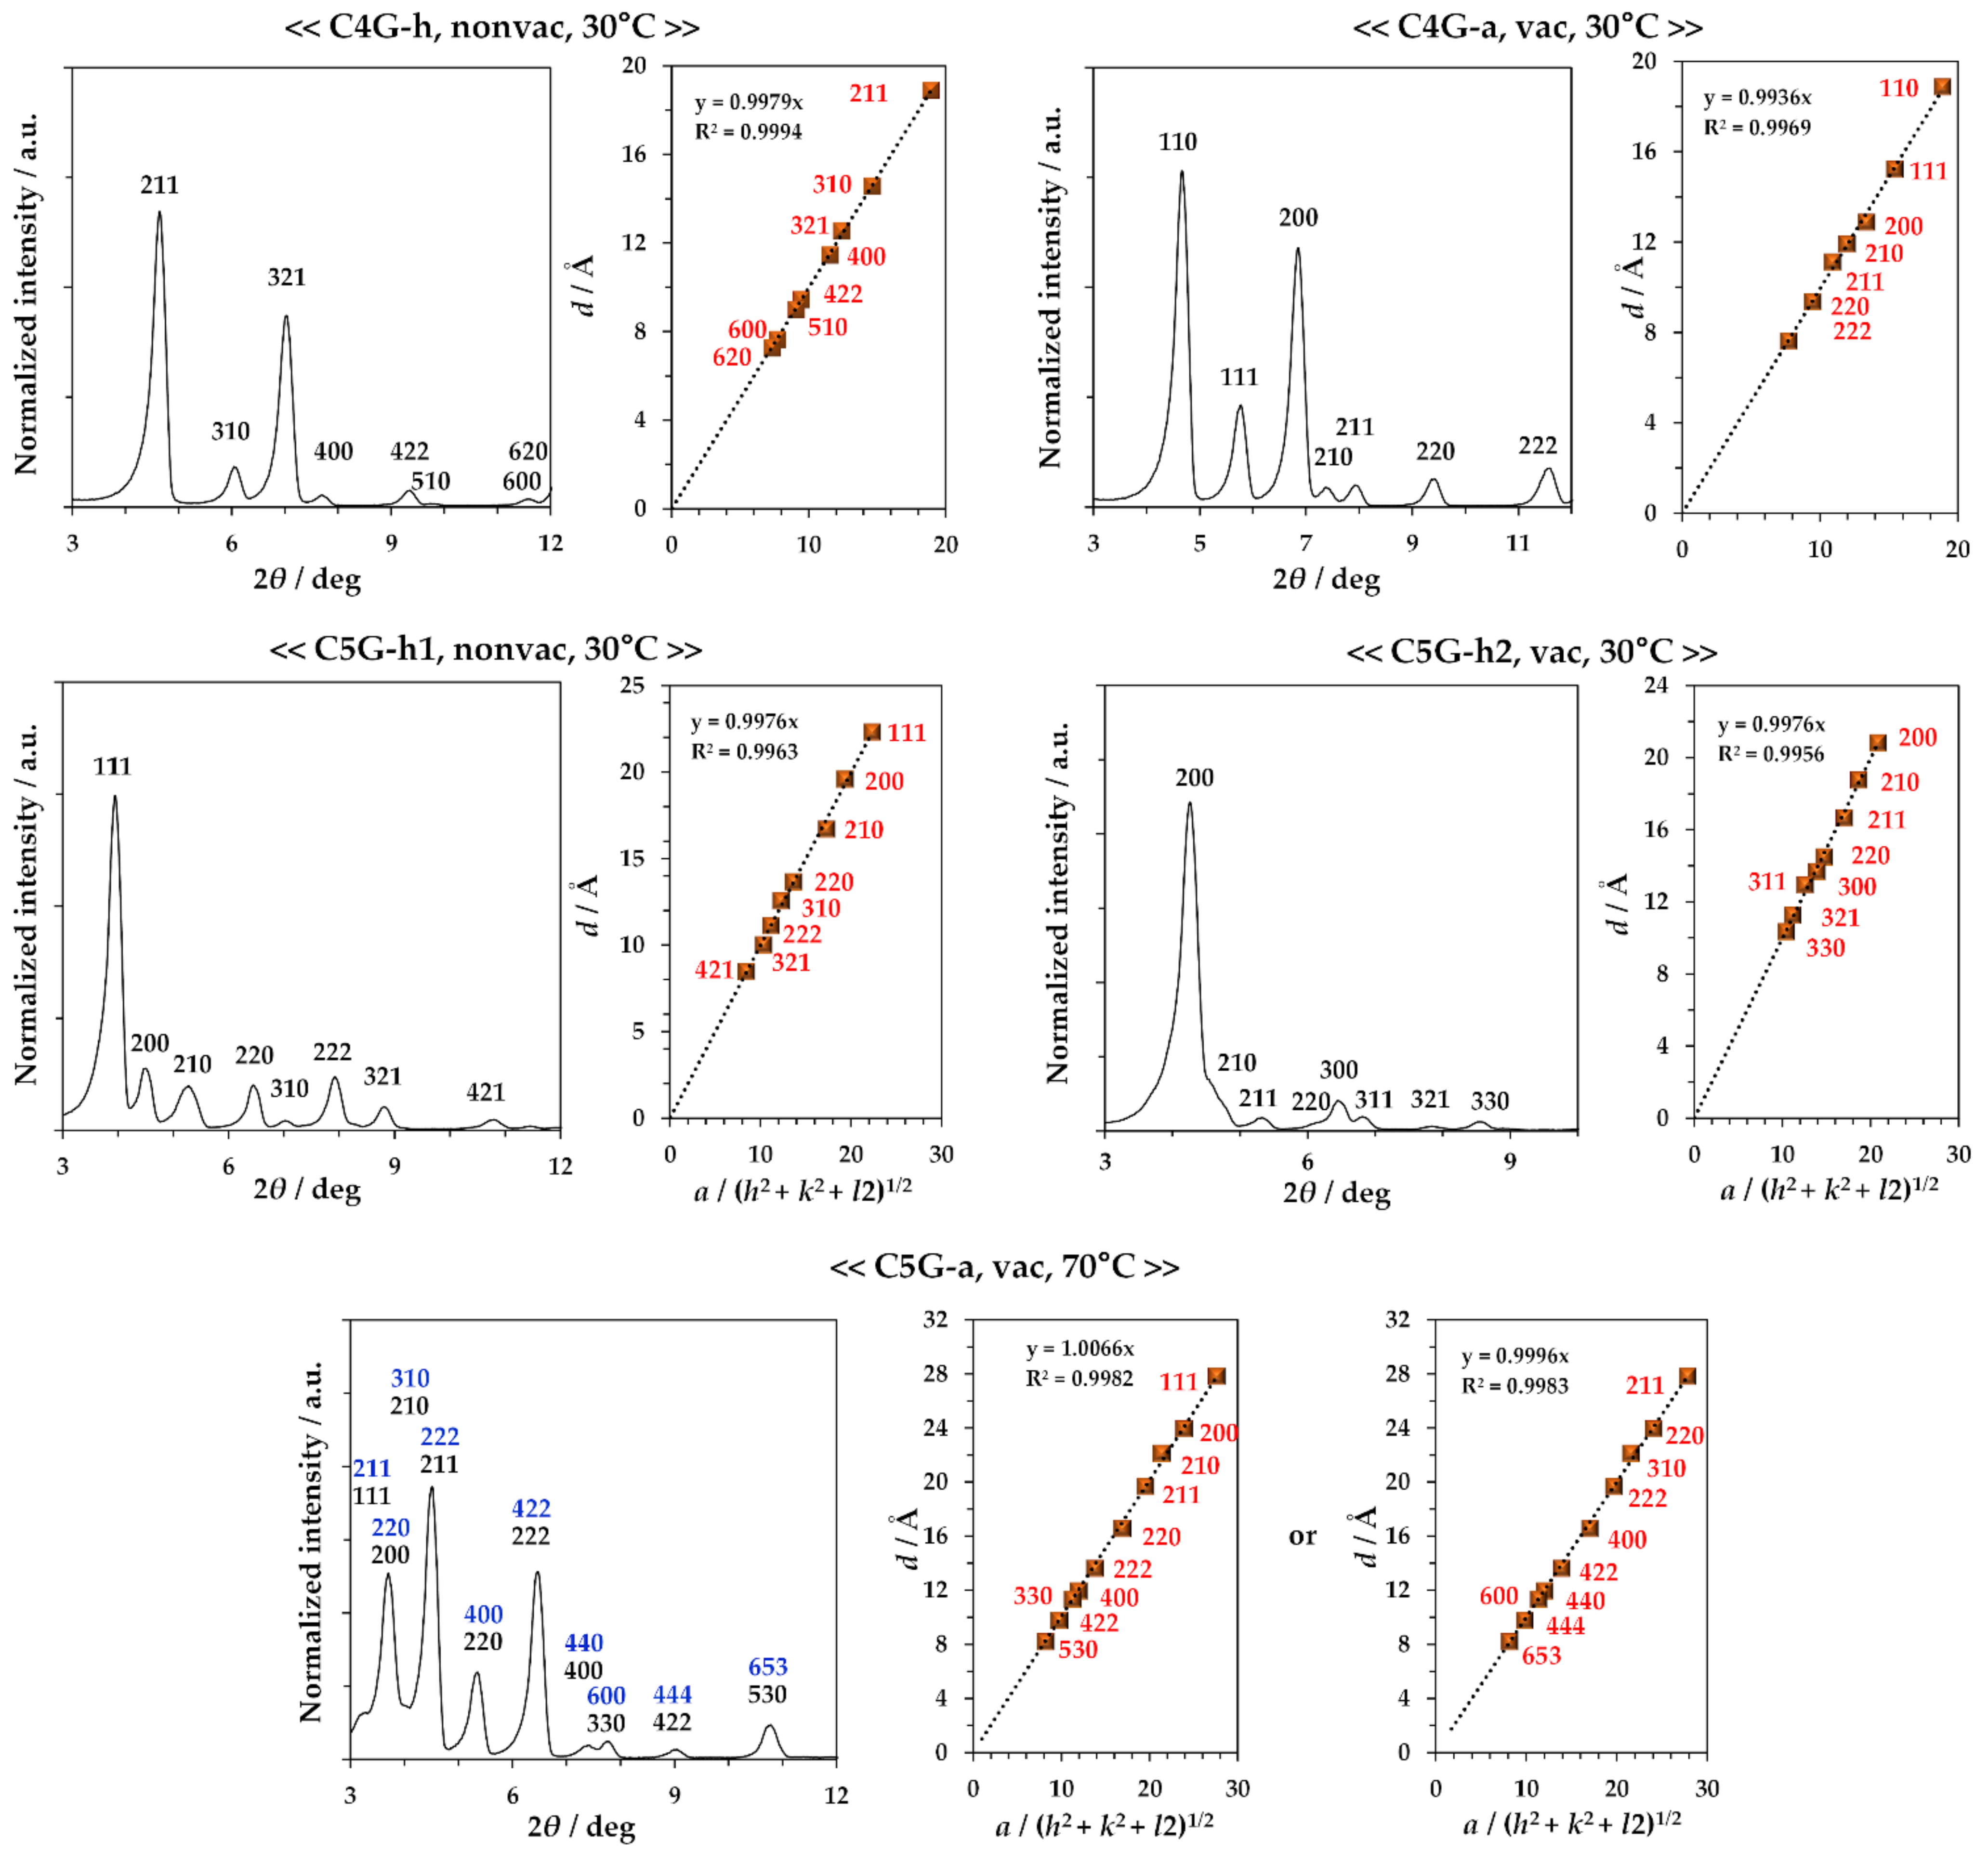
| Compound | Crystal Type | State | Crystal Structure Type | Space Group |
|---|---|---|---|---|
| C4G | 0.32 H2O Hydrate | Isotropic melt | Cubic crystal with 46.3 Å | I-43d (220) |
| C4G | Anhydrous | Cubic crystal with 26.7 Å | P213 (198) or P4232 (208) | |
| C5G | 0.32 H2O Hydrate | Isotropic melt | Cubic crystal with 38.7 Å | Pa-3 (205) |
| C5G | 0.16 H2O Hydrate | Cubic crystal with 41.7 Å | I-43d (220) | |
| C5G | Anhydrous | Cubic crystal with 47.8 Å | Pa-3 (205) or I-43d (220) | |
| C6G | Anhydrous | Lα LC | Modulated lamellar structure | Not determined 2 |
| C7G 1 | Anhydrous | Lα LC | Modulated lamellar structure | P21 |
| C8G 1 | Anhydrous | Lα LC | Modulated lamellar structure | P21 |
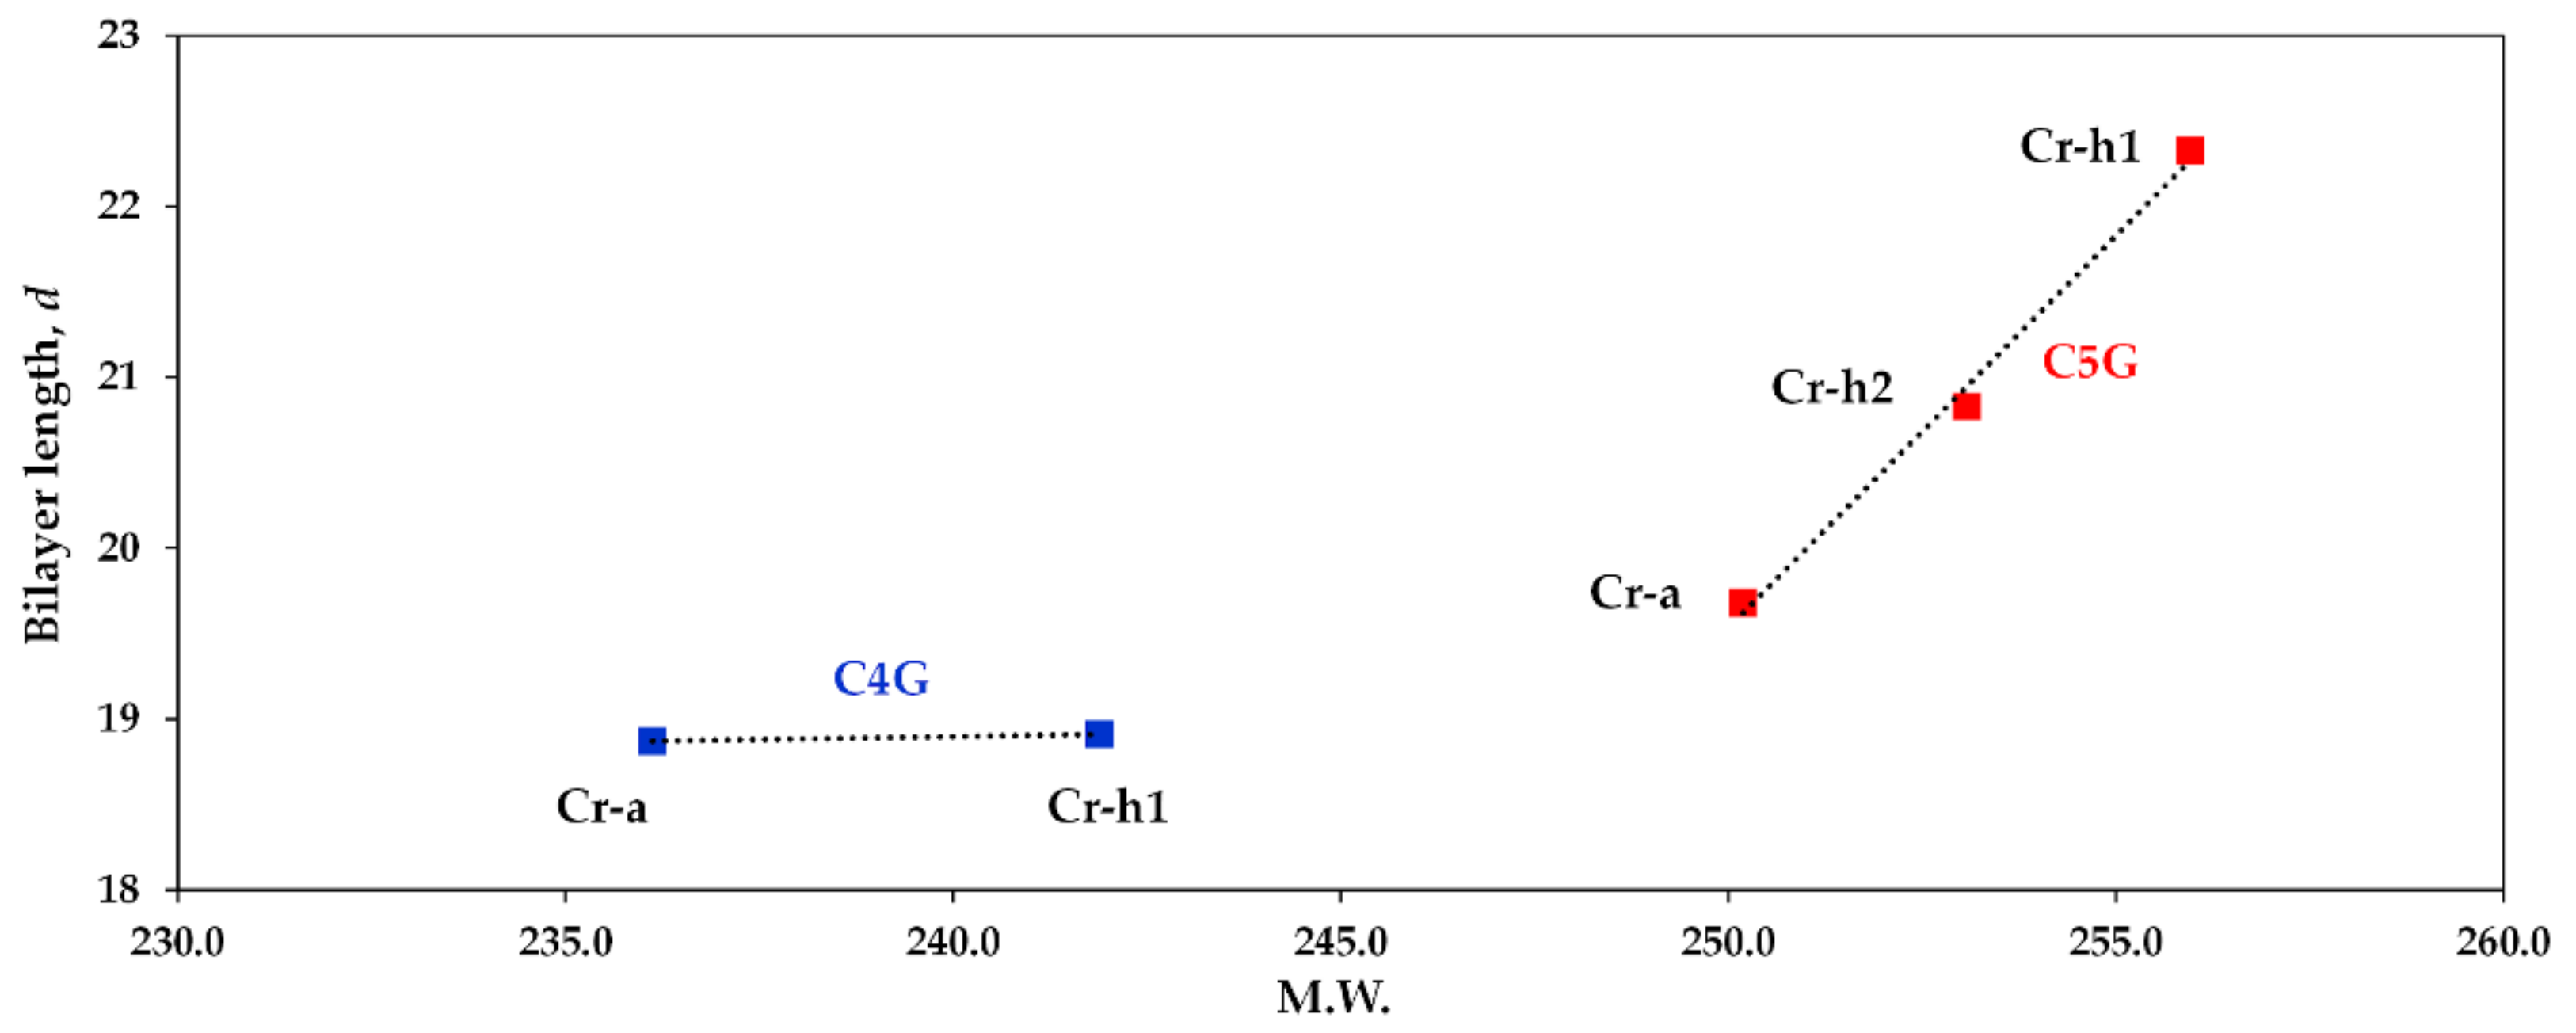
| CnG | H2O | M.W. | 2θ (Deg) | d (Å) |
|---|---|---|---|---|
| C4G (Cr-h) | 0.32 | 241.9236.1 | 4.669 | 18.91 |
| C4G (Cr-a) | 0 | 4.678 | 18.87 | |
| C5G (Cr-h1) | 0.32 | 256.0253.1250.2 | 3.955 | 22.33 |
| C5G (Cr-h2) | 0.16 | 4.239 | 20.83 | |
| C5G (Cr-a) | 0 | 4.487 | 19.68 |
Publisher’s Note: MDPI stays neutral with regard to jurisdictional claims in published maps and institutional affiliations. |
© 2022 by the authors. Licensee MDPI, Basel, Switzerland. This article is an open access article distributed under the terms and conditions of the Creative Commons Attribution (CC BY) license (https://creativecommons.org/licenses/by/4.0/).
Share and Cite
Ogawa, S.; Takahashi, I. Short-Chain Mono-Alkyl β-D-Glucoside Crystals—Do They Form a Cubic Crystal Structure? Molecules 2022, 27, 4359. https://doi.org/10.3390/molecules27144359
Ogawa S, Takahashi I. Short-Chain Mono-Alkyl β-D-Glucoside Crystals—Do They Form a Cubic Crystal Structure? Molecules. 2022; 27(14):4359. https://doi.org/10.3390/molecules27144359
Chicago/Turabian StyleOgawa, Shigesaburo, and Isao Takahashi. 2022. "Short-Chain Mono-Alkyl β-D-Glucoside Crystals—Do They Form a Cubic Crystal Structure?" Molecules 27, no. 14: 4359. https://doi.org/10.3390/molecules27144359
APA StyleOgawa, S., & Takahashi, I. (2022). Short-Chain Mono-Alkyl β-D-Glucoside Crystals—Do They Form a Cubic Crystal Structure? Molecules, 27(14), 4359. https://doi.org/10.3390/molecules27144359