Article

2-Phosphonobutane-1,2,4,-Tricarboxylic Acid (PBTC): pH-Dependent Behavior Studied by Means of Multinuclear NMR Spectroscopy

1
Helmholtz-Zentrum Dresden-Rossendorf, Institute of Resource Ecology, 01328 Dresden, Germany
2
Radiochemistry and Radioecology, Technical University Dresden, 01062 Dresden, Germany
3
Central Radionuclide Laboratory and Radiation Protection, Technical University Dresden, 01062 Dresden, Germany
4
International Research Frontiers Initiative, Institute of Innovative Research, Tokyo Institute of Technology, Meguro, Tokyo 152-8550, Japan
*
Author to whom correspondence should be addressed.
Molecules 2022, 27(13), 4067; https://doi.org/10.3390/molecules27134067
Submission received: 1 June 2022 / Revised: 19 June 2022 / Accepted: 21 June 2022 / Published: 24 June 2022
(This article belongs to the Section Physical Chemistry)

Abstract

:
Although 2-phosphonobutane-1,2,4,-tricarboxylic acid, PBTC, has manifold industrial applications, relevant and reliable data on the protonation of PBTC are poor. However, these data are critical parameters for ascertaining PBTC speciation, especially with regard to a sound structural and thermodynamic characterization of its metal ion complexes. A rigorous evaluation of pH-dependent 1H, 13C, and 31P chemical shifts along with accessible scalar spin–spin coupling constants (J) was performed in order to determine the pKa values of PBTC in 0.5 molal NaCl aqueous solution by means of nuclear magnetic resonance (NMR) spectroscopy. The phosphonate group revealed pKa values of 0.90 ± 0.02 and 9.79 ± 0.02, and the pKa values associated with the carboxylic groups are 3.92 ± 0.02, 4.76 ± 0.03, and 6.13 ± 0.03. Supported by DFT-calculated structures revealing strong intramolecular hydrogen bonding, the sequence of deprotonation could be unambiguously determined.

Graphical Abstract

1. Introduction

Organophosphonates are multipurpose basic chemical compounds. Such products are used in cooling water systems, desalination plants, in the paper, textile, and cement industries as well as in detergents [1]. They act primarily as complexing agents to prevent salt precipitation (antiscalants) and as bleach stabilizers. One of the most widely used organophosphonates is 2-phosphonobutane-1,2,4-tricarboxylic acid, PBTC (Figure 1A) [2,3,4,5]. The combination of phosphonic acid and carboxyl groups makes PBTC an effective dispersant and highly powerful complexing agent for various metal ions (including Ca2+, Mg2+, Zn2+, Al3+, Fe3+) and radionuclides [6,7,8,9]. Due to these properties, PBTC is used in a wide range of technical applications and has been extensively studied in numerous publications and patents. For example, PBTC serves as an efficient long-term retarder in concrete, as a corrosion inhibitor in reinforced concrete and steel, and as a scale inhibitor in water treatment and circulating cooling water systems [10,11].
Regardless of the numerous uses of PBTC in industrial applications, relevant and reliable thermodynamic data on the protonation of PBTC are scarcely available. Protonation constants are necessary thermodynamic parameters for ascertaining PBTC speciation, especially with regard to a thorough structural and thermodynamic characterization of its metal ion complexes. In particular, the protonation constants pKa1 and pKa5 show a lack of consistency among the published values (Table 1) that cannot be explained by factors such as different media and ionic strengths. The first pKa values were published in 1982 in a data sheet for PBTC solution by Bayer AG known under the trade name BAYHIBIT®AM (data available in [12]). Additionally, protonation constants estimated by calculation were released by the European Chemicals Agency (ECHA) [13]. Salvado et al. [8] determined the pKa values by potentiometric pH titrations in 0.5 M NaNO3 at 25 °C; however, this study used commercially available PBTC without any further characterization or purifications. Kornev et al. [14] also lacks information regarding the origin and purity of the PBTC solution used for potentiometric titrations.
NMR spectroscopic techniques have been proven useful for pKa determination for a large variety of molecules [15,16,17,18]. The advantage of these techniques is that they provide structure-related information and cover a wider pH range. For example, determination of a pKa value of about 1 is hardly feasible in potentiometric or calorimetric titration as detection of the abstracted proton is poor against background H+ concentrations ranging between 0.1 and 1 M, corresponding to pH values between 1 and 0, respectively. Especially for phosphorous-containing compounds, the value of 31P NMR-based pH-titrations has been clearly demonstrated by the work of the Hägele group [19,20,21,22].
Table 1. Overview and comparison of PBTC pKa values along with method and conditions.
pKaMethodConditions 1Reference
12345
PBTC
1.08 ± 0.423.99 ± 0.214.44 ± 0.104.99 ± 0.148.59 ± 0.50estimation by calculationwater,
20 °C
[13]
1.84.04.96.810.8not specifiednot specified[12] 2
2.20 ± 0.034.03 ± 0.014.97 ± 0.016.68 ± 0.0110.19 ± 0.01potentiometric titration0.1 M NaCl,
(20 ± 2) °C
[14]
3.8654.1455.176.839.038potentiometric titration0.5 M NaNO3,
25 °C
[8]
0.90 ± 0.023.92 ± 0.024.76 ± 0.036.13 ± 0.039.79 ± 0.02NMR-based
titration
0.5 m NaCl,
(25 ± 1) °C
this work
(R,S)/(S,R) PPTC 3
1.12 ± 0.023.75 ± 0.014.78 ± 0.016.63 ± 0.019.13 ± 0.01NMR-based
titration
not specified[20]
(R,R)/(S,S) PPTC 3
1.02 ± 0.073.37 ± 0.034.87 ± 0.036.30 ± 0.029.19 ± 0.02NMR-based
titration
not specified[20]
1 M and m denote molar and molal concentrations, respectively. 2 Product data sheet of BAYHIBIT®AM 1982, values published in [12]. 3 1-Phosphonopropane-1,2,3-tricarboxylic acid, occurring as diastereomeric pairs of enantiomers.
Within the framework of studies on the release of the long-term retarder PBTC from aged cement phases and related investigations on the complexation behavior towards metal ions under (hyper-)alkaline and highly ionic conditions, we determined pKa values of PBTC. Therefore, we performed solution NMR spectroscopic pH-titration to determine PBTC’s pH-dependent speciation and concomitant structural changes (conformation). Structural aspects such as hydrogen bonds and ambiguities in the deprotonation sequence were clarified by DFT-optimized structures.

2. Results

2.1. NMR Signal Assignment

Unambiguous NMR signal assignment was achieved by heteronuclear single-quantum coherence (HSQC) and heteronuclear multiple-bond correlation (HMBC) between 1H and 13C, as well as 1H and 31P nuclei, allowing for determination of the H, C, and P atomic connectivity. Exemplary spectra are provided in the Supplementary Materials, Figure S1.
In principle, the three methylene groups are diastereotopic, resulting in distinct 1H resonances of either proton in one CH2 group as clearly seen in the H,C-HSQC spectra. The 31P nucleus gives rise to characteristic heteronuclear scalar spin–spin couplings via n bonds (nJ), observable for certain signals in both 1H and 13C spectra. In this work, only the absolute values are quoted, as we do not consider the sign of J in our analysis. Examination of the 1H spectra reveals typical vicinal (3JH,H) coupling between the adjacent methylene groups, H3(a/b) and H4(a/b). In addition, the protons attached to the same carbon are non-equivalent, as they show geminal (2JH,H) coupling. As is typical for 31P-related scalar couplings, the commonly observed order is 1J >> 3J > 2J > 4J, frequently rendering the latter two often unresolved. The carboxylic carbons can be assigned based on their appearance. That is, C4′ is a singlet as the 4JC,P is too small to be observed. Accordingly, the carboxyl 13C doublet with the larger splitting is due to C1′ (3J), whereas that with the smaller splitting arises from C2′ (2J). Correspondingly, among the methylene carbons, the signal associated with C4 is the only one that consistently appears as a doublet (3J), whereas those of C1 and C3 do so only occasionally (2J). The 2+3JC,H resolved in the HMBC spectrum confirm this assignment.
Scalar coupling also occurs between 31P and 1H nuclei, as seen in the H,P-HMBC spectrum and the projected 1H and 1H{31P} spectra (Supplementary Materials, Figure S1A). Again 3J > 4J holds true, allowing for discrimination between H3(a/b) (3JH,P) and H4(a/b) (4JH,P), where 1H signals of the latter reveal no significant alterations upon acquisition with 31P-decoupling. Since H1(a/b) show no coupling to the other methylene protons, their assignment is straightforward.
In particular, the signal splitting of C2 (1JC,P~120 Hz), C2′ (2JC,P~3.5 Hz), C1′ (3JC,P~12 Hz), and C4 (3JC,P~8 Hz) is a recurring spectral feature. The latter three coupling constants are revealed to be pH-dependent and thus reflect the modulations in conformation upon changing speciation along the pH-titration series (vide infra). Of these, the two 3JC,P show Karplus-like curves, indicating extensive charge-induced alterations in (P–C–C–C) dihedral angles.

2.2. pKa Determination from NMR pH-Titration Series

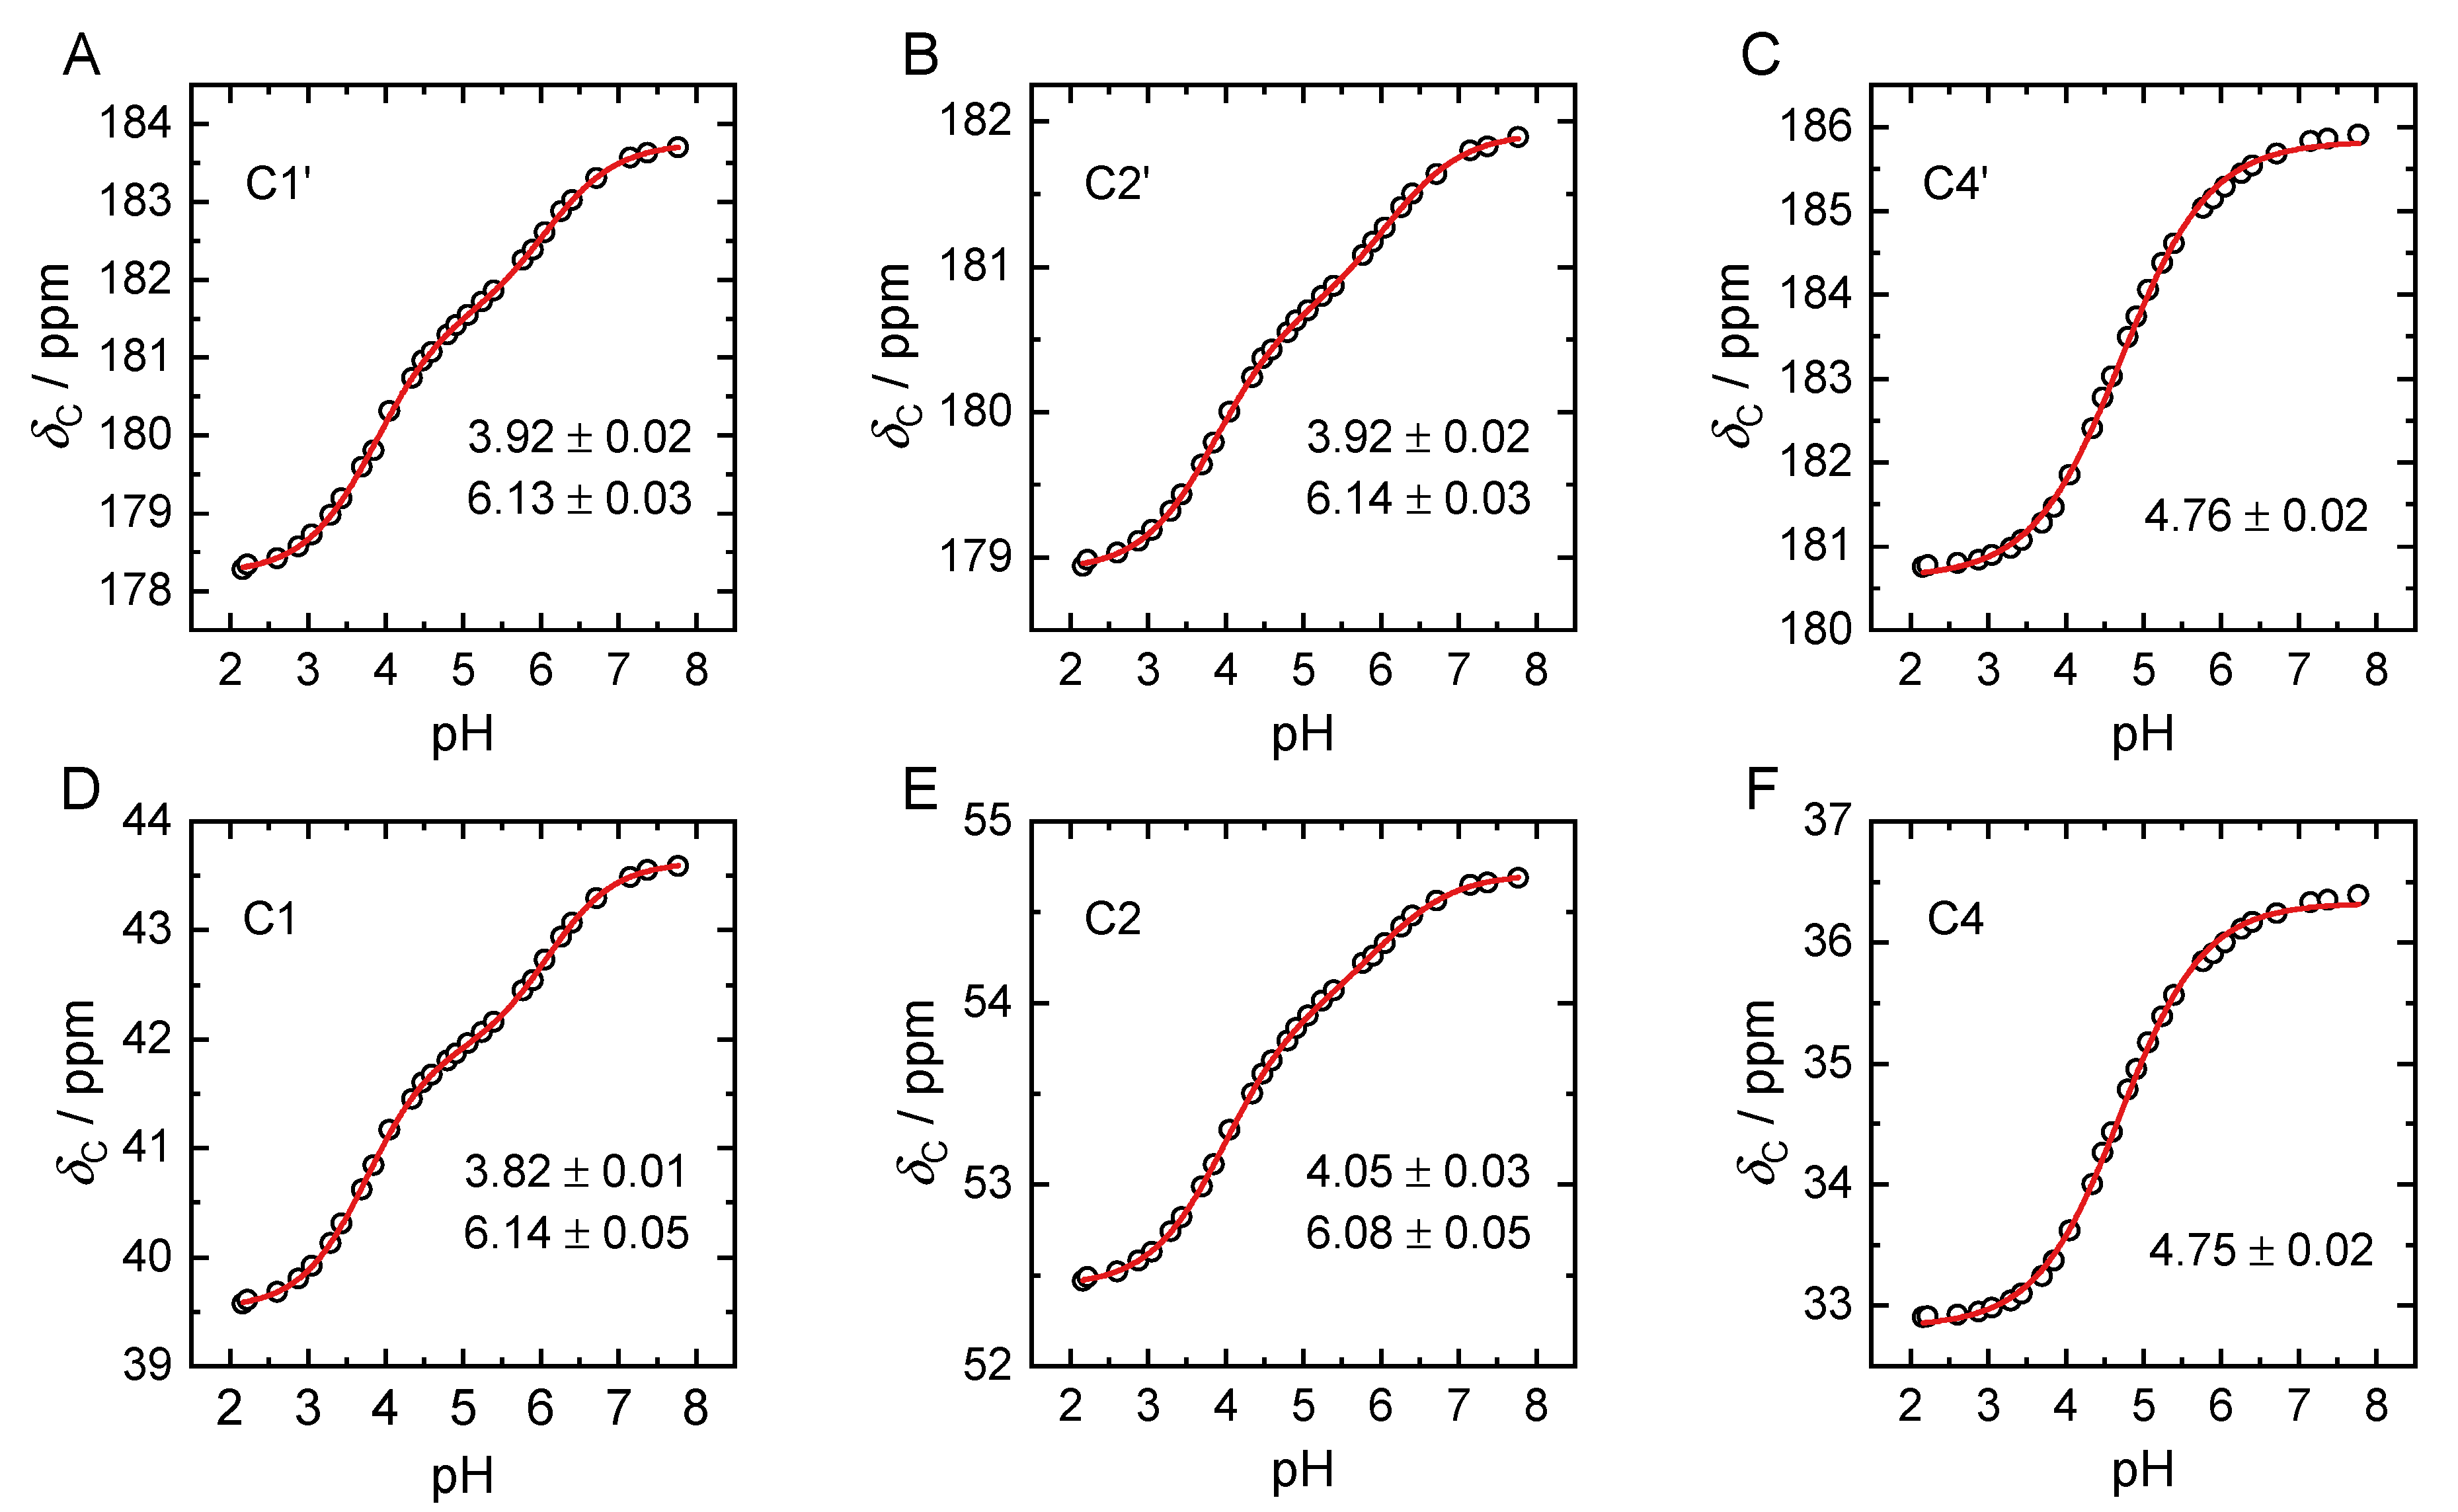
1H, 13C, and 31P NMR spectra of pH-titration series in 0.5 molal NaCl H2O solution are depicted in Figure 1B–D, respectively. An analogous set of spectra for a pD-titration series of 0.35 M PBTC in D2O solution without background electrolyte is given in the Supplementary Materials, Figure S2. The graphical evaluation of the pH-dependent 13C NMR chemical shift values is given in Figure 2.
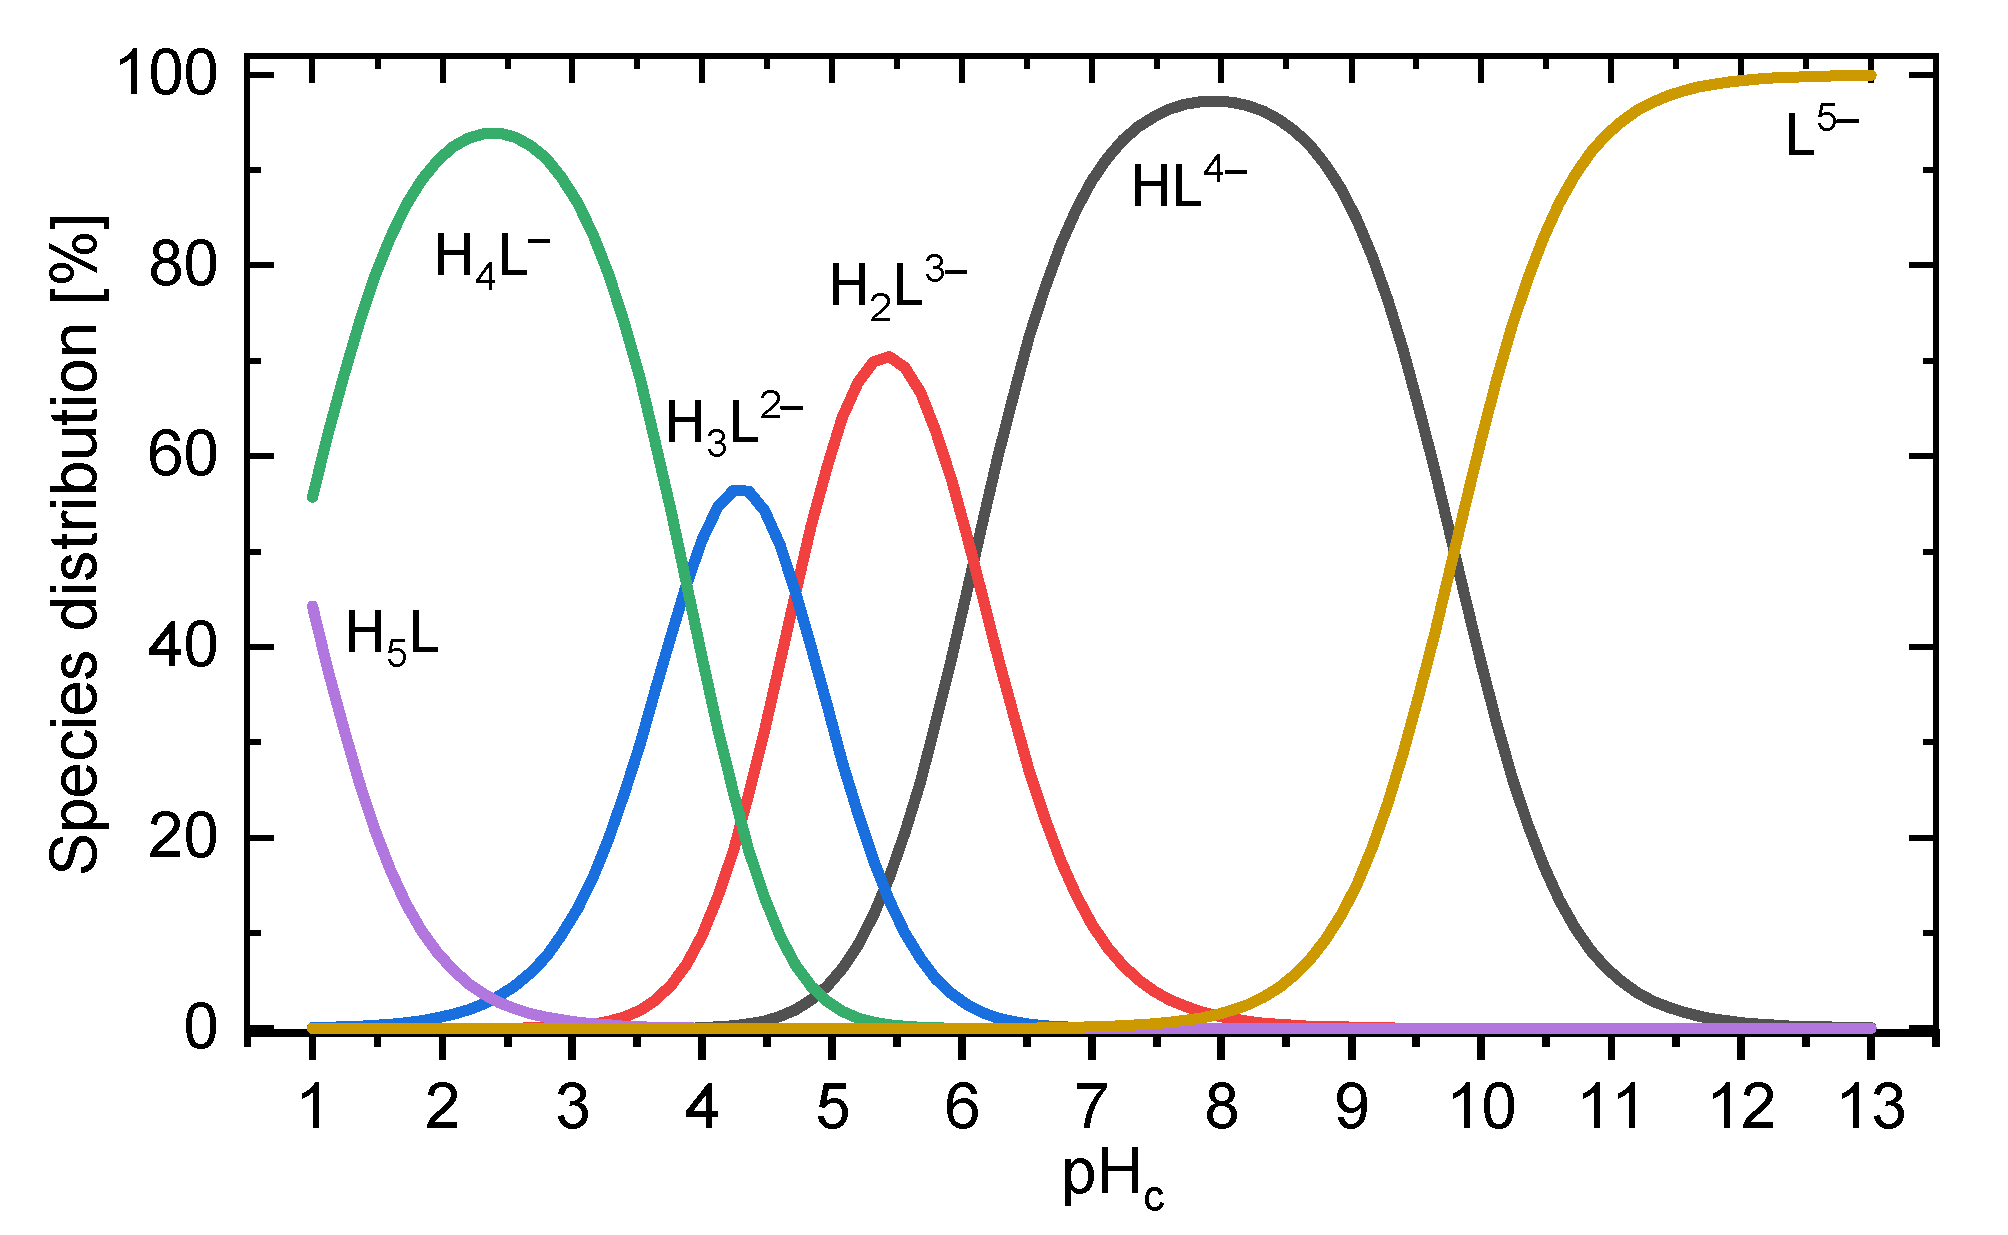
Upon increasing pH, the 13C signals generally shift downfield [23]. The 31P signal shows a more complex behavior. Similar to other phosphonate compounds, proton abstraction at the phosphonic group itself is associated with upfield shifts and occurs in the strongly acidic pH range as well as in the alkaline pH regime. The intermediately observable downfield shift between pH 2 and 7 is associated with the consecutive deprotonation of the carboxylic functional groups. Between pH 7 and 8 the signal position remains constant, mirroring PBTC’s unchanged speciation in that range (Figure 3). The signals of the 1H nuclei show peculiar behavior as they are sensitive to both changing speciation and alterations in the molecule’s conformation accompanied with variations in chemical (spatial) environments (vide infra).
Evaluation of the 31P NMR pH-titration data in order to determine associated pKa values is straightforward and, therefore, δP vs. pH plots along with corresponding sigmoidal dose–response fits are shown in the Supplementary Material, Figure S3. Thus, the determined protolysis constants are pKa1 = 0.90 ± 0.02 and pKa5 = 9.79 ± 0.02.
Concerning the PO3H2 group, the pKa values associated with the COOH groups could also be determined with small statistical uncertainty, with corresponding fitting parameters provided in Table S1 of the Supplementary Material. However, for two out of the three obtained pKa values, assignment to the corresponding COOH group was not straightforward. The pKa3 value of 4.76 ± 0.03 can be unambiguously attributed to the C4′ carboxylic group (Figure 2C,F). In the case of pKa2 and pKa4, determined as 3.92 ± 0.02 and 6.13 ± 0.03, respectively, assignment to the two remaining carboxylic groups C1′ and C2′ is difficult, see Figure 2A,D vs. B,E. Upon application of sigmoidal bi-dose–response fit functions, the pH-dependent chemical shift data of both these carboxylic groups as well as of their adjacent carbons (C1 and C2, respectively) reveal two inflections at virtually identical pH values. Obviously, the individual pH-dependent chemical shift values are strongly correlated. The individual line widths (signal width at half amplitude) are insignificant. As a further NMR spectroscopic quantity, the 13C–31P scalar couplings were considered. Among these nJC,P coupling constants, the 3JC1′,P (vide infra) can be fitted by a sigmoidal bi-dose–response fit function (Supplementary Materials, Figure S4), and reveals almost the same two inflection points already determined from the chemical shift data, viz. 4.01 and 6.16.
Table 1 (vide supra) gives a concise summary of the few PBTC titration literature data. Figure 3 shows a species distribution according to the pKa values determined in this work, obtained in 0.5 m NaCl aqueous solution.

2.3. DFT-Calculated Deprotonation Sequence

Relative energies of DFT-optimized molecular structures of differently protonated HnLn−5 (n = 0, 1, 2, 3, 4, 5) species are summarized in Table 2, and provide further insight into the actual order of deprotonation in this system.
DFT-calculated energies clearly demonstrate that the phosphonic acid group is associated with PBTC’s first and last deprotonation step. Deprotonation of H4L at carboxylic groups 2′ and 4′ results in structures with higher energy than for proton abstraction at 1′. Thus, the second deprotonation, associated with pKa2, is favored for carboxylic group 1′. For the trianionic species, the structure with the proton abstracted from carboxylic group 4′ is somewhat lower in energy, hence associated with pKa3. Therefore, pKa4 refers to carboxylic group 2′. DFT-calculated structures of the respective deprotonated species of lowest energy are compiled in Figure 4.

2.4. pH-Dependent Scalar Spin–Spin Coupling Constants

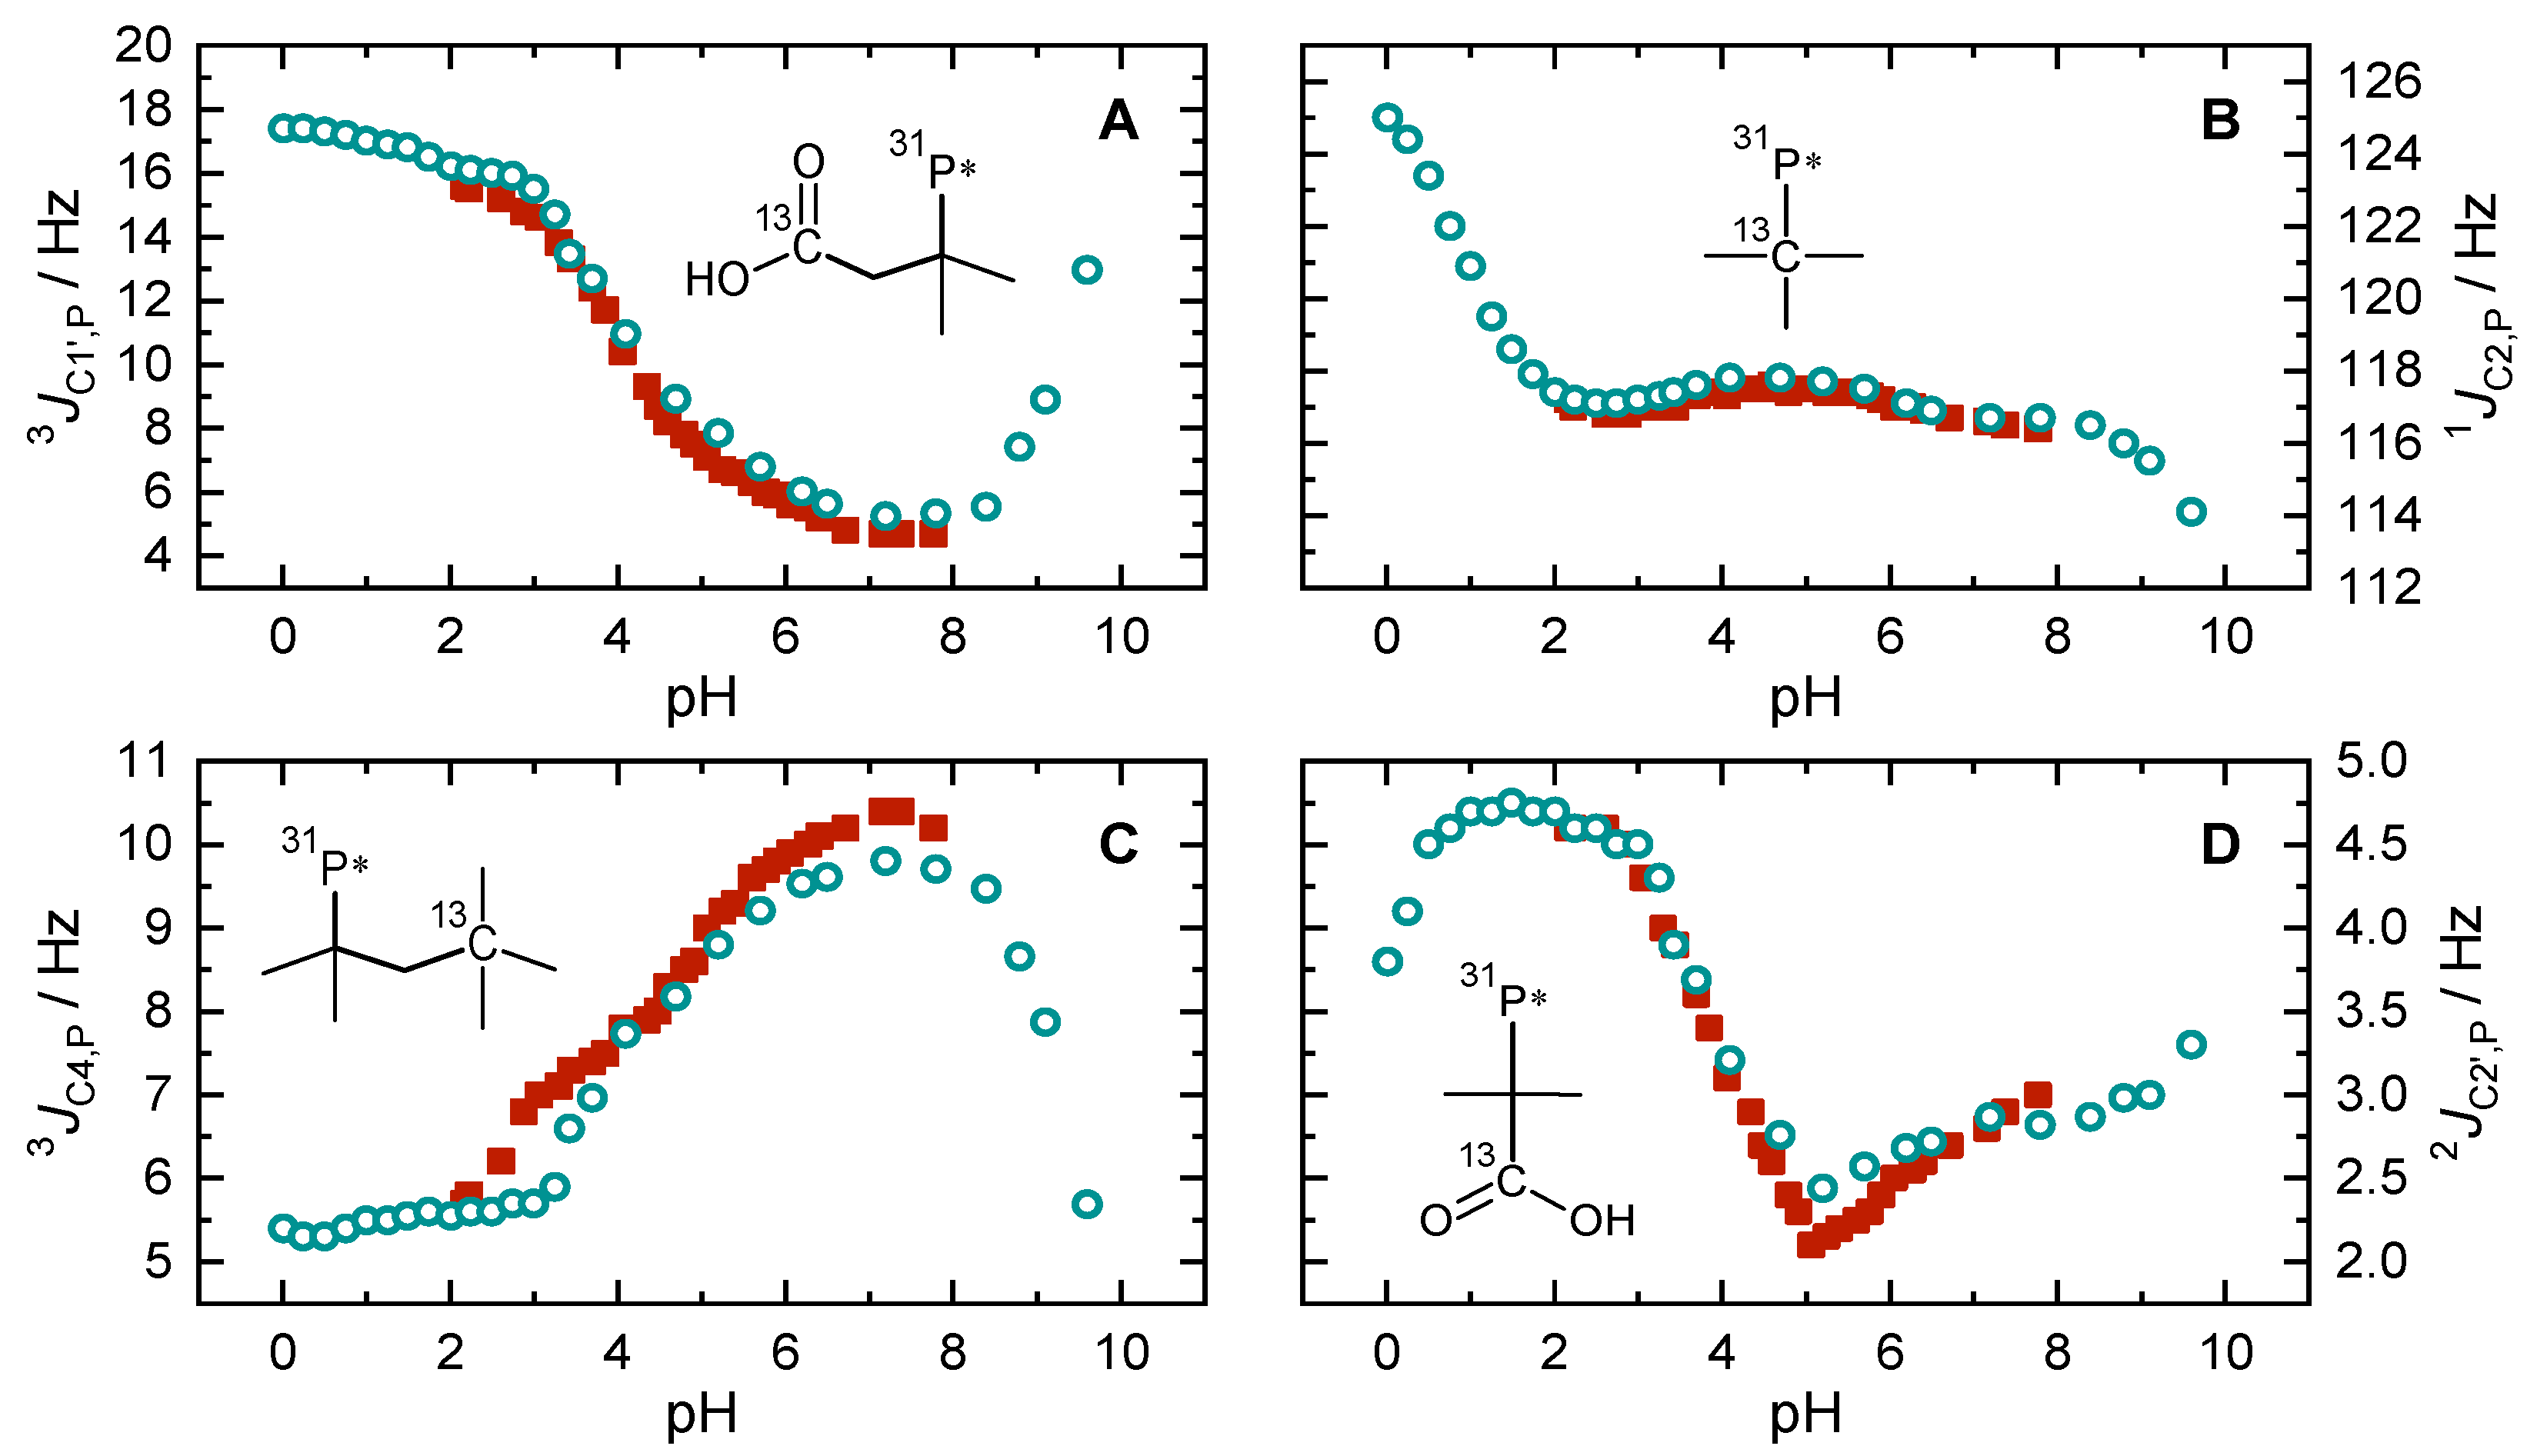
Scalar spin–spin couplings were determined from signal splitting of C1′, C2, C4, and C2′ (Figure 5A–D) for two titration series, i.e., 25 mM PBTC and 0.5 molal NaCl in 90/10 (v/v) H2O/D2O (red squares) as well as 350 mM PBTC in pure D2O solutions (blue circles). We are aware that H and D possess non-negligible isotope effects. However, since superposition of the data from both series indicates consistent behavior, and since the D2O series covers a wider data range than the H2O series, the following considerations focus primarily on the D2O series.
Initially, at pD = 0, PBTC is fully protonated and hence constitutes a neutral molecule that notably retains good solubility, even for concentrations as high as 350 mM. 1JC2,P shows a steady decrease over the course of either of the two PO3H2 deprotonation steps, that is in contrast to almost no variations while titrating the COOH groups (Figure 5B). The curves of the two 3JC,P involving C1′ and C4, Figure 5A,C, respectively, illustrate almost opposite progression during pD titration. In strongly acidic media, 3JC1′,P displays its maximum of ~18 Hz while 3JC4,P reveals its minimum of ~5.5 Hz. Up to pD~3, minimal changes are observed. Upon further increase of the pD to about 7, 3JC1′,P passes its minimum of ~5 Hz, whereas 3JC4,P is at its maximum of 10.5 Hz. Finally, in increasingly alkaline media and with the abstraction of the second phosphonate proton, the trends of both curves return to similar values as in acidic solution. The 2JC2′,P is, in principle, small and so are its pD-dependent variations. Nevertheless, the curve discloses a clear minimum (~2 Hz) at pD = 5.
Among the 1H-related coupling constants, the 2J1a,1b (Figure 6A) is easiest to evaluate and of particular interest. Its absolute value is relatively large, even for a geminal coupling constant. This is mainly due to the proximity of the H-atoms to the carbonyl carbon of the carboxylic group C1′, as previously observed for glycine residue (~18 Hz) or citrate (~16 Hz) [24,25], and reinforced by the strong electron withdrawing effects from the close phosphonate and carboxyl groups. Analogous to the 2JC2′,P discussed above, the pH-dependent variance is small but smooth and significant, showing a minimum at pH = 5 as well. The pH-dependent behavior of the signals associated with H1(a/b) is very different (see Figure 1B and Figure 6A). 1a shows a drastic change in chemical shift between pH 3 and 5, whereas the signal due to 1b is nearly independent of pH.

3. Discussion

As seen from Table 1, the available protolysis data are heterogeneous and ambiguous. Our obtained pKa values appear reasonable overall and are comparable to other phosphonic acids. For instance, in phosphonoacetic acid and 2,4-diphosphonobutane-1,2-dicarboxylic acid (DPBDC), pKa1 values associated with H+ abstraction from the phosphonic acid group are 0.78 and 1.07, respectively [19]. The two carboxyl groups in DPBDC reveal corresponding pKa3 and pKa4 values of 4.82 and 7.05 [19], which are also in accordance with our determined figures. Considering the closely structurally related 1-phosphonopropane-1,2,3-tricarboxylic acid (PPTC, occurring as diastereomeric pairs of enantiomers, included in Table 1), both the phosphonic acid and carboxyl groups show remarkably similar pKa values [22], further corroborating our figures.
The prediction of the deprotonation sequence for the carboxyl groups is not easily accomplished through purely chemical reasoning. Based on the structure of the PBTC molecule, on the one hand, one might expect that 4′ COOH possesses the largest pKa value since it is distant from the other electron-withdrawing functionalities. On the other hand, for the partially ionized species, intramolecular hydrogen bonds play an important role, while for the completely protonated acid the DFT-calculated structure revealed no intramolecular hydrogen bonds. The latter finding is in agreement with the crystal structure of PBTC acid where hydrogen bonds are intermolecular [26].
For DPBDC, Hägele proposed intramolecular hydrogen bridges in protolytic species H3L3− to HL5− with formation of a seven-membered ring between the phosphonate and the carboxyl groups in γ-position [19]. Our DFT-calculated structures (Figure 4) corroborate intramolecular hydrogen bonds with formation of six- and seven-membered rings involving PBTC’s phosphonic acid group and the carboxylic groups 1′ and 2′ in the γ- and β-positions, respectively. The latter of these appears to persist for the PBTC species H4L through H2L3− (Figure 4B,D). For species H4L, 1′ COOH is a hydrogen bond donor with one of the phosphonate oxygens as acceptor, whereas for species H3L2− through HL4− (Figure 4C,E) 1′ COO acts as an acceptor site for -PO2O-H. The calculated intramolecular OH⋯O distances range from 1.50 to 1.67 Å, and are in agreement with literature [27].
As already seen from the chemical shift data, assignment of pKa values to the two carboxyl groups 1′ and 2′ is difficult. The DFT-calculated energy for H3L2− is lowest for H+ abstraction from 1′ COOH, while deprotonation of 2′ COOH is lowest in energy not before HL4, i.e., for deprotonation of H2L3− (see Table 2), in line with its calculated long-persisting hydrogen bond. The increased electron density due to close proximity of 1′ carboxylate as well as the phosphonate group with strong hydrogen bond acceptor properties impedes H+ abstraction from carboxylic group 2′.
Although DFT calculations suggest deprotonation of the trianionic species at the remaining functional groups very close in energy, from 13C NMR data the pKa3 can clearly be assigned to 4′, since the data of both the carboxyl carbon and the carbon of the adjacent methylene group (C4) reveal only one clear sigmoidal. This site can be considered independent from the other functional groups.
As implied by DFT, 4′ is not involved in intramolecular hydrogen bonding. 1H nuclear Overhauser enhancement spectroscopy (NOESY) proves an ‘elongated’ aliphatic carbon chain C2–C3–C4–COO(H). Distance- (r–6) and orientation-dependent NOE contacts (ellipses and arrows in Figure 6B,C), observable for H1b to both H4(a/b) but not to H3(a/b), indicate that the latter points in the opposite direction of H1b and are rather distant, whereas H1b points towards H4(a/b) and is closer in space. Assignment of 1a and 1b is straightforward by means of 3JH,P, where the larger coupling indicates the transoid arrangement between P and H1b whereas the smaller coupling is indicative of the cisoid arrangement for P and H1a (see horizontal projection in Figure 6B). Between pH 2 and 8, the signals due to H1a and H1b reflect the electronic situation in their respective half spaces well. H1a senses deprotonation (and changing hydrogen bonding situation) for the phosphonate as well as 1′ and 2′, and thus is successively shielded. As H1b points in the opposite direction of H1a and is too distant to sense alterations at 4′, its chemical environment is almost unaffected in that pH range.
2JC2′,P‘s minimum observed at pH = 5 (and possibly that of 2J1a,1b, too) is interpreted as the onset of H2L3− deprotonation (emerging curve of HL4−, Figure 3); that is, abstraction of the 2′ carboxyl proton along with cleavage of the associated intramolecular hydrogen bond, almost exactly one pH unit below the corresponding pKa value (6.13).
At pH/pD~8, upon emergence of the fully deprotonated species, the additional negative charge at the phosphonate group once again causes conformation changes because of intramolecular electrostatic repulsion among the phosphonate group and 1′ and 2′ carboxylate groups as well as dissociation of the remaining hydrogen bond. This process is clearly reflected by the simultaneous but opposite Karplus-like pH-dependent 3JC,P curves, indicative of extensive charge-induced alterations in P–C2–C1–C1′ and P–C2–C3–C4 dihedral angles.
The angular dependence of P–O–C–C coupling has clearly been demonstrated for cyclic nucleotides, cyclic phosphites, and phosphates, and an almost symmetrical Karplus curve was found for P–C–C–C coupling in phosphine oxides. For acyclic organic phosphonates, 1JC,P values have been determined as well [28,29,30,31,32,33,34,35,36]. Already in 1976, Buchanan and Benezra addressed the question whether phosphonates show a Karplus-type relationship in P–C–C–C coupling [37]. They draw the conclusion that relating 3JC,P couplings to dihedral angles must be exercised with great care as they are very sensitive to electronic and steric substituent effects, and differ notably from geometrical requirements observed in corresponding vicinal 3JH,H coupling.
The presented data on homo- and heteronuclear coupling constants might be a good basis for benchmarking DFT-calculated J values as demonstrated elsewhere [38]. Although the present study cannot cover quantitative information on the Karplus relationship of 3JC,P in PBTC, it still adds to the examples of qualitatively demonstrating the value of coupling constants in understanding charge-induced alterations in the molecule’s conformation.

4. Materials and Methods

4.1. Starting Material

Aqueous PBTC solution can be obtained from various suppliers (from dedicated chemical distributors to specialty suppliers for the industrial applications). Most of these suppliers guarantee a PBTC content of 48–52%, but do not provide any further information regarding the purity of the solution (except SigmaAldrich, St. Louis, MO, USA; here a purity of >95% was specified but could not be confirmed; refer to Supplementary Materials). Already Armbruster et al. [10] reported on the several impurities of technical PBTC, depending on the conditions during synthesis and workup. Contaminants comprise, among others, phosphorous acid, ortho-phosphoric acid, phosphonopropionic, and phosphonosuccinic acids. Therefore, PBTC solutions from three different suppliers have been tested for their purity. The batch of highest purity, viz. 93% based on 31P signal integration, was used without further purification (TCI Germany GmbH, Eschborn, Germany; batch 1, see Supplementary Materials, Figure S5). Contained impurities do not affect pKa determination since PBTC is the main component and NMR spectroscopy allows for precise examination of the signals associated with the molecule of interest. Assignment of the impurities was waived as their presence had no effect on the results of this study.

4.2. Sample Preparation

Three sample series (S1–S3) were prepared for NMR titration. S1 comprises samples prepared using deuterated chemicals and pD adjusted as described elsewhere [39]. Therefore, original 50% (w/w) aqueous PBTC solution, batch 1, TCI Germany GmbH (see Supplementary Materials) was adjusted to pH~6 using NaOH prior to lyophilization. The obtained pale brownish powder was then dissolved in D2O, yielding a 0.7 M stock solution with its concentration determined by signal integration of quantitative 31P NMR measurements of an aliquot spiked with a weighed amount of Na2HPO4. From this stock solution in D2O, sample solutions finally 350 mM in PBTC were prepared in the pD range 0–13.
Owing to the high sensitivity of 31P, but the comparably low sensitivity of 13C, corresponding series S2 and S3 were 1 mM and 25 mM in PBTC, respectively, covering pH ranges of 0–11 (S1) and 2–8 (S2) with increments of 0.2 to 0.4 pH units. Therefore, S2 and S3 were prepared by appropriate dilution of aliquots of the original 50% PBTC solution mentioned above using pure Milli-Q H2O (18.2 MΩ cm, Millipore, Burlington, MA, USA) for S2, and 10% D2O in Milli-Q H2O (v/v) for S3, as well as NaOH and HCl for pH adjustment with a pH meter (inoLab pH 730) equipped with a pH electrode (SCHOTT, BlueLine), respectively. The measured pH was checked using an ionic strength correction function according to the procedure described in [40]. In the case of Im ≤ 0.5 m, the measured pH equals pHc within uncertainties of 0.05 units. All chemicals for H2O solutions were p.a. grade and purchased from Roth (Arlesheim, Switzerland). In the case of S3, pH was corrected for deuterium. According to the common pD = pH(read) + 0.4 in pure D2O, and since the reading of the pH meter is very nearly a linear function of the atom-% deuterium [41], the used 10% D2O contents in S3 afford for addition of 0.04 pH units.
For the structure elucidation experiments, aliquots of the PBTC stock solution in D2O were diluted appropriately to yield 50 mM solutions, adjusted to pD = 1.9, 3.9, and 9.9, respectively.

4.3. NMR Spectroscopy

All NMR spectra were recorded at 25 °C with an Agilent DD2-600 NMR system, operating at 14.1 T with corresponding 1H, 13C, and 31P resonance frequencies of 599.8, 150.8, and 242.8 MHz, respectively, using a 5 mm oneNMR™ probe.
A total of 700 µL of D2O only (S1) or 90/10 (v/v) H2O/D2O solutions (S3), or 500 µL H2O solutions (S2) were transferred to 5 mm NMR tubes. In the case of series S2, the tubes contained a coaxial capillary insert filled with D2O for deuterium lock along with sodium 3-trimethylsilyl-propionate (TMSP-d4) and one droplet of 85% H3PO4 (Roth, p.a.) for external referencing.
1H NMR spectra (S1 and S2) were measured by accumulating 32 scans, using 2 s of acquisition time and relaxation delay, respectively, applying a 2 s pre-saturation pulse on the water resonance for water signal suppression. Spectra are referenced relative to the methyl signal of TMSP-d4 in D2O with δH = 0.00 ppm. 1H{31P} spectra (S3) were acquired analogously, with simultaneous broadband 31P-decoupling. For 13C NMR measurements (S3), 1024 scans were accumulated upon applying 4 s relaxation delay after a 3.3 µs excitation (30°) pulse and 1 s acquisition time, with 1H broadband-decoupling. 31P NMR spectra (S1 and S2) were obtained after excitation by a 30° pulse (4.16 µs), applying an acquisition time of 2 s, with simultaneous broadband 1H-decoupling. The relaxation delay between two excitations was 3 s. In case of quantitative 31P NMR spectra, 100 scans were accumulated upon excitation by a 30° pulse, inverse-gated 1H decoupling during the 3 s acquisition time, and relaxation delay of 60 s.
For unambiguous signal assignment, heteronuclear single-quantum coherence (HSQC) and heteronuclear multiple-bond correlation was performed using sequences with gradient-selection and adiabatic pulses. H,C-HSQC, H,C-HMBC, and H,P-HMBC spectra were acquired with 2 k × 512, 2 k × 1 k, and 2 k × 128 complex points in F2 and F1, with 24, 64, and 8 transitions per F1 increment, and a relaxation delay of 1 s, respectively. For polarization transfer, (2J)−1 delays of 4.0 and 41.7 ms were opted, corresponding to 125 Hz 1J in HSQC and 12 Hz nJ in either HMBC, respectively.
The NOESY spectrum was obtained from the S3 series’ pH 4.4 sample, acquired with 1 s pre-saturation, 500 ms mixing time, 2k × 512 complex points in F2 and F1, respectively, 64 transitions per F1 increment, and a relaxation delay of 1 s.

4.4. DFT Calculation

Using Gaussian16 program [42], density functional theory (DFT) calculations on PBTC species in different protonation states were performed at the B3LYP level in water through the use of polarizable continuum model (PCM) [25,39,43,44,45]. All-electron basis set of triple-zeta quality was used on all elements. Initial structures of the species were set to maximize the number of intramolecular hydrogen bonds since such structure tends to give energetically more stable complexes. Structures were confirmed to be at their energy minima through vibrational frequency analysis where no imaginary frequency was found to be present.

4.5. Data Processing Software

NMR spectra were processed with MestReNova, version 6.0.2., Mestrelab Research S.L. [46]. Creation of graphs for numerical data visualization and data fitting by non-linear sigmoidal dose–response fit algorithm was performed with Origin 2019, version 9.6.0.172, OriginLab Corporation. DFT-calculated structures are visualized with Avogadro [47].

5. Conclusions and Outlook

A comprehensive evaluation of multinuclear NMR chemical shift and coupling constant data, complemented by DFT calculations, allowed for a certain determination of PBTC’s pKa values and the unambiguous assignment of the respective abstracted proton to the corresponding site among the phosphonic and carboxylic groups. These results endure both a reliable speciation and a good perception of the pH-dependent alterations in the molecule’s structure.
The used approach of NMR-based titration is superior to other methods, e.g. potentiometric titration, as its atomic resolution allows for the assignment of the origin of the abstracted proton. Unfortunately, especially for 13C NMR, the required concentrations in the 10–30 mM range are a clear disadvantage. With the higher sensitivity of 1H and 31P, especially in D2O solution, analyte concentrations of 100 µM or even lower are feasible.
The presented NMR spectra and pKa values are critical spectroscopic and thermodynamic reference data, essential for determining molecular structures and stability constants of PBTC complexes and metal ions such as radionuclides.
The NMR data are also useful when dealing with PBTC modifications of any kind; for instance, PBTC derivatives such as its esters or, in long-term studies, its degradation products upon light-irradiation, thermal treatment, or other extreme conditions. Studies on PBTC in other environments are also conceivable, be it in organic solvents or in aqueous solutions with background electrolytes of different types or concentrations, or in solutions of other complex compositions.

Supplementary Materials

The following supporting information can be downloaded at: https://www.mdpi.com/article/10.3390/molecules27134067/s1, Figure S1: 1H,31P-HMBC, 1H,13C-HMBC, and 1H,13C-HSQC spectra of 50 mM PBTC D2O solution along with 13C signals showing the magnitudes of nJC,P; Figure S2: 1H, 31P{1H}, and 13C{1H} spectra of NMR pD-titration series of 350 mM PBTC in D2O solutions; Figure S3: Graphs of δP vs. pH, along with respective pKa values obtained from sigmoidal dose–response fits, together with corresponding fitting parameters; Figure S4: Graph of 3JC1′,P vs. pH along with corresponding sigmoidal bi-dose–response fit and corresponding fitting parameters; Table S1: Fitting parameters associated with sigmoidal (bi-)dose–response fits of the δP vs. pH graphs presented in Figure 3; Figures S5–S9: Quantitative 1H and 31P NMR spectra of PBTC solutions purchased from different suppliers, along with purity determined from 31P signal integration.

Author Contributions

Conceptualization, J.K. and M.A.; methodology, J.K. and S.T.; formal analysis, J.K., A.W. and S.T.; investigation, J.K., A.W. and S.T.; writing—original draft preparation, J.K.; writing—review and editing, S.T., K.S. and M.A.; visualization, J.K., S.T. and M.A.; supervision, K.S. and M.A.; project administration, K.S. and M.A. All authors have read and agreed to the published version of the manuscript.

Funding

This research was funded by the German Federal Ministry for Economic Affairs and Energy (BMWi) within the GRaZ II projects, no. 02E11860B and 02E11860G.

Institutional Review Board Statement

Not applicable.

Informed Consent Statement

Not applicable.

Data Availability Statement

All data are included in this paper.

Acknowledgments

The authors thank Dominik Goldbach for his valuable lab work and Sara Gilson for linguistic revision.

Conflicts of Interest

The authors declare no conflict of interest.

Sample Availability

Samples of the compounds are not available from the authors.

References

  1. Valsami-Jones, E. Phosphorus in Environmental Technology: Principles and Applications; IWA Publishing: London, UK, 2005. [Google Scholar]
  2. Demadis, K.D.; Lykoudis, P. Chemistry of Organophosphonate Scale Growth lnhibitors: 3. Physicochemical Aspects of 2-Phosphonobutane-1,2,4-Tricarboxylate (PBTC) And Its Effect on CaCO3 Crystal Growth. Bioinorg. Chem. Appl. 2005, 3, 546865. [Google Scholar] [CrossRef] [PubMed] [Green Version]
  3. Demadis, K.D.; Lykoudis, P.; Raptis, R.G.; Mezei, G. Phosphonopolycarboxylates as Chemical Additives for Calcite Scale Dissolution and Metallic Corrosion Inhibition Based on a Calcium-Phosphonotricarboxylate Organic−Inorganic Hybrid. Cryst. Growth Des. 2006, 6, 1064–1067. [Google Scholar] [CrossRef]
  4. Rott, E.; Steinmetz, H.; Metzger, J.W. Organophosphonates: A review on environmental relevance, biodegradability and removal in wastewater treatment plants. Sci. Total Environ. 2018, 615, 1176–1191. [Google Scholar] [CrossRef] [PubMed]
  5. Rott, E.; Happel, O.; Armbruster, D.; Minke, R. Behavior of PBTC, HEDP, and Aminophosphonates in the Process of Wastewater Treatment. Water 2020, 12, 53. [Google Scholar] [CrossRef] [Green Version]
  6. Clearfield, A.; Demadis, K.D. (Eds.) Metal Phosphonate Chemistry: From Synthesis to Applications; Royal Society of Chemistry: Cambridge, UK, 2011. [Google Scholar]
  7. Huang, Y.; Zheng, H.; Li, H.; Zhao, C.; Zhao, R.; Li, S. Highly selective uranium adsorption on 2-phosphonobutane-1,2,4-tricarboxylic acid-decorated chitosan-coated magnetic silica nanoparticles. Chem. Eng. J. 2020, 388, 124349. [Google Scholar] [CrossRef]
  8. Salvadó, V.; Escoda, M.L.S.; de la Torre, F. A study of the complex formation between trivalent ions (Al3+, Fe3+) and 2-phosphonobutane-1,2,4-tricarboxylic acid and their industrial applications. Polyhedron 1999, 18, 3275–3280. [Google Scholar] [CrossRef]
  9. Spinthaki, A.; Matheis, J.; Hater, W.; Demadis, K.D. Antiscalant-Driven Inhibition and Stabilization of “Magnesium Silicate” under Geothermal Stresses: The Role of Magnesium–Phosphonate Coordination Chemistry. Energy Fuels 2018, 32, 11749–11760. [Google Scholar] [CrossRef]
  10. Armbruster, D.; Müller, U.; Happel, O. Characterization of phosphonate-based antiscalants used in drinking water treatment plants by anion-exchange chromatography coupled to electrospray ionization time-of-flight mass spectrometry and inductively coupled plasma mass spectrometry. J. Chromatogr. A 2019, 1601, 189–204. [Google Scholar] [CrossRef]
  11. Rickert, J.; Thielen, G. Influence of a Long-Term Retarder on the Hydration of Clinker and Cement. In Cement, Concrete, and Aggregates; ASTM International: West Conshohocken, PA, USA, 2004; Volume 26, pp. 1–10. [Google Scholar] [CrossRef] [Green Version]
  12. Szczygieł, B.; Drela, I. Evaluation of Organic Ligands as Copper Complexing Agents Using the Isotachophoresis Method. Pol. J. Environ. Stud. 2008, 17, 479–483. [Google Scholar]
  13. European Chemicals Agency (ECHA). 2-Phosphonobutane-1,2,4-Tricarboxylic Acid. Dissociation Constants Estimated by Calculation. European Chemicals Agency (ECHA) Study Report 2009. Available online: https://echa.europa.eu/registration-dossier/-/registered-dossier/14870/4/22 (accessed on 29 March 2022).
  14. Kornev, V.I.; Kropacheva, T.N.; Sorokina, U.V. Coordination compounds of oxovanadium(IV) with organophosphonic complexones in aqueous solutions. Russ. J. Inorg. Chem. 2015, 60, 403–408. [Google Scholar] [CrossRef]
  15. Popov, K.; Rönkkömäki, H.; Lajunen, L.H.J. Guidelines for NMR measurements for determination of high and low pKa values (IUPAC Technical Report). Pure Appl. Chem. 2006, 78, 663–675. [Google Scholar] [CrossRef]
  16. Szakács, Z.; Hägele, G. Accurate determination of low pK values by 1H NMR titration. Talanta 2004, 62, 819–825. [Google Scholar] [CrossRef] [PubMed]
  17. Szakács, Z.; Hägele, G.; Tyka, R. 1H/31P NMR pH indicator series to eliminate the glass electrode in NMR spectroscopic pKa determinations. Anal. Chim. Acta 2004, 522, 247–258. [Google Scholar] [CrossRef]
  18. Szakács, Z.; Kraszni, M.; Noszál, B. Determination of microscopic acid–base parameters from NMR–pH titrations. Anal. Bioanal. Chem. 2004, 378, 1428–1448. [Google Scholar] [CrossRef] [PubMed]
  19. Hägele, G. Protolysis and Complex Formation of Organophosphorus Compounds—Characterization by NMR-Controlled Titrations. Molecules 2019, 24, 3238. [Google Scholar] [CrossRef] [Green Version]
  20. Hägele, G. NMR controlled titrations characterizing organophosphorus compounds. Phosphorus Sulfur Silicon Relat. Elem. 2019, 194, 361–363. [Google Scholar] [CrossRef]
  21. Hägele, G.; Arendt, C.; Kropp, H.W.; Majer, H.J.; Ollig, J. Protonation and Metal Complex Formation of Phosphorus Containing Acids and Bases. Phosphorus Sulfur Silicon Relat. Elem. 1996, 109, 205–208. [Google Scholar] [CrossRef]
  22. Lindner, A. 1-Phosphonopropan-1,2,3-Tricarbonsäure—NMR-und Konformationsanalytische Untersuchungen; Heinreich-Heine-Universität Düsseldorf: Düsseldorf, Germany, 2000. [Google Scholar]
  23. Hagen, R.; Roberts, J.D. Nuclear magnetic resonance spectroscopy. Carbon-13 spectra of aliphatic carboxylic acids and carboxylate anions. J. Am. Chem. Soc. 1969, 91, 4504–4506. [Google Scholar] [CrossRef]
  24. Kretzschmar, J.; Brendler, E.; Wagler, J.; Schmidt, A.-C. Kinetics and activation parameters of the reaction of organoarsenic(V) compounds with glutathione. J. Hazard. Mater. 2014, 280, 734–740. [Google Scholar] [CrossRef]
  25. Kretzschmar, J.; Tsushima, S.; Drobot, B.; Steudtner, R.; Schmeide, K.; Stumpf, T. Trimeric uranyl(VI)–citrate forms Na+, Ca2+, and La3+ sandwich complexes in aqueous solution. Chem. Commun. 2020, 56, 13133–13136. [Google Scholar] [CrossRef]
  26. Demadis, K.D.; Raptis, R.G.; Baran, P. Chemistry of Organophosphonate Scale Growth Inhibitors: 2. Structural Aspects of 2-Phosphonobutane-1,2,4-Tricarboxylic Acid Monohydrate (PBTC.H2O). Bioinorg. Chem. Appl. 2005, 3, 606490. [Google Scholar] [CrossRef] [PubMed] [Green Version]
  27. Grabowski, S.J. Understanding Hydrogen Bonds: Theoretical and Experimental Views; The Royal Society of Chemistry: London, UK, 2021; pp. 368–400. [Google Scholar]
  28. Lapper, R.D.; Smith, I.C.P. Carbon-13 and proton nuclear magnetic resonance study of the conformations of 2′,3′-cyclic nucleotides. J. Am. Chem. Soc. 1973, 95, 2880–2884. [Google Scholar] [CrossRef]
  29. Haemers, M.; Ottinger, R.; Reisse, J.; Zimmermann, D. Direct NMR evidence of the axial preference of the substituent on phosphorus in 2-chloro- and 2-methoxy-1,2,3-dioxaphosphorinanes. Tetrahedron Lett. 1971, 12, 461–464. [Google Scholar] [CrossRef]
  30. Borisenko, A.A.; Sergeyev, N.M.; Nifant’ev, E.Y.; Ustynyuk, Y.A. Carbon-13 nuclear magnetic resonance of 1,3,2-dioxaphosphorinan-2-ones. J. Chem. Soc. Chem. Commun. 1972, 7, 406–407. [Google Scholar] [CrossRef]
  31. Wetzel, R.B.; Kenyon, G.L. 1-phosphabicyclo[2.2.1]heptane 1-oxide and 1-phosphabicyclo[2.2.2]octane 1-oxide. Syntheses and some properties relative to their monocyclic and acyclic analogs. J. Am. Chem. Soc. 1974, 96, 5189–5198. [Google Scholar] [CrossRef]
  32. Gray, G.A.; Cremer, S.E. Carbon-13 nuclear magnetic resonance of organophosphorus compounds. III. Phosphorus heterocycles. J. Org. Chem. 1972, 37, 3458–3469. [Google Scholar] [CrossRef]
  33. McFarlane, W.; Whiffen, D.H. A 13C and 31P magnetic double resonance study of organo-phosphorus compounds. Proc. R. Soc. Ser. A 1968, 306, 185–199. [Google Scholar] [CrossRef]
  34. Mavel, G.; Green, M.J. Carbon–phosphorus coupling in representative organophosphorus compounds. Chem. Commun. 1968, 13, 742–743. [Google Scholar] [CrossRef]
  35. Benezra, C. NMR of phosphonates. VI. Variation of vicinal phosphorus-31-carbon-carbon-proton couplings with dihedral angle in phosphonates. J. Am. Chem. Soc. 1973, 95, 6890–6894. [Google Scholar] [CrossRef]
  36. Jakobsen, H.J.; Bundgaard, T.; Hansen, R.S. Assignments and signs of 13C-31P coupling constants from off-resonance proton decoupled 13C spectra. Mol. Phys. 1972, 23, 197–201. [Google Scholar] [CrossRef]
  37. Buchanan, G.W.; Benezra, C. Stereochemical dependence of 13C shieldings and 13C–31P couplings in phosphonates of known geometry. Is there a Karplus-type relationship for P–C–C–C coupling? Canad. J. Chem. 1976, 54, 231–237. [Google Scholar] [CrossRef]
  38. Ghiasi, M.; Oskouie, A.A.; Saeidian, H. Dynamic stereochemistry of Topiramate (anticonvulsant drug) in solution: Theoretical approaches and experimental validation. Carbohydr. Res. 2012, 348, 47–54. [Google Scholar] [CrossRef] [PubMed] [Green Version]
  39. Kretzschmar, J.; Tsushima, S.; Lucks, C.; Jäckel, E.; Meyer, R.; Steudtner, R.; Müller, K.; Rossberg, A.; Schmeide, K.; Brendler, V. Dimeric and Trimeric Uranyl(VI)–Citrate Complexes in Aqueous Solution. Inorg. Chem. 2021, 60, 7998–8010. [Google Scholar] [CrossRef] [PubMed]
  40. Altmaier, M.; Metz, V.; Neck, V.; Müller, R.; Fanghänel, T. Solid-liquid equilibria of Mg(OH)2(cr) and Mg2(OH)3Cl·4H2O(cr) in the system Mg-Na-H-OH-Cl-H2O at 25 °C. Geochim. Cosmochim. Acta 2003, 67, 3595–3601. [Google Scholar] [CrossRef]
  41. Glasoe, P.K.; Long, F.A. Use of glass electrodes to measure acidities in deuterium oxide. J. Phys. Chem. 1960, 64, 188–190. [Google Scholar] [CrossRef]
  42. Frisch, M.J.; Trucks, G.W.; Schlegel, H.B.; Scuseria, G.E.; Robb, M.A.; Cheeseman, J.R.; Scalmani, G.; Barone, V.; Petersson, G.A.; Nakatsuji, H.; et al. Gaussian 16, Revision B.01; Gaussian, Inc.: Wallingford, CT, USA, 2016. [Google Scholar]
  43. Tomasi, J.; Mennucci, B.; Cammi, R. Quantum Mechanical Continuum Solvation Models. Chem. Rev. 2005, 105, 2999–3094. [Google Scholar] [CrossRef] [PubMed]
  44. Cossi, M.; Rega, N.; Scalmani, G.; Barone, V. Energies, structures, and electronic properties of molecules in solution with the C-PCM solvation model. J. Comput. Chem. 2003, 24, 669–681. [Google Scholar] [CrossRef] [PubMed]
  45. Barone, V.; Cossi, M. Quantum Calculation of Molecular Energies and Energy Gradients in Solution by a Conductor Solvent Model. J. Phys. Chem. A 1998, 102, 1995–2001. [Google Scholar] [CrossRef]
  46. Willcott, M.R. MestRe Nova. J. Am. Chem. Soc. 2009, 131, 13180. [Google Scholar] [CrossRef]
  47. Hanwell, M.D.; Curtis, D.E.; Lonie, D.C.; Vandermeersch, T.; Zurek, E.; Hutchison, G.R. Avogadro: An advanced semantic chemical editor, visualization, and analysis platform. J. Cheminf. 2012, 4, 17. [Google Scholar] [CrossRef] [Green Version]
Figure 1. (A) Structure of PBTC together with atomic labeling used throughout this work. (BD) NMR pH-titration series of PBTC in 0.5 molal NaCl solutions. (B) 1H{31P} NMR and (C) 13C{1H} NMR spectra of 25 mM PBTC in the pH range 2–8, and (D) 31P{1H} NMR spectra of 1 mM PBTC in the pH range 0–11; pH values increase from bottom to top with increments of 0.2 to 0.4 pH units. For clarity, only spectral regions of interest are shown.
Molecules 27 04067 g001
Figure 2. Graphs of pH-dependent 13C NMR chemical shift values (black circles) obtained from pH-titration series of 25 mM PBTC in 0.5 molal NaCl solutions. Graphs respectively correspond to carboxyl carbons C1′ (A), C2′ (B), C4′ (C), and methylene carbons C1 (D), C2 (E), C4 (F). The pKa values obtained from sigmoidal (bi-)dose–response fits (red lines) are stated with each subfigure.
Molecules 27 04067 g002
Figure 3. Species distribution diagram calculated for 1 mM of total PBTC based on the pKa values obtained in this work (Im = 0.5 m NaCl, T = 25 °C).
Molecules 27 04067 g003
Figure 4. DFT-optimized structures of HnPBTCn−5 species of lowest energy (n = 5 through 0, corresponding to consecutive deprotonation, (AF), respectively), according to Table 2. Sites of respective deprotonation are indicated by *. Dashed lines indicate intramolecular hydrogen bonds, with OH⋯O distances given in Å.
Molecules 27 04067 g004
Figure 5. Graphs showing scalar 13C–31P spin–spin coupling constants (absolute values) in dependence on pH/pD. (A) 3J (C1′–P), (B) 1J (C2–P), (C) 3J (C4–P), and (D) 2J (C2′–P). Red squares correspond to pH-titrations series of 25 mM PBTC in 0.5 molal NaCl 90/10 (v/v) H2O/D2O solutions, and blue circles correspond to pD-titration series of 350 mM PBTC in D2O solution without background electrolyte. Inserts sketch the respective considered coupling pathways. P* denotes the phosphonate group.
Molecules 27 04067 g005
Figure 6. (A) 1H chemical shift (left y-axis) of H1a and H1b (green squares and blue triangles, respectively) as well as their geminal coupling constant (right y-axis, absolute values, open circles) in dependence on pH, as determined from 1H{31P} NMR spectra shown in Figure 1B. (B) NOESY spectrum (500 ms mixing time) of PBTC pH 4.4 solution, and (C) DFT-calculated structure of H3L2−, indicating the non-trivial NOE contacts by ellipses and arrows, respectively.
Molecules 27 04067 g006
Table 2. Relative energies (in kcal mol−1) calculated from DFT-optimized structures (Figure 4) for a given macrospecies deprotonated at the respective functional groups.
Species Carboxylic Groups
P* 11′2′4′
H4L±0.0+26.8+9.0+25.3
H3L2−-±0.0+7.6+14.8
H2L3−--+7.7±0.0
HL4−+8.6-±0.0-
1 P* denotes the phosphonate group.
Publisher’s Note: MDPI stays neutral with regard to jurisdictional claims in published maps and institutional affiliations.