
Metabolic Behaviors of Aconitum Alkaloids in Different Concentrations of Aconiti Lateralis Radix Praeparata and Effects of Aconitine in Healthy Human and Long QT Syndrome Cardiomyocytes

 , ,
, ,
Abstract
:1. Introduction
2. Results and Discussion
2.1. Method Validation
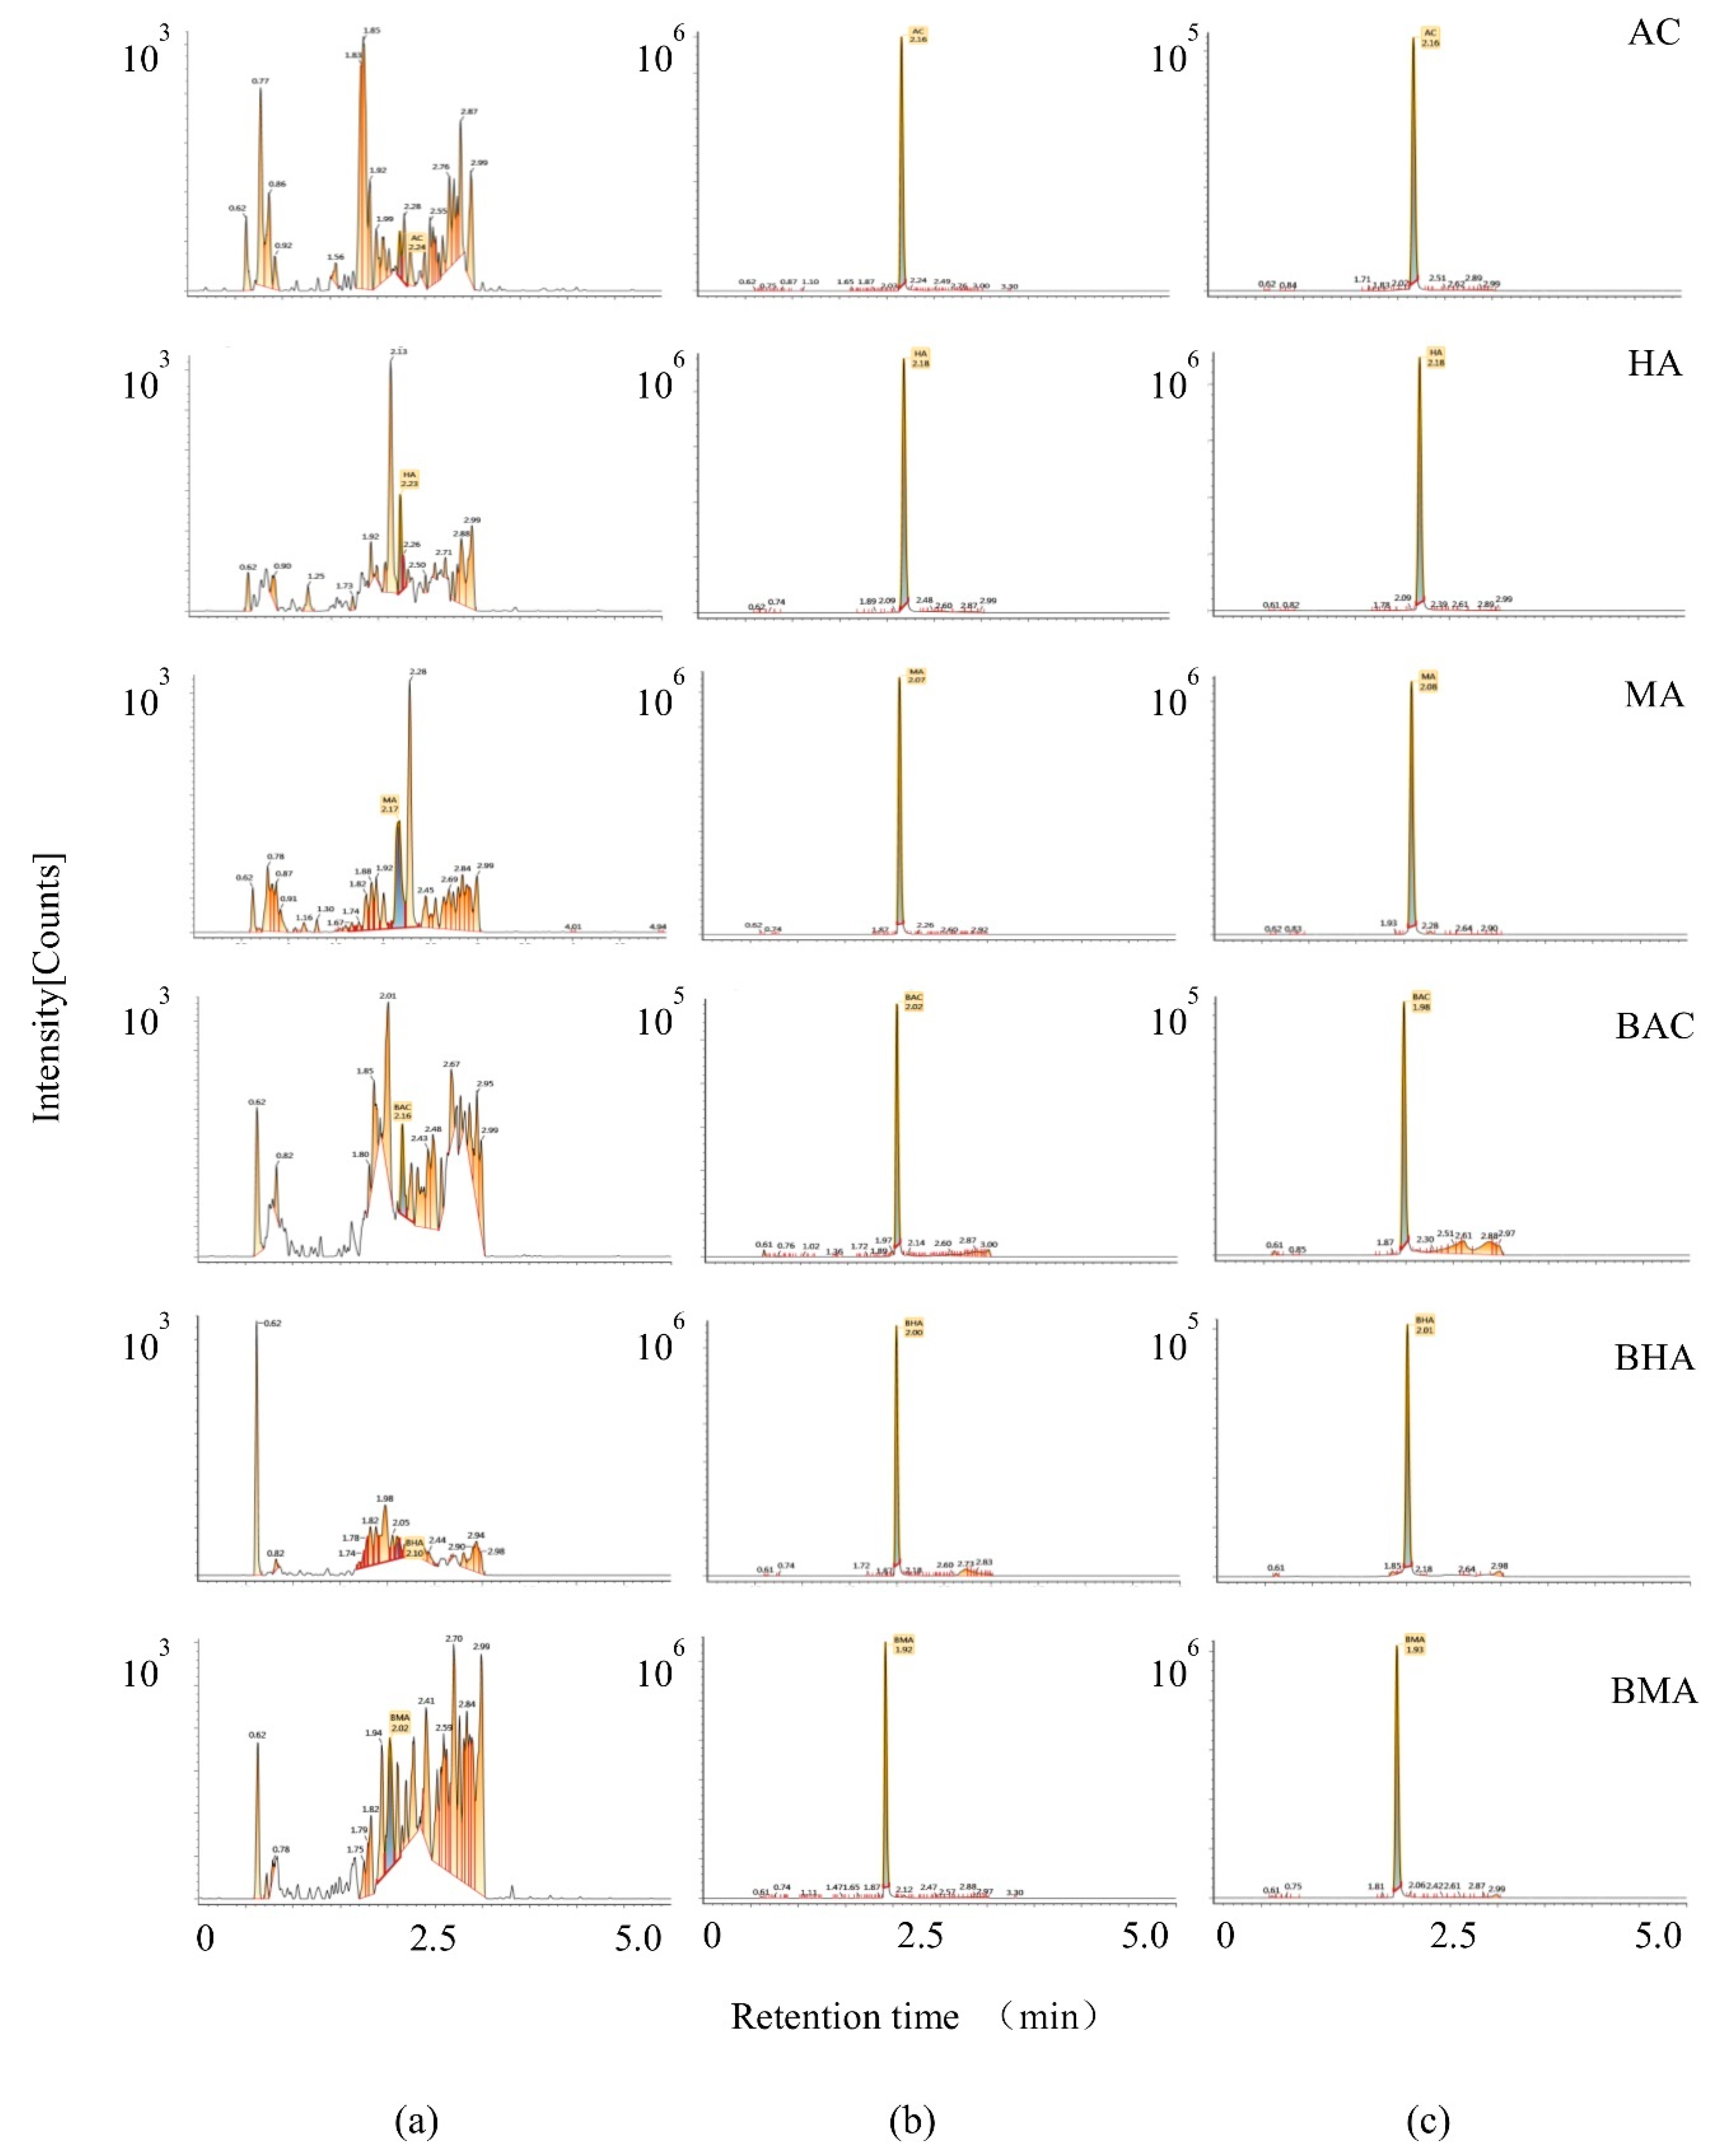
2.1.1. Selectivity
2.1.2. Sensitivity and Linearity
2.1.3. Accuracy and Precision
2.1.4. Stability
2.1.5. Extraction Recovery and Matrix Effect
2.2. Pharmacokinetic Study
2.3. Cell Toxicity of AC on Normal and LQTS hiPSC-CMs
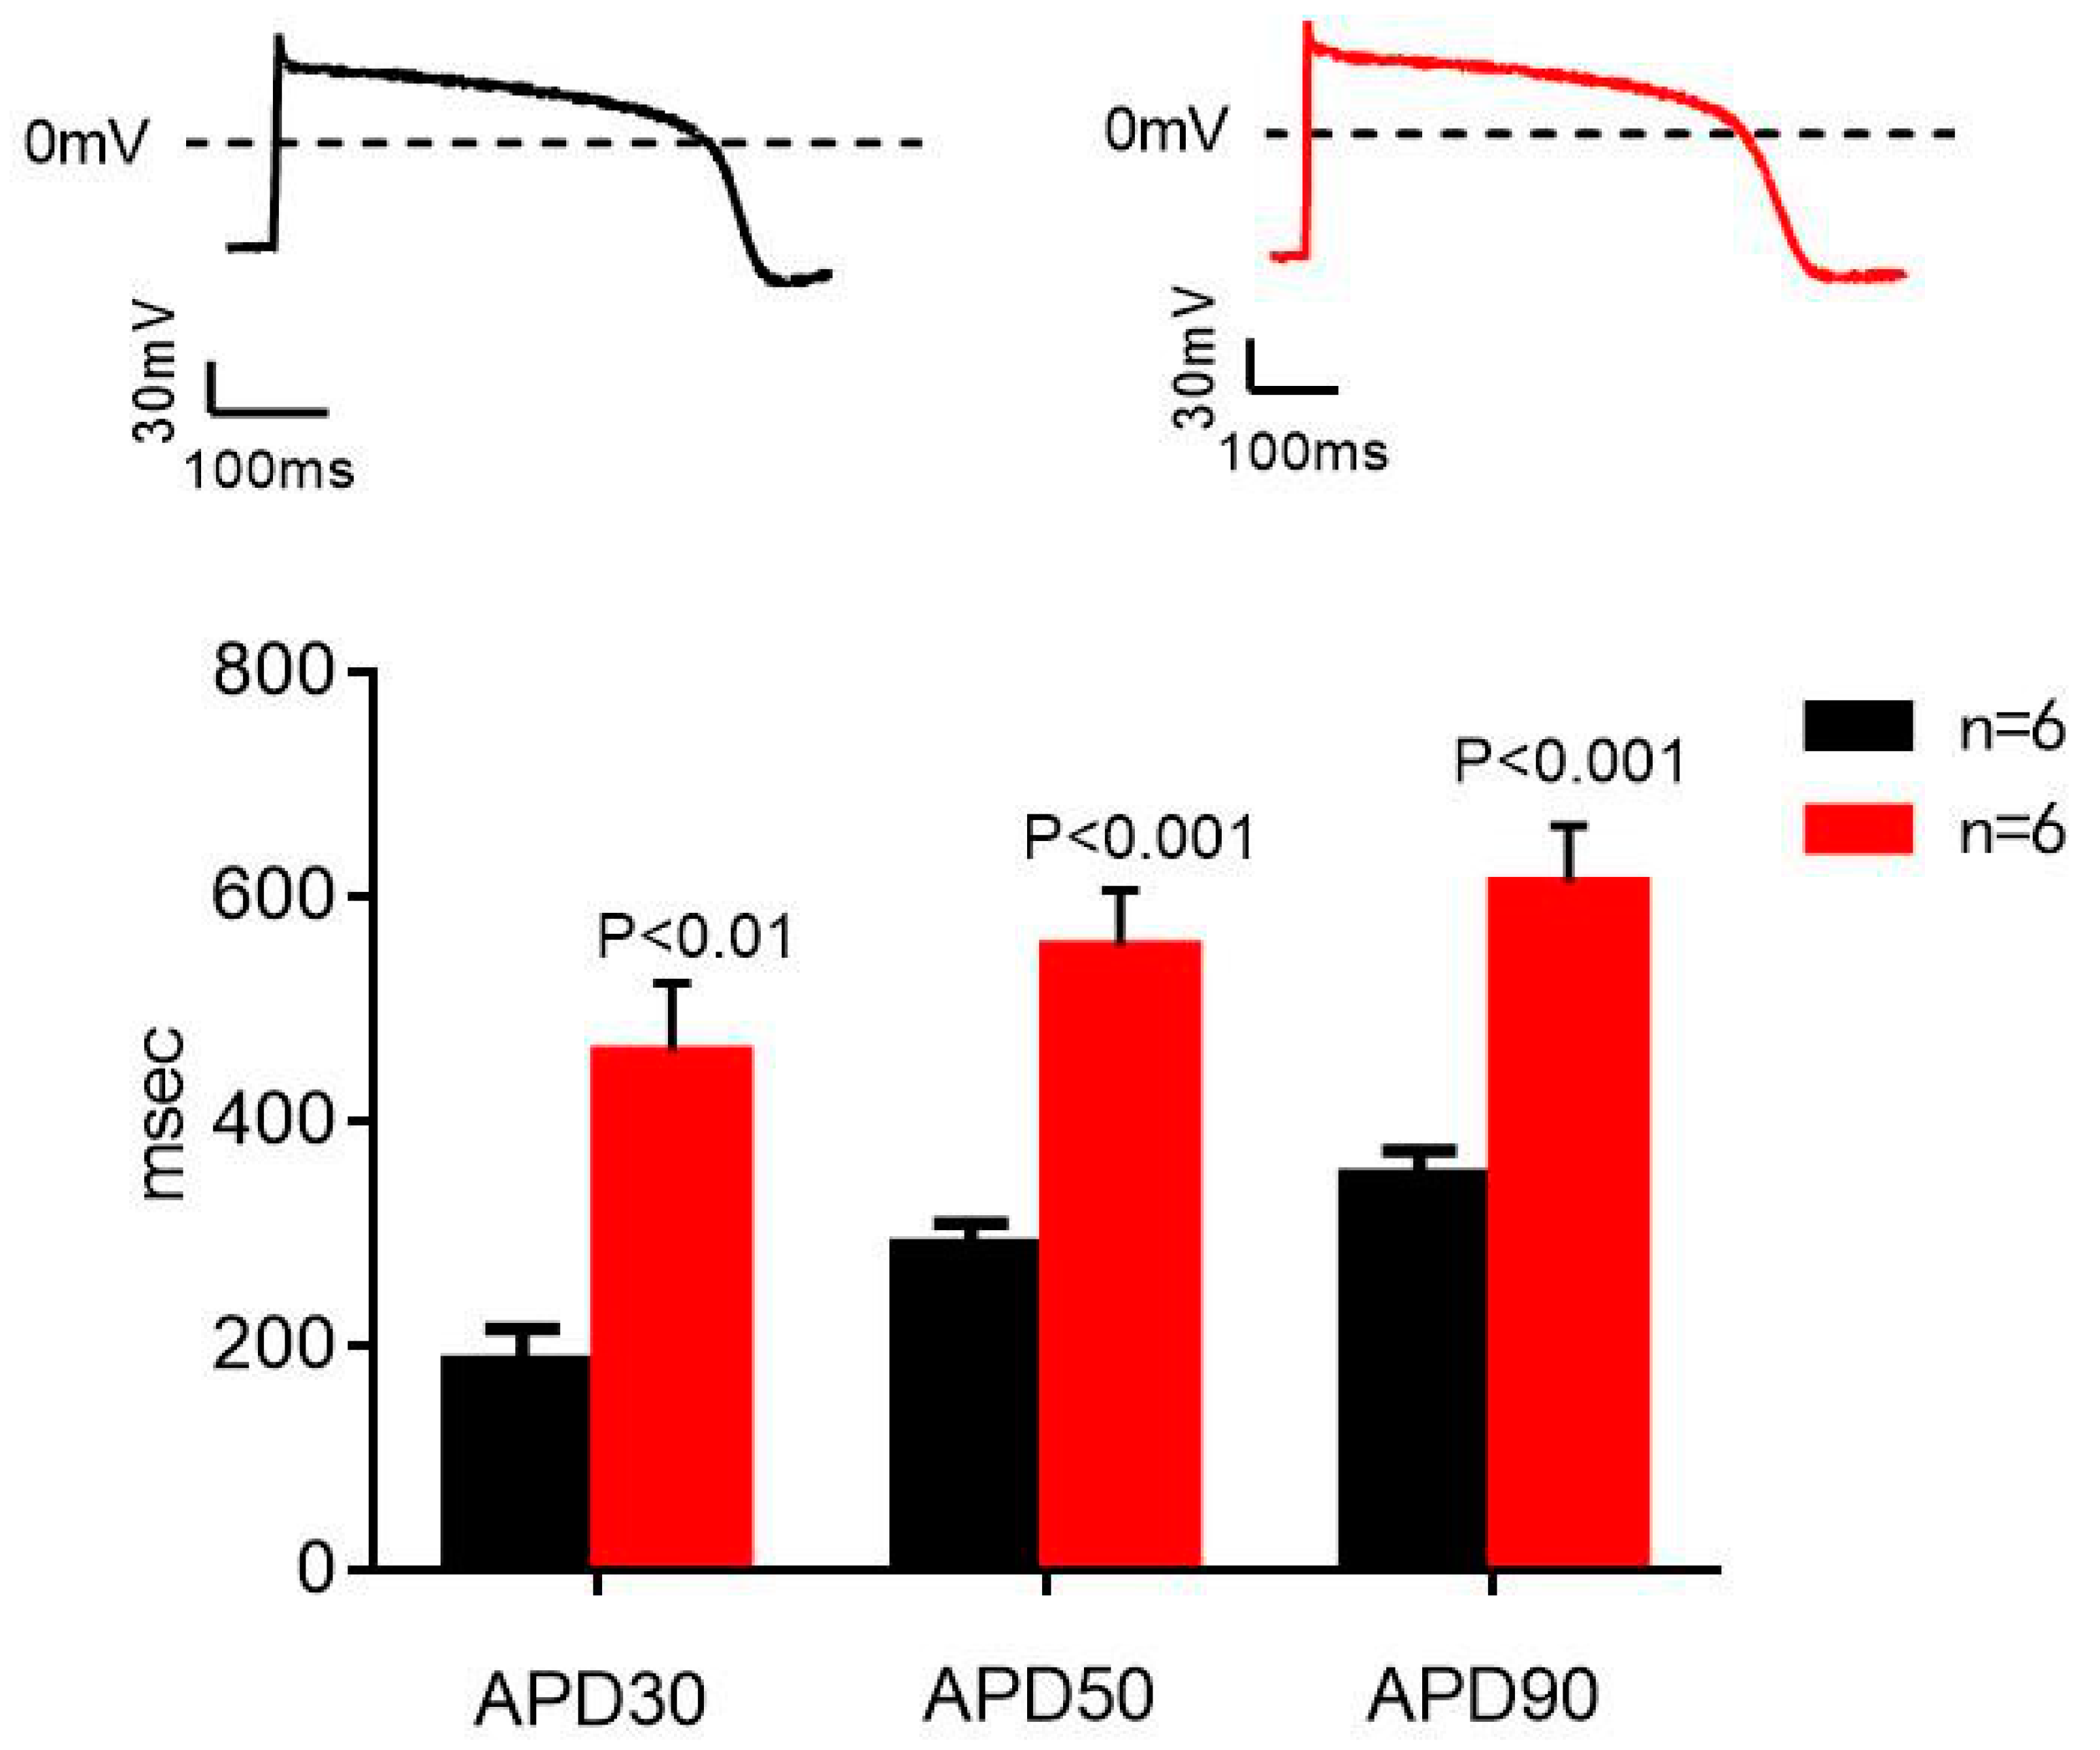
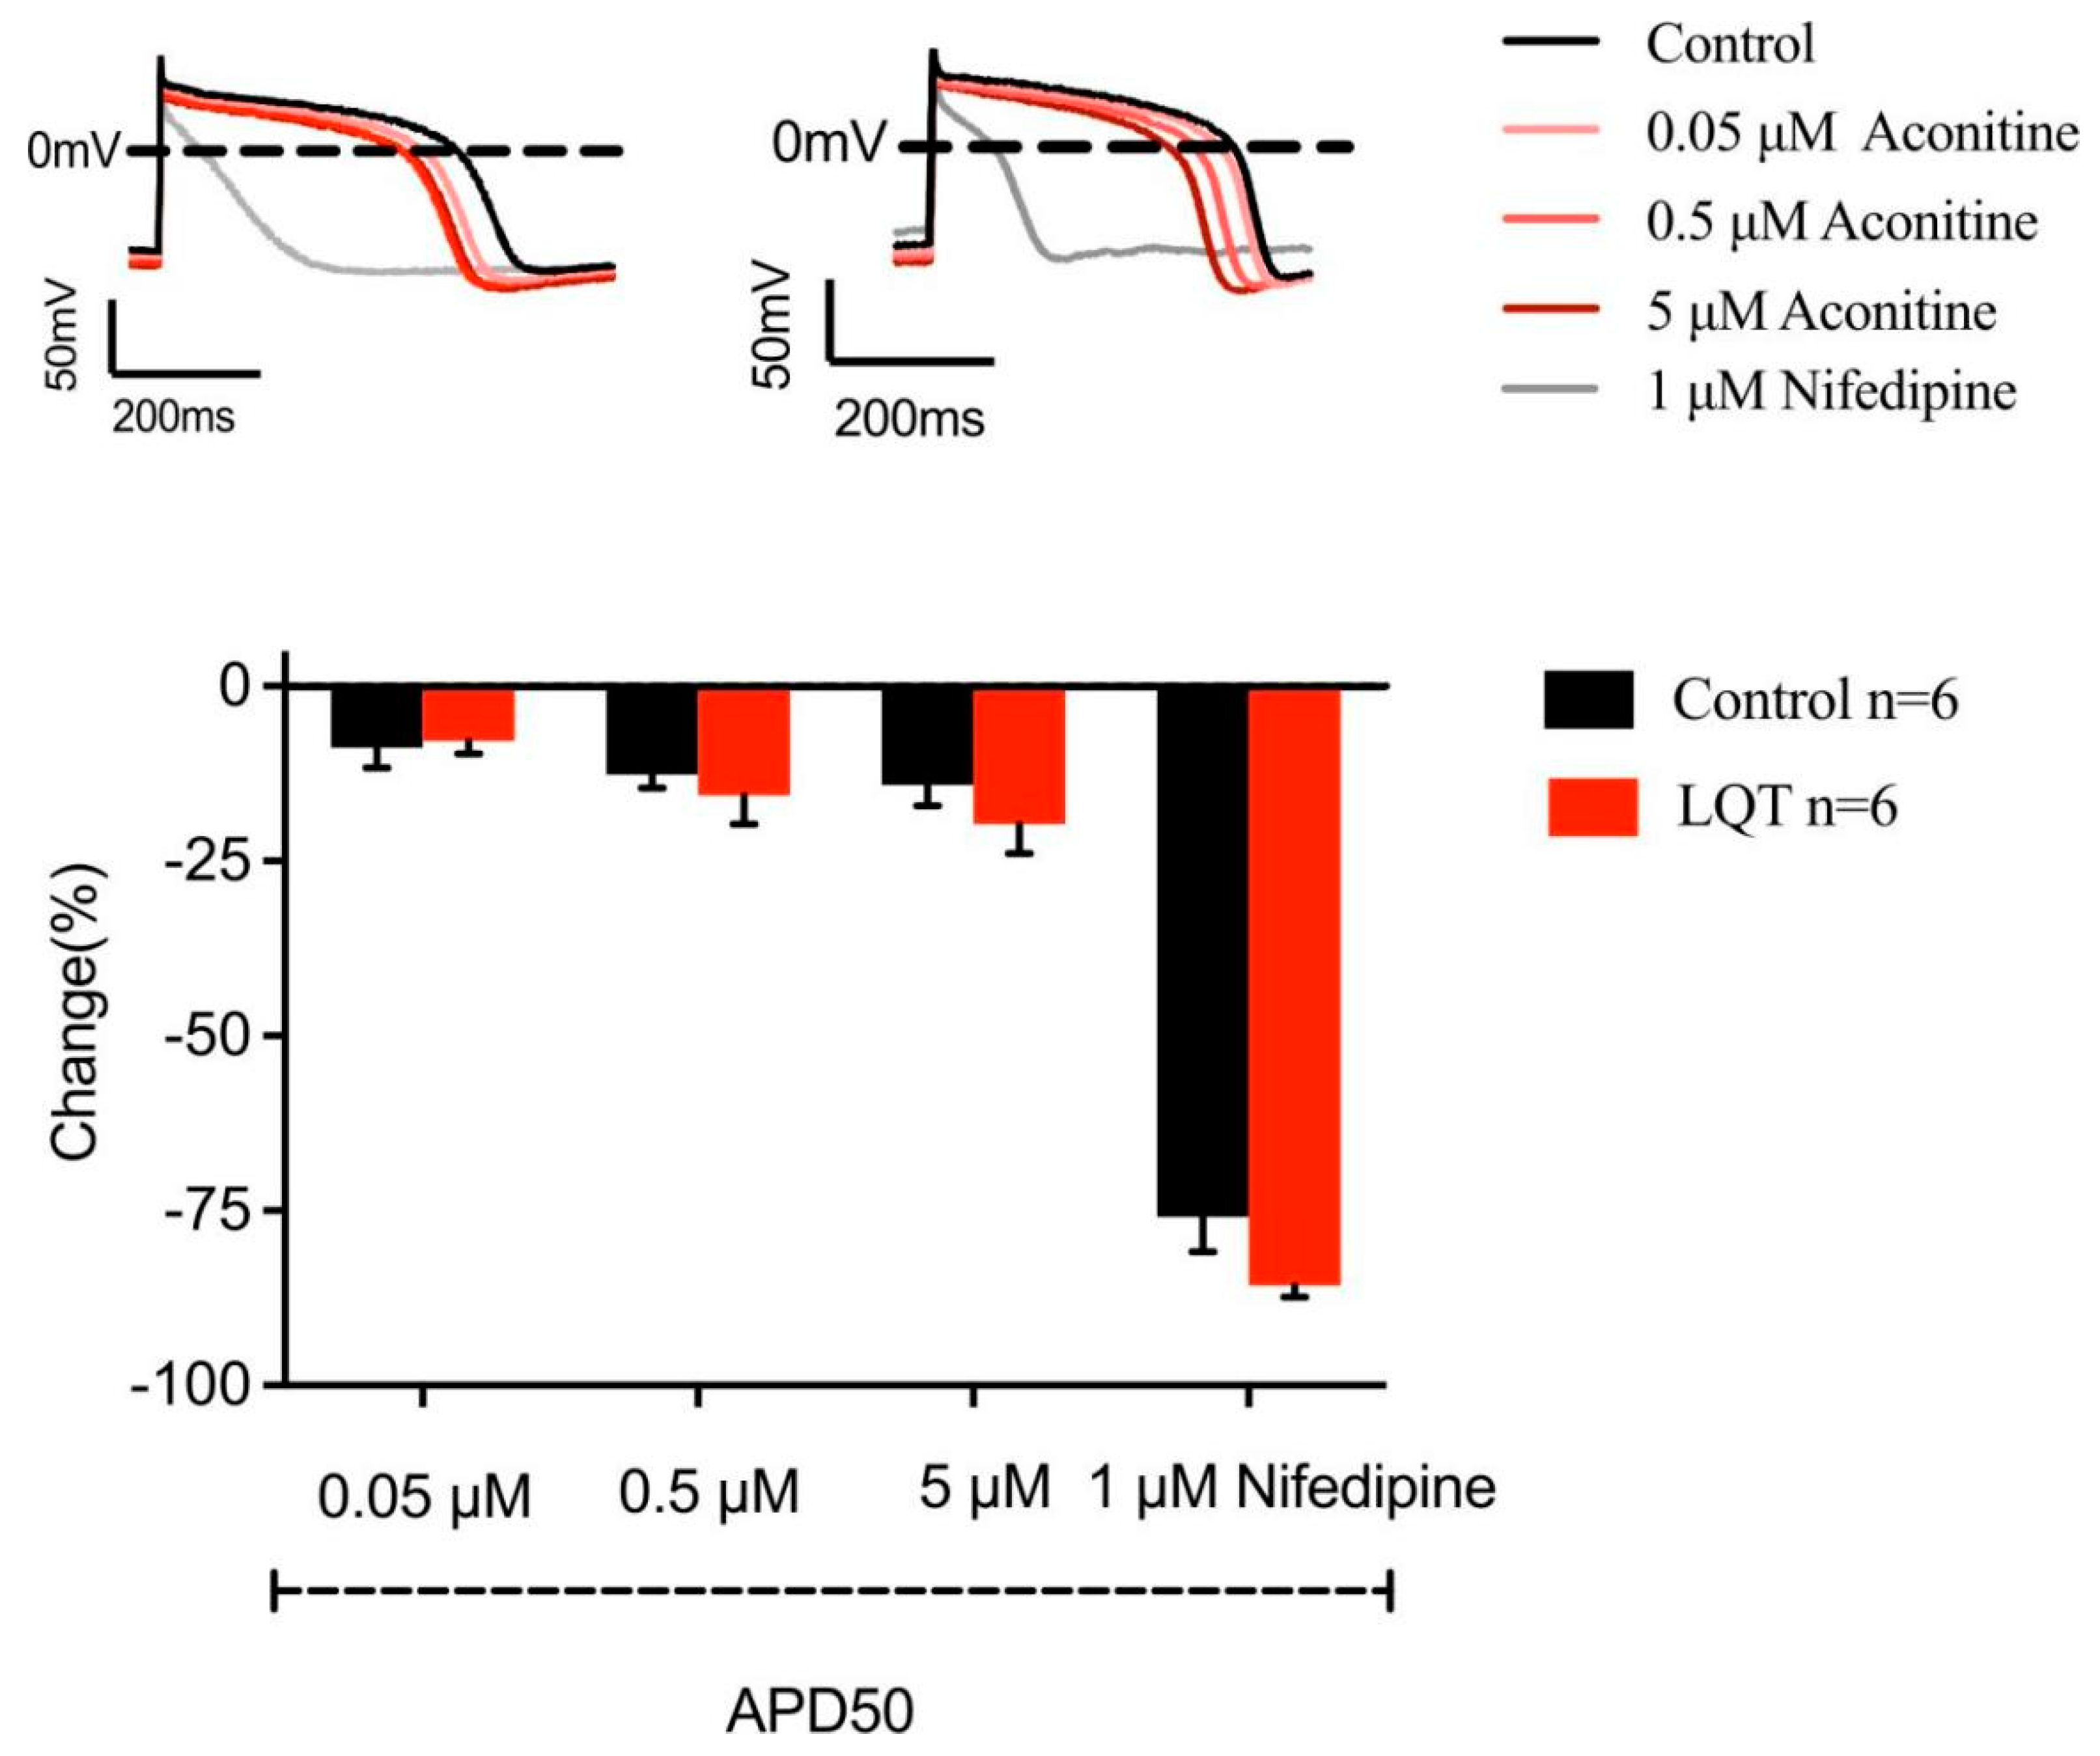
2.4. Effects of AC on APD in Normal and LQT Syndrome hiPSC-CMs
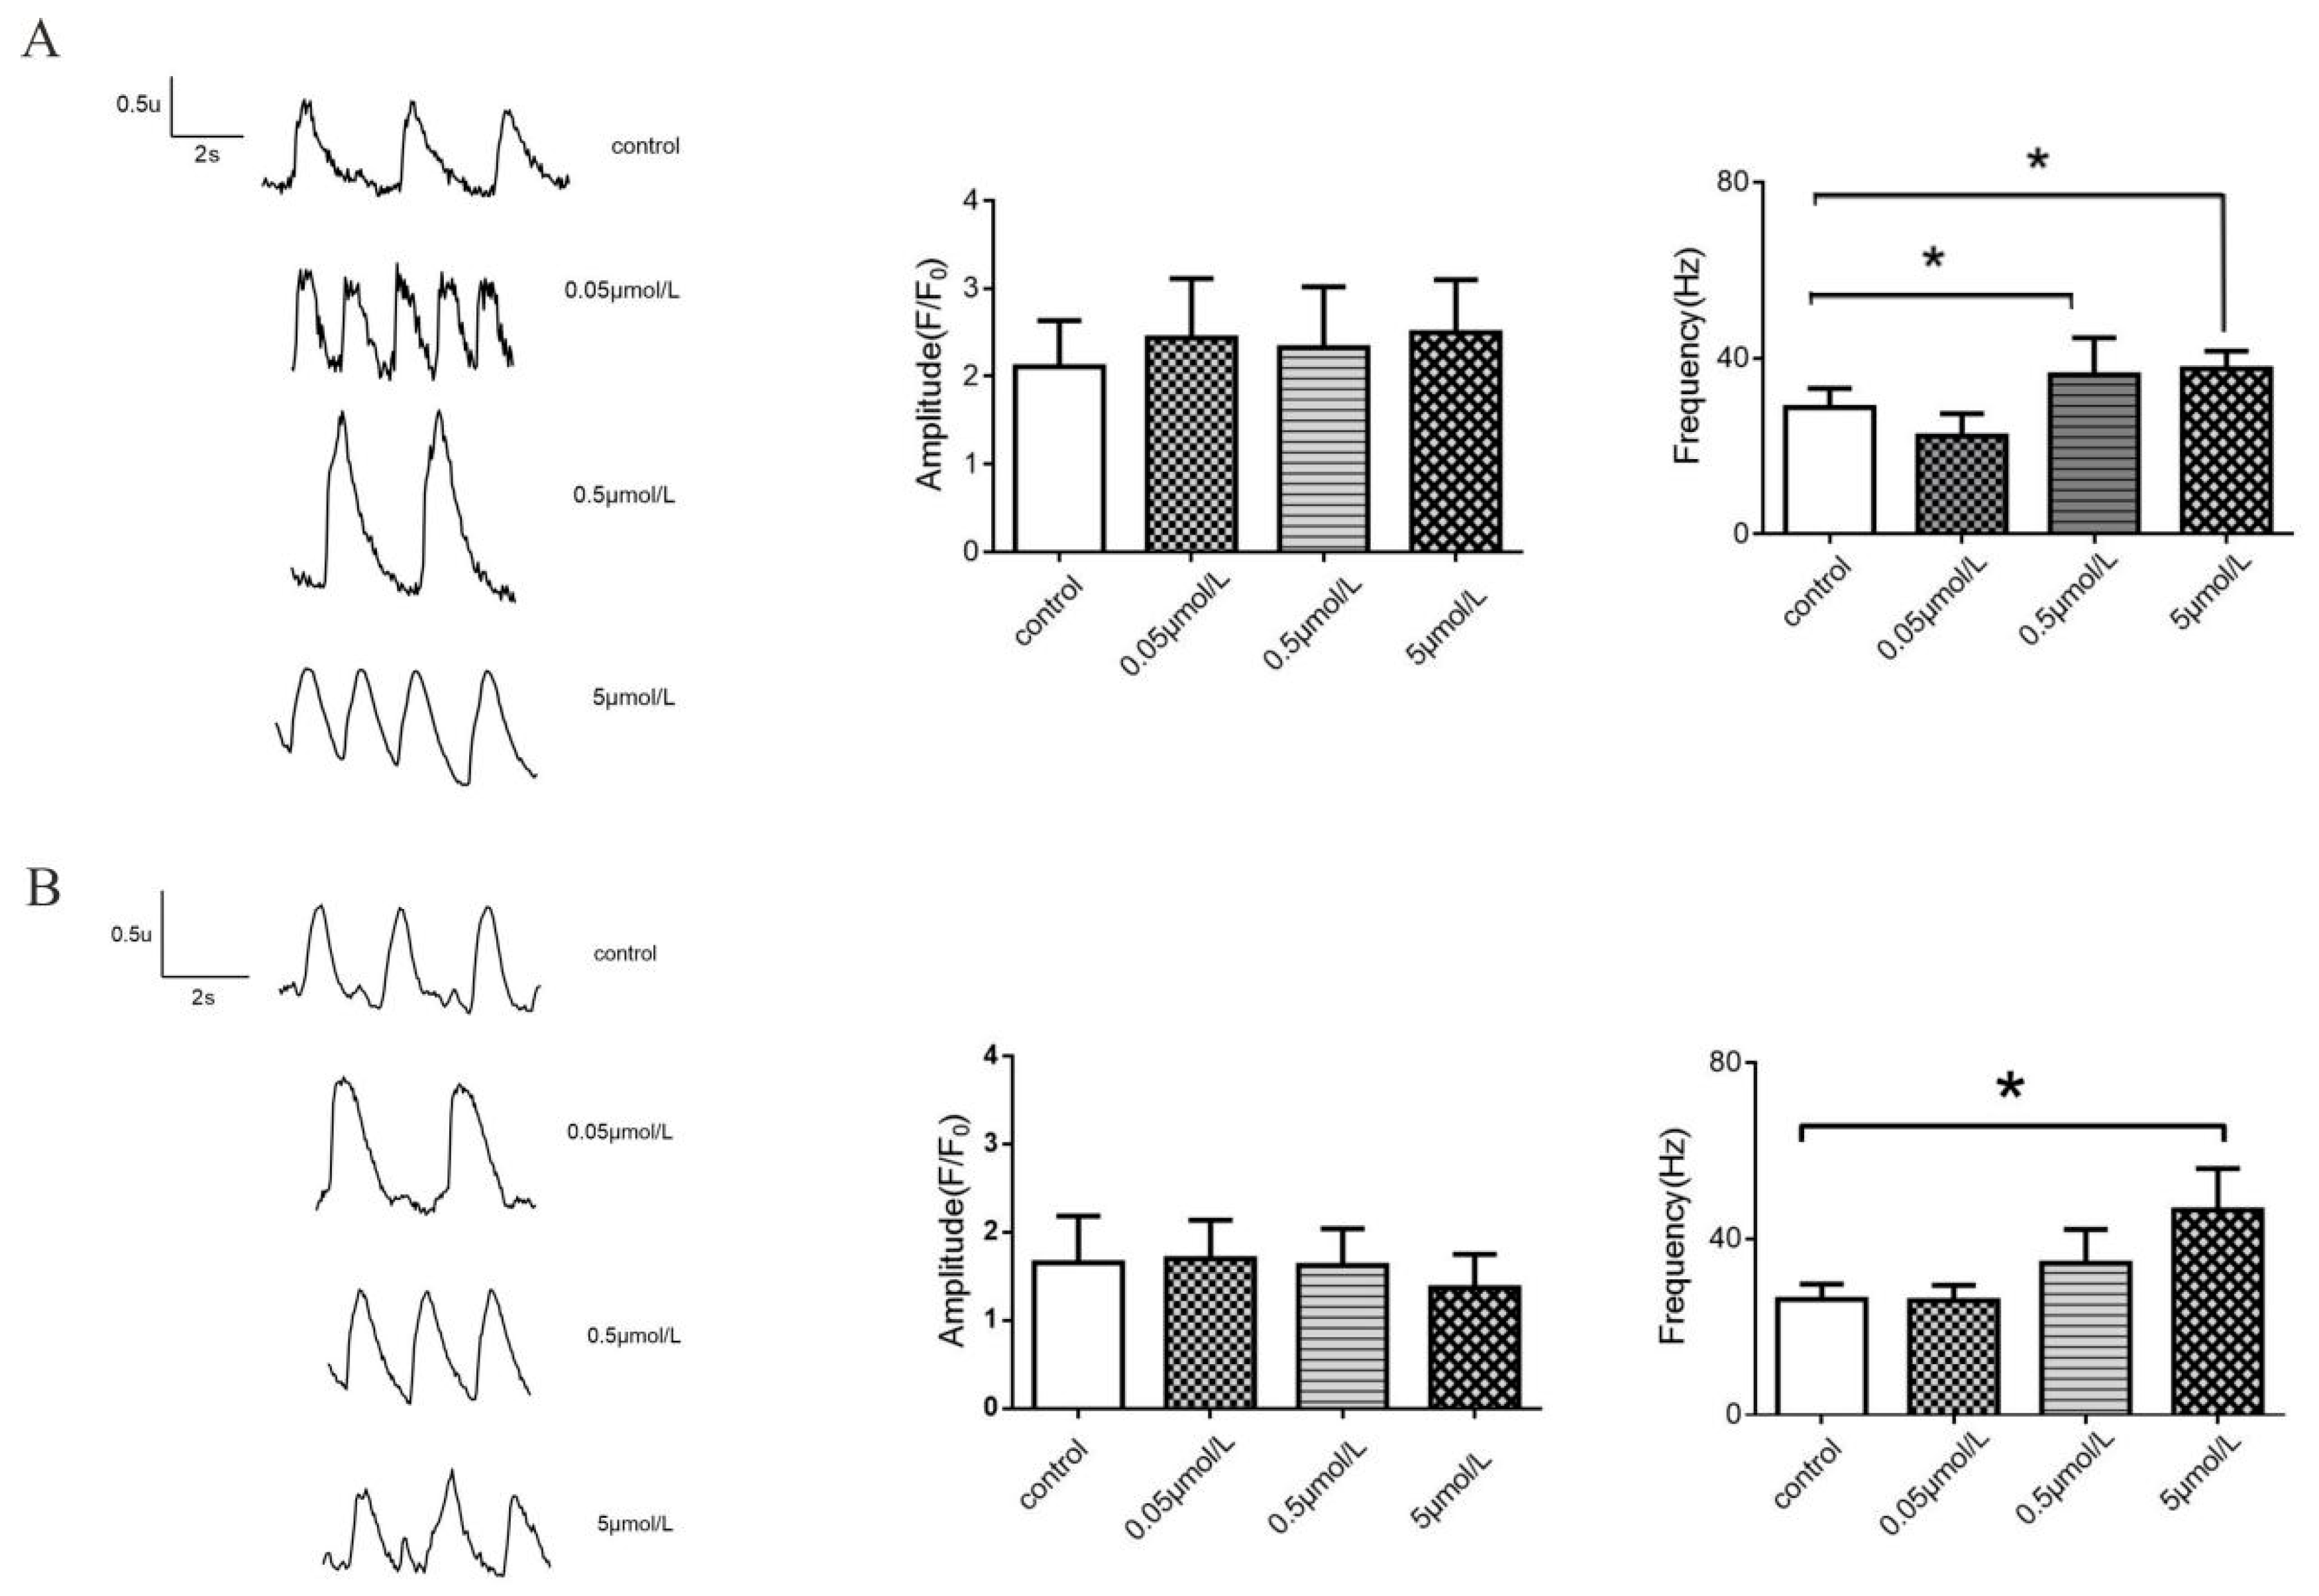
2.5. Effects of AC on Calcium Transients in Normal and LQT Syndrome hiPSC-CMs
2.6. Effects of AC on L-Type Calcium Current in Normal and LQTS hiPSC-CMs
3. Discussion
4. Materials and Methods
4.1. Materials and Instruments
4.2. Preparation of Fu Zi Extracts
4.3. Conditions of Chromatographic and Mass Spectrometry
4.4. Preparation of Calibration Standards and Quality Control Samples
4.5. Pre-Treatment of Plasma Samples
4.6. Method Validation
4.7. Animals and Treatments
4.8. Culture and Maintenance of Undifferentiated hiPSCs
4.9. Impedance Beating Recordings
4.10. Ca2+ Imaging
4.11. Patch-Clamp Recordings of hiPSCs
4.12. Compound Solutions in Drug Assay
4.13. Statistical Analysis
5. Conclusions
Author Contributions
Funding
Informed Consent Statement
Data Availability Statement
Acknowledgments
Conflicts of Interest
Abbreviations
| Aconiti Lateralis Radix Praeparata | Fu Zi |
| Aconitine | AC |
| Acquired Long QT Syndrome | aLQTS |
| AP duration | APD |
| Benzoylaconine | BAC |
| Benzoylhypaconine | BHA |
| Benzoylmesaconine | BMA |
| Calcium-induced calcium release | CICR |
| Concentration | Conc. |
| Congenital long QT syndrome | cLQTS |
| Cytochrome P450 | CYP450 |
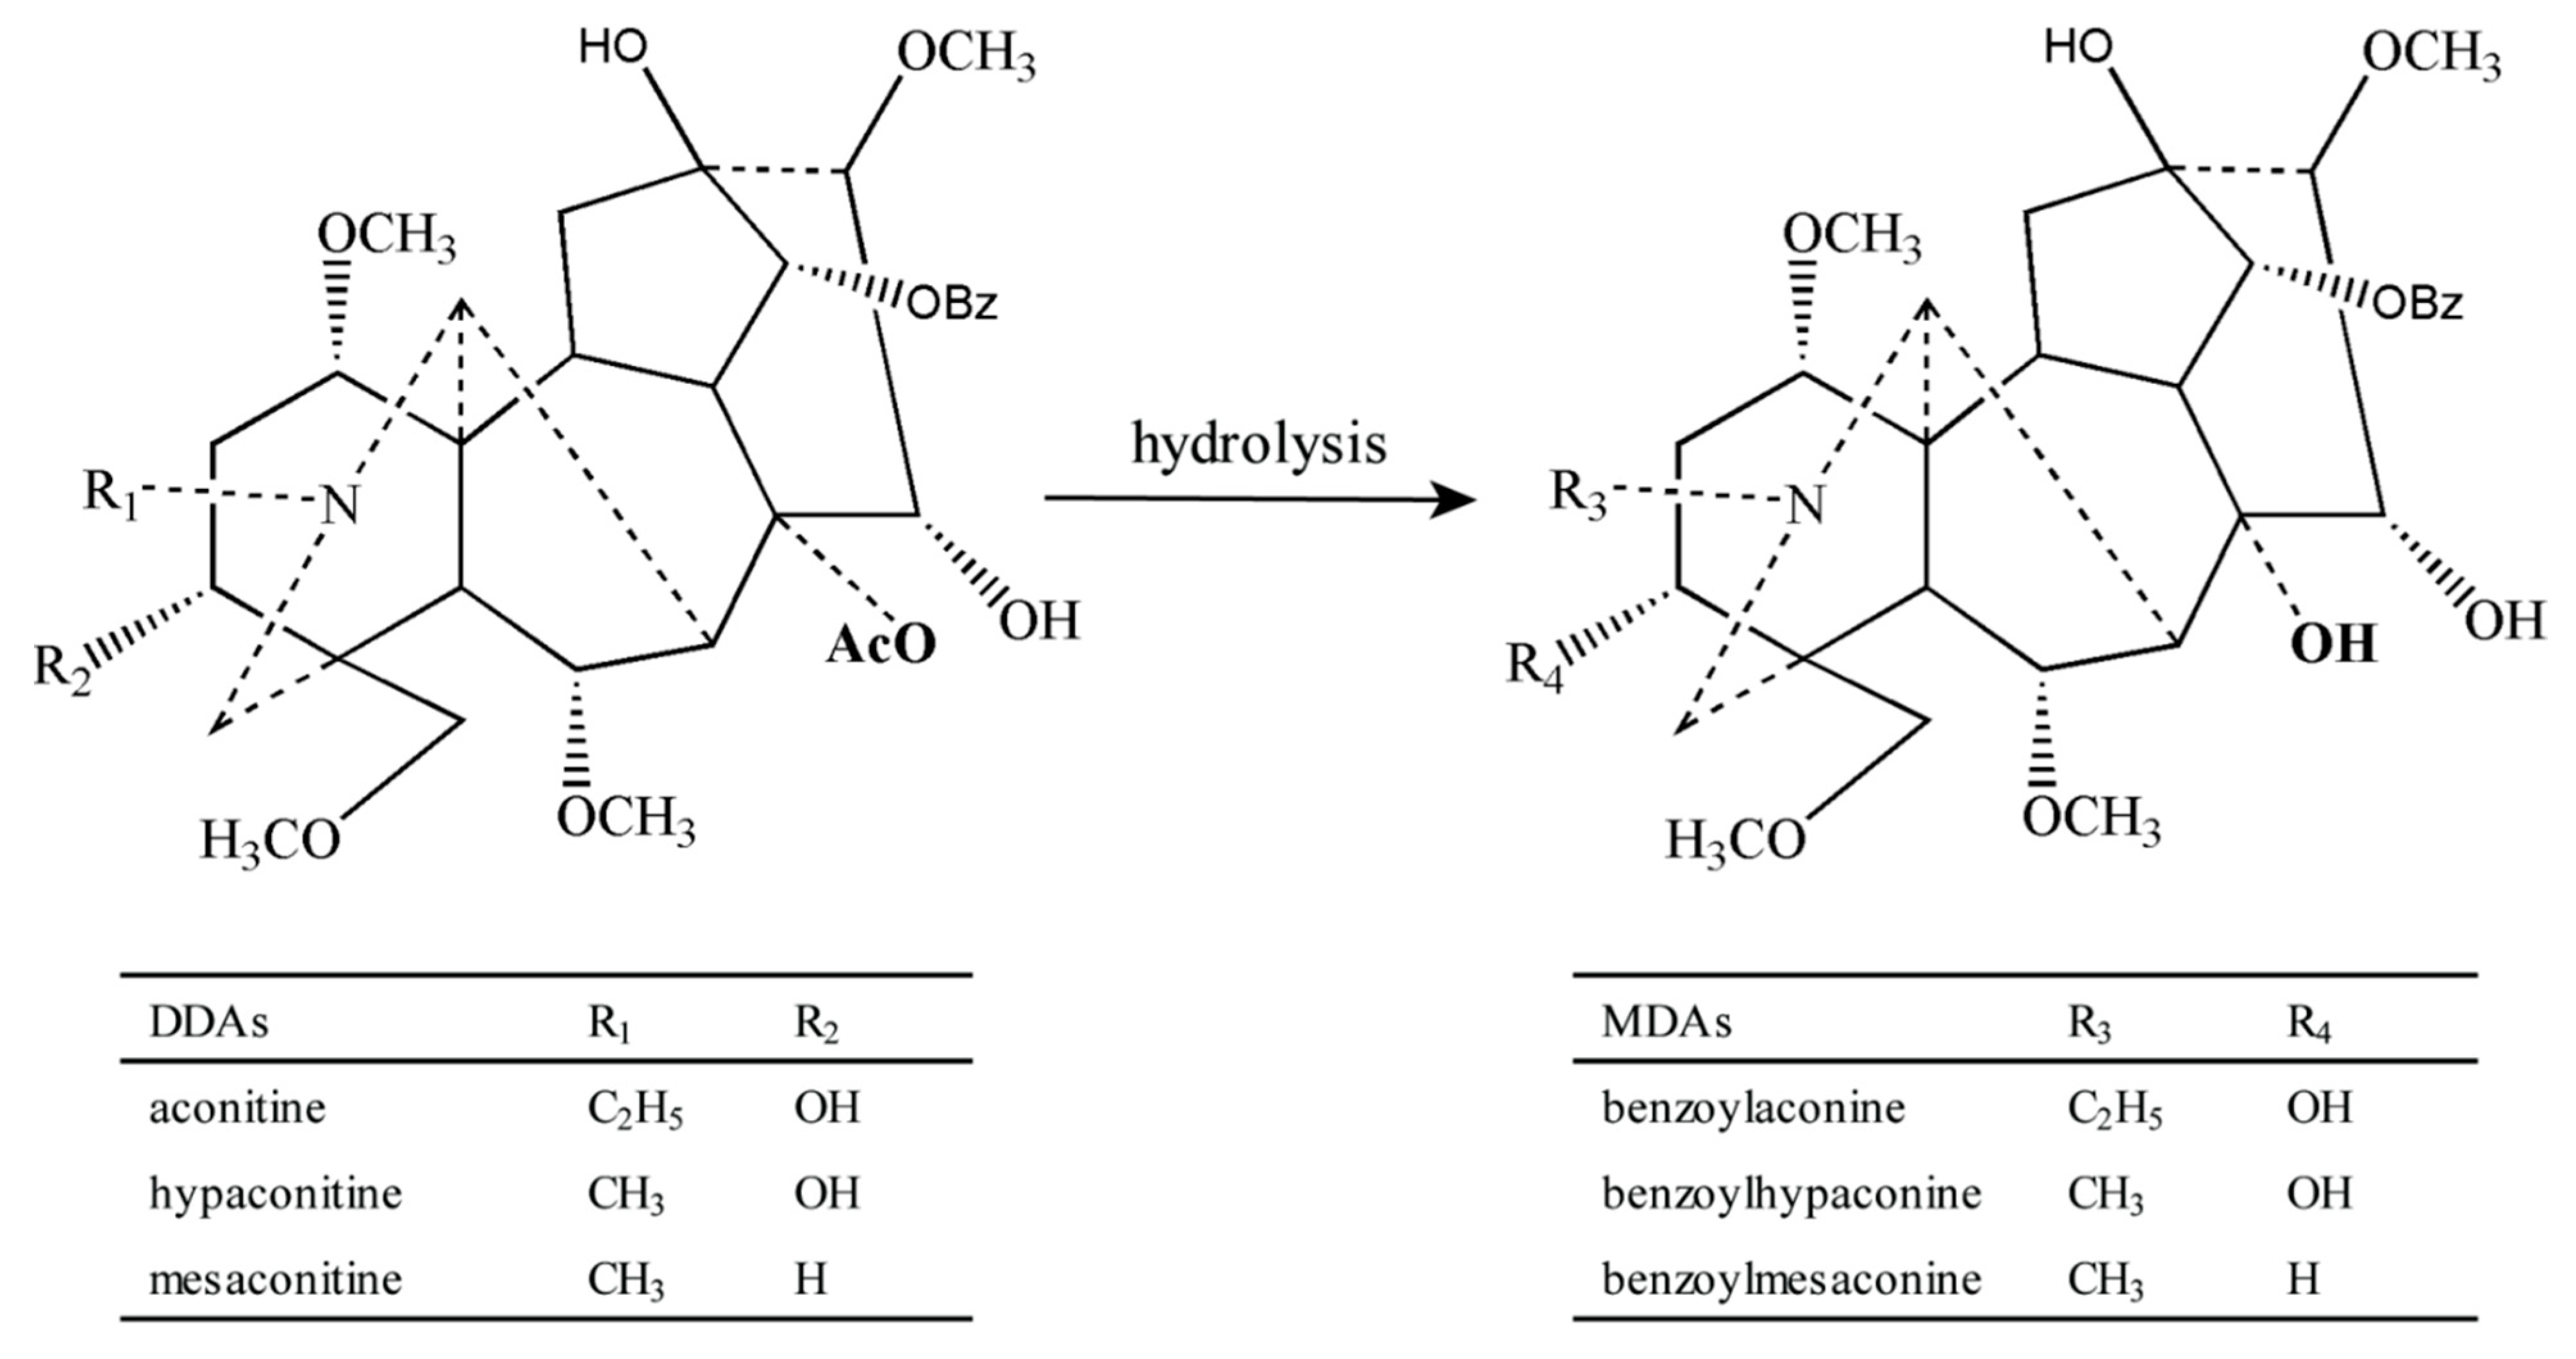
| Diester-diterpene alkaloids | DDAs |
| Monoester-diterpene alkaloids | MDAs |
| Hypaconitine | HA |
| Half life time | t1/2 |
| Human induced pluripotent stem cells | hiPSCs |
| Long QT syndrome | LQTS |
| Lower limit of quantitation | LLOQ |
| Limit of detection | LOD |
| Maximum concentration | Cmax |
| Mesaconitine | MA |
| Multiple reaction monitoring | MRM |
| Panax ginseng | P. ginseng |
| Peak time | Tmax |
| Relative standard deviation | RSD |
| Relative error | RE |
| The area under the curve | AUC |
| Traditional Chinese Medicine | TCM |
| Ultra performance liquid chromatography tandem mass spectrometry | UPLC-MS/MS |
| Volume of distribution | Vz/F |
References
- Qu, L.; Zou, W.; Zhou, Z.; Zhang, T.; Greef, J.; Wang, M. Non-European traditional herbal medicines in Europe: A community herbal monograph perspective. J. Ethnopharmacol. 2014, 156, 107–114. [Google Scholar] [CrossRef] [PubMed]
- Huang, S.H.; Tung, C.W.; Fülöp, F.; Li, J.H. Developing a QSAR model for hepatotoxicity screening of the active compounds in traditional Chinese medicines. Food Chem. Toxicol. 2015, 78, 71–77. [Google Scholar] [CrossRef] [PubMed]
- Ma, Y.; Zhou, K.; Fan, J.; Sun, S. Traditional Chinese medicine: Potential approaches from modern dynamical complexity theories. Front. Med. 2016, 10, 28–32. [Google Scholar] [CrossRef] [PubMed]
- Zhou, G.; Tang, L.; Zhou, X.; Wang, T.; Kou, Z.; Wang, Z. A review on phytochemistry and pharmacological activities of the processed lateral root of Aconitum carmichaelii Debeaux. J. Ethnopharmacol. 2015, 160, 173–193. [Google Scholar] [CrossRef] [PubMed]
- Wu, J.J.; Guo, Z.Z.; Zhu, Y.F.; Huang, Z.-J.; Gong, X.; Li, Y.-H.; Son, W.-J.; Li, X.-Y.; Lou, Y.-M.; Zhu, L.-J.; et al. A systematic review of pharmacokinetic studies on herbal drug Fuzi: Implications for Fuzi as personalized medicine. Phytomedicine 2018, 44, 187–203. [Google Scholar] [CrossRef] [PubMed]
- Singhuber, J.; Zhu, M.; Prinz, S.; Kopp, B. Aconitum in traditional Chinese medicine: A valuable drug or an unpredictable risk? J. Ethnopharmacol. 2009, 126, 18–30. [Google Scholar] [CrossRef]
- Gao, T.; Bi, H.; Ma, S.; Lu, J. The antitumor and immunostimulating activities of water soluble polysaccharides from Radix Aconiti, Radix Aconiti Lateralis and Radix Aconiti Kusnezoffii. Nat. Prod. Commun. 2010, 5, 447–455. [Google Scholar] [CrossRef] [Green Version]
- Gupta, R.; Alcantara, R.; Ranchal, P.; Martin, A.; Aronow, W.S.; Garg, J. Aconite Poisoning-Induced Ventricular Arrhythmia. Am. J. Ther. 2020, 29, e103–e105. [Google Scholar] [CrossRef]
- Bisset, N.G. Arrow poisons in China. Part II. Aconitum—Botany, chemistry, and pharmacology. J. Ethnopharmacol. 1981, 4, 247–336. [Google Scholar] [CrossRef]
- Yu, B.; Cao, Y.; Xiong, Y.K. Pharmacokinetics of aconitine-type alkaloids after oral administration of Fuzi (Aconiti Lateralis Radix Praeparata) in rats with chronic heart failure by microdialysis and ultra-high performance liquid chromatography-tandem mass spectrometry. J. Ethnopharmacol. 2015, 165, 173–179. [Google Scholar] [CrossRef]
- Li, S.; Yu, L.; Shi, Q.; Liu, Y.; Zhang, Y.; Wang, S.; Lai, X. An insight into current advances on pharmacology, pharmacokinetics, toxicity and detoxification of aconitine. Biomed. Pharmacother. 2022, 151, 113115. [Google Scholar] [CrossRef] [PubMed]
- Gao, Y.; Fan, H.; Nie, A.; Yang, K.; Xing, H.; Gao, Z.; Yang, L.; Wang, Z.; Zhang, L. Aconitine: A review of its pharmacokinetics, pharmacology, toxicology and detoxification. J. Ethnopharmacol. 2022, 293, 115270. [Google Scholar] [CrossRef]
- Feng, W.; Liu, J.; Zhang, D.; Tan, Y.; Cheng, H.; Peng, C. Revealing the efficacy-toxicity relationship of Fuzi in treating rheumatoid arthritis by systems pharmacology. Sci. Rep. 2021, 11, 23083. [Google Scholar] [CrossRef] [PubMed]
- Yang, Z.; Lin, Y.; Gao, L.; Zhou, Z.; Wang, S.; Dong, D.; Wu, B. Circadian clock regulates metabolism and toxicity of Fuzi (lateral root of Aconitum carmichaeli Debx) in mice. Phytomedicine 2020, 67, 153161. [Google Scholar] [CrossRef] [PubMed]
- Yang, L.; Huang, G.Y.; Wang, Y.G.; Han, B.Q.; Zheng, B.; Zhu, J.M.; Gao, S.; Gao, Y. Efficacy of Renshen (Radix Ginseng) plus Fuzi (Radix Aconiti Lateralis Preparata) on myocardial infarction by enhancing autophagy in rat. J. Tradit. Chin. Med. 2021, 41, 909–918. [Google Scholar] [CrossRef]
- Wu, X.; Zhang, H.; Fan, S.; Zhang, Y.; Yang, Z.; Fan, S.; Zhuang, P.; Zhang, Y. Quality markers based on biological activity: A new strategy for the quality control of traditional Chinese medicine. Phytomedicine 2018, 44, 103–108. [Google Scholar] [CrossRef]
- Kang, T.; Dou, D.; Xu, L. Establishment of a quality marker (Q-marker) system for Chinese herbal medicines using burdock as an example. Phytomedicine 2019, 54, 339–346. [Google Scholar] [CrossRef]
- Zhang, P.; Kong, D.; Du, Q.; Zhao, J.; Li, Q.; Zhang, J.; Li, T.; Ren, L. A conscious rat model involving bradycardia and hypotension after oral administration: A toxicokinetical study of aconitine. Xenobiotica 2017, 47, 515–525. [Google Scholar] [CrossRef]
- Liu, X.; Li, H.; Song, X.; Qin, K.; Guo, H.; Wu, L.; Cai, H.; Cai, B. Comparative pharmacokinetics studies of benzoylhypaconine, benzoylmesaconine, benzoylaconine and hypaconitine in rats by LC-MS method after administration of Radix Aconiti Lateralis Praeparata extract and Dahuang Fuzi Decoction. Biomed. Chromatogr. 2014, 28, 966–973. [Google Scholar] [CrossRef]
- Ye, L.; Gao, S.; Feng, Q.; Liu, W.; Yang, Z.; Hu, M.; Liu, Z. Development and validation of a highly sensitive UPLC-MS/MS method for simultaneous determination of aconitine, mesaconitine, hypaconitine, and five of their metabolites in rat blood and its application to a pharmacokinetics study of aconitine, mesaconitine, and hypaconitine. Xenobiotica 2012, 42, 518–525. [Google Scholar] [CrossRef]
- Tang, L.; Gong, Y.; Lv, C.; Ye, L.; Liu, L.; Liu, Z. Pharmacokinetics of aconitine as the targeted marker of Fuzi (Aconitum carmichaeli) following single and multiple oral administrations of Fuzi extracts in rat by UPLC/MS/MS. J. Ethnopharmacol. 2012, 141, 736–741. [Google Scholar] [CrossRef] [PubMed]
- Pan, Z.; Ebert, A.; Liang, P. Human-induced pluripotent stem cells as models for rare cardiovascular diseases: From evidence-based medicine to precision medicine. Pflug. Arch. 2021, 473, 1151–1165. [Google Scholar] [CrossRef] [PubMed]
- Sugrue, A.; van Zyl, M.; Enger, N.; Mancl, K.; Eidem, B.W.; Oh, J.K.; Bos, J.M.; Asirvatham, S.J.; Ackerman, M.J. Echocardiography-Guided Risk Stratification for Long QT Syndrome. J. Am. Coll. Cardiol. 2020, 76, 2834–2843. [Google Scholar] [CrossRef] [PubMed]
- Matsuda, S.; Ohnuki, Y.; Okami, M.; Ochiai, E.; Yamada, S.; Takahashi, K.; Osawa, M.; Okami, K.; Iida, M.; Mochizuki, H. Jervell and Lange-Nielsen syndrome with novel KCNQ1 and additional gene mutations. Hum. Genome Var. 2020, 7, 34. [Google Scholar] [CrossRef] [PubMed]
- Szperl, M.; Kozicka, U.; Kosiec, A.; Kukla, P.; Roszczynko, M.; Biernacka, E.K. Identification novel LQT syndrome-associated variants in Polish population and genotype-phenotype correlations in eight families. J. Appl. Genet. 2018, 59, 463–469. [Google Scholar] [CrossRef] [Green Version]
- Li, Y.; Ning, J.; Wang, Y.; Wang, C.; Sun, C.; Huo, X.; Yu, Z.; Feng, L.; Zhang, B.; Tian, X.; et al. Drug interaction study of flavonoids toward CYP3A4 and their quantitative structure activity relationship (QSAR) analysis for predicting potential effects. Toxicol. Lett. 2018, 294, 27–36. [Google Scholar] [CrossRef]
- You, G.; Li, H.; Zheng, F.; Liu, Y.; Wang, M.; Sun, L.; Mou, J.; Ren, X. Characteristic profiling of Aconiti Lateralis Radix for distinguishing it from compatible herbal pair using UPLC-Q-TOF-MS coupled with chemometrics. Biomed. Chromatogr. 2022, 36, e5256. [Google Scholar] [CrossRef]
- Yang, L.; Wang, Y.; Xu, H.; Huang, G.; Zhang, Z.; Ma, Z.; Gao, Y. Panax ginsengInhibits Metabolism of Diester Alkaloids by Downregulating CYP3A4 Enzyme Activity via the Pregnane X Receptor. Evid. Based Complement. Altern. Med. 2019, 2019, 3508658. [Google Scholar] [CrossRef] [Green Version]
- Zhou, W.; Liu, H.; Qiu, L.-Z.; Yue, L.-X.; Zhang, G.-J.; Deng, H.-F.; Ni, Y.-H.; Gao, Y. Cardiac efficacy and toxicity of aconitine: A new frontier for the ancient poison. Med. Res. Rev. 2021, 41, 1798–1811. [Google Scholar] [CrossRef]
- Tai, Y.T.; But, P.P.; Young, K.; Lau, C.P. Cardiotoxicity after accidental herb-induced aconite poisoning. Lancet 1992, 340, 1254–1256. [Google Scholar] [CrossRef]
- Tan, Y.; Li, J.; Liu, X.; Ko, J.; He, X.; Lu, C.; Liu, Z.; Zhao, H.; Xiao, C.; Niu, X.; et al. Deciphering the differential toxic responses of Radix aconiti lateralis praeparata in healthy and hydrocortisone-pretreated rats based on serum metabolic profiles. J. Proteome Res. 2013, 12, 513–524. [Google Scholar] [CrossRef] [PubMed]
- Zhang, H.; Wu, Q.; Li, W.; Sun, S.; Zhang, W.; Zhu, Z.; Zhang, G.; Chai, Y. Absorption and metabolism of three monoester-diterpenoid alkaloids in Aconitum carmichaeli after oral administration to rats by HPLC-MS. J. Ethnopharmacol. 2014, 154, 645–652. [Google Scholar] [CrossRef] [PubMed]
- Zhang, M.; Peng, C.S.; Li, X.B. Human intestine and liver microsomal metabolic differences between C19-diester and monoester diterpenoid alkaloids from the roots of Aconitum carmichaelii Debx. Toxicol. Vitro 2017, 45 Pt 3, 318–333. [Google Scholar] [CrossRef] [PubMed]
- Mazzanti, A.; Trancuccio, A.; Kukavica, D.; Pagan, E.; Wang, M.; Mohsin, M.; Peterson, D.; Bagnardi, V.; Zareba, W.; Priori, S.G. Independent validation and clinical implications of the risk prediction model for long QT syndrome (1-2-3-LQTS-Risk). Europace 2022, 24, 614–619. [Google Scholar] [CrossRef] [PubMed]


| Compounds | Calibration Equation | Correlation Coefficient (r) | Linear Range (ng/mL) | LLOQ (ng/mL) | LOD (ng/mL) |
|---|---|---|---|---|---|
| AC | y = 4.82 × 10⁵x + 1.66 × 10⁴ | 0.9994 | 0.1–10 | 0.1 | 0.025 |
| HA | y = 7.63 × 10⁵x + 2.29 × 10⁴ | 0.9990 | 0.1–10 | 0.1 | 0.025 |
| MA | y = 6.34 × 10⁵x + 2.46 × 10⁴ | 0.9984 | 0.1–10 | 0.1 | 0.025 |
| BAC | y = 3.66 × 10⁵x + 1.63 × 10⁴ | 0.9992 | 0.1–10 | 0.1 | 0.025 |
| BHA | y = 9.78 × 10⁵x + 7.3 × 10⁴ | 0.9985 | 0.1–10 | 0.1 | 0.025 |
| BMA | y = 1.23 × 10⁵x + 5.49 × 10⁵ | 0.9992 | 0.1–10 | 0.1 | 0.025 |
| Compounds | Conc. (ng/mL) | Intra-Day | Inter-Day | ||||
|---|---|---|---|---|---|---|---|
| Measured Conc. (ng/mL) | Accuracy (RE, %) | Precision (%) | Measured Conc. (ng/mL) | Accuracy (RE, %) | Precision (%) | ||
| AC | 0.1 | 0.11 ± 0.01 | 9.2 | 6.2 | 0.11 ± 0.01 | 11.8 | 8.4 |
| 0.2 | 0.21 ± 0.02 | 7.3 | 7.6 | 0.21 ± 0.02 | 5.3 | 10.5 | |
| 2 | 2.20 ± 0.30 | 10.0 | 13.8 | 2.26 ± 0.23 | 12.8 | 10.0 | |
| 8 | 9.00 ± 0.38 | 12.5 | 4.2 | 8.34 ± 0.79 | 4.3 | 9.5 | |
| HA | 0.1 | 0.09 ± 0.01 | 9.8 | 6.3 | 0.11 ± 0.02 | 7.7 | 13.6 |
| 0.2 | 0.21 ± 0.01 | 7.1 | 3.9 | 0.23 ± 0.02 | 13.8 | 9.4 | |
| 2 | 2.28 ± 0.06 | 14.1 | 2.5 | 2.19 ± 0.29 | 9.5 | 13.3 | |
| 8 | 8.06 ± 0.41 | 0.9 | 5.1 | 8.74 ± 0.62 | 9.3 | 7.1 | |
| MA | 0.1 | 0.10 ± 0.01 | −4.7 | 6.1 | 0.08 ± 0.01 | −15.7 | 11.5 |
| 0.2 | 0.20 ± 0.02 | −1.2 | 8 | 0.20 ± 0.03 | −0.6 | 12.9 | |
| 2 | 2.19 ± 0.06 | 9.3 | 2.8 | 2.17 ± 0.23 | 8.6 | 10.3 | |
| 8 | 7.50 ± 0.40 | −6.3 | 5.3 | 7.86 ± 0.50 | −1.8 | 6.3 | |
| BAC | 0.1 | 0.09 ± 0.01 | −7.5 | 7.8 | 0.11 ± 0.02 | 6.7 | 18.8 |
| 0.2 | 0.22 ± 0.02 | 10.3 | 11.0 | 0.21 ± 0.03 | 6.9 | 13.3 | |
| 2 | 2.24 ± 0.17 | 11.9 | 7.5 | 2.27 ± 0.20 | 13.7 | 8.8 | |
| 8 | 8.53 ± 0.60 | 6.6 | 7.1 | 8.63 ± 0.60 | 7.9 | 6.9 | |
| BHA | 0.1 | 0.09 ± 0.01 | −8.7 | 4.7 | 0.09 ± 0.01 | −9.4 | 9.2 |
| 0.2 | 0.20 ± 0.01 | −2.3 | 3.9 | 0.20 ± 0.02 | 3.4 | 8.0 | |
| 2 | 2.29 ± 0.05 | 14.7 | 2.2 | 2.17 ± 0.14 | 8.5 | 6.3 | |
| 8 | 8.50 ± 0.25 | 6.2 | 2.9 | 7.91 ± 0.58 | −1.2 | 7.3 | |
| BMA | 0.1 | 0.09 ± 0.01 | −11.3 | 8.8 | 0.09 ± 0.01 | −6.0 | 11.7 |
| 0.2 | 0.19 ± 0.02 | −0.4 | 9.1 | 0.21 ± 0.02 | 4.8 | 9.8 | |
| 2 | 2.07 ± 0.30 | 3.4 | 14.6 | 2.25 ± 0.27 | 12.3 | 12.2 | |
| 8 | 8.08 ± 0.40 | 0.19 | 4.9 | 8.52 ± 0.76 | 6.5 | 9.0 | |
| Compounds | Conc. (ng/mL) | 4 h at Room Temperature | 10 h in Autosampler | 7 Days of Storage at −20 °C | Freeze-Thaw Cycles | ||||||||
|---|---|---|---|---|---|---|---|---|---|---|---|---|---|
| Measured Conc. (ng/mL) | Accuracy (RE, %) | Precision (%) | Measured Conc. (ng/mL) | Accuracy (RE, %) | Precision (%) | Measured Conc. (ng/mL) | Accuracy (RE, %) | Precision (%) | Measured Conc. (ng/mL) | Accuracy (RE, %) | Precision (%) | ||
| AC | 0.2 | 0.21 ± 0.01 | 3.6 | 4.2 | 0.18 ± 0.01 | −8.9 | 5.2 | 0.21 ± 0.01 | 5.6 | 6.1 | 0.19 ± 0.02 | −5.2 | 9.0 |
| 8 | 7.56 ± 0.30 | −5.5 | 3.9 | 8.29 ± 0.24 | 3.7 | 2.9 | 8.23 ± 1.08 | 2.8 | 13.1 | 8.40 ± 0.41 | 4.9 | 4.9 | |
| HA | 0.2 | 0.22 ± 0.01 | 11.2 | 6.2 | 0.19 ± 0.02 | −3.0 | 7.7 | 0.20 ± 0.02 | −1.0 | 10.6 | 0.19 ± 0.02 | −2.8 | 12.6 |
| 8 | 7.60 ± 0.33 | −5.0 | 4.3 | 8.34 ± 0.31 | 4.2 | 3.7 | 7.86 ± 0.82 | −1.8 | 10.5 | 8.26 ± 0.34 | 3.2 | 4.1 | |
| MA | 0.2 | 0.19 ± 0.01 | −4.2 | 5.2 | 0.18 ± 0.01 | −8.7 | 7.4 | 0.19 ± 0.01 | −6.7 | 5.8 | 0.18 ± 0.01 | −9.6 | 7.2 |
| 8 | 7.03 ± 0.34 | −12.1 | 4.8 | 8.12 ± 0.24 | 1.5 | 2.9 | 7.50 ± 0.89 | −6.2 | 11.9 | 8.25 ± 0.35 | 3.1 | 4.2 | |
| BAC | 0.2 | 0.19 ± 0.01 | −3.0 | 6.2 | 0.19 ± 0.02 | −3.1 | 12.4 | 0.18 ± 0.01 | −10.5 | 5.5 | 0.18 ± 0.01 | −10.8 | 6.8 |
| 8 | 7.02 ± 0.37 | −12.2 | 5.2 | 8.29 ± 0.26 | 3.6 | 3.1 | 7.38 ± 0.91 | −7.8 | 12.4 | 8.31 ± 0.37 | 3.9 | 4.5 | |
| BHA | 0.2 | 0.21 ± 0.02 | 4.3 | 10.7 | 0.20 ± 0.01 | −2.3 | 3.9 | 0.19 ± 0.01 | −4.9 | 3.0 | 0.19 ± 0.01 | −1.8 | 6.8 |
| 8 | 7.67 ± 0.76 | −4.1 | 9.9 | 8.50 ± 0.25 | 6.2 | 2.9 | 8.01 ± 0.23 | 0.1 | 2.9 | 7.69 ± 0.38 | 6.7 | 3.8 | |
| BMA | 0.2 | 0.22 ± 0.02 | 11.4 | 10.7 | 0.18 ± 0.01 | −10.4 | 7.9 | 0.19 ± 0.01 | −3.1 | 6.5 | 0.20 ± 0.02 | −2.5 | 10.6 |
| 8 | 8.12 ± 0.69 | 1.5 | 8.5 | 7.79 ± 0.31 | −2.6 | 4.0 | 7.40 ± 0.75 | −7.4 | 10.2 | 7.69 ± 0.38 | −3.9 | 4.9 | |
| Compounds | Conc. (ng/mL) | Extraction Recovery (%) | Precision (%) | Matrix Effect (%) | Precision (%) |
|---|---|---|---|---|---|
| AC | 0.2 | 75.1 ± 5.9 | 7.8 | 85.2 ± 8.3 | 9.8 |
| 2 | 88.2 ± 7.0 | 8.0 | 91.3 ± 8.9 | 9.8 | |
| 8 | 90.1 ± 4.1 | 4.5 | 87.8 ± 7.4 | 8.5 | |
| HA | 0.2 | 78.5 ± 7.3 | 9.4 | 81.5 ± 11.4 | 14.0 |
| 2 | 85.3 ± 4.2 | 5.0 | 84.9 ± 9.0 | 10.6 | |
| 8 | 89.7 ± 4.4 | 4.9 | 86.9 ± 9.4 | 10.8 | |
| MA | 0.2 | 73.8 ± 6.7 | 9.1 | 75.6 ± 8.7 | 11.5 |
| 2 | 79.7 ± 5.1 | 6.4 | 79.0 ± 5.5 | 6.9 | |
| 8 | 79.7 ± 3.8 | 4.7 | 79.5 ± 7 | 8.8 | |
| BAC | 0.2 | 88.3 ± 6.8 | 7.7 | 93.2 ± 10.5 | 11.3 |
| 2 | 89.1 ± 5.8 | 6.5 | 90.2 ± 7.2 | 8.0 | |
| 8 | 90.0 ± 4.4 | 4.9 | 89.0 ± 6.8 | 7.6 | |
| BHA | 0.2 | 67.7 ± 4.0 | 5.8 | 67.6 ± 8.8 | 13.0 |
| 2 | 95.0 ± 7.2 | 7.6 | 100.3 ± 6.9 | 6.9 | |
| 8 | 101.1 ± 5.5 | 5.4 | 97.3 ± 6.0 | 6.1 | |
| BMA | 0.2 | 82.0 ± 5.7 | 7.0 | 85.7 ± 8.5 | 9.9 |
| 2 | 88.8 ± 6.6 | 7.5 | 89.3 ± 5.7 | 6.4 | |
| 8 | 88.7 ± 5.2 | 5.9 | 85.5 ± 5.7 | 6.7 |
| Compounds | Dose (g/kg) | Cmax (μg/L) | Tmax (h) | Vz/F (L/kg) | t1/2z (h) | CLz/F (L/h/kg) | AUC(0–48h) (μg/L·h) |
|---|---|---|---|---|---|---|---|
| AC | 0.5 | 1.28 ± 0.34 | 4.38 ± 3.11 | 14.01 ± 4.33 | 1.90 ± 0.31 | 4.62 ± 1.29 | 13.47 ± 3.28 |
| 1.0 | 1.69 ± 0.33 | 3.13 ± 1.25 | 70.03 ± 33.39 * | 7.53 ± 2.74 * | 6.39 ± 1.83 | 17.15 ± 4.68 | |
| 2.0 | 2.27 ± 0.70 * | 1.03 ± 0.84 ## | 166.81 ± 80.09 **,# | 11.47 ± 4.30 * | 8.85 ± 2.11 ** | 23.82 ± 7.77 * | |
| HA | 0.5 | 6.37 ± 1.96 | 2.14 ± 0.90 | 12.75 ± 6.88 | 1.83 ± 0.64 | 4.02 ± 1.80 | 62.90 ± 26.89 |
| 1.0 | 9.22 ± 1.78 * | 3.88 ± 2.03 | 45.31 ± 26.28 * | 8.72 ± 3.40 ** | 3.57 ± 1.05 | 115.20 ± 24.99 ** | |
| 2.0 | 12.48 ± 4.42 * | 1.60 ± 1.47 | 80.41 ± 35.49 ** | 11.92 ± 4.59 ** | 4.78 ± 1.73 | 185.72 ± 64.72 ** | |
| MA | 0.5 | 2.66 ± 0.50 | 2.18 ± 1.40 | 33.10 ± 25.06 | 1.72 ± 0.25 | 9.89 ± 1.93 | 26.39 ± 5.42 |
| 1.0 | 4.41 ± 1.81 | 3.86 ± 2.19 | 52.99 ± 26.92 | 4.27 ± 2.27 | 8.73 ± 1.00 | 59.41 ± 9.25 ** | |
| 2.0 | 6.77 ± 1.32 **,# | 1.06 ± 0.81 # | 87.22 ± 43.08 * | 6.04 ± 3.85 * | 12.49 ± 3.75 | 85.82 ± 20.71 **,# | |
| BAC | 0.5 | 1.52 ± 0.71 | 3.72 ± 3.60 | 193.64 ± 116.81 | 4.48 ± 0.64 | 27.59 ± 14.27 | 16.21 ± 5.43 |
| 1.0 | 3.24 ± 2.01 | 5.71 ± 5.07 | 151.61 ± 97.07 | 5.91 ± 3.79 | 16.24 ± 7.33 | 38.51 ± 15.45 * | |
| 2.0 | 5.91 ± 2.25 ** | 0.34 ± 0.20 | 800.57 ± 396.01 *,# | 13.67 ± 4.26 **,# | 34.98 ± 17.89 | 50.54 ± 19.45 ** | |
| BHA | 0.5 | BQL | BQL | BQL | BQL | BQL | BQL |
| 1.0 | 0.41 ± 0.13 | 4.10 ± 3.88 | 257.62 ± 106.42 | 7.70 ± 4.28 | 30.60 ± 17.16 | 7.96 ± 3.58 | |
| 2.0 | 1.52 ± 0.76 # | 0.40 ± 0.17 | 383.54 ± 177.00 | 8.75 ± 7.14 | 25.58 ± 18.42 | 17.29 ± 6.18 # | |
| BMA | 0.5 | 0.78 ± 0.26 | 5.18 ± 4.84 | 207.34 ± 75.96 | 4.53 ± 3.84 | 44.39 ± 16.02 | 6.85 ± 2.40 |
| 1.0 | 1.92 ± 0.92 * | 6.50 ± 5.93 | 382.12 ± 166.25 | 16.81 ± 10.13 * | 19.81 ± 13.56 * | 28.16 ± 13.38 * | |
| 2.0 | 6.92 ± 3.00 **,## | 0.35 ± 0.17 | 616.61 ± 290.20 * | 19.14 ± 8.84 ** | 26.10 ± 13.73 | 44.20 ± 18.82 * |
| Compounds | Q1/Q3 (m/z) | Cone(v) | C.E. (V) |
|---|---|---|---|
| AC | 646.24/104.90 | 58 | 69 |
| HA | 616.24/104.85 | 58 | 46 |
| MA | 632.23/104.81 | 58 | 33 |
| BAC | 604.32/104.81 | 52 | 43 |
| BHA | 574.24/104.85 | 48 | 52 |
| BMA | 590.30/104.81 | 50 | 20 |
| Reagent | Extracellular Solution (mM) (EC 0.0.0 NaCl-Ringer’s Solution) | Intracellular Solution (mM) (IC 0.0.0 KCl-Ringer’s Solution) |
|---|---|---|
| CsCl | 20 | 135 |
| TEA-Cl | 140 | 2 |
| BaCl2 | 5 | - |
| glucose | 25 | - |
| HEPES | 10 | 10 |
| CaCl2 | - | 2 |
| Mg2ATP | - | 3 |
| NaCl | - | 10 |
| EGTA | - | 5 |
| pH | 7.3 (Adjust with CSOH) | 7.2 (Adjust with CSOH) |
| Osmotic pressure | ~315 mOsm | ~300 mOsm |
| Reagent | Extracellular (mM) (EC 0.0.0 NaCl-Ringer’s Solution) | Intracellular (mM) (IC 0.0.0 KCl-Ringer’s Solution) |
|---|---|---|
| NaCl | 140 | - |
| KCl | 5 | 20 |
| MgCl2.6H2O | 1 | 1 |
| HEPES | 5 | 10 |
| glucose | 10 | - |
| CaCl2 | 1.8 | - |
| K-Asparate | - | 110 |
| Na2-phosphocreatine | - | 4 |
| EGTA | - | 5 |
| Na-GTP | - | 0.1 |
| Mg2-ATP | - | 5 |
| pH | 7.3 (Adjust with CSOH) | 7.3(Adjust with CSOH) |
| Osmotic pressure | ~315 mOsm | ~300 mOsm |
Publisher’s Note: MDPI stays neutral with regard to jurisdictional claims in published maps and institutional affiliations. |
© 2022 by the authors. Licensee MDPI, Basel, Switzerland. This article is an open access article distributed under the terms and conditions of the Creative Commons Attribution (CC BY) license (https://creativecommons.org/licenses/by/4.0/).
Share and Cite
Yang, L.; Xie, G.; Wang, Y.; Li, J.; Zheng, B.; Zhu, J.; Yuan, X.; Hong, Q.; Ma, Z.; Gao, Y. Metabolic Behaviors of Aconitum Alkaloids in Different Concentrations of Aconiti Lateralis Radix Praeparata and Effects of Aconitine in Healthy Human and Long QT Syndrome Cardiomyocytes. Molecules 2022, 27, 4055. https://doi.org/10.3390/molecules27134055
Yang L, Xie G, Wang Y, Li J, Zheng B, Zhu J, Yuan X, Hong Q, Ma Z, Gao Y. Metabolic Behaviors of Aconitum Alkaloids in Different Concentrations of Aconiti Lateralis Radix Praeparata and Effects of Aconitine in Healthy Human and Long QT Syndrome Cardiomyocytes. Molecules. 2022; 27(13):4055. https://doi.org/10.3390/molecules27134055
Chicago/Turabian StyleYang, Liang, Guanghui Xie, Yuguang Wang, Jian Li, Bin Zheng, Jinmiao Zhu, Xinsong Yuan, Qian Hong, Zengchun Ma, and Yue Gao. 2022. "Metabolic Behaviors of Aconitum Alkaloids in Different Concentrations of Aconiti Lateralis Radix Praeparata and Effects of Aconitine in Healthy Human and Long QT Syndrome Cardiomyocytes" Molecules 27, no. 13: 4055. https://doi.org/10.3390/molecules27134055
APA StyleYang, L., Xie, G., Wang, Y., Li, J., Zheng, B., Zhu, J., Yuan, X., Hong, Q., Ma, Z., & Gao, Y. (2022). Metabolic Behaviors of Aconitum Alkaloids in Different Concentrations of Aconiti Lateralis Radix Praeparata and Effects of Aconitine in Healthy Human and Long QT Syndrome Cardiomyocytes. Molecules, 27(13), 4055. https://doi.org/10.3390/molecules27134055