
Natural-like Chalcones with Antitumor Activity on Human MG63 Osteosarcoma Cells

 , , ,
, , ,  , ,
, ,  ,
,  , and
, and
Abstract
:
1. Introduction
2. Results
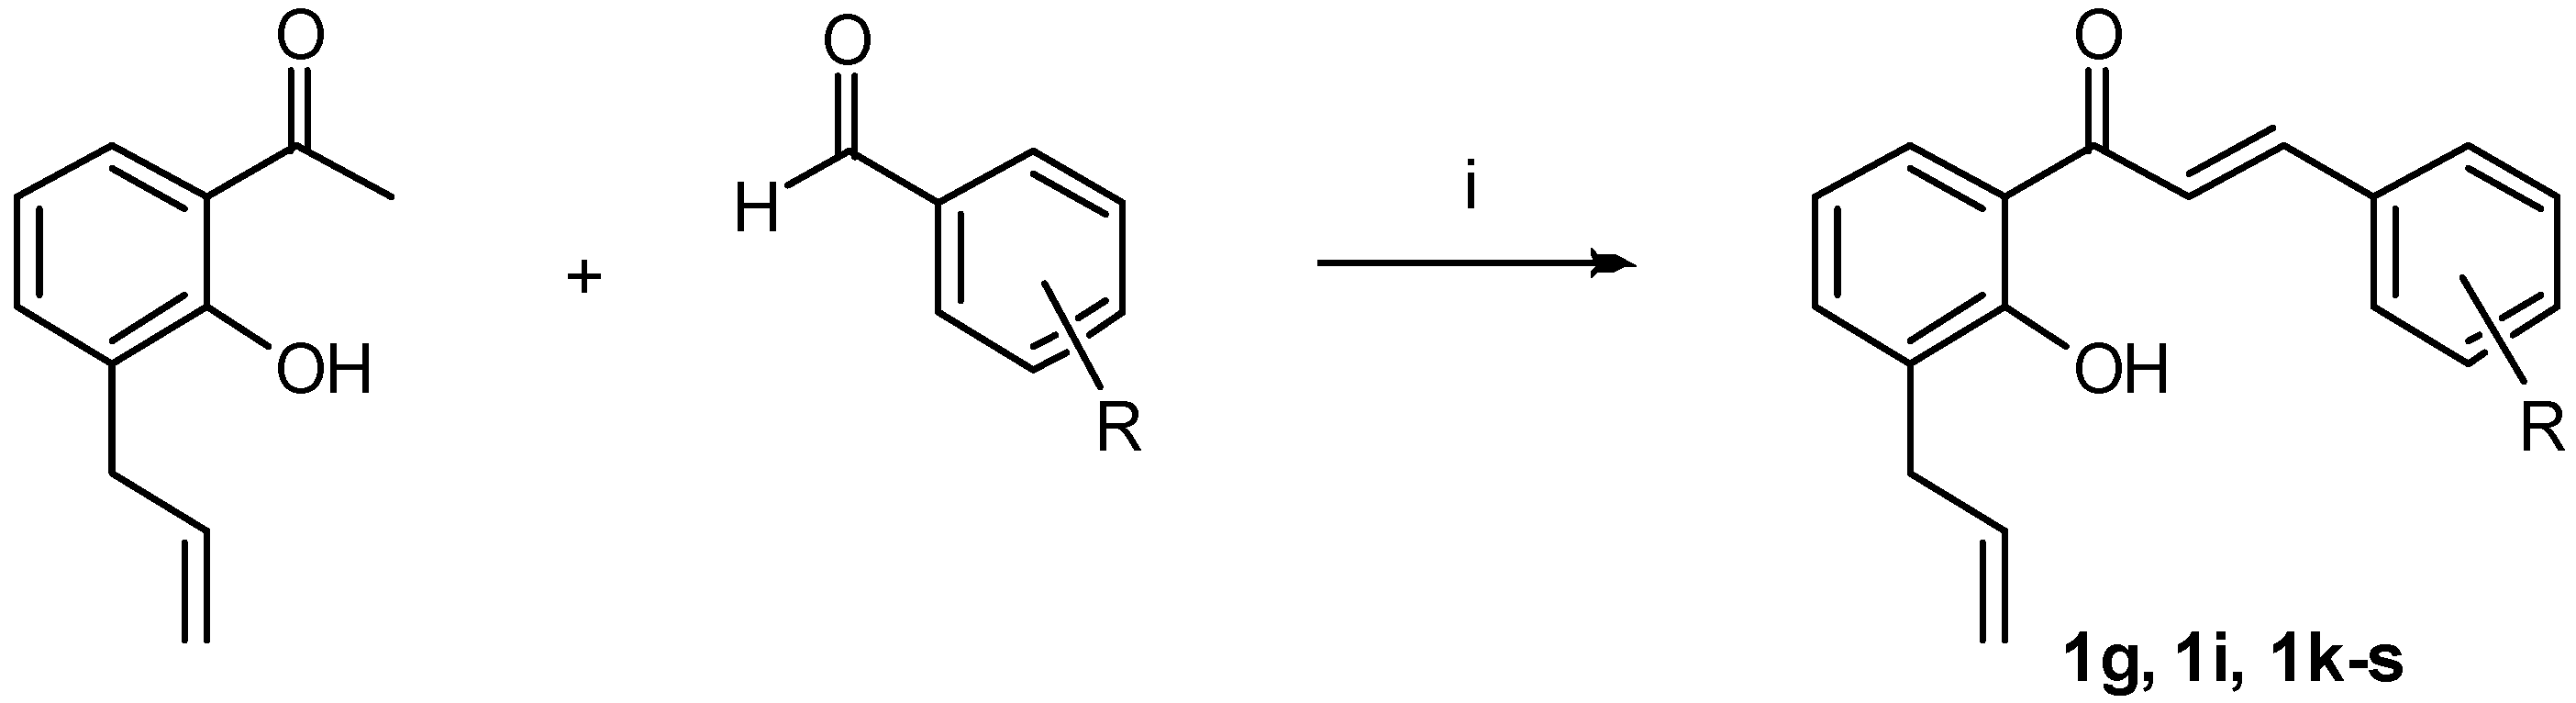
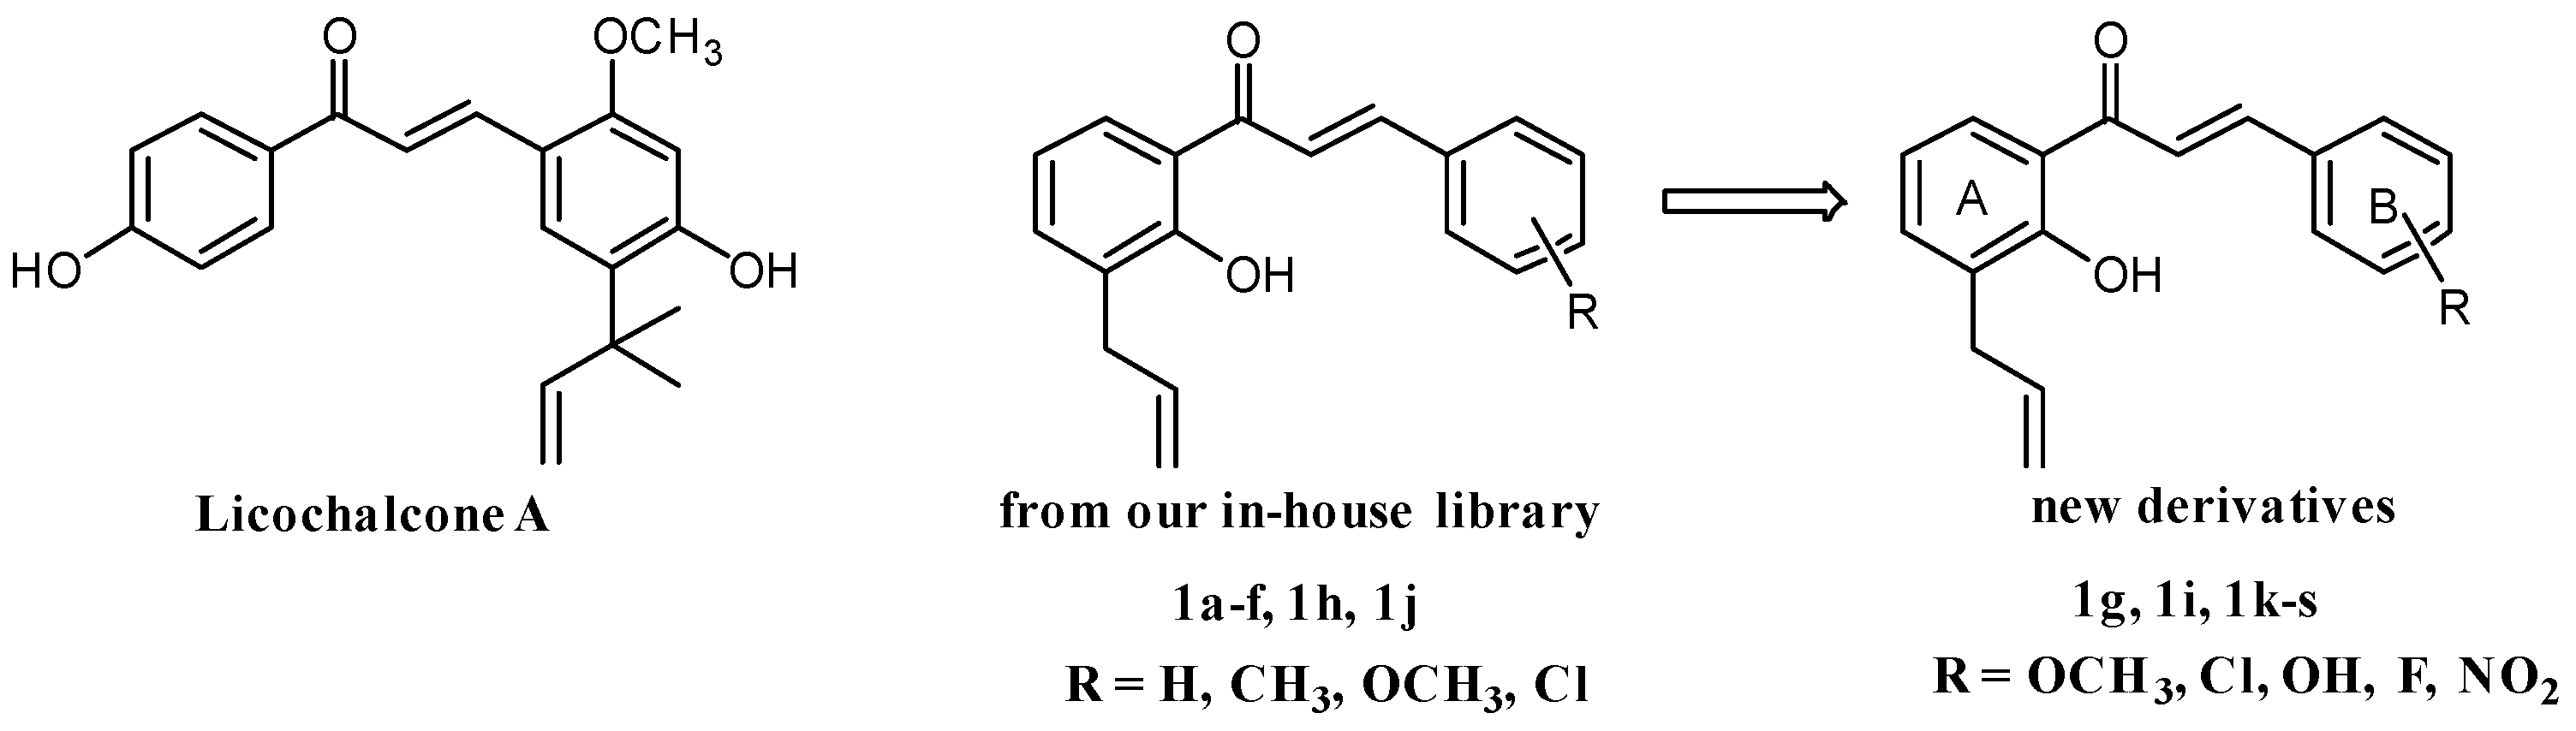
2.1. Chemistry
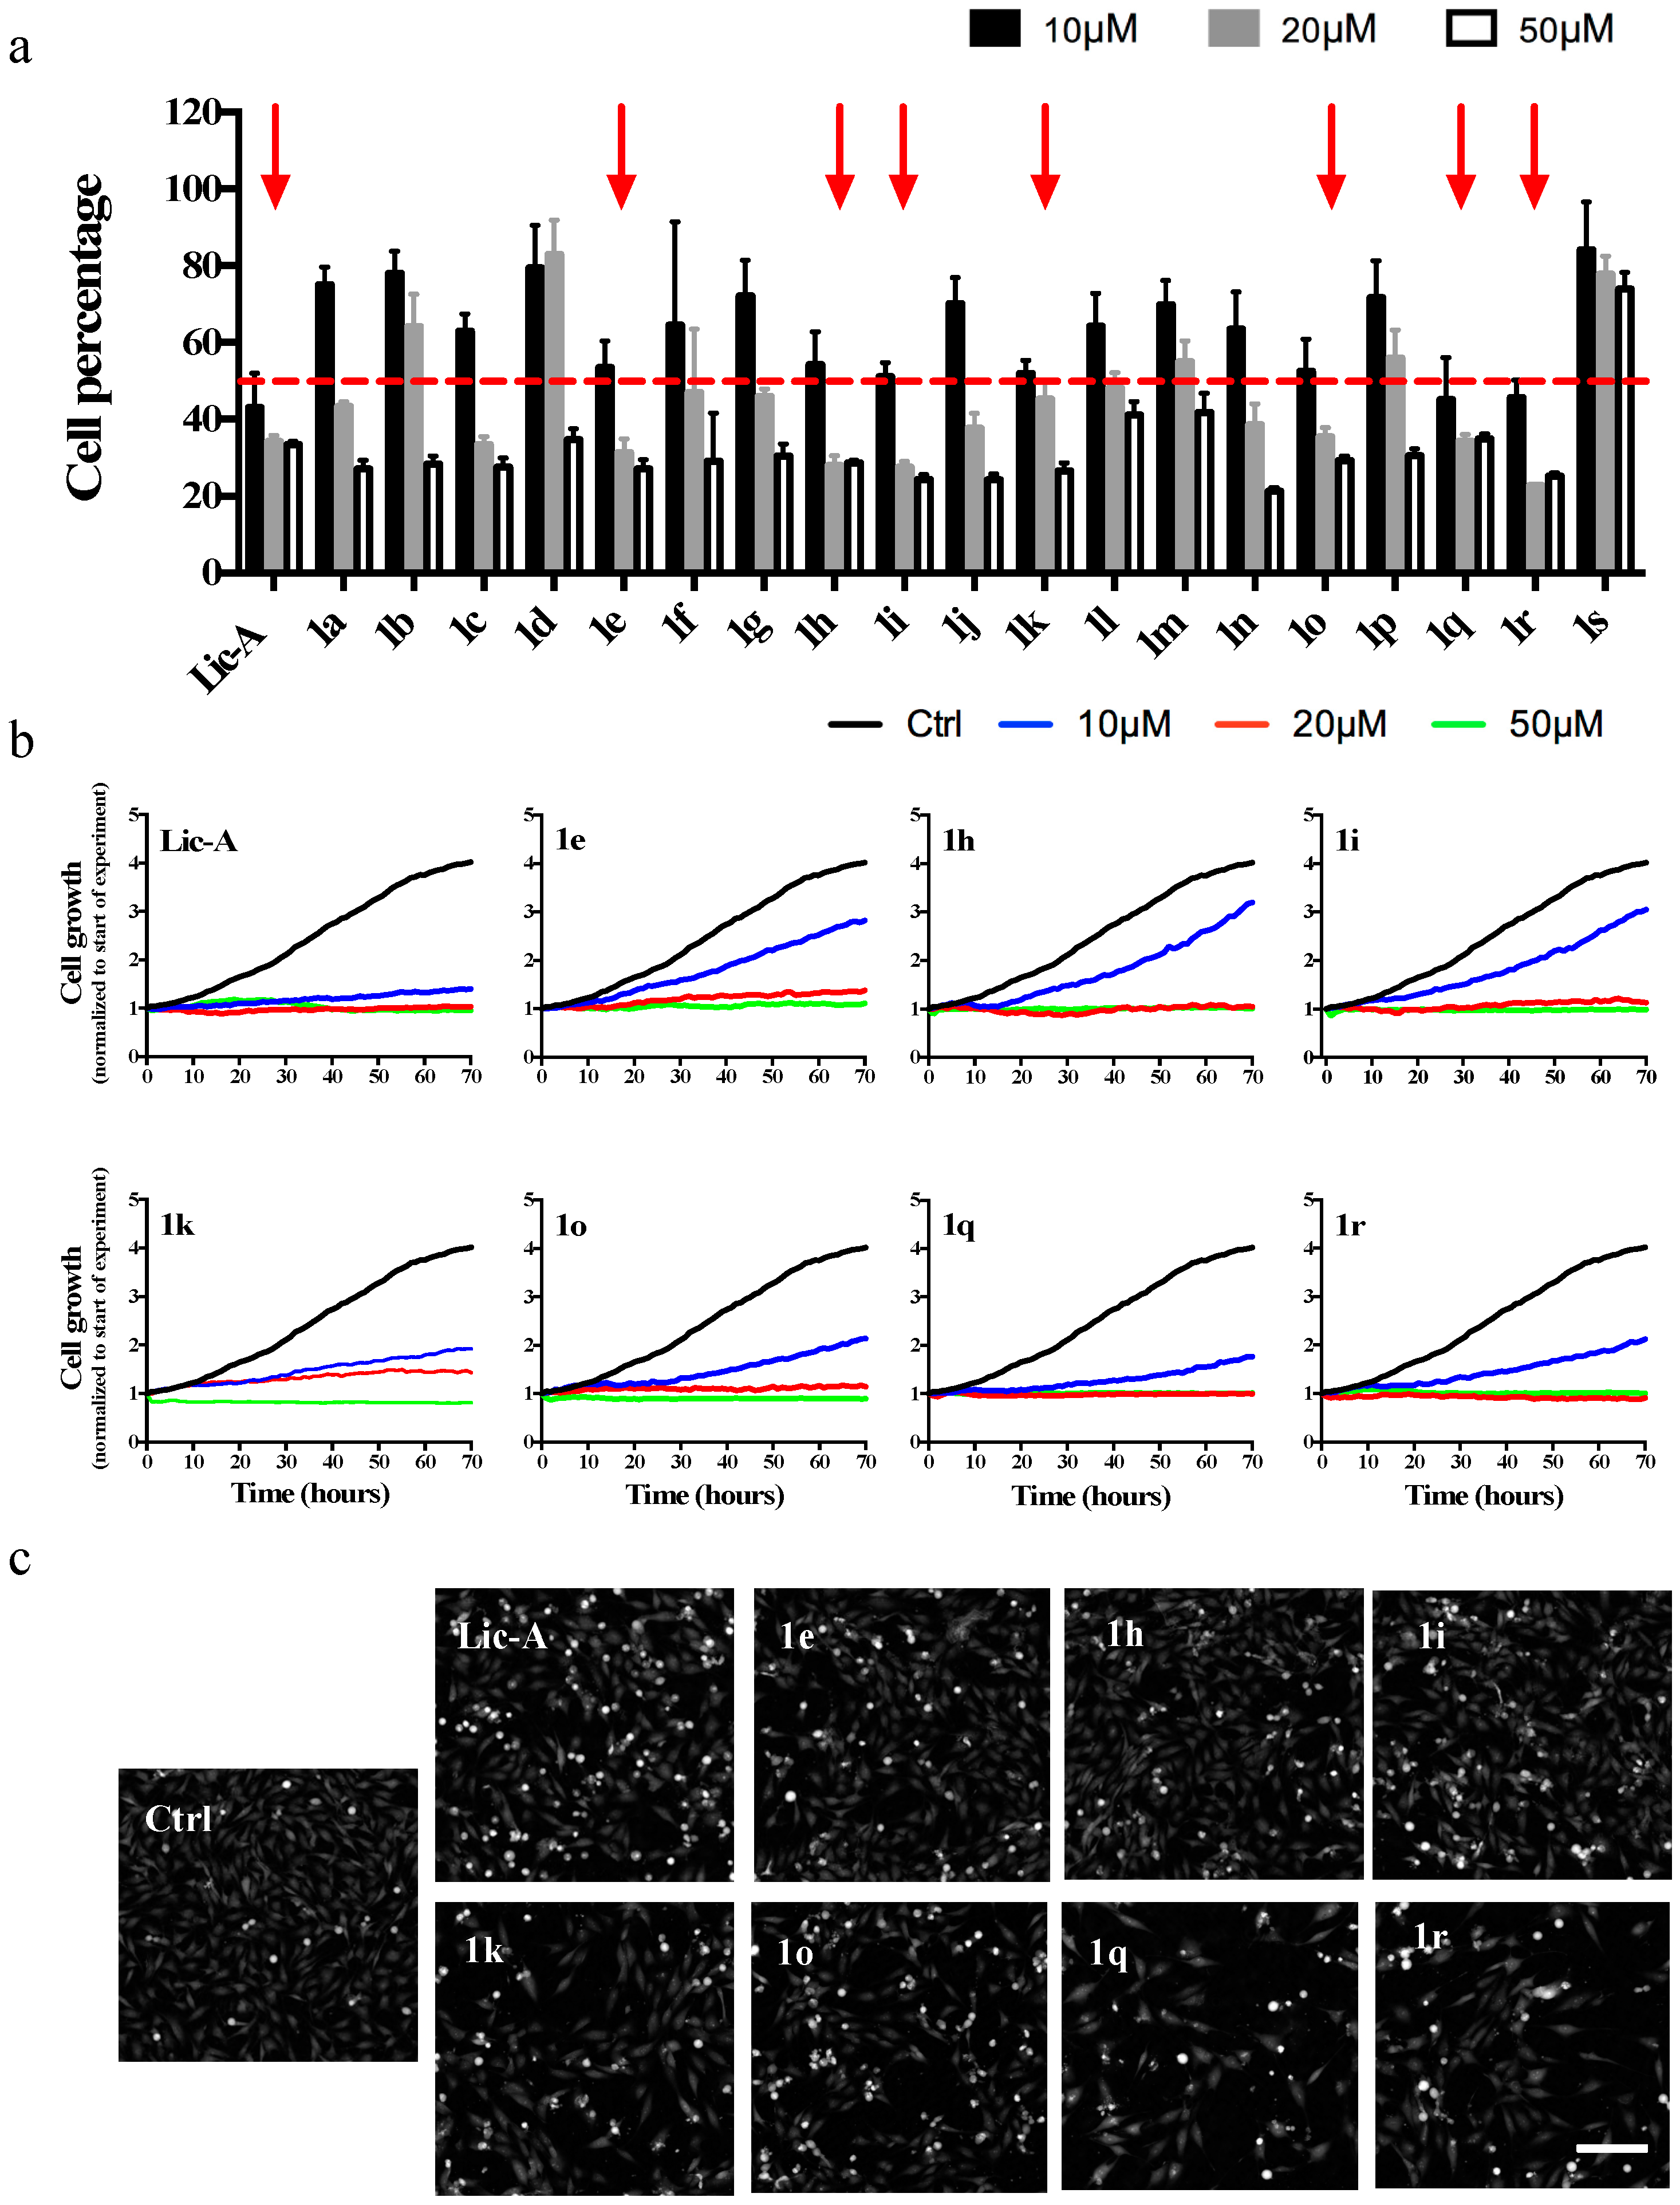
2.2. Effects on MG63 Cell Proliferation
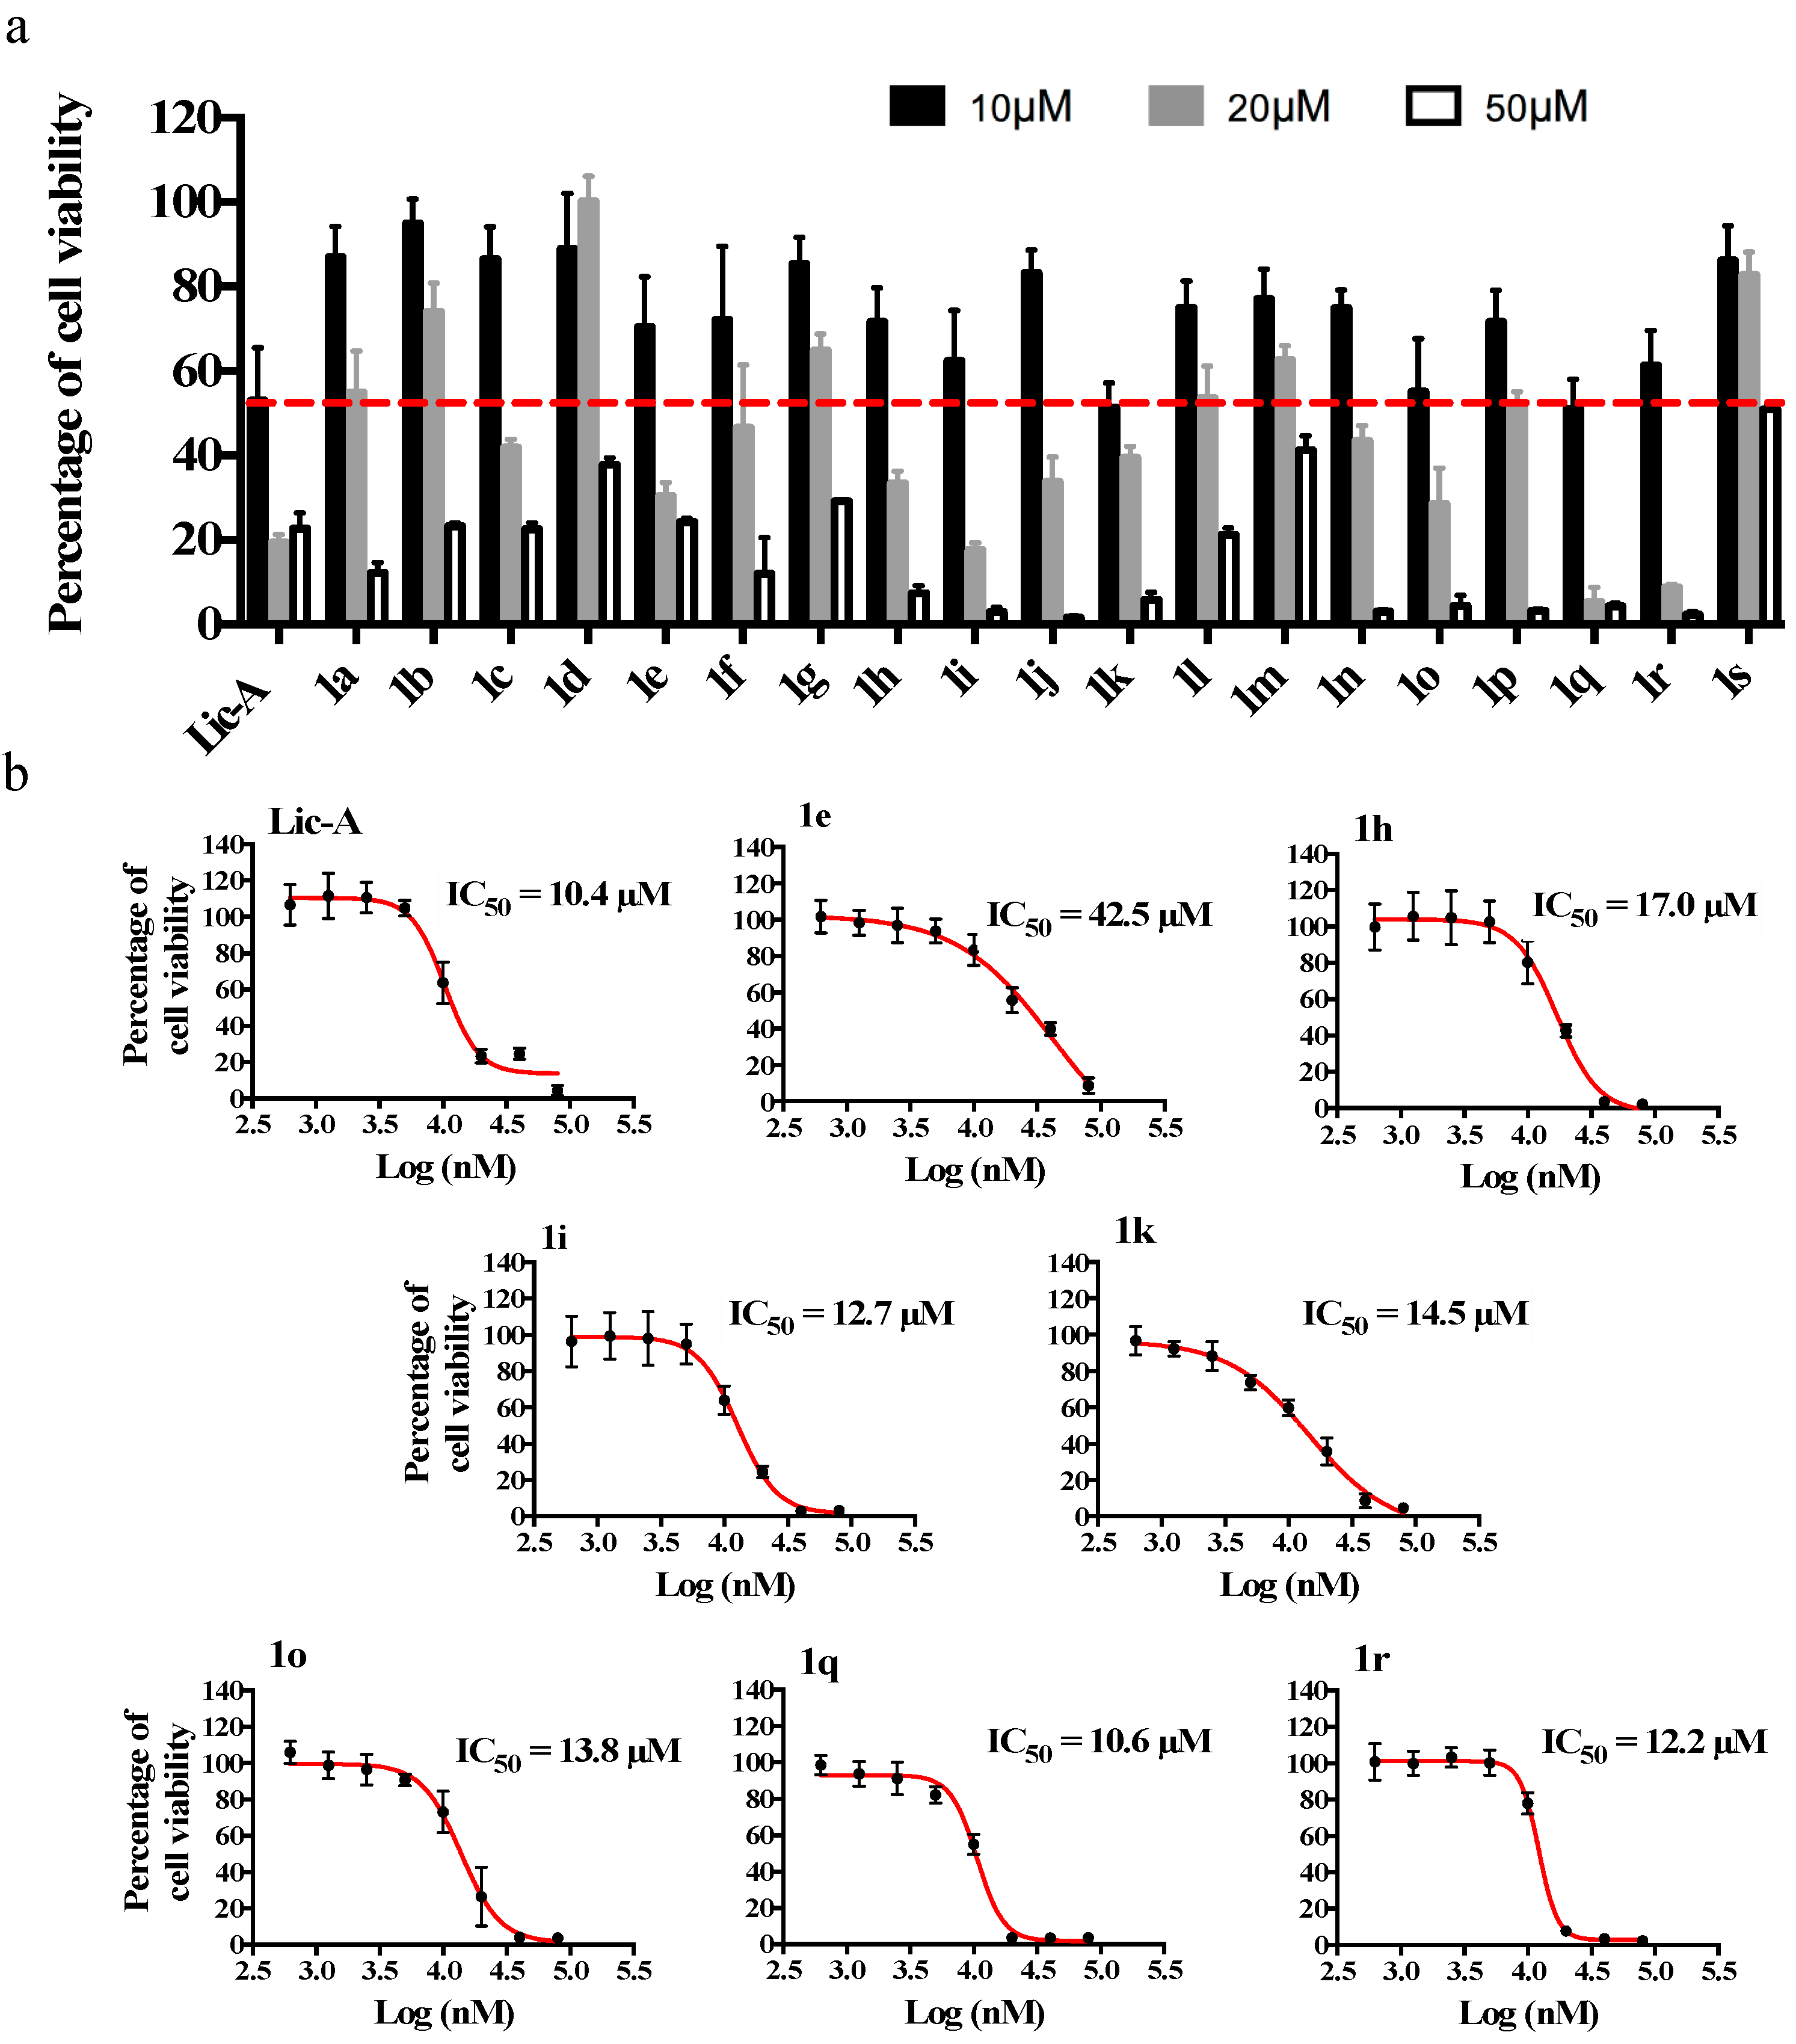
2.3. Effects on MG63 Cell Viability and Metabolic Activity
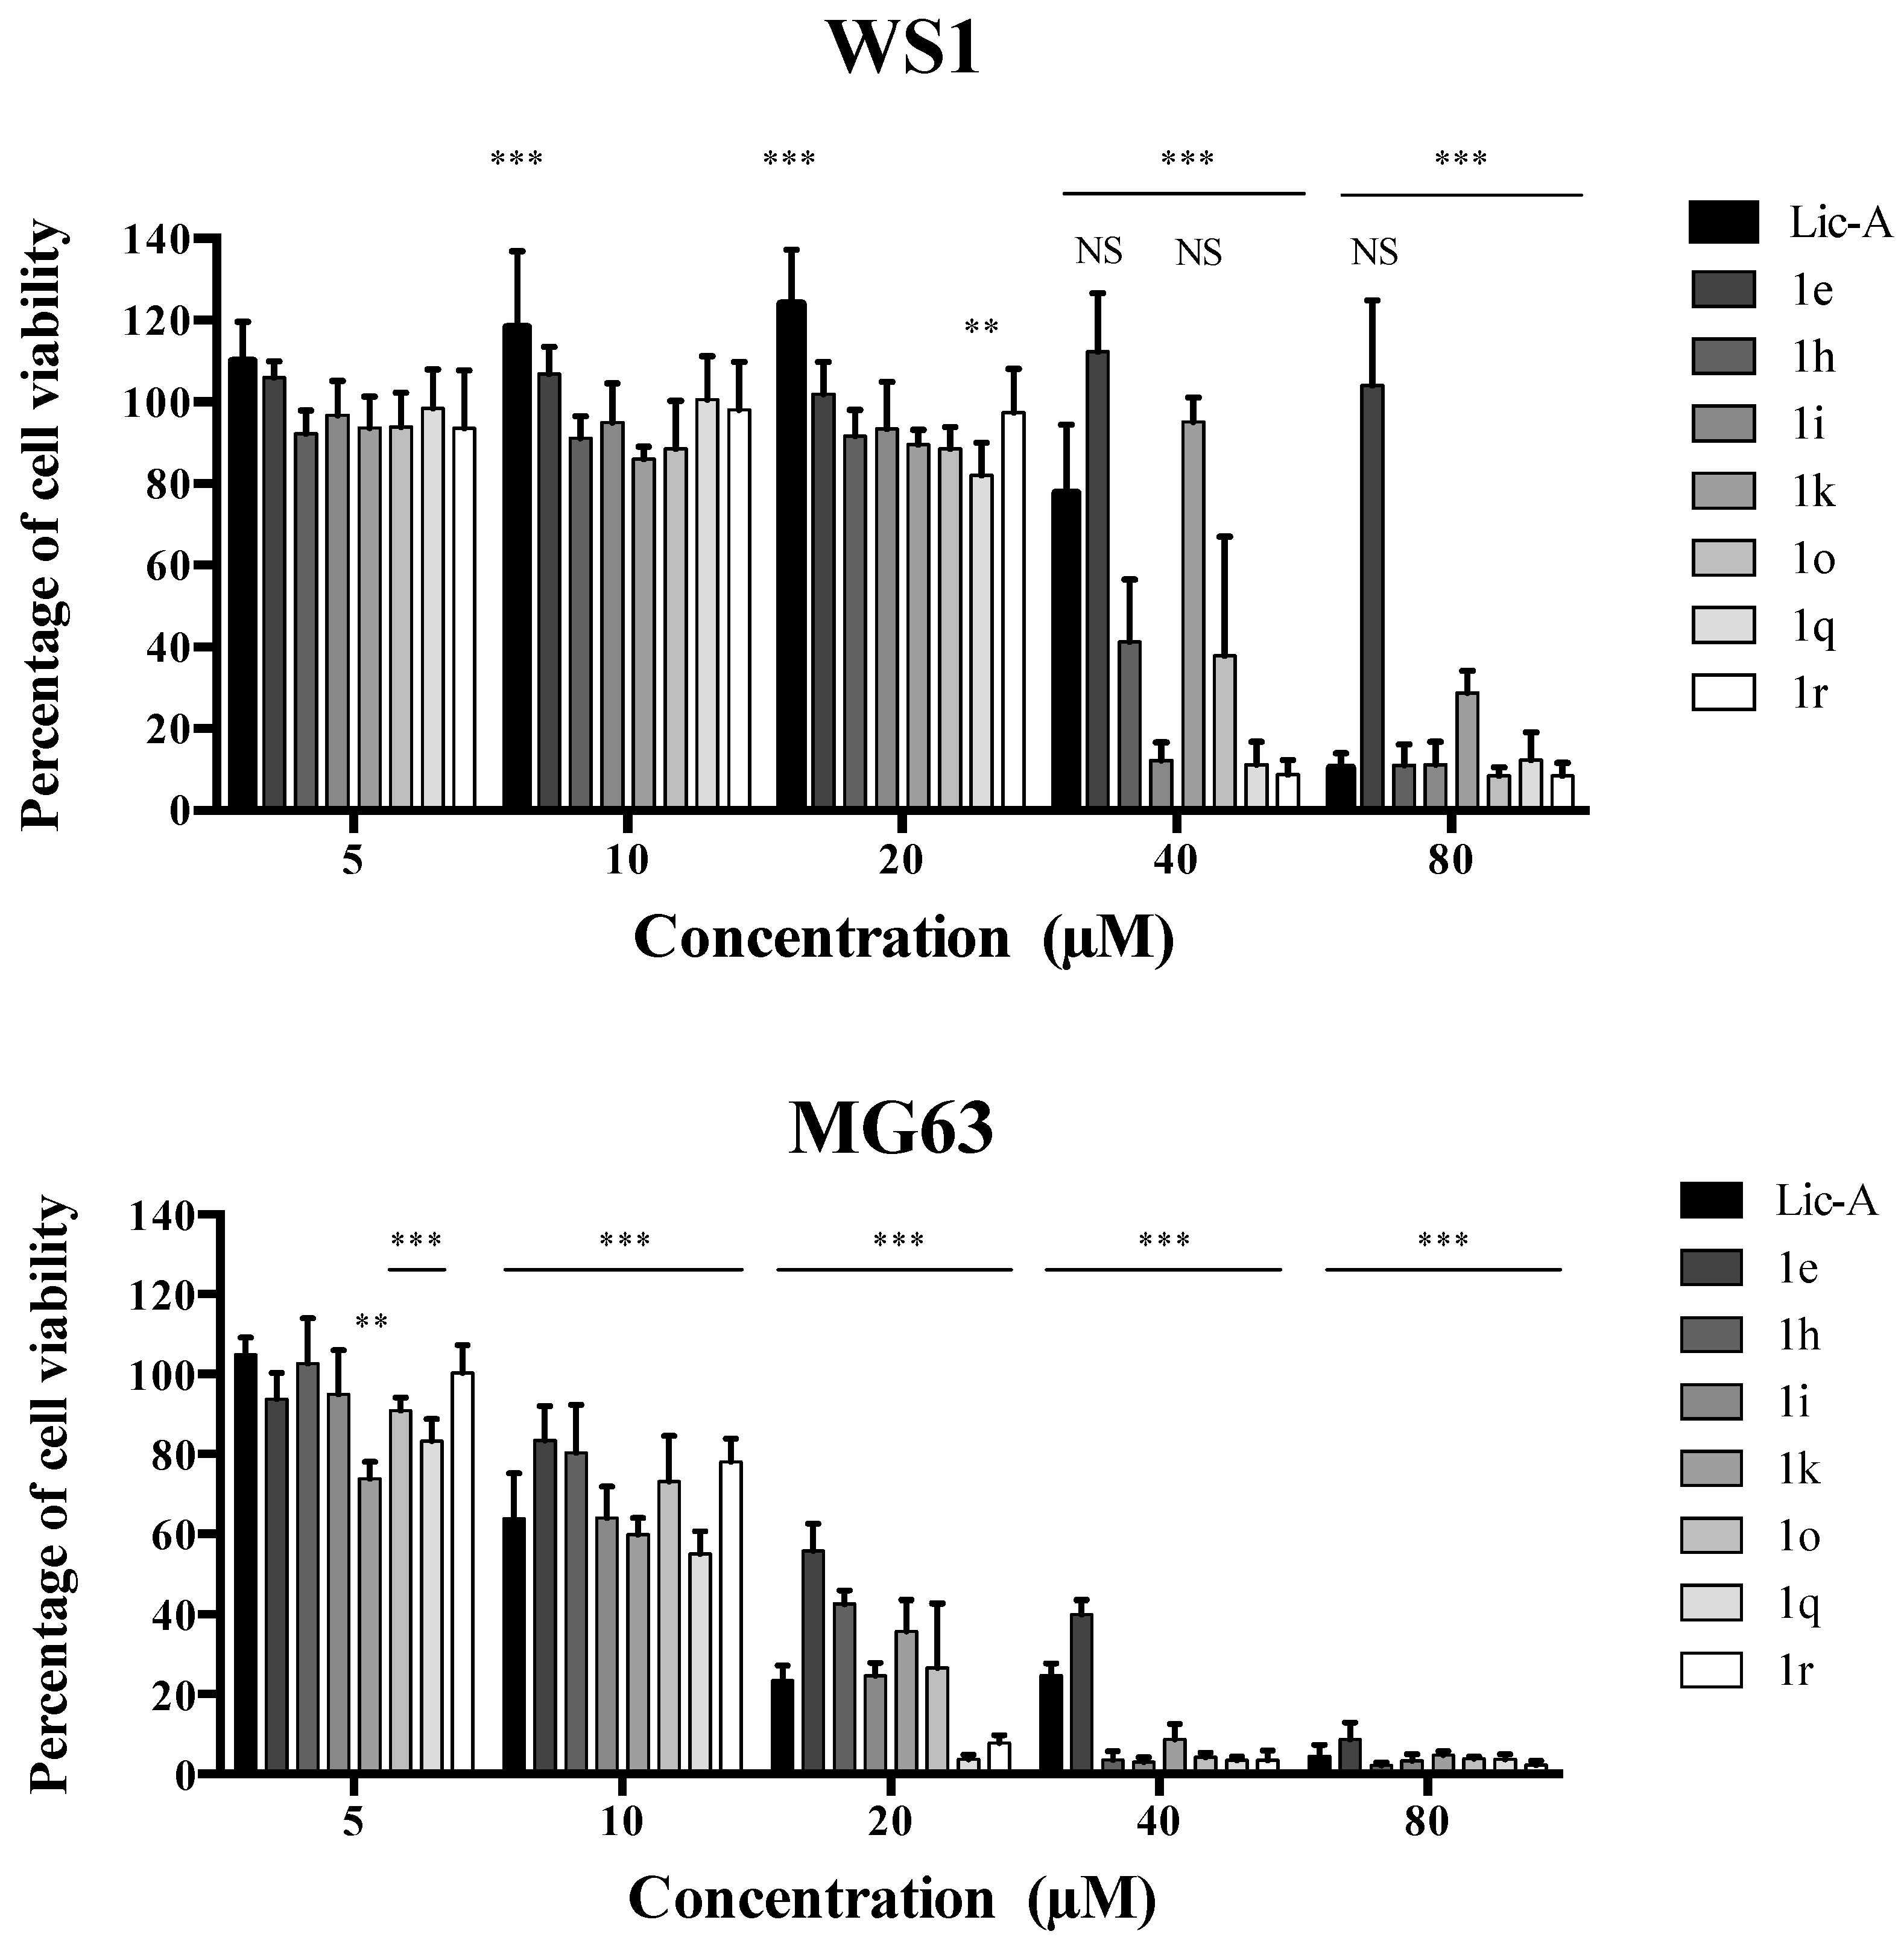
2.4. Analysis of Cytotoxicity on Normal Human Fibroblasts
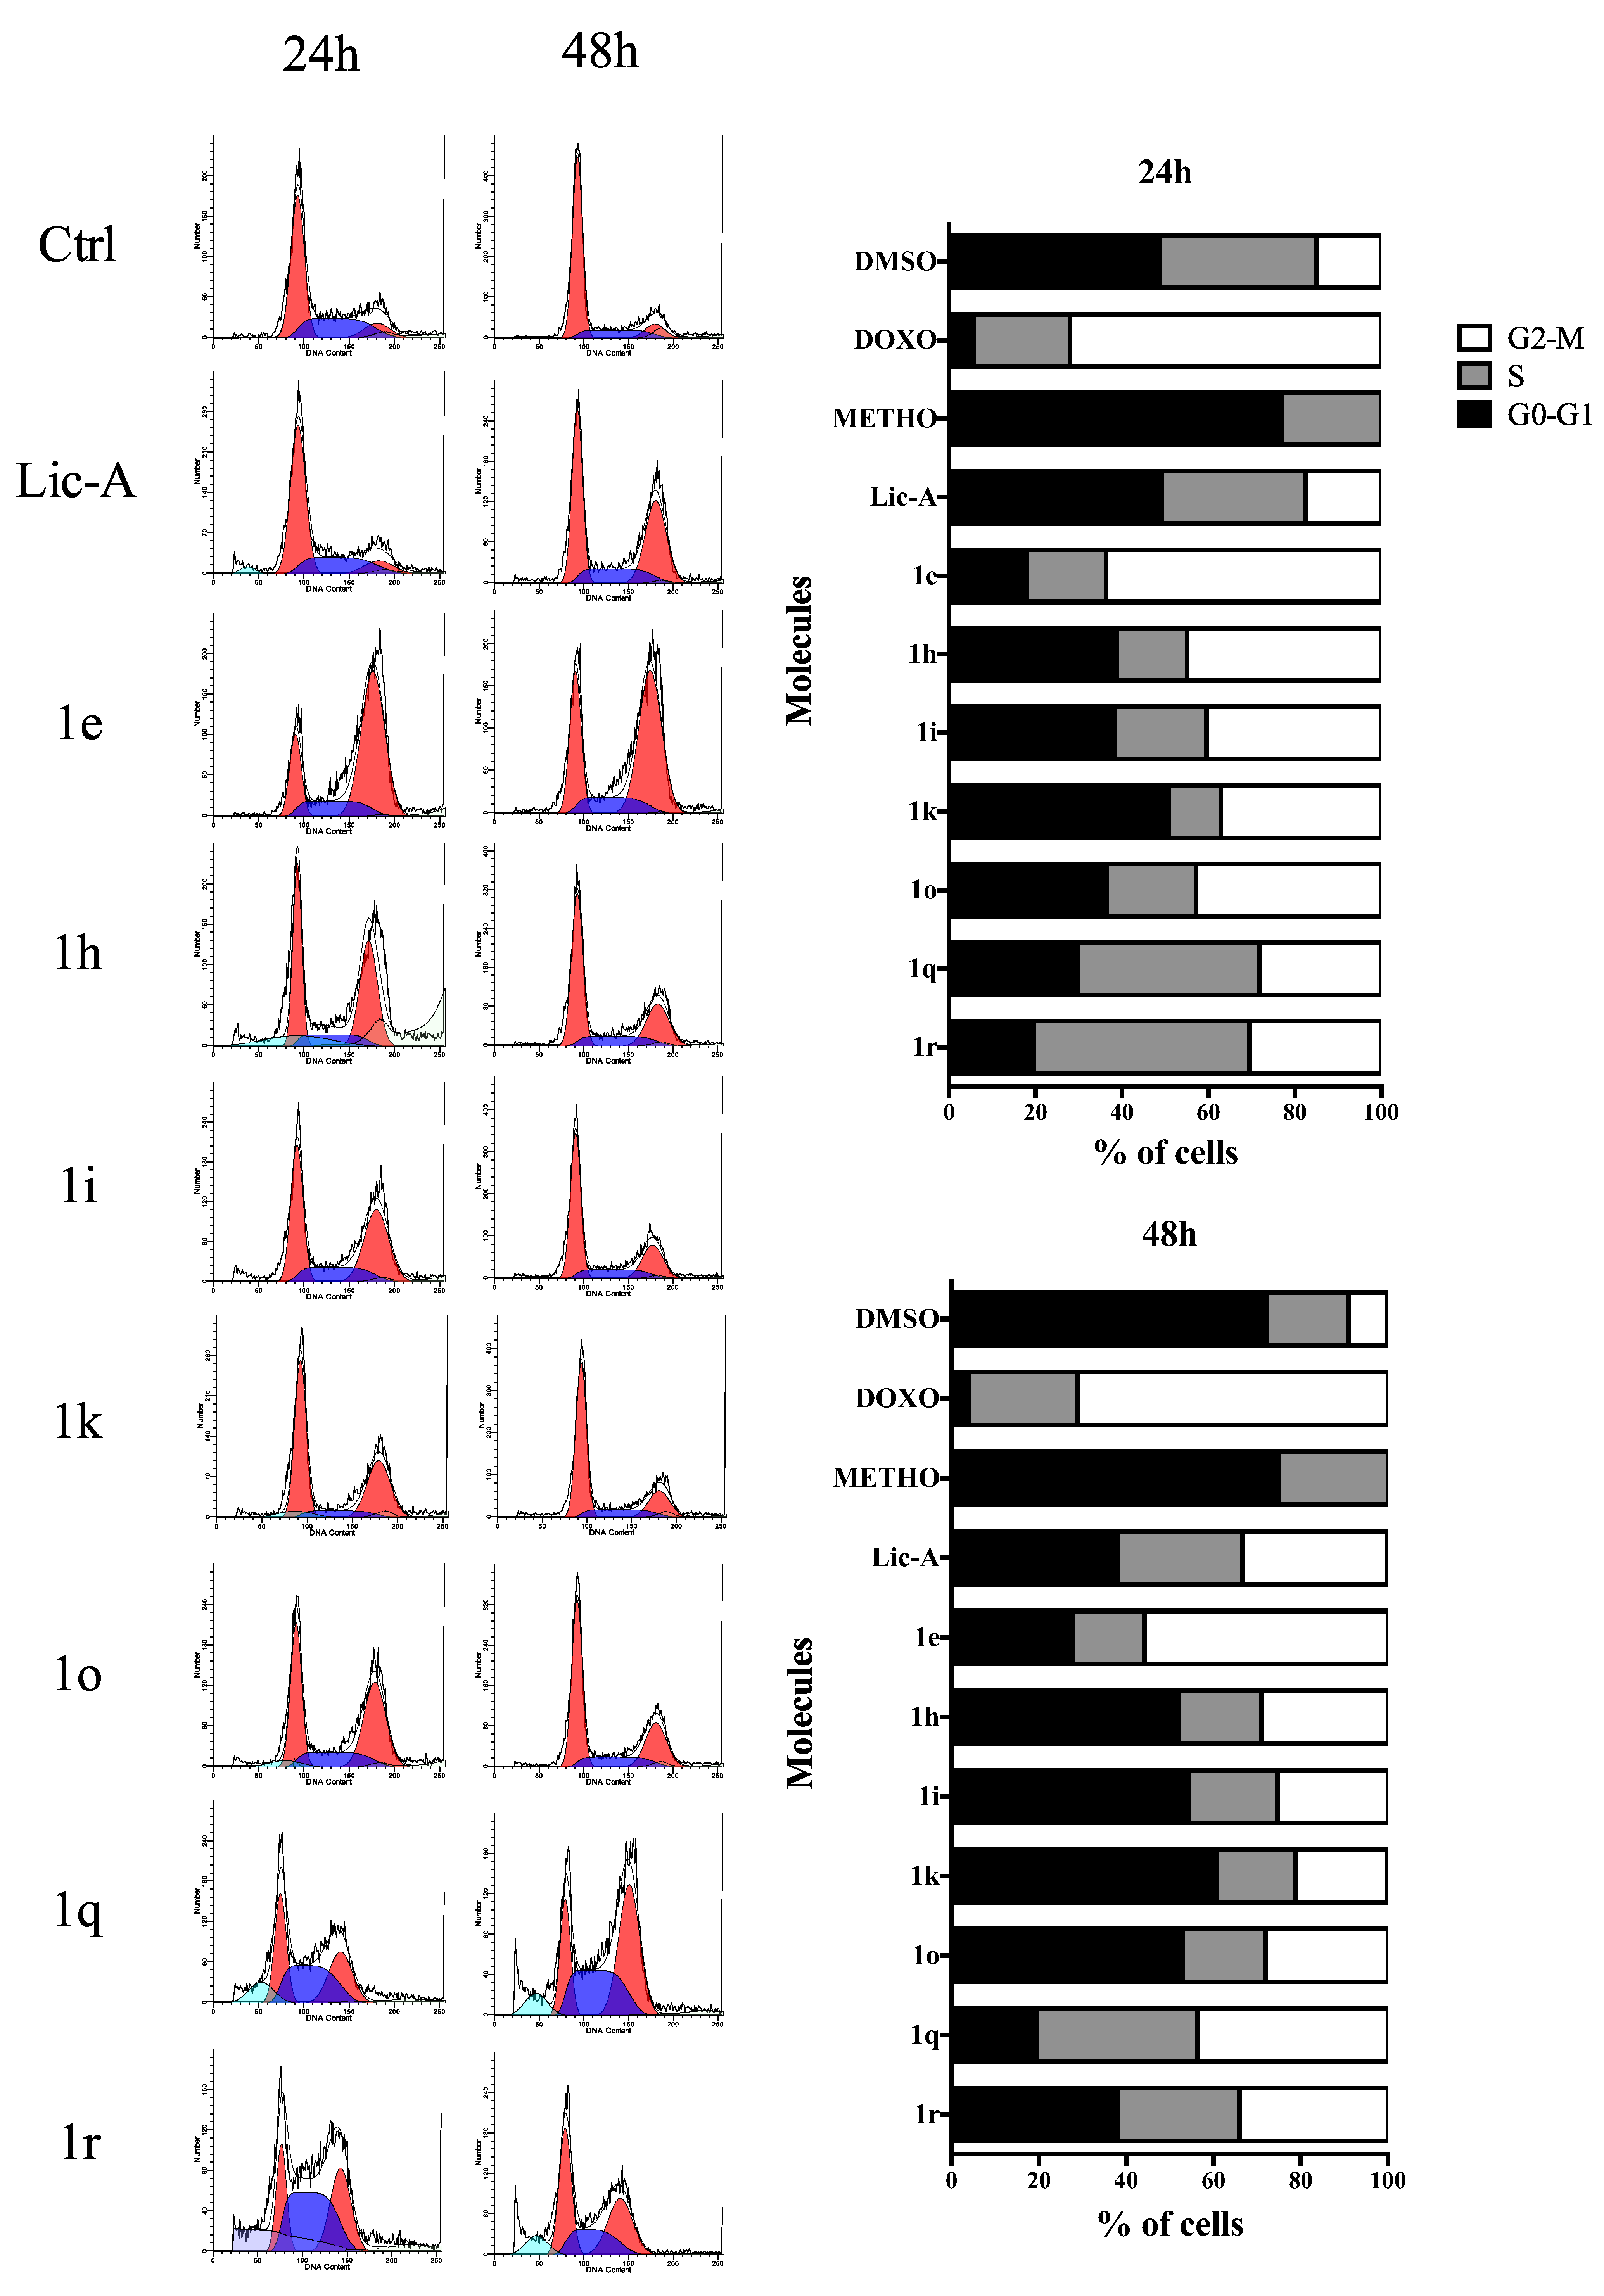
2.5. Effects on MG63 Cell Cycle
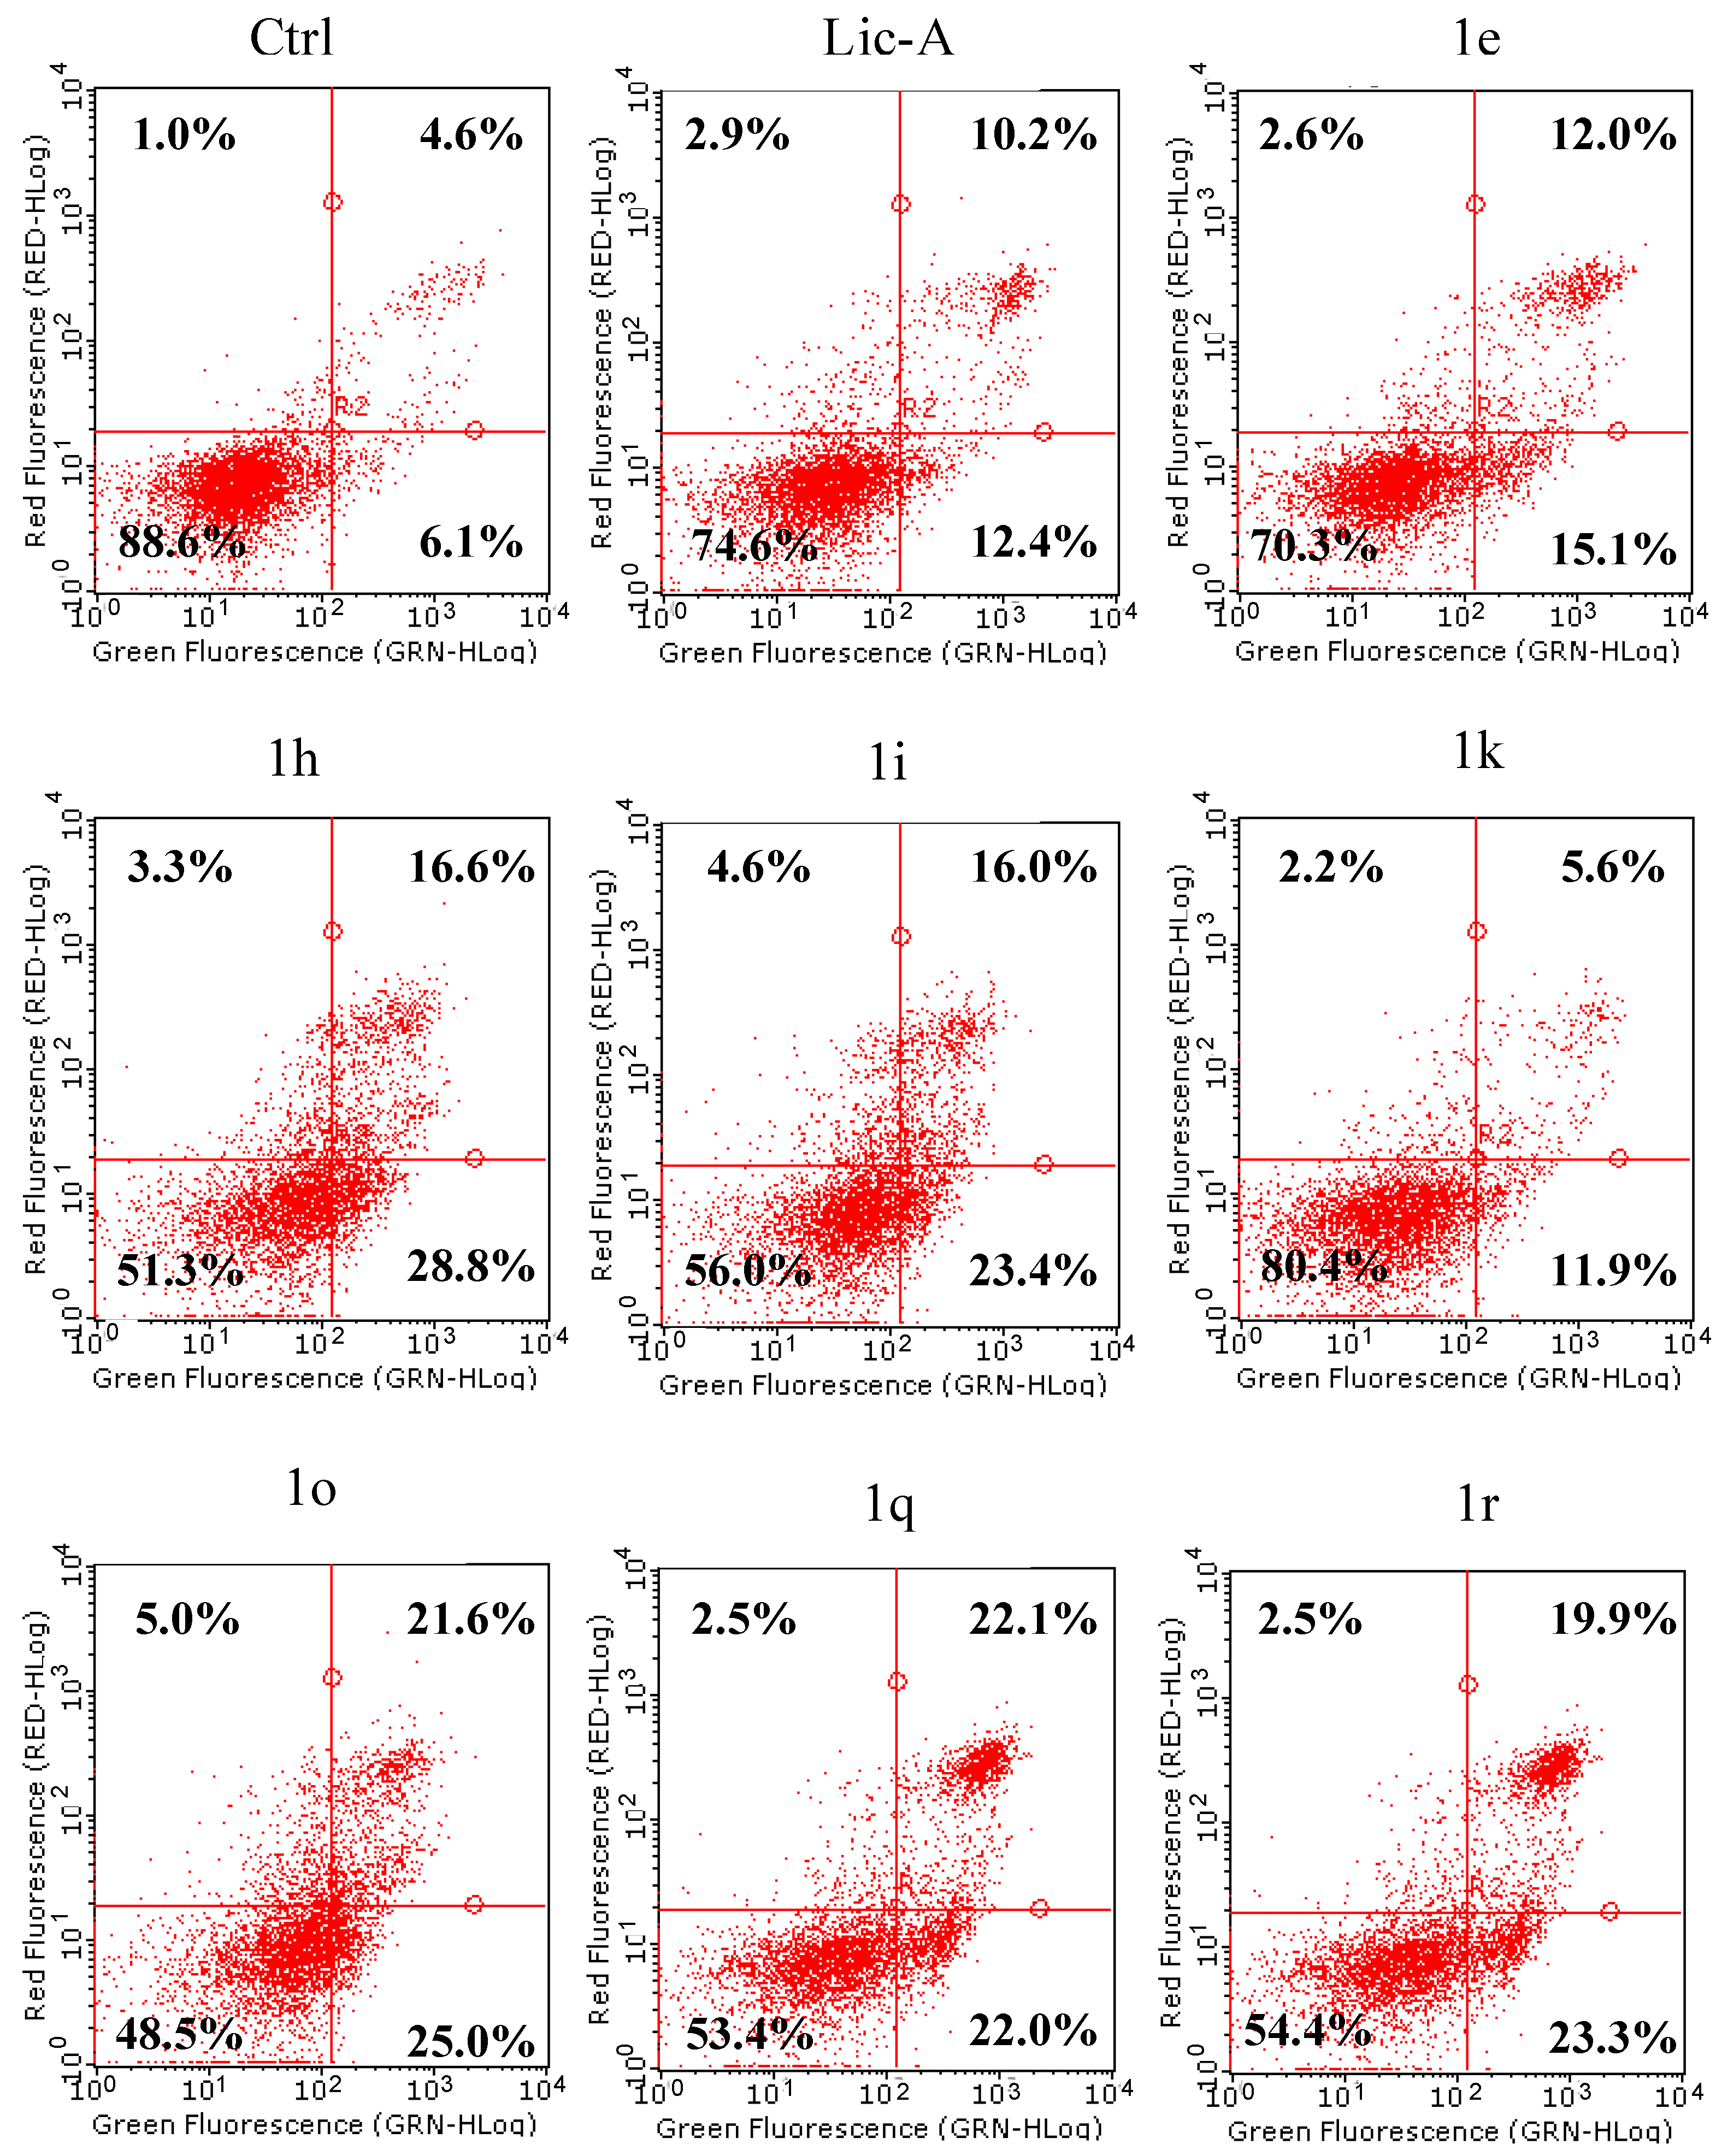
2.6. Effects on MG63 Apoptosis: Phosphatidylserine Exposure
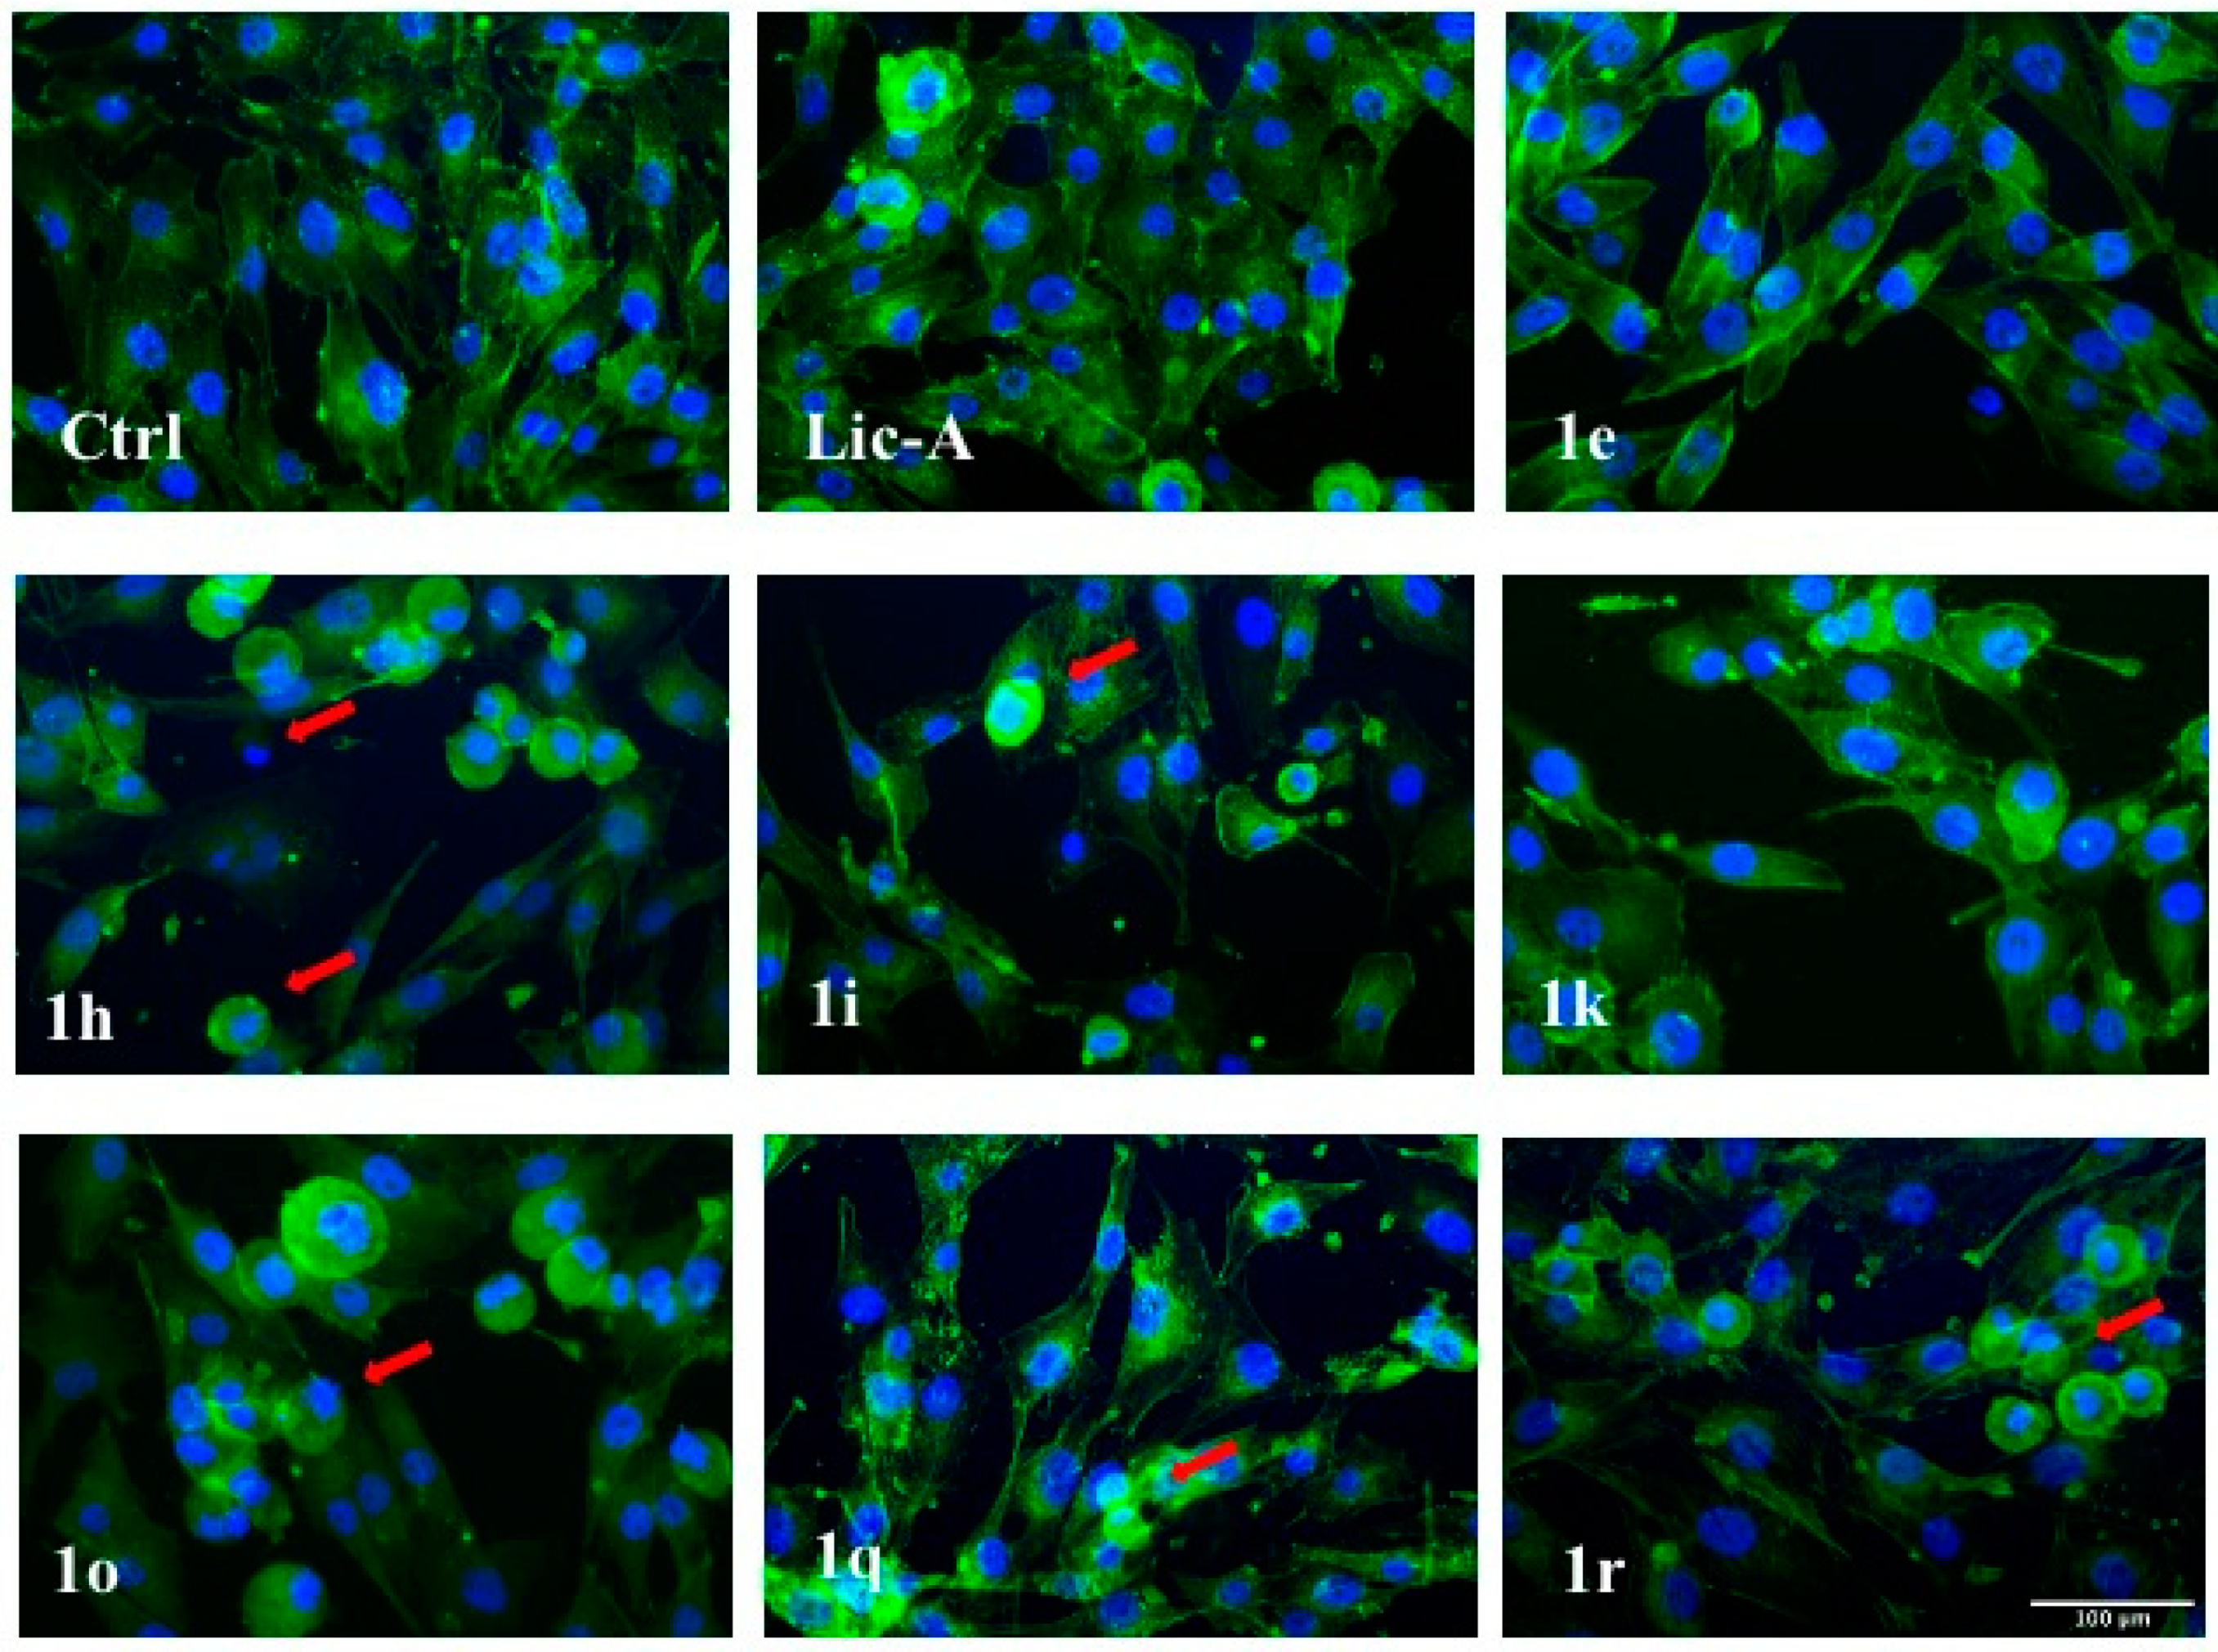
2.7. Effects on MG63 Apoptosis: Cytoskeleton Changes and Nuclear Morphology
3. Materials and Methods
3.1. Chemistry
3.1.1. General Methods
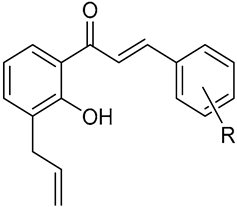
3.1.2. General Procedures for the Synthesis of Chalcones 1g, 1i, 1k–s
(E)-1-(3-Allyl-2-hydroxyphenyl)-3-(4-methoxyphenyl)prop-2-en-1-one (1g)
(E)-1-(3-Allyl-2-hydroxyphenyl)-3-(3-chlorophenyl)prop-2-en-1-one (1i)
(E)-1-(3-Allyl-2-hydroxyphenyl)-3-(2-hydroxyphenyl)prop-2-en-1-one (1k)
(E)-1-(3-Allyl-2-hydroxyphenyl)-3-(3-hydroxyphenyl)prop-2-en-1-one (1l)
(E)-1-(3-Allyl-2-hydroxyphenyl)-3-(4-hydroxyphenyl)prop-2-en-1-one (1m)
(E)-1-(3-Allyl-2-hydroxyphenyl)-3-(2-fluorophenyl)prop-2-en-1-one (1n)
(E)-1-(3-Allyl-2-hydroxyphenyl)-3-(3-fluorophenyl)prop-2-en-1-one (1o)
(E)-1-(3-Allyl-2-hydroxyphenyl)-3-(4-fluorophenyl)prop-2-en-1-one (1p)
(E)-1-(3-Allyl-2-hydroxyphenyl)-3-(2-nitrophenyl)prop-2-en-1-one (1q)
(E)-1-(3-Allyl-2-hydroxyphenyl)-3-(3-nitrophenyl)prop-2-en-1-one (1r)
(E)-1-(3-Allyl-2-hydroxyphenyl)-3-(4-nitrophenyl)prop-2-en-1-one (1s)
3.2. Cell Culture and Treatments
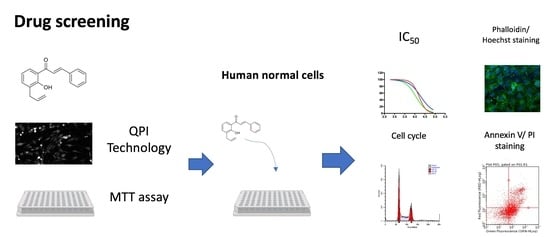
3.3. Quantitative Phase Imaging
3.4. MTT Viability Assay
3.5. Dose–Response Relationship and IC50 Calculation
3.6. Cell Cycle Analysis
3.7. Nuclei and F-Actin Staining
3.8. Annexin V/Propidium Staining
3.9. Statistical Analysis
4. Discussion and Conclusions
Supplementary Materials
Author Contributions
Funding
Institutional Review Board Statement
Informed Consent Statement
Data Availability Statement
Acknowledgments
Conflicts of Interest
Sample Availability
References
- Bacci, G.; Bertoni, F.; Longhi, A.; Ferrari, S.; Forni, C.; Biagini, R.; Bacchini, P.; Donati, D.; Manfrini, M.; Bernini, G.; et al. Neoadjuvant chemotherapy for high-grade central osteosarcoma of the extremity. Histologic response to preoperative chemotherapy correlates with histologic subtype of the tumor. Cancer 2003, 97, 3068–3075. [Google Scholar] [CrossRef] [PubMed]
- Longhi, A.; Errani, C.; De Paolis, M.; Mercuri, M.; Bacci, G. Primary bone osteosarcoma in the pediatric age: State of the art. Cancer Treat. Rev. 2006, 32, 423–436. [Google Scholar] [CrossRef] [PubMed]
- Ferrari, S.; Palmerini, E. Adjuvant and neoadjuvant combination chemotherapy for osteogenic sarcoma. Curr. Opin. Oncol. 2007, 19, 341–346. [Google Scholar] [CrossRef] [PubMed]
- Alfranca, A.; Martinez-Cruzado, L.; Tornin, J.; Abarrategi, A.; Amaral, T.; de Alava, E.; Menendez, P.; Garcia-Castro, J.; Rodriguez, R. Bone microenvironment signals in osteosarcoma development. Cell Mol. Life Sci. 2015, 72, 3097–3113. [Google Scholar] [CrossRef] [PubMed]
- Abarrategi, A.; Tornin, J.; Martinez-Cruzado, L.; Hamilton, A.; Martinez-Campos, E.; Rodrigo, J.P.; Gonzalez, M.V.; Baldini, N.; Garcia-Castro, J.; Rodriguez, R. Osteosarcoma: Cells-of-Origin, Cancer Stem Cells, and Targeted Therapies. Stem Cells Int. 2016, 2016, 3631764. [Google Scholar] [CrossRef]
- Allison, D.C.; Carney, S.C.; Ahlmann, E.R.; Hendifar, A.; Chawla, S.; Fedenko, A.; Angeles, C.; Menendez, L.R. A meta-analysis of osteosarcoma outcomes in the modern medical era. Sarcoma 2012, 2012, 704872. [Google Scholar] [CrossRef]
- Drews, J. Drug discovery: A historical perspective. Science 2000, 287, 1960–1964. [Google Scholar] [CrossRef]
- Atanasov, A.G.; Zotchev, S.B.; Dirsch, V.M.; The International Natural Product Sciences Taskforce; Supuran, C.T. Natural products in drug discovery: Advances and opportunities. Nat. Rev. Drug Discov. 2021, 20, 200–216. [Google Scholar] [CrossRef]
- Newman, D.J.; Cragg, G.M. Natural Products as Sources of New Drugs over the Nearly Four Decades from 01/1981 to 09/2019. J. Nat. Prod. 2020, 83, 770–803. [Google Scholar] [CrossRef]
- Salehi, B.; Quispe, C.; Chamkhi, I.; El Omari, N.; Balahbib, A.; Sharifi-Rad, J.; Bouyahya, A.; Akram, M.; Iqbal, M.; Docea, A.O.; et al. Pharmacological Properties of Chalcones: A Review of Preclinical Including Molecular Mechanisms and Clinical Evidence. Front. Pharmacol. 2020, 11, 592654. [Google Scholar] [CrossRef]
- Gomes, M.N.; Muratov, E.N.; Pereira, M.; Peixoto, J.C.; Rosseto, L.P.; Cravo, P.V.L.; Andrade, C.H.; Neves, B.J. Chalcone Derivatives: Promising Starting Points for Drug Design. Molecules 2017, 22, 1210. [Google Scholar] [CrossRef] [PubMed]
- Michalkova, R.; Mirossay, L.; Gazdova, M.; Kello, M.; Mojzis, J. Molecular Mechanisms of Antiproliferative Effects of Natural Chalcones. Cancers 2021, 13, 2730. [Google Scholar] [CrossRef] [PubMed]
- Lv, H.; Xiao, Q.; Zhou, J.; Feng, H.; Liu, G.; Ci, X. Licochalcone A Upregulates Nrf2 Antioxidant Pathway and Thereby Alleviates Acetaminophen-Induced Hepatotoxicity. Front. Pharmacol. 2018, 9, 147. [Google Scholar] [CrossRef]
- Liang, M.; Li, X.; Ouyang, X.; Xie, H.; Chen, D. Antioxidant Mechanisms of Echinatin and Licochalcone A. Molecules 2018, 24, 3. [Google Scholar] [CrossRef] [PubMed]
- Lu, W.J.; Wu, G.J.; Chen, R.J.; Chang, C.C.; Lien, L.M.; Chiu, C.C.; Tseng, M.F.; Huang, L.T.; Lin, K.H. Licochalcone A attenuates glioma cell growth in vitro and in vivo through cell cycle arrest. Food Funct. 2018, 9, 4500–4507. [Google Scholar] [CrossRef] [PubMed]
- Xue, L.; Zhang, W.J.; Fan, Q.X.; Wang, L.X. Licochalcone A inhibits PI3K/Akt/mTOR signaling pathway activation and promotes autophagy in breast cancer cells. Oncol. Lett. 2018, 15, 1869–1873. [Google Scholar] [CrossRef] [PubMed]
- Shen, T.S.; Hsu, Y.K.; Huang, Y.F.; Chen, H.Y.; Hsieh, C.P.; Chen, C.L. Licochalcone A Suppresses the Proliferation of Osteosarcoma Cells through Autophagy and ATM-Chk2 Activation. Molecules 2019, 24, 2435. [Google Scholar] [CrossRef]
- Lin, R.C.; Yang, S.F.; Chiou, H.L.; Hsieh, S.C.; Wen, S.H.; Lu, K.H.; Hsieh, Y.H. Licochalcone A-Induced Apoptosis Through the Activation of p38MAPK Pathway Mediated Mitochondrial Pathways of Apoptosis in Human Osteosarcoma Cells In Vitro and In Vivo. Cells 2019, 8, 1441. [Google Scholar] [CrossRef]
- Gobbi, S.; Rampa, A.; Bisi, A.; Belluti, F.; Piazzi, L.; Valenti, P.; Caputo, A.; Zampiron, A.; Carrara, M. Synthesis and biological evaluation of 3-alkoxy analogues of flavone-8-acetic acid. J. Med. Chem. 2003, 46, 3662–3669. [Google Scholar] [CrossRef]
- Bennett, C.J.; Caldwell, S.T.; McPhail, D.B.; Morrice, P.C.; Duthie, G.G.; Hartley, R.C. Potential therapeutic antioxidants that combine the radical scavenging ability of myricetin and the lipophilic chain of vitamin E to effectively inhibit microsomal lipid peroxidation. Bioorg. Med. Chem. 2004, 12, 2079–2098. [Google Scholar] [CrossRef]
- Nepali, K.; Lee, H.Y.; Liou, J.P. Nitro-Group-Containing Drugs. J. Med. Chem. 2019, 62, 2851–2893. [Google Scholar] [CrossRef] [PubMed]
- Malucelli, E.; Procopio, A.; Fratini, M.; Gianoncelli, A.; Notargiacomo, A.; Merolle, L.; Sargenti, A.; Castiglioni, S.; Cappadone, C.; Farruggia, G.; et al. Single cell versus large population analysis: Cell variability in elemental intracellular concentration and distribution. Anal. Bioanal. Chem. 2018, 410, 337–348. [Google Scholar] [CrossRef] [PubMed]
- Azevedo, A.; Farinha, D.; Geraldes, C.; Faneca, H. Combining gene therapy with other therapeutic strategies and imaging agents for cancer theranostics. Int. J. Pharm. 2021, 606, 120905. [Google Scholar] [CrossRef] [PubMed]
- LeBleu, V.S.; Neilson, E.G. Origin and functional heterogeneity of fibroblasts. FASEB J. 2020, 34, 3519–3536. [Google Scholar] [CrossRef] [PubMed]
- Lee, S.H.; Meng, X.W.; Flatten, K.S.; Loegering, D.A.; Kaufmann, S.H. Phosphatidylserine exposure during apoptosis reflects bidirectional trafficking between plasma membrane and cytoplasm. Cell Death Differ. 2013, 20, 64–76. [Google Scholar] [CrossRef]
- Franklin-Tong, V.E.; Gourlay, C.W. A role for actin in regulating apoptosis/programmed cell death: Evidence spanning yeast, plants and animals. Biochem. J. 2008, 413, 389–404. [Google Scholar] [CrossRef]
- Desouza, M.; Gunning, P.W.; Stehn, J.R. The actin cytoskeleton as a sensor and mediator of apoptosis. Bioarchitecture 2012, 2, 75–87. [Google Scholar] [CrossRef]
- Kasprowicz, R.; Suman, R.; O’Toole, P. Characterising live cell behaviour: Traditional label-free and quantitative phase imaging approaches. Int. J. Biochem. Cell Biol. 2017, 84, 89–95. [Google Scholar] [CrossRef]
- Erba, E.; Ubezio, P.; Pepe, S.; Vaghi, M.; Marsoni, S.; Torri, W.; Mangioni, C.; Landoni, F.; D’Incalci, M. Flow cytometric analysis of DNA content in human ovarian cancers. Br. J. Cancer 1989, 60, 45–50. [Google Scholar] [CrossRef]


 | |||
|---|---|---|---|
| Cpd | R | Cell Number (%) a | IC50 (95% CI) b µM |
| Lic-A | 43.01 ± 9% | 10.4 (9.4–11.4) | |
| 1a c | H | 75.05 ± 4.58% | n.d. |
| 1b c | 2-CH3 | 78.07 ± 5.72% | n.d. |
| 1c c | 3-CH3 | 62.94 ± 4.55% | n.d. |
| 1d c | 4-CH3 | 79.44 ± 11.12% | n.d. |
| 1ec | 2-OCH3 | 53.55 ± 6.87% | 42.5 (22.9–78.8) |
| 1f c | 3-OCH3 | 64.51 ± 26.9% | n.d. |
| 1g | 4-OCH3 | 72.12 ± 9.37% | n.d. |
| 1hc | 2-Cl | 54.26 ± 8.62% | 17.0 (15.4–18.9) |
| 1i | 3-Cl | 51.11 ± 3.66% | 12.7 (11.5–14.0) |
| 1j c | 4-Cl | 70.15 ± 6.85% | n.d. |
| 1k | 2-OH | 51.99 ± 3.33% | 14.5 (12.0–17.5) |
| 1l | 3-OH | 64.26 ± 8.602% | n.d. |
| 1m | 4-OH | 69.83 ± 6.35% | n.d. |
| 1n | 2-F | 63.47 ± 9.66% | n.d. |
| 1o | 3-F | 52.55 ± 8.25% | 13.8 (12.4–15.3) |
| 1p | 4-F | 71.67 ± 9.72% | n.d. |
| 1q | 2-NO2 | 45.18 ± 10.94% | 10.6 (10.2–11.1) |
| 1r | 3-NO2 | 45.66 ± 4.61% | 12.2 (11.6–12.8) |
| 1s | 4-NO2 | 84.16 ± 12.46% | n.d. |
Publisher’s Note: MDPI stays neutral with regard to jurisdictional claims in published maps and institutional affiliations. |
© 2022 by the authors. Licensee MDPI, Basel, Switzerland. This article is an open access article distributed under the terms and conditions of the Creative Commons Attribution (CC BY) license (https://creativecommons.org/licenses/by/4.0/).
Share and Cite
Rossi, M.; Cappadone, C.; Picone, G.; Bisi, A.; Farruggia, G.; Belluti, F.; Blasi, P.; Gobbi, S.; Malucelli, E. Natural-like Chalcones with Antitumor Activity on Human MG63 Osteosarcoma Cells. Molecules 2022, 27, 3751. https://doi.org/10.3390/molecules27123751
Rossi M, Cappadone C, Picone G, Bisi A, Farruggia G, Belluti F, Blasi P, Gobbi S, Malucelli E. Natural-like Chalcones with Antitumor Activity on Human MG63 Osteosarcoma Cells. Molecules. 2022; 27(12):3751. https://doi.org/10.3390/molecules27123751
Chicago/Turabian StyleRossi, Martina, Concettina Cappadone, Giovanna Picone, Alessandra Bisi, Giovanna Farruggia, Federica Belluti, Paolo Blasi, Silvia Gobbi, and Emil Malucelli. 2022. "Natural-like Chalcones with Antitumor Activity on Human MG63 Osteosarcoma Cells" Molecules 27, no. 12: 3751. https://doi.org/10.3390/molecules27123751
APA StyleRossi, M., Cappadone, C., Picone, G., Bisi, A., Farruggia, G., Belluti, F., Blasi, P., Gobbi, S., & Malucelli, E. (2022). Natural-like Chalcones with Antitumor Activity on Human MG63 Osteosarcoma Cells. Molecules, 27(12), 3751. https://doi.org/10.3390/molecules27123751