
Analytical Performance and Greenness Evaluation of Five Multi-Level Design Models Utilized for Impurity Profiling of Favipiravir, a Promising COVID-19 Antiviral Drug


Abstract
:1. Introduction
2. Results
2.1. Method Validation
2.1.1. Calibration Matrix Design
2.1.2. CLS Model Construction
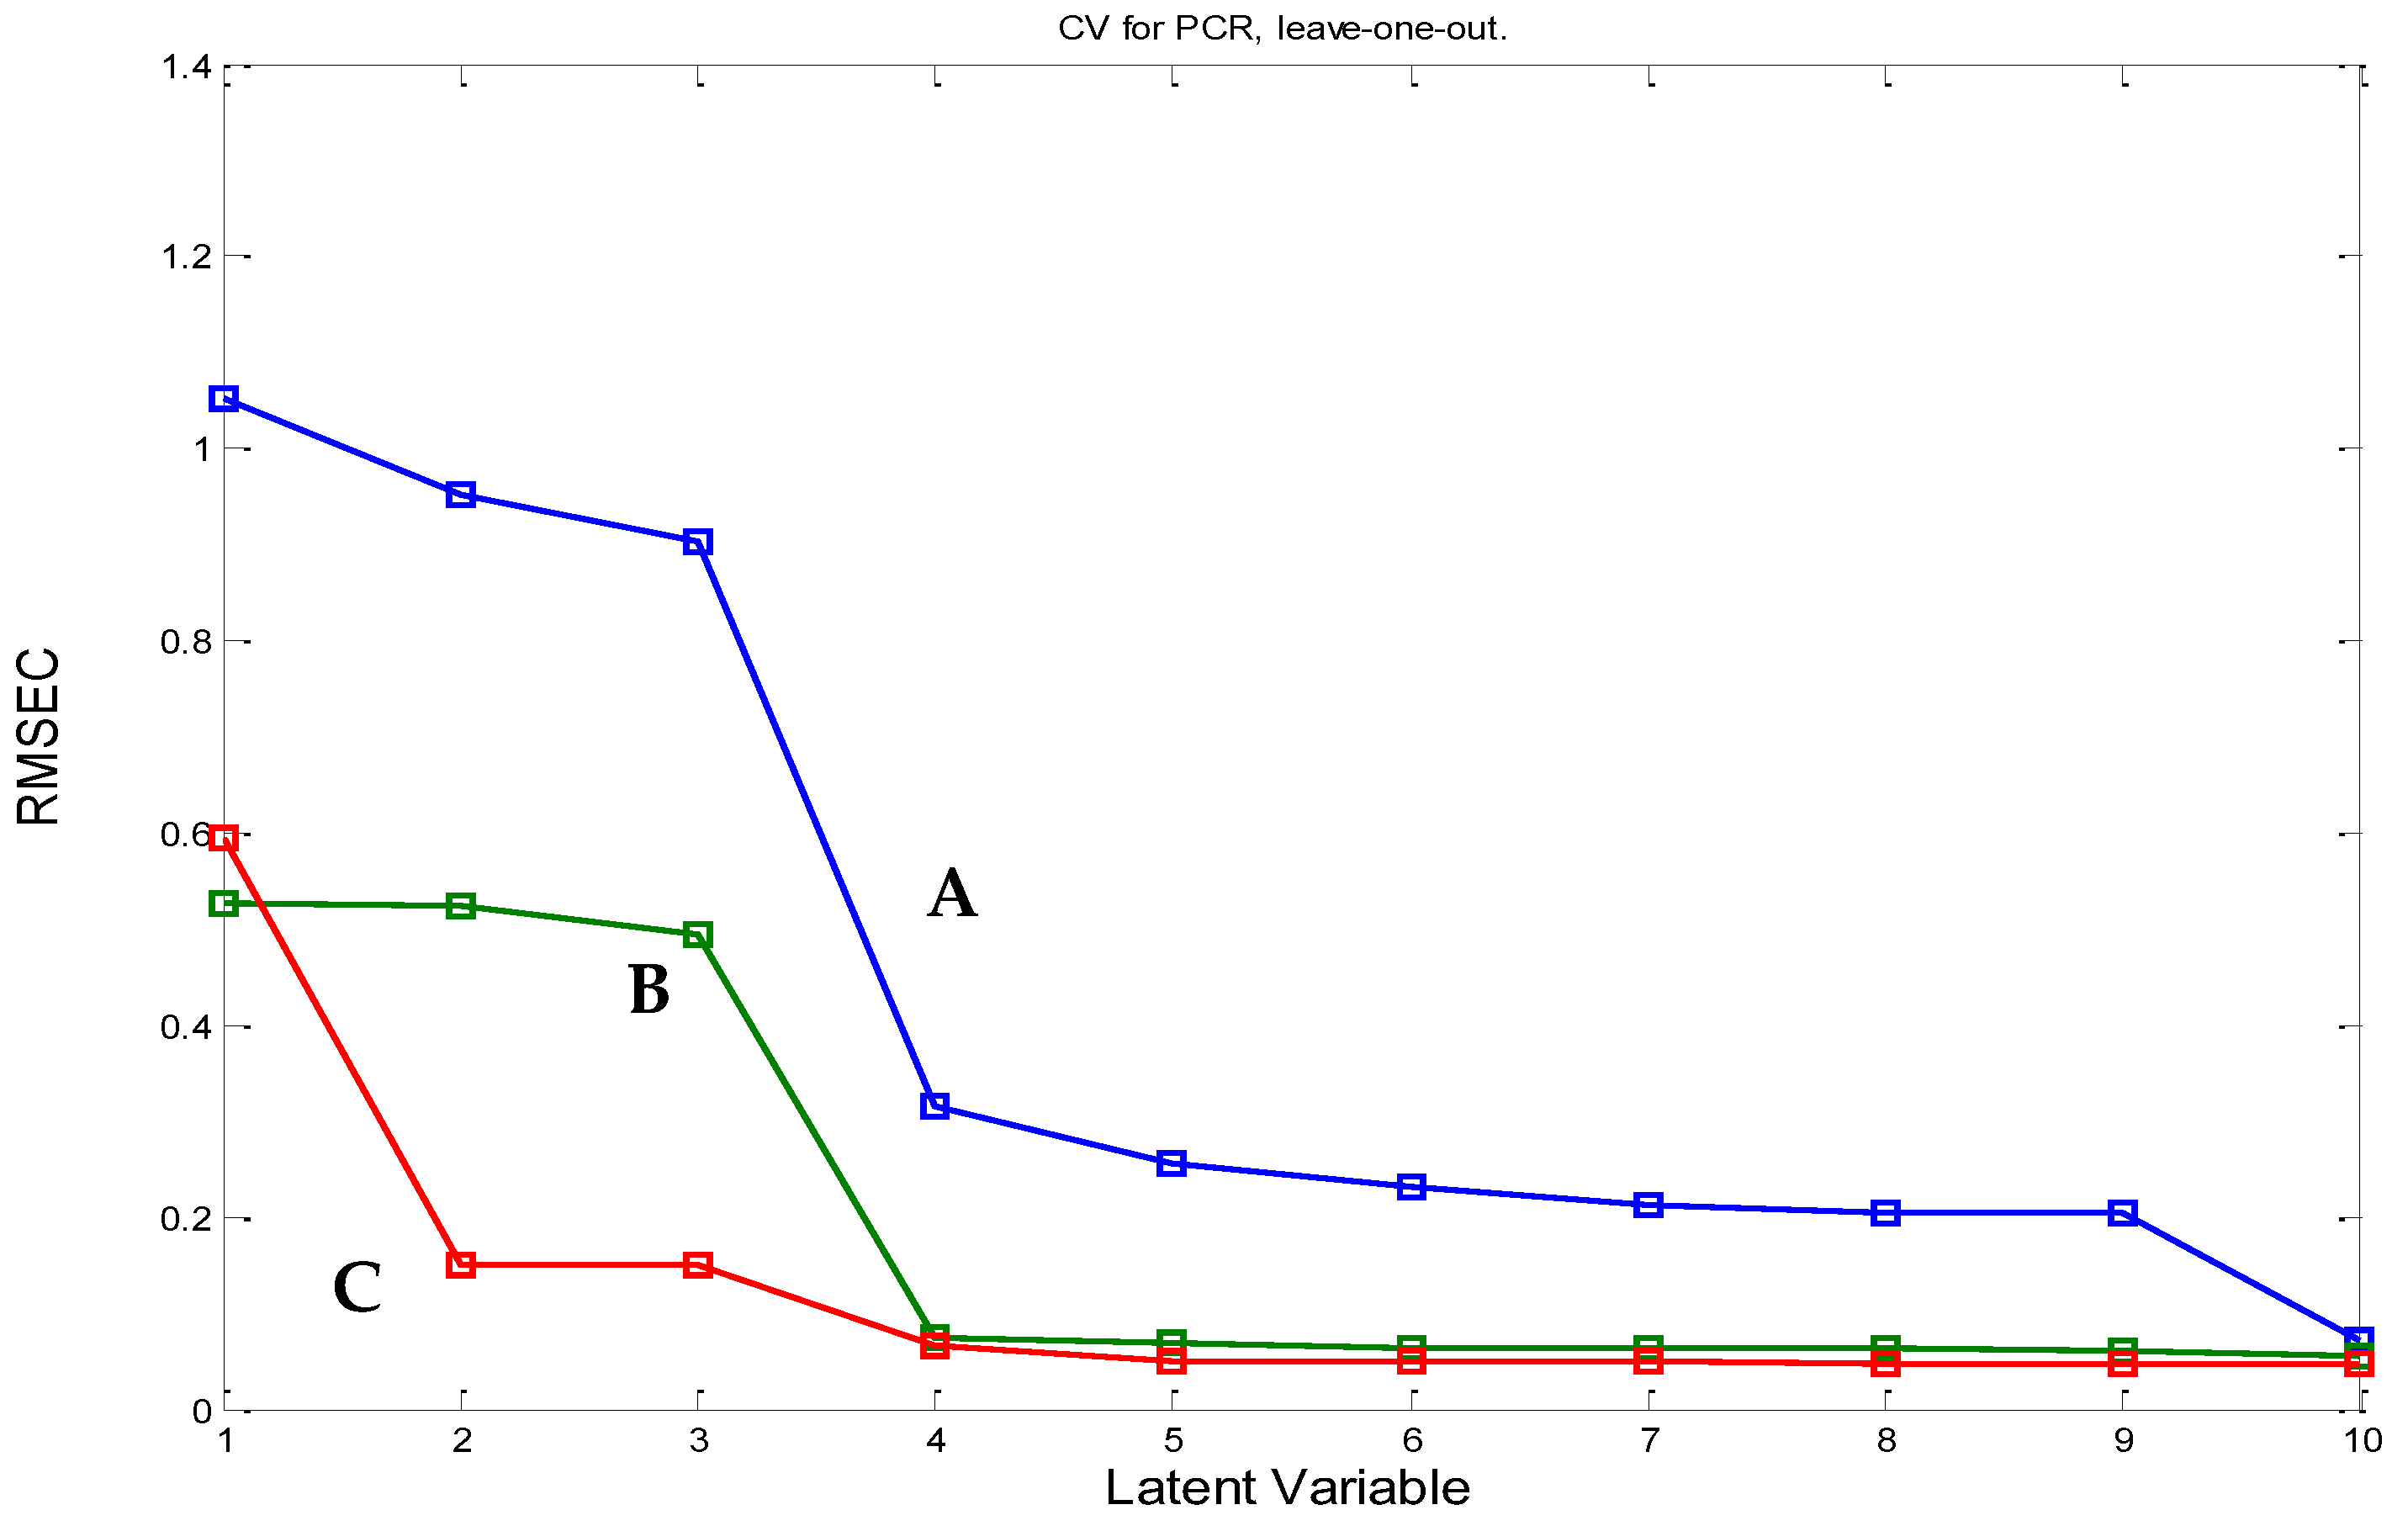
2.1.3. PCR and PLS Model Construction
2.1.4. GA-PLS Model Construction
2.1.5. ANN Model Construction
2.2. Models’ Validation, Evaluation, and Comparison
2.3. Methods’ Application and Statistical Comparison
2.4. Assessment of the Proposed Method against Reported Research
3. Materials and Methods
3.1. Materials
3.2. Instruments and Software
3.3. Standard Stock Solutions
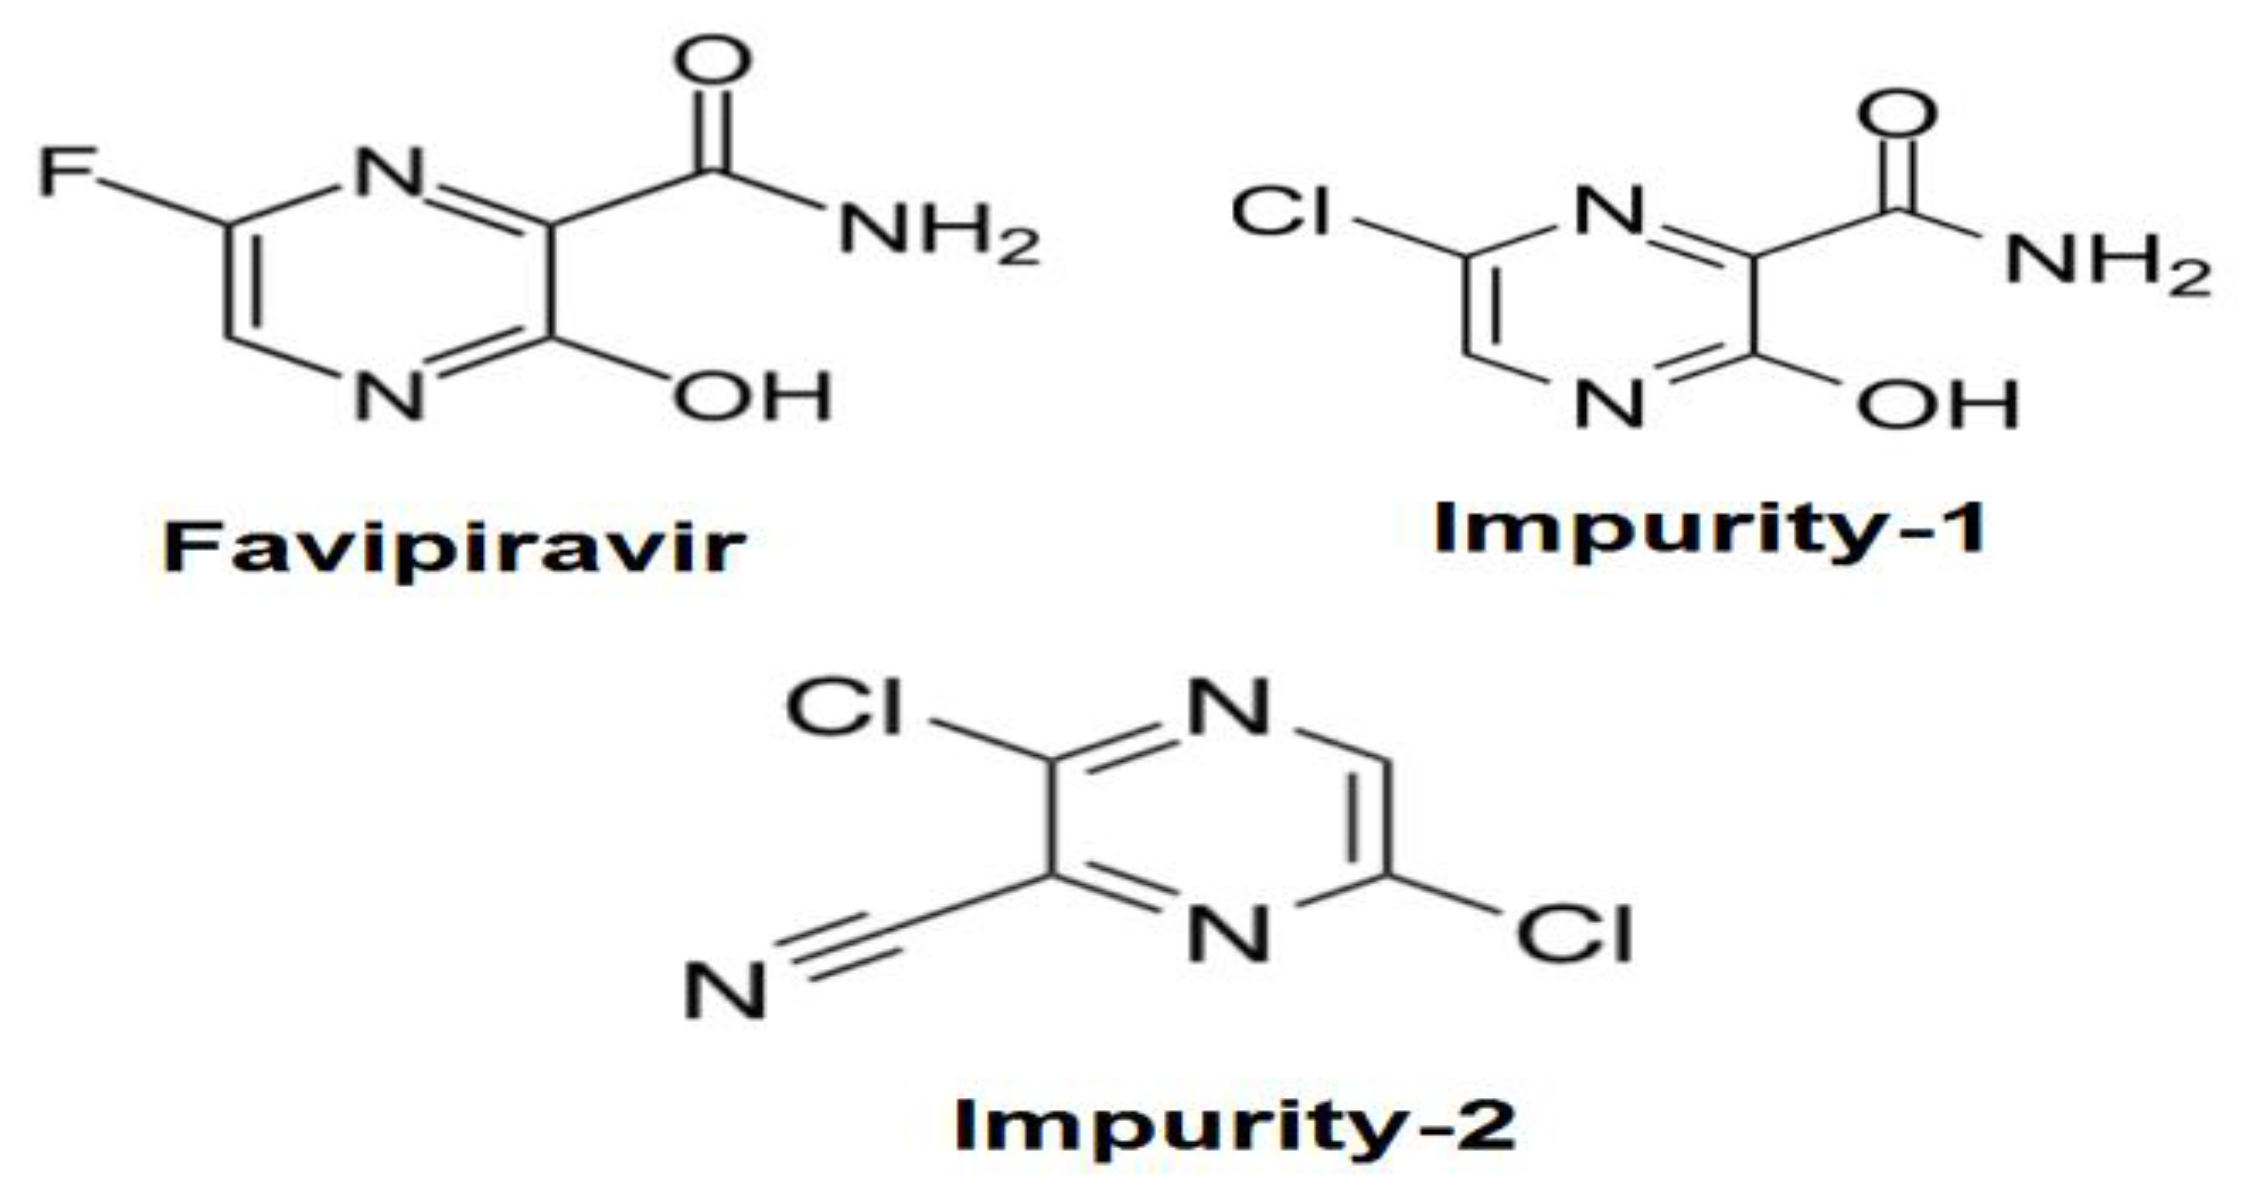
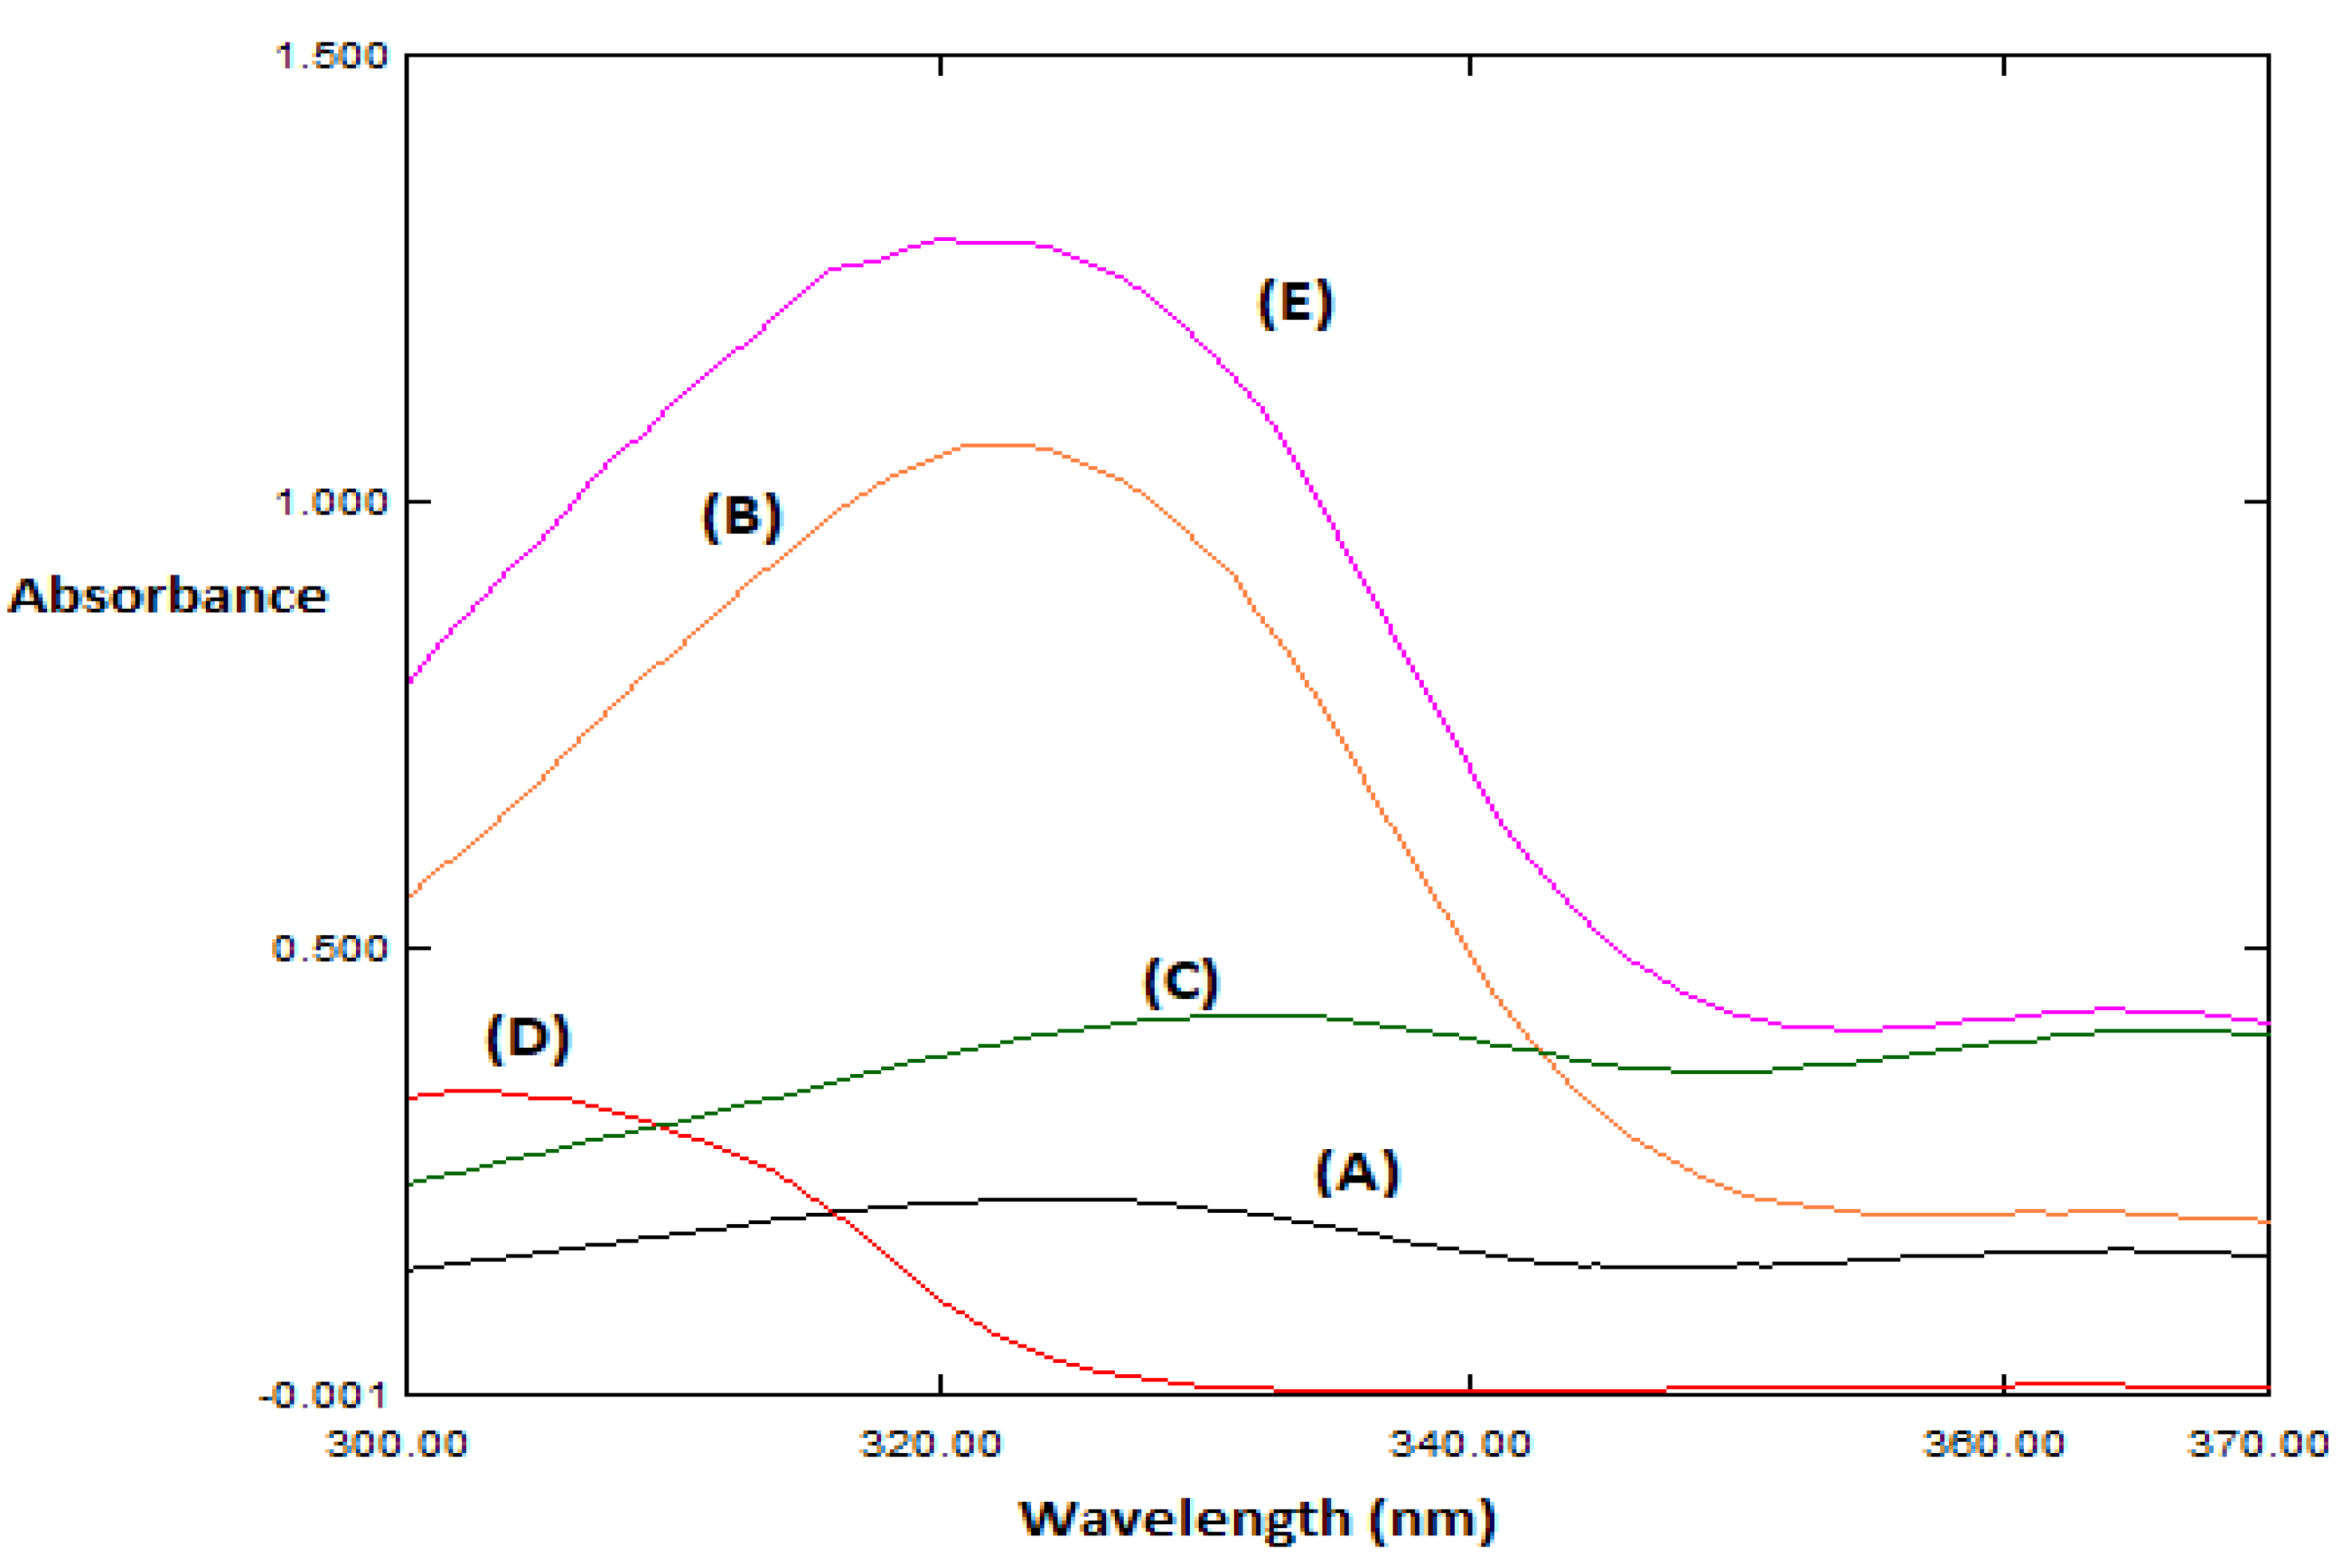
3.4. Spectral Characteristics
3.5. Multi-Level Multi-Factor Design Construction
3.6. Preparation of Dosage Form for Analysis
4. Conclusions
Supplementary Materials
Author Contributions
Funding
Institutional Review Board Statement
Informed Consent Statement
Data Availability Statement
Conflicts of Interest
Sample Availability
References
- Hiscott, J.; Alexandridi, M.; Muscolini, M.; Tassone, E.; Palermo, E.; Soultsioti, M.; Zevini, A. The global impact of the coronavirus pandemic. Cytokine Growth Factor Rev. 2020, 53, 1–9. [Google Scholar] [CrossRef] [PubMed]
- WHO. WHO COVID-19 Dashboard. Available online: https://covid19.who.int/ (accessed on 25 December 2021).
- Cai, Q.; Yang, M.; Liu, D.; Chen, J.; Shu, D.; Xia, J.; Liao, X.; Gu, Y.; Cai, Q.; Yang, Y. Experimental treatment with favipiravir for COVID-19: An open-label control study. Engineering 2020, 6, 1192–1198. [Google Scholar] [CrossRef]
- Berlin, D.A.; Gulick, R.M.; Martinez, F.J. Severe COVID-19. N. Engl. J. Med. 2020, 383, 2451–2460. [Google Scholar] [CrossRef]
- Joshi, S.; Parkar, J.; Ansari, A.; Vora, A.; Talwar, D.; Tiwaskar, M.; Patil, S.; Barkate, H. Role of favipiravir in the treatment of COVID-19. Int. J. Infect. Dis. 2020, 102, 501–508. [Google Scholar] [CrossRef] [PubMed]
- Mirza, M.U.; Froeyen, M. Structural elucidation of SARS-CoV-2 vital proteins: Computational methods reveal potential drug candidates against main protease, Nsp12 polymerase and Nsp13 helicase. J. Pharm. Anal. 2020, 10, 320–328. [Google Scholar] [CrossRef]
- Shannon, A.; Selisko, B.; Le, N.; Huchting, J.; Touret, F.; Piorkowski, G.; Fattorini, V.; Ferron, F.; Decroly, E.; Meier, C. Favipiravir strikes the SARS-CoV-2 at its Achilles heel, the RNA polymerase. bioRxiv 2020. [Google Scholar] [CrossRef]
- Agrawal, U.; Raju, R.; Udwadia, Z.F. Favipiravir: A new and emerging antiviral option in COVID-19. Med. J. Armed Forces India 2020, 76, 367–370. [Google Scholar] [CrossRef] [PubMed]
- El Deeb, S.; Ibrahim, A.E.; Al-Harrasi, A.; Wolber, G.; Gust, R. Validated Capillary Zone Electrophoresis Method for Impurity Profiling and Determination of NiII(3-OMe-Salophene). Separations 2022, 9, 25. [Google Scholar] [CrossRef]
- Mishima, E.; Anzai, N.; Miyazaki, M.; Abe, T. Uric acid elevation by favipiravir, an antiviral drug. Tohoku J. Exp. Med. 2020, 251, 87–90. [Google Scholar] [CrossRef] [PubMed]
- Guo, Q.; Xu, M.; Guo, S.; Zhu, F.; Xie, Y.; Shen, J. The complete synthesis of favipiravir from 2-aminopyrazine. Chem. Pap. 2019, 73, 1043–1051. [Google Scholar] [CrossRef]
- Egawa, H.; Furuta, Y.; Sugita, J.; Uehara, S.; Hamamoto, S.; Yonezawa, K. Novel pyrazine derivatives or salts thereof, pharmaceutical compositions containing the derivatives or the salts and intermediates for the preparation of both. Patent Application Japenese Patent PCT/JP2001/001038; International Publication Number: WO 2001, 60834, 19 June 2006. [Google Scholar]
- Madelain, V.; Guedj, J.; Nguyen, T.H.T.; Jacquot, F.; Oestereich, L.; Kadota, T.; Yamada, K.; Taburet, A.-M.; de Lamballerie, X.; Raoul, H. Favipiravir pharmacokinetics in nonhuman primates and insights for future efficacy studies of hemorrhagic fever viruses. Antimicrob. Agents Chemother. 2017, 61, e01305–e01316. [Google Scholar] [CrossRef] [PubMed] [Green Version]
- Smee, D.F.; Hurst, B.L.; Egawa, H.; Takahashi, K.; Kadota, T.; Furuta, Y. Intracellular metabolism of favipiravir (T-705) in uninfected and influenza A (H5N1) virus-infected cells. J. Antimicrob. Chemother. 2009, 64, 741–746. [Google Scholar] [CrossRef] [PubMed]
- Nguyen, T.H.T.; Guedj, J.; Anglaret, X.; Laouénan, C.; Madelain, V.; Taburet, A.-M.; Baize, S.; Sissoko, D.; Pastorino, B.; Rodallec, A. Favipiravir pharmacokinetics in Ebola-Infected patients of the JIKI trial reveals concentrations lower than targeted. PLoS Negl. Trop. Dis. 2017, 11, e0005389. [Google Scholar] [CrossRef] [Green Version]
- Gowen, B.B.; Sefing, E.J.; Westover, J.B.; Smee, D.F.; Hagloch, J.; Furuta, Y.; Hall, J.O. Alterations in favipiravir (T-705) pharmacokinetics and biodistribution in a hamster model of viral hemorrhagic fever. Antivir. Res. 2015, 121, 132–137. [Google Scholar] [CrossRef] [Green Version]
- Bulduk, İ. HPLC-UV method for quantification of favipiravir in pharmaceutical formulations. Acta Chromatogr. 2021, 33, 209–215. [Google Scholar] [CrossRef]
- Hailat, M.; Al-Ani, I.; Hamad, M.; Zakareia, Z.; Abu Dayyih, W. Development and Validation of a Method for Quantification of Favipiravir as COVID-19 Management in Spiked Human Plasma. Molecules 2021, 26, 3789. [Google Scholar] [CrossRef] [PubMed]
- Mikhail, I.E.; Elmansi, H.; Belal, F.; Ehab Ibrahim, A. Green micellar solvent-free HPLC and spectrofluorimetric determination of favipiravir as one of COVID-19 antiviral regimens. Microchem. J. 2021, 165, 106189. [Google Scholar] [CrossRef] [PubMed]
- Rezk, M.R.; Badr, K.A.; Abdel-Naby, N.S.; Ayyad, M.M. A novel, rapid and simple UPLC–MS/MS method for quantification of favipiravir in human plasma: Application to a bioequivalence study. Biomed. Chromatogr. 2021, 35, e5098. [Google Scholar] [CrossRef] [PubMed]
- Onmaz, D.E.; Abusoglu, S.; Onmaz, M.; Yerlikaya, F.H.; Unlu, A. Development and validation of a sensitive, fast and simple LC-MS/MS method for the quantitation of favipiravir in human serum. J. Chromatogr. B 2021, 1176, 122768. [Google Scholar] [CrossRef] [PubMed]
- Morsy, M.I.; Nouman, E.G.; Abdallah, Y.M.; Zainelabdeen, M.A.; Darwish, M.M.; Hassan, A.Y.; Gouda, A.S.; Rezk, M.R.; Abdel-Megied, A.M.; Marzouk, H.M. A novel LC-MS/MS method for determination of the potential antiviral candidate favipiravir for the emergency treatment of SARS-CoV-2 virus in human plasma: Application to a bioequivalence study in Egyptian human volunteers. J. Pharm. Biomed. Anal. 2021, 199, 114057. [Google Scholar] [CrossRef]
- Sharaf, Y.A.; El Deeb, S.; Ibrahim, A.E.; Al-Harrasi, A.; Sayed, R.A. Two Green Micellar HPLC and Mathematically Assisted UV Spectroscopic Methods for the Simultaneous Determination of Molnupiravir and Favipiravir as a Novel Combined COVID-19 Antiviral Regimen. Molecules 2022, 27, 2330. [Google Scholar] [CrossRef]
- Saraya, R.E.; Deeb, S.E.; Salman, B.I.; Ibrahim, A.E. Highly sensitive high-performance thin-layer chromatography method for the simultaneous determination of Molnupiravir, Favipiravir, and Ritonavir in pure forms and pharmaceutical formulations. J. Sep. Sci. 2022; in press. [Google Scholar] [CrossRef] [PubMed]
- Emam, A.A.; Abdelaleem, E.A.; Abdelmomen, E.H.; Abdelmoety, R.H.; Abdelfatah, R.M. Rapid and ecofriendly UPLC quantification of Remdesivir, Favipiravir and Dexamethasone for accurate therapeutic drug monitoring in Covid-19 Patient’s plasma. Microchem. J. 2022, 179, 107580. [Google Scholar] [CrossRef]
- Megahed, S.M.; Habib, A.A.; Hammad, S.F.; Kamal, A.H. Experimental design approach for development of spectrofluorimetric method for determination of favipiravir; a potential therapeutic agent against COVID-19 virus: Application to spiked human plasma. Spectrochim. Acta Part A Mol. Biomol. Spectrosc. 2020, 249, 119241. [Google Scholar] [CrossRef] [PubMed]
- El Sharkasy, M.E.; Tolba, M.M.; Belal, F.; Walash, M.; Aboshabana, R. Quantitative analysis of favipiravir and hydroxychloroquine as FDA-approved drugs for treatment of COVID-19 using synchronous spectrofluorimetry: Application to pharmaceutical formulations and biological fluids. Luminescence, 2022; in press. [Google Scholar] [CrossRef]
- Allahverdiyeva, S.; Yunusoğlu, O.; Yardım, Y.; Şentürk, Z. First electrochemical evaluation of favipiravir used as an antiviral option in the treatment of COVID-19: A study of its enhanced voltammetric determination in cationic surfactant media using a boron-doped diamond electrode. Anal. Chim. Acta 2021, 1159, 338418. [Google Scholar] [CrossRef]
- Kanbeş Dindar, Ç.; Bozal-Palabiyik, B.; Uslu, B. Development of a Diamond Nanoparticles-based Nanosensor for Detection and Determination of Antiviral Drug Favipiravir. Electroanalysis, 2022; in press. [Google Scholar] [CrossRef]
- Marzouk, H.M.; Rezk, M.R.; Gouda, A.S.; Abdel-Megied, A.M. A Novel Stability-Indicating HPLC-DAD Method for Determination of Favipiravir, a Potential Antiviral Drug for COVID-19 Treatment; Application to Degradation Kinetic Studies and In-Vitro Dissolution Profiling. Microchem. J. 2022, 172, 106917. [Google Scholar] [CrossRef]
- Ali, S.N.S.; Mobina, L.; Mehfuza, M.; Patel, S.; Ahmed, A.; Khan, G. Analytical method development and validation and forced degradation stability-indicating studies of Favipiravir by RP-HPLC and UV in bulk and pharmaceutical dosage form. J. Pharm. Res. Int 2021, 33, 254–271. [Google Scholar] [CrossRef]
- Egyptian International Pharmaceutical Industries Co (EIPICo). Pharmaceutical Company Located in Tenth of Ramadan City, Egypt. Available online: https://www.eipico.com.eg/ (accessed on 25 December 2021).
- Sayed, R.A.; Ibrahim, A.E.; Sharaf, Y.A. Chemometry-assisted UV-spectrophotmetric methods for the simultaneous determination of paritaprevir, ritonavir, and ombitasvir in their combined tablet dosage forms: A comparative study. J. Chemom. 2021, 35, e3339. [Google Scholar] [CrossRef]
- Kramer, R. Chemometric Techniques for Quantitative Analysis; CRC Press: Boca Raton, FL, USA, 1998. [Google Scholar]
- Sasaki, K.; Kawata, S.; Minami, S. Optimal wavelength selection for quantitative analysis. Appl. Spectrosc. 1986, 40, 185–190. [Google Scholar] [CrossRef]
- Haaland, D.M.; Thomas, E.V. Partial least-squares methods for spectral analyses. 1. Relation to other quantitative calibration methods and the extraction of qualitative information. Anal. Chem. 1988, 60, 1193–1202. [Google Scholar] [CrossRef]
- Abbaspour, A.; Baramakeh, L. Application of principle component analysis–artificial neural network for simultaneous determination of zirconium and hafnium in real samples. Spectrochim. Acta Part A Mol. Biomol. Spectrosc. 2006, 64, 477–482. [Google Scholar] [CrossRef] [PubMed]
- Beale, M.H.; Hagan, M.T.; Demuth, H.B. Neural Network Toolbox. User’s Guide MathWorks; The MathWorks Inc.: Natick, MA, USA, 2010; Volume 2, pp. 77–81. [Google Scholar]
- Galera, M.M.; García, M.G.; Goicoechea, H. The application to wastewaters of chemometric approaches to handling problems of highly complex matrices. TrAC Trends Anal. Chem. 2007, 26, 1032–1042. [Google Scholar] [CrossRef]
- Ibrahim, A.E.; Elmaaty, A.A.; El-Sayed, H.M. Determination of six drugs used for treatment of common cold by micellar liquid chromatography. Anal. Bioanal. Chem. 2021, 413, 5051–5065. [Google Scholar] [CrossRef]
- Gałuszka, A.; Migaszewski, Z.M.; Konieczka, P.; Namieśnik, J. Analytical Eco-Scale for assessing the greenness of analytical procedures. TrAC Trends Anal. Chem. 2012, 37, 61–72. [Google Scholar] [CrossRef]
- Płotka-Wasylka, J. A new tool for the evaluation of the analytical procedure: Green Analytical Procedure Index. Talanta 2018, 181, 204–209. [Google Scholar] [CrossRef]
- Pena-Pereira, F.; Wojnowski, W.; Tobiszewski, M. AGREE—Analytical GREEnness Metric Approach and Software. Anal. Chem. 2020, 92, 10076–10082. [Google Scholar] [CrossRef] [PubMed]
- Brereton, R.G. Multilevel multifactor designs for multivariatecalibration. Analyst 1997, 122, 1521–1529. [Google Scholar] [CrossRef]

| Parameter | FVR | Impurity-1 | Impurity-2 |
|---|---|---|---|
| Population size | 36 | 36 | 36 |
| Maximum generations | 49 | 49 | 49 |
| Mutation rate | 0.005 | 0.005 | 0.005 |
| The number of variables in a window (window width) | 2 | 2 | 2 |
| % population the same at convergence | 100 | 100 | 100 |
| % Wavelengths used at initiation | 50 | 50 | 50 |
| Crossover type | Double | Double | Double |
| Maximum number of latent variables | 6 | 6 | 6 |
| Cross validation | Random | Random | Random |
| Number of subsets to divide data into for cross validation | 5 | 5 | 5 |
| Parameter | CLS | PCR | PLS | GA-PLS | ANN |
|---|---|---|---|---|---|
| Wavelength range * | 300–370 nm | ||||
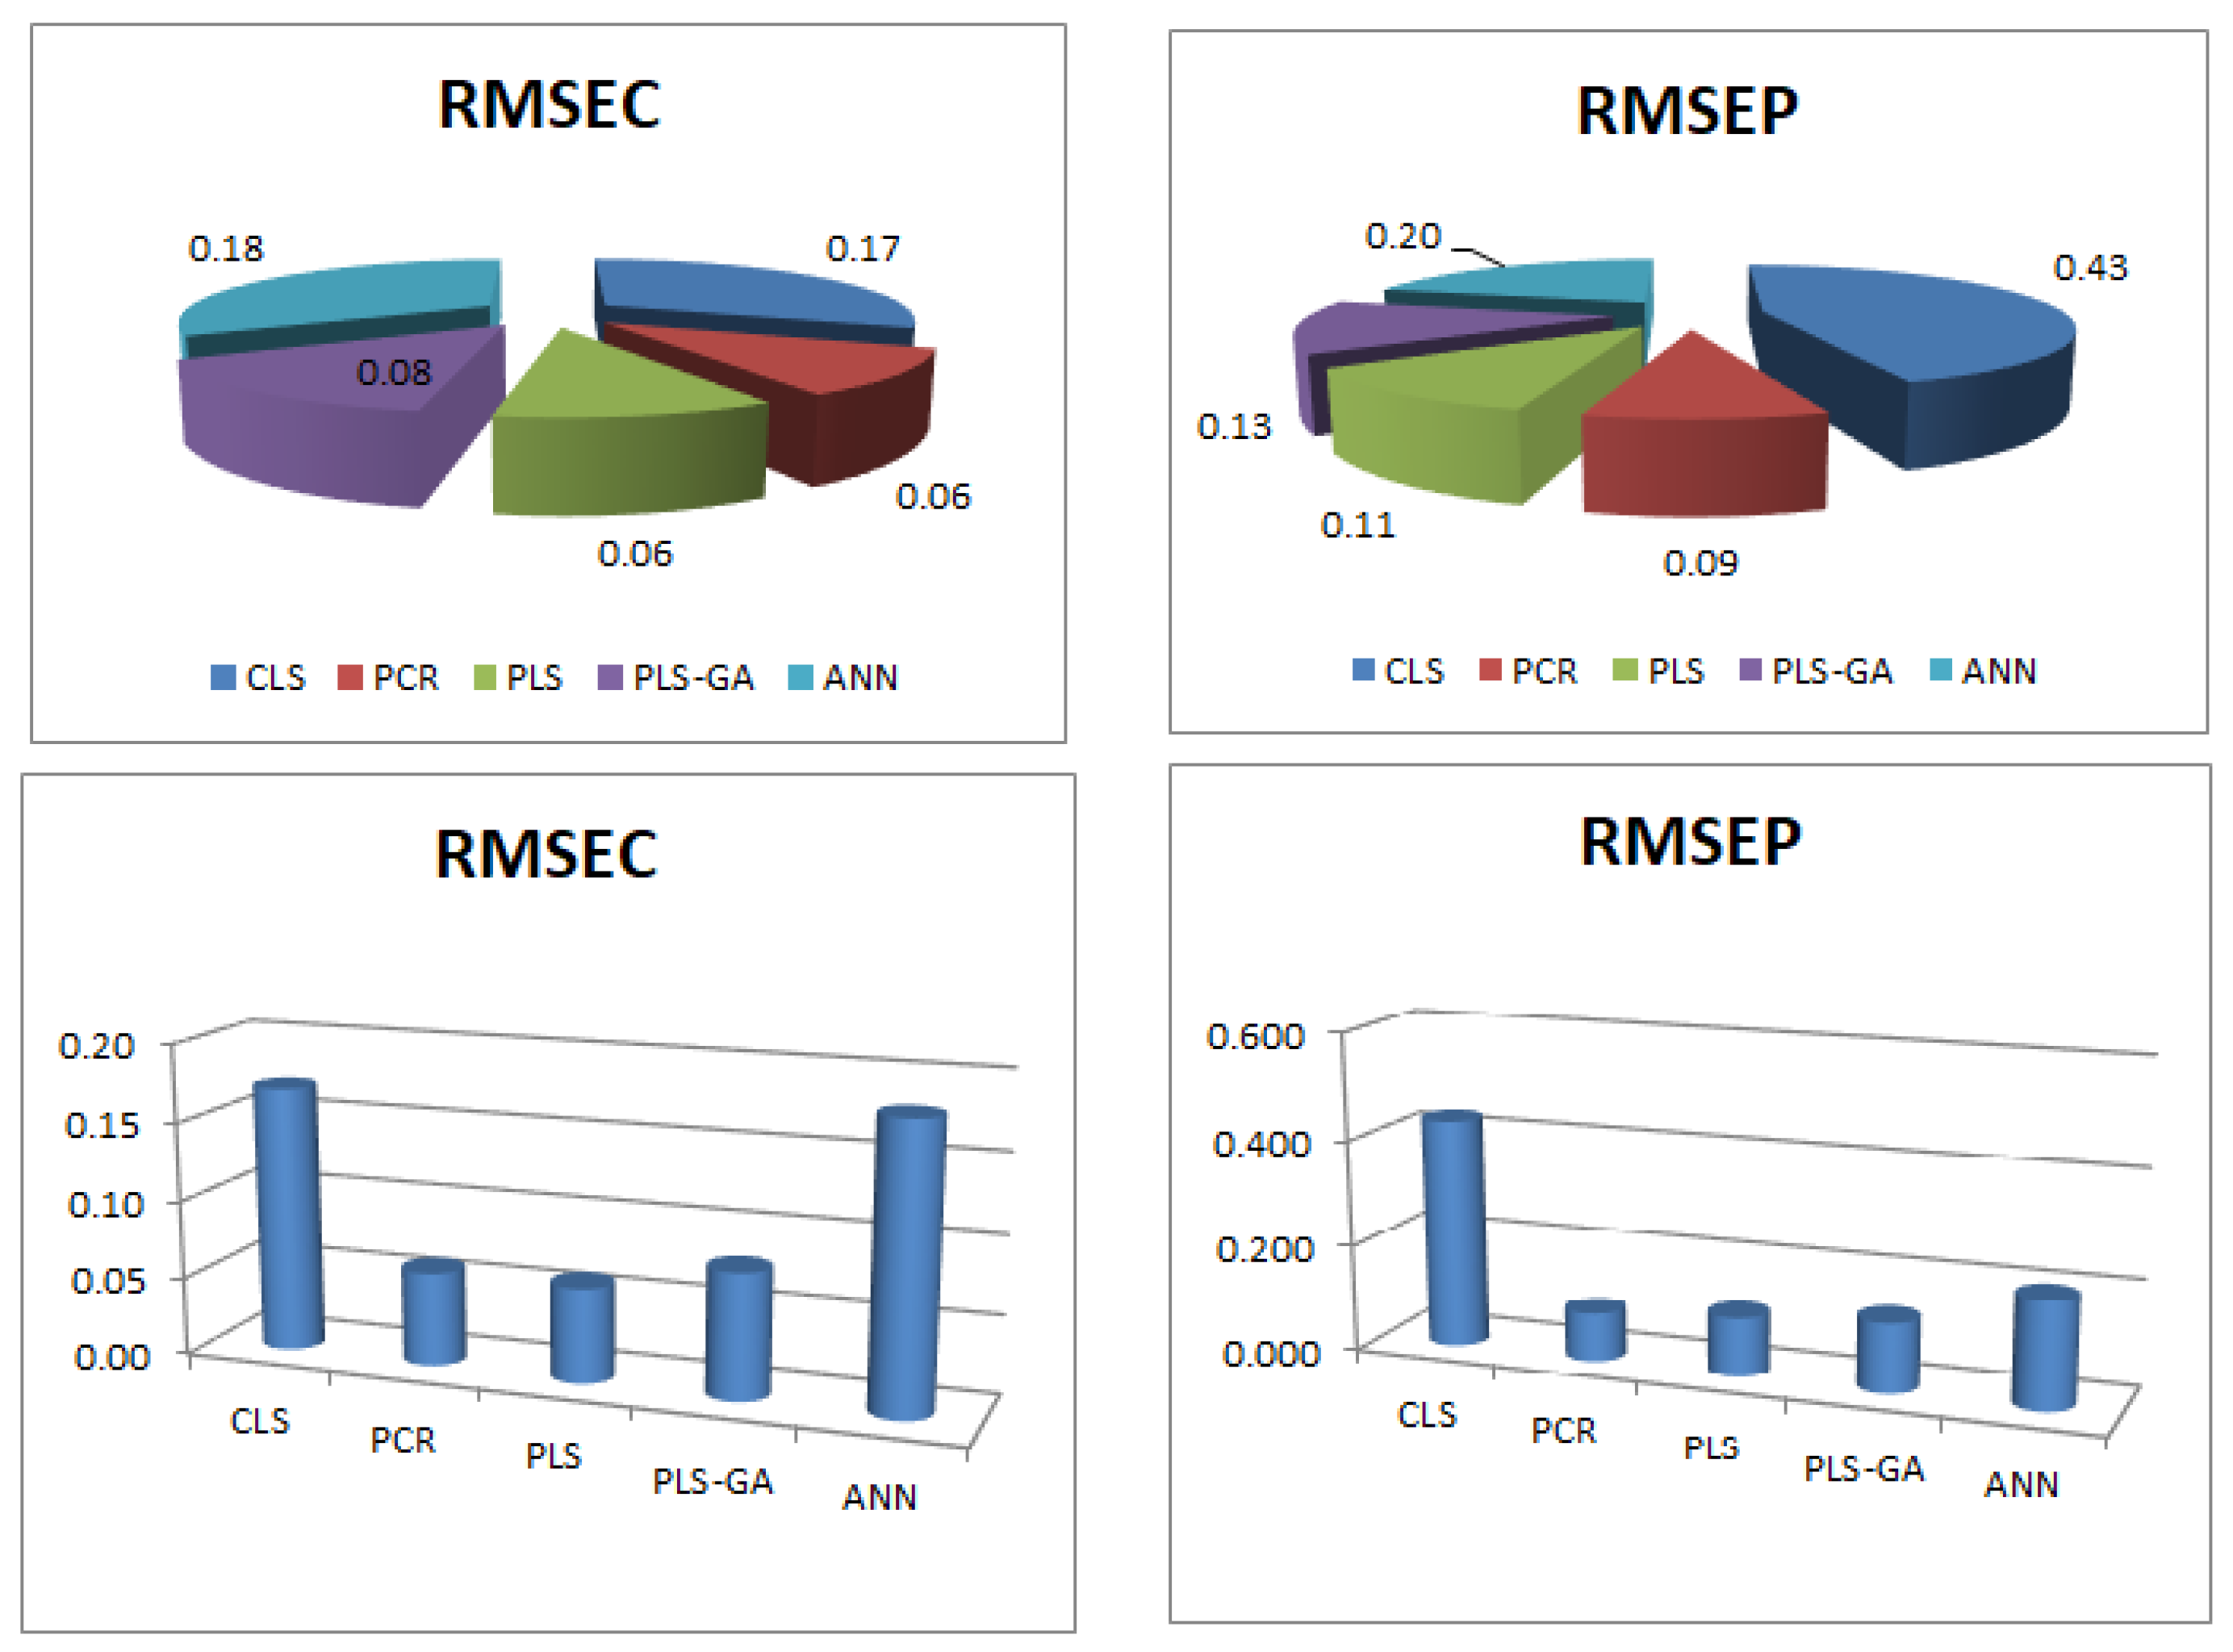
| RMSEC | 0.17 | 0.06 | 0.06 | 0.08 | 0.18 |
| RMSEP | 0.43 | 0.09 | 0.11 | 0.13 | 0.2 |
| LV number | - | 4 | 4 | 4 | - |
| Mean (%) ** | 98.64 | 99.99 | 99.69 | 99.08 | 100.82 |
| R | 0.7543 | 0.9994 | 0.9995 | 0.9990 | 0.9989 |
| Parameter | Claimed Conc. of FVR in Tab (µg mL−1) | Percentage Recovery (%) | ||||
|---|---|---|---|---|---|---|
| CLS | PCR | PLS | GA-PLS | ANN | ||
| 18 | 99.91 | 100.73 | 101.70 | 100.55 | 100.22 | |
| 19 | 98.88 | 99.93 | 100.74 | 99.64 | 100.84 | |
| 20 | 100.00 | 100.65 | 102.55 | 99.87 | 101.17 | |
| 21 | 98.19 | 101.03 | 101.74 | 100.57 | 99.98 | |
| Reported method a [19] | CLS | PCR | PLS | GA-PLS | ANN | |
| Mean ± SD | 100.80 ± 1.50 | 99.25 ± 0.87 | 100.58 ± 0.47 | 101.68 ± 0.74 | 100.16 ± 0.47 | 100.55 ± 0.55 |
| V | 2.25 | 0.75 | 0.22 | 0.55 | 0.22 | 0.30 |
| N | 3 | 4 | 4 | 4 | 4 | 4 |
| F-test (F-tabulated 28.71) b | -- | 3.00 | 10.23 | 4.09 | 10.23 | 7.50 |
| Student’s t-test (t-tabulated 2.571) b | -- | 1.747 | 0.284 | 1.039 | 0.825 | 0.315 |
| Parameters | Proposed Spectroscopic Method | Reported LC Method [30] |
|---|---|---|
| Technique | UV Spectroscopy | Ion pair HPLC-DAD |
| Linearity range | 2.0–20.0 µgmL−1 | 6.3–250.0 µgmL−1 |
| Impurity profile | Process related impurities | Degradation impurities |
| Organic solvents | Methanol as the solvent | Methanol as the solvent. Isocratic elution using 28% MeOH & 10% ACN |
| Run time | NA | 5 min |
| Flow rate | NA | 1.0 mL min−1 |
| Column | NA | C18-RP |
| GAPI assessment * | 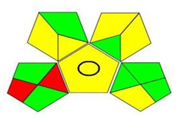 | 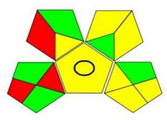 |
| AGREE assessment * |  |  |
| Sample No. | FVR (μg mL−1) | Impurity-1 (μg mL−1) | Impurity-2 (μg mL−1) |
|---|---|---|---|
| 1 * | 20 | 3 | 3 |
| 2 * | 20 | 2 | 2 |
| 3 | 19 | 2 | 4 |
| 4 * | 19 | 4 | 2.5 |
| 5 | 21 | 2.5 | 4 |
| 6 * | 19.5 | 4 | 3 |
| 7 | 21 | 3 | 2.5 |
| 8 * | 20 | 2.5 | 2.5 |
| 9 * | 19.5 | 2.5 | 3.5 |
| 10 * | 19.5 | 3.5 | 4 |
| 11 * | 20.5 | 4 | 3.5 |
| 12 * | 21 | 3.5 | 3 |
| 13 | 20.5 | 3 | 4 |
| 14 * | 20 | 4 | 4 |
| 15 | 21 | 4 | 2 |
| 16 | 21 | 2 | 3.5 |
| 17 | 19 | 3.5 | 2 |
| 18 | 20.5 | 2 | 3 |
| 19 | 19 | 3 | 3.5 |
| 20 | 20 | 3.5 | 3.5 |
| 21 * | 20.5 | 3.5 | 2.5 |
| 22 * | 20.5 | 2.5 | 2 |
| 23 | 19.5 | 2 | 2.5 |
| 24 | 19 | 2.5 | 3 |
| 25 * | 19.5 | 3 | 2 |
Publisher’s Note: MDPI stays neutral with regard to jurisdictional claims in published maps and institutional affiliations. |
© 2022 by the authors. Licensee MDPI, Basel, Switzerland. This article is an open access article distributed under the terms and conditions of the Creative Commons Attribution (CC BY) license (https://creativecommons.org/licenses/by/4.0/).
Share and Cite
Ibrahim, A.E.; Sharaf, Y.A.; El Deeb, S.; Sayed, R.A. Analytical Performance and Greenness Evaluation of Five Multi-Level Design Models Utilized for Impurity Profiling of Favipiravir, a Promising COVID-19 Antiviral Drug. Molecules 2022, 27, 3658. https://doi.org/10.3390/molecules27123658
Ibrahim AE, Sharaf YA, El Deeb S, Sayed RA. Analytical Performance and Greenness Evaluation of Five Multi-Level Design Models Utilized for Impurity Profiling of Favipiravir, a Promising COVID-19 Antiviral Drug. Molecules. 2022; 27(12):3658. https://doi.org/10.3390/molecules27123658
Chicago/Turabian StyleIbrahim, Adel Ehab, Yasmine Ahmed Sharaf, Sami El Deeb, and Rania Adel Sayed. 2022. "Analytical Performance and Greenness Evaluation of Five Multi-Level Design Models Utilized for Impurity Profiling of Favipiravir, a Promising COVID-19 Antiviral Drug" Molecules 27, no. 12: 3658. https://doi.org/10.3390/molecules27123658
APA StyleIbrahim, A. E., Sharaf, Y. A., El Deeb, S., & Sayed, R. A. (2022). Analytical Performance and Greenness Evaluation of Five Multi-Level Design Models Utilized for Impurity Profiling of Favipiravir, a Promising COVID-19 Antiviral Drug. Molecules, 27(12), 3658. https://doi.org/10.3390/molecules27123658