
Statistical FT-IR Spectroscopy for the Characterization of 17 Vegetable Oils

Abstract
:1. Introduction
2. Results
2.1. Spectral and Random Data
2.2. ATR versus Transmissive Spectra
2.3. Resolution
2.4. Averaged Spectra
2.5. Data Selection
2.6. Preprocessing Technique
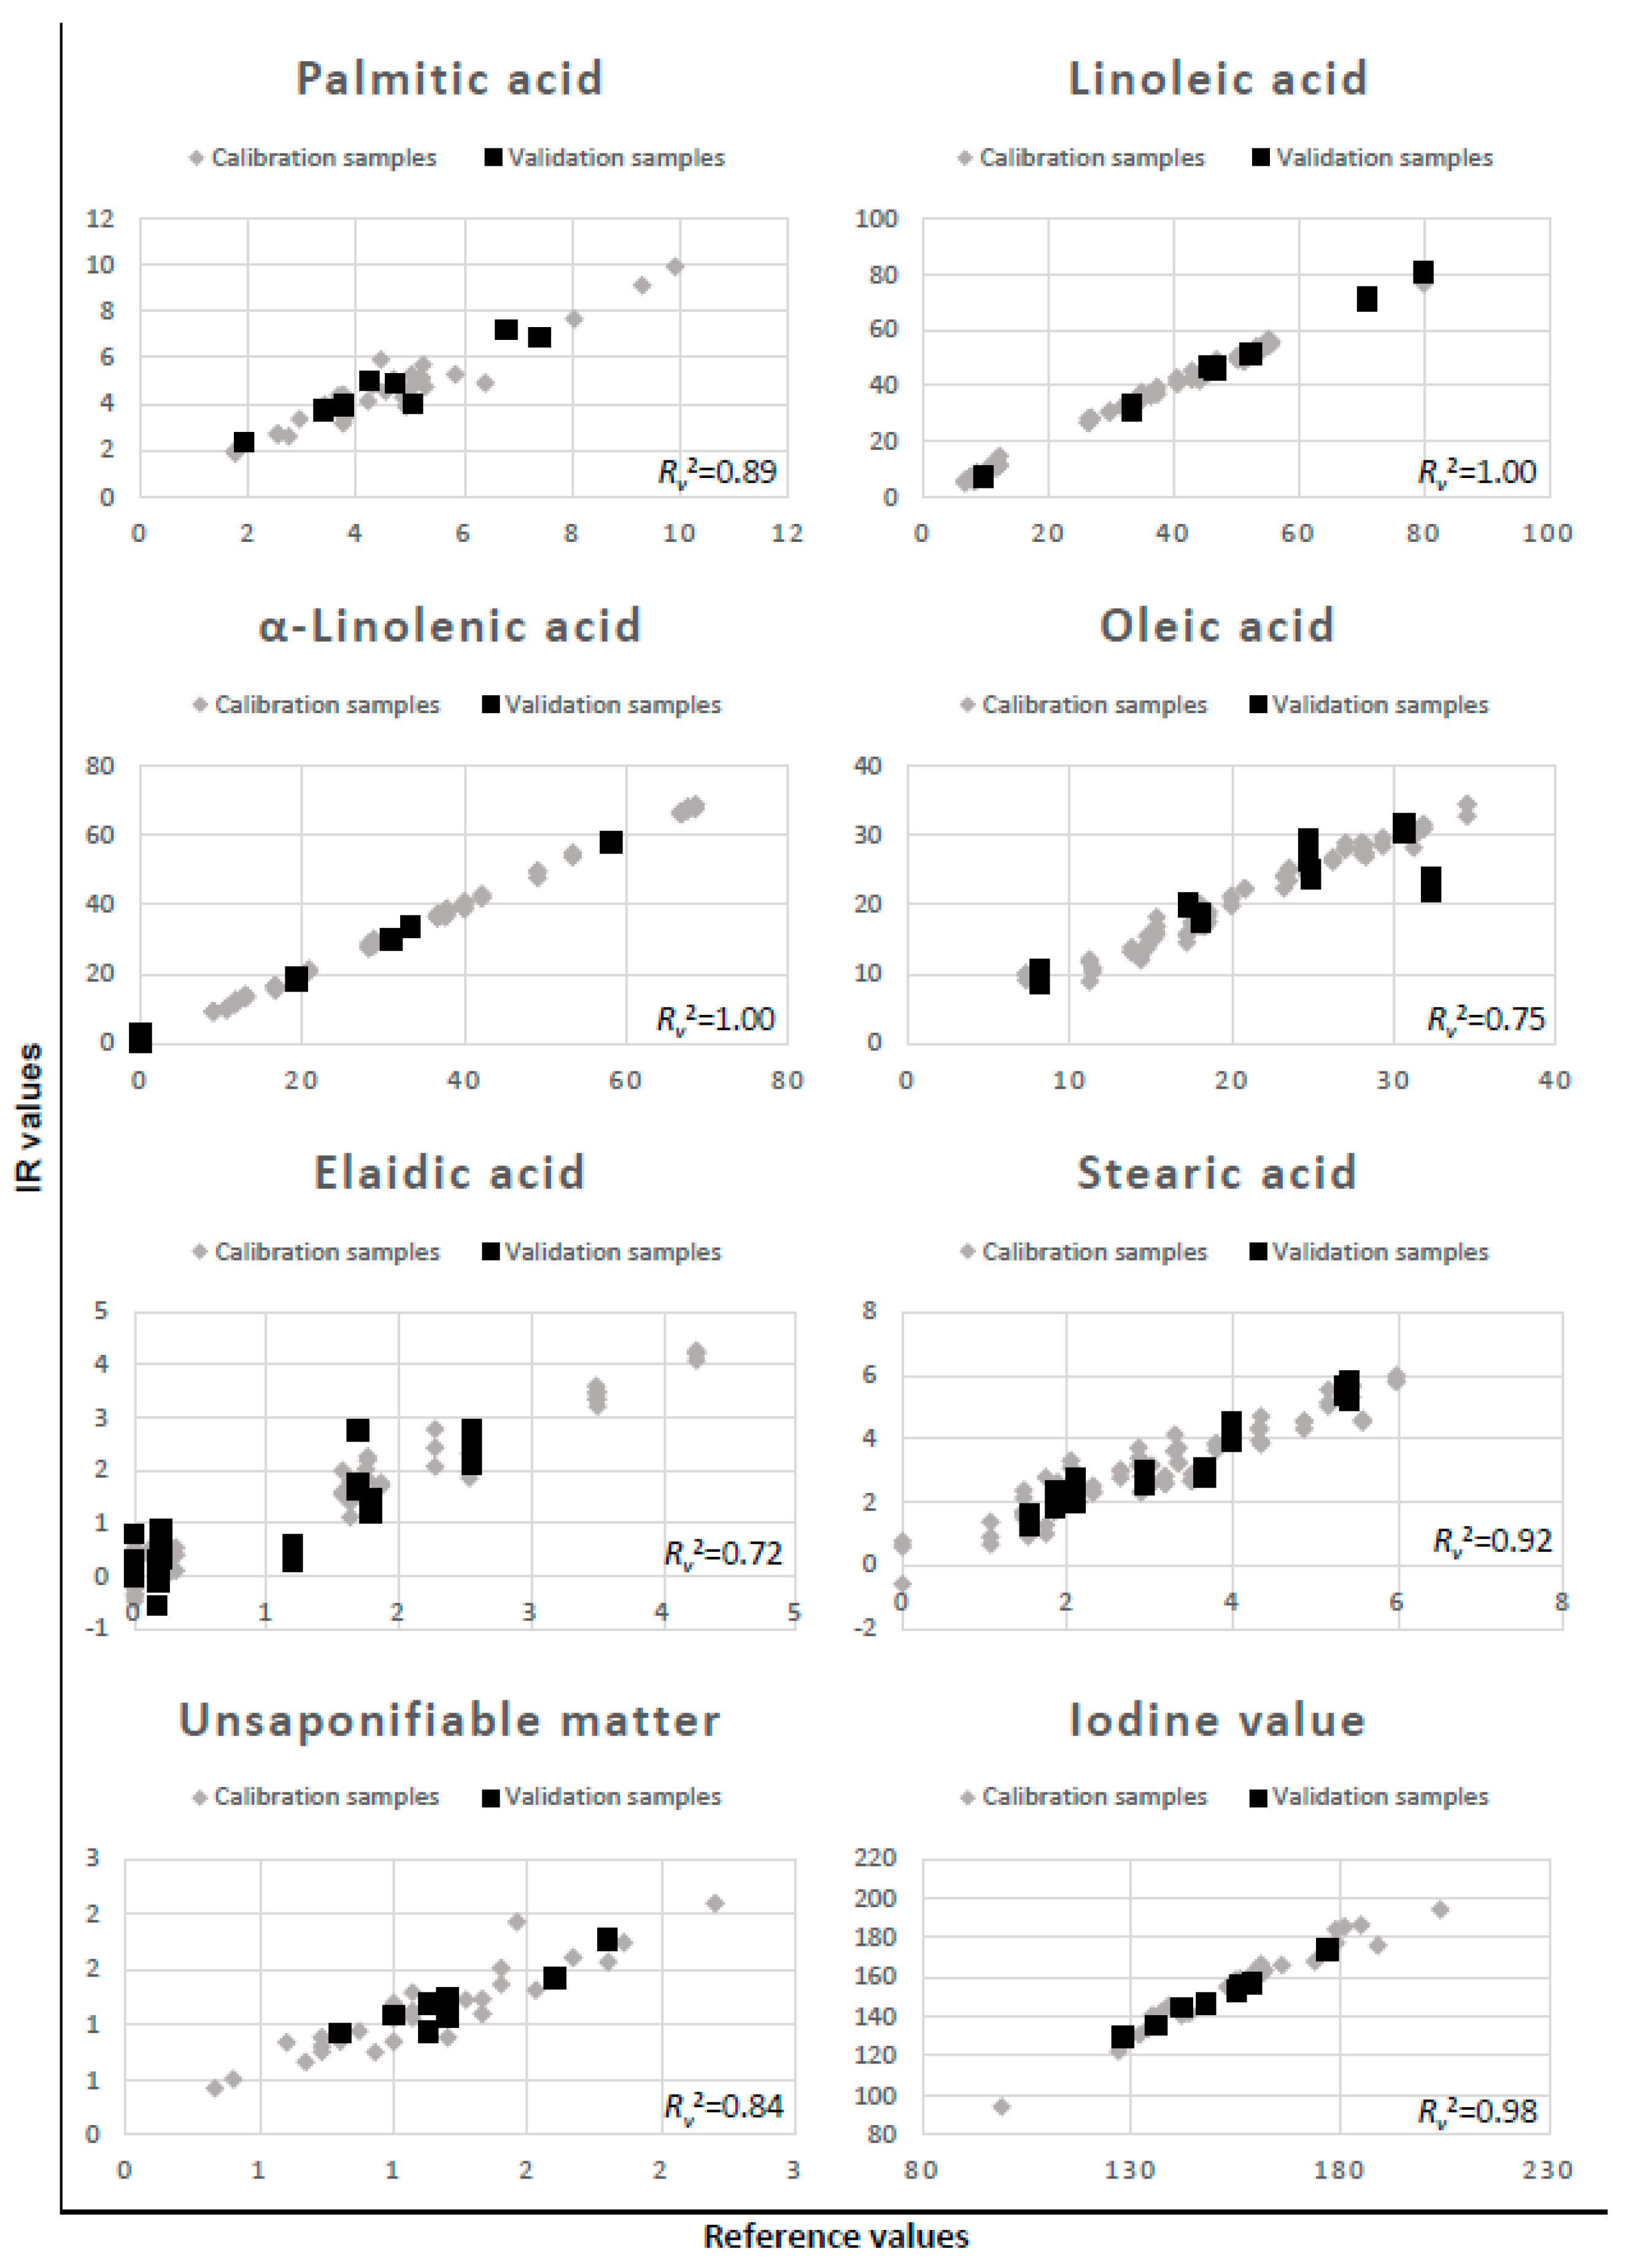
2.7. Dependent Variables
3. Discussion
4. Materials and Methods
4.1. Samples
4.2. Chemical Characterization of Vegetable Oils
4.3. GC–MS Analysis of Fatty Acid Composition
4.4. Recording of the IR Spectra
4.4.1. ATR Spectra
4.4.2. Transmissive Spectra
4.5. Data Analysis
5. Conclusions
Supplementary Materials
Author Contributions
Funding
Institutional Review Board Statement
Informed Consent Statement
Data Availability Statement
Acknowledgments
Conflicts of Interest
Sample Availability
References
- Wang, D.D.; Hu, F.B. Dietary Fat and Risk of Cardiovascular Disease: Recent Controversies and Advances. Annu. Rev. Nutr. 2017, 37, 423–446. [Google Scholar] [CrossRef] [PubMed]
- Locke, A.; Schneiderhan, J.; Zick, S.M. Diets for Health: Goals and Guidelines. Am. Fam. Physician 2018, 97, 721–728. [Google Scholar] [PubMed]
- Poljšak, N.; Kreft, S.; Kočevar Glavač, N. Vegetable Butters and Oils in Skin Wound Healing: Scientific Evidence for New Opportunities in Dermatology. Phytother. Res. 2020, 34, 254–269. [Google Scholar] [CrossRef] [PubMed]
- Vaughn, A.R.; Clark, A.K.; Sivamani, R.K.; Shi, V.Y. Natural Oils for Skin-Barrier Repair: Ancient Compounds Now Backed by Modern Science. Am. J. Clin. Dermatol. 2018, 19, 103–117. [Google Scholar] [CrossRef]
- Negash, Y.A.; Amare, D.E.; Bitew, B.D.; Dagne, H. Assessment of Quality of Edible Vegetable Oils Accessed in Gondar City, Northwest Ethiopia. BMC Res. Notes 2019, 12, 793–798. [Google Scholar] [CrossRef]
- Ganguly, R.; Pierce, G.N. The Toxicity of Dietary Trans Fats. Food Chem. Toxicol. 2015, 78, 170–176. [Google Scholar] [CrossRef]
- Perjesi, P.; Pinter, Z.; Gyongyi, Z.; Ember, I. Effect of Rancid Corn Oil on Some Onco/Suppressor Gene Expressions in Vivo. A Short-Term Study-PubMed. Anticancer Res. 2002, 22, 225–230. [Google Scholar]
- European Pharmacopoeia (Ph. Eur.), 8th ed.; EDQM-European Directorate for the Quality of Medicines: Strasbourg, France, 2013.
- Kwon, C.W.; Park, K.M.; Park, J.W.; Lee, J.; Choi, S.J.; Chang, P.S. Rapid and Sensitive Determination of Lipid Oxidation Using the Reagent Kit Based on Spectrophotometry (FOODLAB Fat System). J. Chem. 2016, 2016, 1468743. [Google Scholar] [CrossRef] [Green Version]
- Gilbraith, W.E.; Carter, J.C.; Adams, K.L.; Booksh, K.S.; Ottaway, J.M. Improving Prediction of Peroxide Value of Edible Oils Using Regularized Regression Models. Molecules 2021, 26, 7281. [Google Scholar] [CrossRef]
- Geana, E.I.; Ciucure, C.T.; Apetrei, C.; Artem, V. Application of Spectroscopic UV-Vis and FT-IR Screening Techniques Coupled with Multivariate Statistical Analysis for Red Wine Authentication: Varietal and Vintage Year Discrimination. Molecules 2019, 24, 4166. [Google Scholar] [CrossRef] [Green Version]
- Wu, Z.; Zhao, Y.; Zhang, J.; Wang, Y. Quality Assessment of Gentiana Rigescens from Different Geographical Origins Using FT-IR Spectroscopy Combined with HPLC. Molecules 2017, 22, 1238. [Google Scholar] [CrossRef] [PubMed] [Green Version]
- Ildiz, G.O.; Karadag, A.; Kaygisiz, E.; Fausto, R. PLS-DA Model for the Evaluation of Attention Deficit and Hyperactivity Disorder in Children and Adolescents through Blood Serum FTIR Spectra. Molecules 2021, 26, 3400. [Google Scholar] [CrossRef] [PubMed]
- Luypaert, J.; Zhang, M.H.; Massart, D.L. Feasibility Study for the Use of near Infrared Spectroscopy in the Qualitative and Quantitative Analysis of Green Tea, Camellia Sinensis (L.). Anal. Chim. Acta 2003, 478, 303–312. [Google Scholar] [CrossRef]
- Kokalj, M.; Rihtarič, M.; Kreft, S. Commonly Applied Smoothing of IR Spectra Showed Unappropriate for the Identification of Plant Leaf Samples. Chemom. Intell. Lab. Syst. 2011, 108, 154–161. [Google Scholar] [CrossRef]
- Junaedi, E.; Lestari, K.; Muchtaridi, M. Infrared Spectroscopy Technique for Quantification of Compounds in Plant-Based Medicine and Supplement. J. Adv. Pharm. Technol. Res. 2021, 12, 1–7. [Google Scholar]
- Geladi, P.; Martens, H.; Hadjiiski, L.; Hopke, P. A Calibration Tutorial for Spectral Data. Part 2. Partial Least Squares Regression Using Matlab and Some Neural Network Results. J. Near Infrared Spectrosc. 1996, 4, 243–255. [Google Scholar] [CrossRef]
- Kokalj, M.; Strgulc Krajšek, S.; Omahen Bratuša, J.; Kreft, S. Comparison and Improvement of Commonly Applied Statistical Approaches for Identification of Plant Species from IR Spectra. J. Chemom. 2010, 24, 611–616. [Google Scholar] [CrossRef]
- Guille, D.; Cabo, N. Infrared Spectroscopy in the Study of Edible Oils and Fats. J. Sci. Food Agric. 1997, 75, 1–11. [Google Scholar] [CrossRef]
- Vlachos, N.; Skopelitis, Y.; Psaroudaki, M.; Konstantinidou, V.; Chatzilazarou, A.; Tegou, E. Applications of Fourier Transform-Infrared Spectroscopy to Edible Oils. Anal. Chim. Acta 2006, 573–574, 459–465. [Google Scholar] [CrossRef]
- Zhang, Q.; Liu, C.; Sun, Z.; Hu, X.; Shen, Q.; Wu, J. Authentication of Edible Vegetable Oils Adulterated with Used Frying Oil by Fourier Transform Infrared Spectroscopy. Food Chem. 2012, 132, 1607–1613. [Google Scholar] [CrossRef]
- Liang, P.; Chen, C.; Zhao, S.; Ge, F.; Liu, D.; Liu, B.; Fan, Q.; Han, B.; Xiong, X. Application of Fourier Transform Infrared Spectroscopy for the Oxidation and Peroxide Value Evaluation in Virgin Walnut Oil. J. Spectrosc. 2013, 2013, 138728. [Google Scholar] [CrossRef]
- Bendini, A.; Cerretani, L.; DI Virgilio, F.; Belloni, P.; Bonoli-Carbognin, M.; Lercker, G. Preliminary evaluation of the application of the ftir spectroscopy to control the geographic origin and quality of virgin olive oils. J. Food Qual. 2007, 30, 424–437. [Google Scholar] [CrossRef]
- van de Voort, F.R.; Ismail, A.A.; Sedman, J.; Dubois, J.; Nicodemo, T. The Determination of Peroxide Value by Fourier Transform Infrared Spectroscopy. J. Am. Oil Chem. Soc. 1994, 71, 921–926. [Google Scholar] [CrossRef]
- Sanchez, J.L.; Pereira, S.B.G.; de Lima, P.C.; Possebon, G.; Tanamati, A.; Poppi, R.J.; Tanamati, A.A.C.; Bona, E. Mid-Infrared Spectroscopy and Support Vector Machines Applied to Control the Hydrogenation Process of Soybean Oil. Eur. Food Res. Technol. 2017, 243, 1447–1457. [Google Scholar] [CrossRef]
- Tinggi Farmasi Borneo Lestari, S.; Kalimantan, S. Determination of Peroxide Value of Red Fruit Oil by FTIR Spectroscopy and Multivariate Calibration. Int. Food Res. J. 2017, 24, 2312–2316. [Google Scholar]
- Mahboubifar, M.; Yousefinejad, S.; Alizadeh, M.; Hemmateenejad, B. Prediction of the Acid Value, Peroxide Value and the Percentage of Some Fatty Acids in Edible Oils during Long Heating Time by Chemometrics Analysis of FTIR-ATR Spectra. J. Iran. Chem. Soc. 2016, 13, 2291–2299. [Google Scholar] [CrossRef]
- Wójcicki, K.; Khmelinskii, I.; Sikorski, M.; Sikorska, E. Near and Mid Infrared Spectroscopy and Multivariate Data Analysis in Studies of Oxidation of Edible Oils. Food Chem. 2015, 187, 416–423. [Google Scholar] [CrossRef]
- Chen, J.Y.; Zhang, H.; Ma, J.; Tuchiya, T.; Miao, Y. Determination of the Degree of Degradation of Frying Rapeseed Oil Using Fourier-Transform Infrared Spectroscopy Combined with Partial Least-Squares Regression. Int. J. Anal. Chem. 2015, 2015, 185367. [Google Scholar] [CrossRef] [Green Version]
- Zhang, H.; Ma, J.; Miao, Y.; Tuchiya, T.; Chen, J.Y. Analysis of Carbonyl Value of Frying Oil by Fourier Transform Infrared Spectroscopy. J. Oleo Sci. 2015, 64, 375–380. [Google Scholar] [CrossRef] [Green Version]
- Pizarro, C.; Esteban-Díez, I.; Rodríguez-Tecedor, S.; González-Sáiz, J.M. Determination of the Peroxide Value in Extra Virgin Olive Oils through the Application of the Stepwise Orthogonalisation of Predictors to Mid-Infrared Spectra. Food Control 2013, 34, 158–167. [Google Scholar] [CrossRef]
- Luna, A.S.; Da Silva, A.P.; Ferré, J.; Boqué, R. Classification of Edible Oils and Modeling of Their Physico-Chemical Properties by Chemometric Methods Using Mid-IR Spectroscopy. Spectrochim. Acta Part A Mol. Biomol. Spectrosc. 2013, 100, 109–114. [Google Scholar] [CrossRef] [PubMed]
- van de Voort, F.R.; Ismail, A.A.; Sedman, J.; Emo, G. Monitoring the Oxidation of Edible Oils by Fourier Transform Infrared Spectroscopy. J. Am. Oil Chem. Soc. 1994, 71, 243–253. [Google Scholar] [CrossRef]
- Dymińska, L.; Calik, M.; Albegar, A.M.M.; Zając, A.; Kostyń, K.; Lorenc, J.; Hanuza, J. Quantitative Determination of the Iodine Values of Unsaturated Plant Oils Using Infrared and Raman Spectroscopy Methods. Int. J. Food Prop. 2017, 20, 2003–2015. [Google Scholar] [CrossRef] [Green Version]

| Spectral Preprocessing Method | R2 Type | Percent of Models with Good R2 Values | ||||||
|---|---|---|---|---|---|---|---|---|
| ≥0.99 | ≥0.95 | ≥0.90 | ≥0.80 | ≥0.70 | ≥0.60 | ≥0.50 | ||
| Raw spectral data | Rc2 Rv2 | 26% | 56% | 67% | 73% | 75% | 78% | 79% |
| 2% | 7% | 15% | 23% | 28% | 32% | 40% | ||
| First derivative of spectral data | Rc2 Rv2 | 37% | 59% | 68% | 74% | 77% | 80% | 84% |
| 1% | 5% | 12% | 20% | 23% | 27% | 30% | ||
| Second derivative of spectral data | Rc2 Rv2 | 39% | 58% | 66% | 71% | 78% | 81% | 85% |
| 0% | 4% | 9% | 16% | 18% | 20% | 23% | ||
| Normalized spectral data | Rc2 Rv2 | 38% | 57% | 68% | 74% | 76% | 79% | 83% |
| 4% | 15% | 18% | 25% | 29% | 34% | 39% | ||
| First derivative of normalized spectral data | Rc2 Rv2 | 47% | 59% | 67% | 76% | 79% | 83% | 86% |
| 6% | 13% | 17% | 22% | 26% | 29% | 33% | ||
| Second derivative of normalized spectral data | Rc2 Rv2 | 42% | 58% | 67% | 73% | 80% | 84% | 88% |
| 3% | 8% | 12% | 17% | 19% | 22% | 25% | ||
| SNV of spectral data | Rc2 Rv2 | 40% | 60% | 71% | 75% | 78% | 81% | 84% |
| 6% | 16% | 19% | 24% | 30% | 35% | 39% | ||
| First derivative of SNV spectral data | Rc2 Rv2 | 50% | 63% | 70% | 78% | 81% | 84% | 88% |
| 6% | 13% | 16% | 21% | 27% | 30% | 33% | ||
| Second derivative of SNV spectral data | Rc2 Rv2 | 45% | 59% | 68% | 73% | 80% | 84% | 87% |
| 3% | 9% | 12% | 17% | 19% | 22% | 25% | ||
| Wavelet approximate coefficients of spectral data | Rc2 Rv2 | 24% | 54% | 66% | 71% | 74% | 77% | 78% |
| 2% | 8% | 15% | 22% | 27% | 31% | 41% | ||
| First derivative of wavelet approximate spectral data | Rc2 Rv2 | 33% | 60% | 68% | 73% | 76% | 80% | 85% |
| 1% | 6% | 13% | 20% | 25% | 30% | 32% | ||
| Second derivative of wavelet approximate spectral data | Rc2 Rv2 | 30% | 53% | 61% | 68% | 74% | 78% | 83% |
| 0% | 4% | 13% | 19% | 21% | 25% | 27% | ||
| Wavelet detail coefficients of spectral data | Rc2 Rv2 | 33% | 55% | 67% | 74% | 77% | 80% | 85% |
| 0% | 6% | 11% | 20% | 23% | 28% | 30% | ||
| First derivative of wavelet detail spectral data | Rc2 Rv2 | 29% | 48% | 60% | 67% | 72% | 77% | 81% |
| 0% | 4% | 13% | 17% | 20% | 23% | 25% | ||
| Second derivative of wavelet detail spectral data | Rc2 Rv2 | 29% | 44% | 54% | 63% | 69% | 75% | 81% |
| 0% | 3% | 7% | 15% | 18% | 21% | 24% | ||
| Random data | Rc2 Rv2 | 46% | 59% | 73% | 87% | 89% | 90% | 92% |
| 0% | 0% | 0% | 0% | 0% | 0% | 0% | ||
| Dependent Variable | ATR | TRANS | R2 | R4 | R8 | ALL | AVG | STD | CORR | CHEM | |
|---|---|---|---|---|---|---|---|---|---|---|---|
| Palmitic acid | R2 ≥ 0.9 | 0% | 0% | 0% | 0% | 0% | 0% | 0% | 0% | 0% | 0% |
| R2 ≥ 0.5 | 16% | 34% | 9% | 17% | 23% | 33% | 16% | 14% | 18% | 17% | |
| Linoleic acid | R2 ≥ 0.9 | 16% | 37% | 13% | 18% | 22% | 28% | 25% | 15% | 18% | 20% |
| R2 ≥ 0.5 | 34% | 50% | 21% | 29% | 33% | 42% | 41% | 27% | 27% | 30% | |
| α-Linolenic acid | R2 ≥ 0.9 | 30% | 48% | 19% | 25% | 33% | 40% | 38% | 25% | 25% | 27% |
| R2 ≥ 0.5 | 39% | 50% | 24% | 31% | 33% | 45% | 44% | 29% | 29% | 31% | |
| Oleic acid | R2 ≥ 0.9 | 0% | 0% | 0% | 0% | 0% | 0% | 0% | 0% | 0% | 0% |
| R2 ≥ 0.5 | 4% | 28% | 5% | 13% | 14% | 23% | 8% | 11% | 9% | 13% | |
| Elaidic acid | R2 ≥ 0.9 | 0% | 0% | 0% | 0% | 0% | 0% | 0% | 0% | 0% | 0% |
| R2 ≥ 0.5 | 3% | 2% | 1% | 3% | 1% | 2% | 2% | 2% | 2% | 1% | |
| Stearic acid | R2 ≥ 0.9 | 0% | 2% | 0% | 1% | 1% | 2% | 0% | 1% | 0% | 1% |
| R2 ≥ 0.5 | 14% | 25% | 9% | 12% | 18% | 31% | 8% | 12% | 13% | 15% | |
| Unsaponifiable matter | R2 ≥ 0.9 | 0% | 0% | 0% | 0% | 0% | 0% | 0% | 0% | 0% | 0% |
| R2 ≥ 0.5 | 2% | 2% | 1% | 2% | 1% | 2% | 2% | 1% | 1% | 2% | |
| Acid value | R2 ≥ 0.9 | 0% | 0% | 0% | 0% | 0% | 0% | 0% | 0% | 0% | 0% |
| R2 ≥ 0.5 | 0% | 0% | 0% | 0% | 0% | 0% | 0% | 0% | 0% | 0% | |
| Saponification value | R2 ≥ 0.9 | 0% | 0% | 0% | 0% | 0% | 0% | 0% | 0% | 0% | 0% |
| R2 ≥ 0.5 | 0% | 0% | 0% | 0% | 0% | 0% | 0% | 0% | 0% | 0% | |
| Ester value | R2 ≥ 0.9 | 0% | 0% | 0% | 0% | 0% | 0% | 0% | 0% | 0% | 0% |
| R2 ≥ 0.5 | 0% | 0% | 0% | 0% | 0% | 0% | 0% | 0% | 0% | 0% | |
| Hydroxyl value | R2 ≥ 0.9 | 0% | 0% | 0% | 0% | 0% | 0% | 0% | 0% | 0% | 0% |
| R2 ≥ 0.5 | 0% | 0% | 0% | 0% | 0% | 0% | 0% | 0% | 0% | 0% | |
| Iodine value | R2 ≥ 0.9 | 13% | 30% | 16% | 10% | 17% | 16% | 26% | 14% | 14% | 14% |
| R2 ≥ 0.5 | 41% | 50% | 26% | 31% | 33% | 45% | 45% | 29% | 30% | 31% | |
| Peroxide value | R2 ≥ 0.9 | 0% | 0% | 0% | 0% | 0% | 0% | 0% | 0% | 0% | 0% |
| R2 ≥ 0.5 | 0% | 0% | 0% | 0% | 0% | 0% | 0% | 0% | 0% | 0% | |
| ATR or Trans | Resolution | All or Averaged sp. | Variable Selection | Preprocessing | PLS Factors | RMSECV | RMSEC | RMSEP | Calibration Range | Rc2 | Rv2 | |
|---|---|---|---|---|---|---|---|---|---|---|---|---|
| Palmitic acid | Trans | R2 | Avg | STD | NOR | 9 | 1.54 | 0.56 | 0.55 | 1.74–9.90 | 0.91 | 0.89 |
| Trans | R8 | All | CORR | WD | 12 | 0.66 | 0.42 | 0.56 | 0.95 | 0.89 | ||
| Trans | R2 | Avg | STD | WA | 11 | 1.60 | 0.44 | 0.59 | 0.95 | 0.87 | ||
| Linoleic acid | Trans | R8 | All | STD | NOR 1st D | 16 | 2.99 | 1.30 | 1.23 | 6.63–80.00 | 0.99 | 1.00 |
| Trans | R8 | All | CHEM | NOR 1st D | 17 | 3.00 | 1.07 | 1.40 | 1.00 | 1.00 | ||
| Trans | R8 | All | STD | SNV 1st D | 16 | 2.53 | 1.13 | 1.47 | 1.00 | 0.99 | ||
| α-Linolenic acid | Trans | R2 | All | CORR | SNV | 18 | 1.69 | 0.62 | 0.98 | 0.00–68.50 | 1.00 | 1.00 |
| ATR | R8 | Avg | CHEM | SNV | 7 | 2.74 | 0.90 | 1.19 | 1.00 | 1.00 | ||
| Trans | R2 | All | CHEM | SNV | 18 | 1.70 | 0.53 | 1.25 | 1.00 | 1.00 | ||
| Oleic acid | Trans | R8 | All | STD | NOR 1st D | 14 | 1.97 | 1.19 | 3.75 | 7.28–34.50 | 0.97 | 0.75 |
| Trans | R4 | All | CHEM | SNV 1st D | 18 | 2.12 | 0.14 | 3.76 | 1.00 | 0.75 | ||
| Trans | R8 | All | CHEM | NOR 1st D | 14 | 1.97 | 1.17 | 3.83 | 0.97 | 0.74 | ||
| Elaidic acid | Trans | R4 | All | STD | 1st D | 13 | 0.73 | 0.24 | 0.48 | 0.00–4.25 | 0.96 | 0.72 |
| Trans | R4 | All | STD | WD | 13 | 0.72 | 0.27 | 0.48 | 0.95 | 0.72 | ||
| ATR | R4 | Avg | CHEM | NOR | 3 | 1.16 | 0.85 | 0.50 | 0.54 | 0.69 | ||
| Stearic acid | Trans | R4 | All | CHEM | NOR 1st D | 10 | 0.99 | 0.49 | 0.39 | 0.00–5.98 | 0.89 | 0.92 |
| Trans | R8 | All | STD | WA | 20 | 0.67 | 0.34 | 0.40 | 0.94 | 0.92 | ||
| Trans | R4 | All | STD | NOR | 17 | 0.72 | 0.37 | 0.41 | 0.94 | 0.92 | ||
| Unsaponifiable matter | ATR | R2 | Avg | CHEM | RAW | 5 | 0.41 | 0.17 | 0.12 | 0.33–2.20 | 0.85 | 0.84 |
| ATR | R2 | Avg | CHEM | WA | 18 | 0.40 | 0.00 | 0.16 | 1.00 | 0.73 | ||
| Trans | R8 | Avg | CORR | NOR 2nd D | 20 | 0.44 | 0.00 | 0.18 | 1.00 | 0.65 | ||
| Acid value | Trans | R2 | Avg | CHEM | 2nd D | 9 | 1.48 | 0.05 | 0.55 | 0.112–11.2 | 1.00 | −0.98 |
| Trans | R2 | Avg | CORR | NOR 2nd D | 7 | 1.20 | 0.18 | 0.56 | 0.99 | −1.07 | ||
| Trans | R4 | Avg | CORR | WD 2nd D | 5 | 1.30 | 0.67 | 0.57 | 0.91 | −1.09 | ||
| Saponification value | ATR | R4 | Avg | CORR | WA | 1 | 3.63 | 2.65 | 0.72 | 178–196 | 0.23 | 0.26 |
| ATR | R2 | Avg | CORR | WA | 1 | 3.63 | 2.63 | 0.72 | 0.24 | 0.25 | ||
| ATR | R4 | Avg | CORR | RAW | 1 | 3.62 | 2.65 | 0.72 | 0.23 | 0.25 | ||
| Ester value | ATR | R8 | Avg | CHEM | NOR 2nd D | 10 | 3.47 | 0.02 | 0.86 | 176–194 | 1.00 | 0.22 |
| Trans | R4 | Avg | STD | RAW | 1 | 3.74 | 3.47 | 0.95 | 0.11 | 0.04 | ||
| Trans | R4 | Avg | STD | WA | 1 | 3.74 | 3.47 | 0.95 | 0.11 | 0.04 | ||
| Hydroxyl value | Trans | R4 | Avg | CHEM | NOR | 1 | 3.16 | 2.72 | 1.31 | 2.70–19.4 | 0.19 | 0.26 |
| Trans | R4 | Avg | CORR | WD | 1 | 3.07 | 2.52 | 1.32 | 0.30 | 0.25 | ||
| Trans | R4 | Avg | CORR | 1st D | 1 | 3.05 | 2.54 | 1.33 | 0.29 | 0.23 | ||
| Iodine value | ATR | R8 | Avg | STD | NOR 2nd D | 2 | 7.73 | 4.47 | 1.94 | 99–204 | 0.96 | 0.98 |
| ATR | R8 | Avg | CORR | NOR | 1 | 6.06 | 5.66 | 2.18 | 0.93 | 0.98 | ||
| ATR | R8 | Avg | CORR | NOR 1st D | 2 | 6.91 | 5.26 | 2.36 | 0.94 | 0.97 | ||
| Peroxide value | ATR | R8 | Avg | CORR | NOR | 1 | 21.36 | 18.38 | 18.87 | 9.29–123 | 0.39 | 0.49 |
| Trans | R8 | All | CHEM | 1st D | 20 | 11.32 | 2.01 | 18.92 | 0.99 | 0.49 | ||
| Trans | R8 | All | CHEM | WA 2nd D | 18 | 11.14 | 3.54 | 19.03 | 0.98 | 0.49 |
| Titration (Acid, Hydroxyl, Iodine, Peroxide, Saponification Value) | Gas Chromatography (Fatty Acid Content) | FT-IR | |
|---|---|---|---|
| Method development | developed | developed | has to be developed and validated |
| Time consumption | long | long | fast |
| Amount of sample | grams | miligrams | miligrams |
| Repeatability | poor | good | good |
| Chemicals | toxic organic | toxic organic | none |
| Ease of analysis | good laboratory skills | good laboratory skills | easy |
| Laboratory equipment | basic | expensive | expensive |
| Plant of the Oil Source | Latin Name of the Plant | Supplier | Calibration or Validation Dataset |
|---|---|---|---|
| Cranberry seed oil | Vaccinum macrocarpon | Behawe Naturprodukte, Germany | Calibration |
| Cranberry seed oil | Vaccinum macrocarpon | Alexmo Cosmetics, Germany | Calibration |
| Cranberry seed oil | Vaccinum macrocarpon | Dragonspice Naturwaren, Germany | Validation |
| Elderberry seed oil | Sambucus nigra | Baccararose, Germany | Calibration |
| Elderberry seed oil | Sambucus nigra | Behawe Naturprodukte, Germany | Calibration |
| Borage seed oil | Borago officinalis | Dragonspice Naturwaren, Germany | Validation |
| Borage seed oil | Borago officinalis | Tovarna Organika, Slovenia | Validation |
| Borage seed oil | Borago officinalis | Caelo, Germany | Calibration |
| Borage seed oil | Borago officinalis | Farmalabor, Italy | Calibration |
| Blackcurrant seed oil | Ribes nigrum | Dragonspice Naturwaren, Germany | Calibration |
| Blackcurrant seed oil | Ribes nigrum | Behawe Naturprodukte, Germany | Calibration |
| Hemp seed oil | Cannabis sativa | Dragonspice Naturwaren, Germany | Calibration |
| Hemp seed oil | Cannabis sativa | Tovarna Organika, Slovenia | Calibration |
| Hemp seed oil | Cannabis sativa | Manske, Germany | Validation |
| Raspberry seed oil | Rubus idaeus | Tovarna Organika, Slovenia | Validation |
| Raspberry seed oil | Rubus idaeus | Dragonspice Naturwaren, Germany | Calibration |
| Raspberry seed oil | Rubus idaeus | Behawe Naturprodukte, Germany | Calibration |
| Black mustard seed oil | Brassica nigra | Behawe Naturprodukte, Germany | Calibration |
| Walnut seed oil | Juglans regia | Baccararose, Germany | Calibration |
| Walnut seed oil | Juglans regia | Caelo, Germany | Calibration |
| Sea buckthorn seed oil | Hippophae rhamnoides | Dragonspice Naturwaren, Germany | Calibration |
| Sea buckthorn seed oil | Hippophae rhamnoides | Behawe Naturprodukte, Germany | Calibration |
| Evening primrose seed oil | Oenothera biennis | Dragonspice Naturwaren, Germany | Validation |
| Evening primrose seed oil | Oenothera biennis | Farmalabor, Italy | Calibration |
| Evening primrose seed oil | Oenothera biennis | Alexmo Cosmetics, Germany | Calibration |
| Evening primrose seed oil | Oenothera biennis | Caelo, Germany | Validation |
| Rosehip seed oil | Rosa canina | Manske, Germany | Calibration |
| Rosehip seed oil | Rosa canina | Alexmo Cosmetics, Germany | Calibration |
| Chia seed oil | Salvia hispanica | Baccararose, Germany | Calibration |
| Chia seed oil | Salvia hispanica | Dragonspice Naturwaren, Germany | Calibration |
| Perilla seed oil | Perilla frutescens | Baccararose, Germany | Calibration |
| Black cumin seed oil | Nigella sativa | Caelo, Germany | Calibration |
| Sacha inchi seed oil | Plukenetia volubilis | Magnolija, Slovenia | Calibration |
| Kiwi seed oil | Actinidia chinensis | Dragonspice Naturwaren, Germany | Calibration |
| Lineseed oil | Linum usitatissimum | Baccararose, Germany | Validation |
| Lineseed oil | Linum usitatissimum | Farmalabor, Italy | Calibration |
| Lineseed oil | Linum usitatissimum | Caelo, Germany | Calibration |
Publisher’s Note: MDPI stays neutral with regard to jurisdictional claims in published maps and institutional affiliations. |
© 2022 by the authors. Licensee MDPI, Basel, Switzerland. This article is an open access article distributed under the terms and conditions of the Creative Commons Attribution (CC BY) license (https://creativecommons.org/licenses/by/4.0/).
Share and Cite
Kokalj Ladan, M.; Kočevar Glavač, N. Statistical FT-IR Spectroscopy for the Characterization of 17 Vegetable Oils. Molecules 2022, 27, 3190. https://doi.org/10.3390/molecules27103190
Kokalj Ladan M, Kočevar Glavač N. Statistical FT-IR Spectroscopy for the Characterization of 17 Vegetable Oils. Molecules. 2022; 27(10):3190. https://doi.org/10.3390/molecules27103190
Chicago/Turabian StyleKokalj Ladan, Meta, and Nina Kočevar Glavač. 2022. "Statistical FT-IR Spectroscopy for the Characterization of 17 Vegetable Oils" Molecules 27, no. 10: 3190. https://doi.org/10.3390/molecules27103190
APA StyleKokalj Ladan, M., & Kočevar Glavač, N. (2022). Statistical FT-IR Spectroscopy for the Characterization of 17 Vegetable Oils. Molecules, 27(10), 3190. https://doi.org/10.3390/molecules27103190