Abstract
In this work, the extraction procedure of a natural pigment from the flower of Ceiba speciosa (A. St.-Hil.) was optimized by response surface methodology. It is the first time that the extraction of the flower pigment of C. speciosa (FPCS) has been reported, along with an evaluation of its stability and biological activity under various conditions, and an exploration of its potential use as a food additive and in medicine. Specifically, the effects of ethanol concentration, solid–liquid ratio, temperature and time on the extraction rate of FPCS were determined using a Box–Behnken design. The optimum extraction conditions for FPCS were 75% ethanol with a solid–liquid ratio of 1:75 mg/mL) at 66 °C for 39 min. The purification of FPCS using different macroporous resins showed that D101 performed best when the initial mass concentration of the injection solution was 1.50 mg/mL, resulting in a three-fold increase in color value. The yield of dry flowers was 9.75% of fresh petals and the FPCS extraction efficiency was 43.2%. The effects of light, solubility, pH, temperature, sweeteners, edible acids, redox agents, preservatives and metal ions on FPCS were also investigated. Furthermore, the characteristics of FPCS were determined by spectrophotometry at a specific wavelength using the Lambert–Beer law to correlate the mass of FPCS with its absorbance value. An acute toxicological test performed according to Horne’s method showed that FPCS is a non-toxic extract and thus may be used as a food additive or in other ingestible forms. Finally, western blotting showed that FPCS prevents lipopolysaccharide-induced hippocampal oxidative stress in mice. The study suggests that FPCS may function as an antioxidant with applications in the food, cosmetics and polymer industries.
1. Introduction
Nature has long been recognized as a source of innumerable biologically active compounds, many of which have medical applications either as purely natural products or as their derivatives [1,2,3,4]. However, the limited availability of source material for natural products such as pigments can hamper biological studies and the clinical development of interesting compounds. In this context, both industry and academia are continuing to develop sustainable methods of extraction involving technologies that can isolate biologically active natural products quickly and cheaply [5,6,7].
Edible natural pigments can be obtained from natural resources including animals, plants and microorganisms. Natural pigments, unlike synthetic pigments, are generally safe and non-toxic. As well as their natural coloring properties, most of these pigments have some pharmacological value, either alone or in combination with other compounds, which has provoked recent attention from researchers and industrialists [8,9].
Ceiba speciosa, also known as the floss silk tree, is a large tree within the Bombacaceae family. It occurs in tropical and subtropical forests in South American countries such as Argentina, Bolivia, Brazil, Peru and Paraguay [10,11], and is also found in Guangdong province, China. It is also consumed in Northern and Eastern Nigeria as a traditional medicine for diabetic control. This tree is also found in Palermo city, representing its availablity in Europe [12]. C. speciosa is a fast-growing deciduous tree with unique and appealing characteristics. It produces soft compound leaves with six to eight leaflets, while its large, ornamental flowers are pale pink with five frilly petals and a cream-colored or yellow center. This tree has been investigated on several levels. Thus, a complex polymer with a backbone made up of glucuronosyl and mannosyl units has been found in the gum exudate, which is exuded when the trunk is injured [11]. C. speciosa fruit elicits anti-inflammatory and antioxidant responses via phenolic compounds that inhibit hydrogen peroxide-induced mitochondrial membrane depolarization and caspase-9 activation [11,13]. Preliminary research suggests that C. speciosa leaf extracts have antioxidant, anti-inflammatory, antipyretic, antibacterial and antifungal functions [14,15], while its seed oil shows hypoglycemic and anti-obesity properties [16]. An aqueous extract of C. speciosa bark has a low toxicity and the potential to treat hyperglycemia in animals [17]. However, to date, there has been no investigation of the extraction and possible beneficial functions of the flower pigment of C. speciosa (FPCS).
The aim of the present work was to determine and validate optimum extraction conditions for a quantitative analysis of FPCS and to further explore the potential of FPCS as an antioxidant and as a new source of natural pigment. Several parameters were evaluated, such as the solvent concentration, solid/liquid (SL) ratio, extraction time, ultrasound power and extraction temperature, that may significantly affect the extraction efficiency. The study showed that some parameters, such as the volume fraction of ethanol, SL ratio and homogenization time, were critical for the yield and purity of FPCS. Finally, the results of bioactivity screening suggest that FPCS is non-toxic and may function as an antioxidant.
2. Materials and Methods
2.1. Extract Preparation
FPSC was harvested from October to December 2020 from different C. speciosa trees in Guangzhou (23°7′0′′ N 113°15′ E), Guangdong Province, China. The species and its flowers were identified by a botanist. In particular, the gathering of flowers was carried out in the city by collecting them randomly from 30 healthy plants. The collected flowers were deposited in the School of Life Sciences (FCSBC10122020) and delivered to a laboratory, washed with distilled water and then air dried for about a week. After cleaning and drying, the yield of dry flowers was 9.75% of fresh petals. Dry flowers were crushed with a grinder, passed through an 80-mesh sieve and stored at 4 °C. Ethanol was used for extraction since it had a higher extraction efficiency than water in our preliminary experiments.
2.2. Response Surface Methodology (RSM)
Lixiviating and Thermal baths were used to perform the extraction. The study used the experimental design of pigment extraction which mainly considers four factors: extractant concentration, solid–liquid ratio, temperature and extraction time. Based on the verification of a single-factor experiment, all four factors had a significant impact on the extraction rate, indicating that the extraction rate was affected by multi-factors and should be analyzed by RSM [18]. The Box–Behnken design (BBD) was selected to obtain the best extraction conditions when there are more than three factors which act together. The ranges of four factors: extractant concentration (65–85%), material–liquid ratio (1:60–1:80), temperature (60–80 °C) and time (45–60 min).
The process flow was as follows: petal harvesting → cleaning → drying → crushing → ethanol solution extraction → centrifugal separation → filtration → rotary evaporation → drying → crude product.
The C. speciosa petal powder was accurately weighed into a triangular flask and the crude product was extracted according to the process flow. After accurately weighing the quantity of the crude product, the yield of crude pigment was calculated according to the following formula:
Yield (y) = mass of crude pigment/mass of petal powder × 100%
2.3. Purification of FPCS
Macroporous resin is a styrene-type non-polar copolymer that was used as an adsorbent to remove impurities such as colloids, starch, sugar, fat, tannin and inorganic salts in the crude FPCS preparation. The porosity of D101 macroporous resin is 42–46%, with an averaged pore size of 25–28 nm and granulation (particle size range 0.3–1.25 nm) ≥ 95%. The porosity of A8 macroporous resin is 42–46%, with an averaged pore size of 12–16 nm and granulation (particle size range 0.3–1.25 nm) ≥ 95%. The porosity of HPD100 macroporous resin is 42–46%, with an averaged pore size of 8.5–9 nm and granulation (particle size range 0.3–1.25 nm) ≥ 95%. All resins were from Donghong Chemical Co., Ltd. (Dongguan, China). A static adsorption method was used: the activated macroporous resin was accurately weighed into a conical flask and an FPCS solution of the same volume and concentration was added; the flask was shaken at room temperature (100 rpm) for 24 h; then, the absorbance (A1) of the supernatant at the maximum absorption wavelength was measured every 2 h and the static adsorption rate and adsorption capacity were calculated as follows:
where M is the mass of resin; A0 is the absorbance value of pigment stock solution; V0 is the volume of pigment stock solution; and A1 is the absorbance value of thesupernatant after adsorption.
Adsorption rate = (A0 − A1)/A0 × 100%;
Adsorption capacity = (A0 − A1) × V0/M
For the dynamic adsorption method, the activated macroporous resin was placed in a chromatographic column and FPCS solutions of different concentrations (0.5, 1, 1.5, 2, 2.5 mg/mL) were passed through the column at 1 mL/min. The absorbance (A1) was determined, then ethanol solutions of different concentrations (55%, 65%, 75%, 85%, 95%) at different rates (1, 2, 3, 4, 5 mL/min) were selected for elution and the absorbance (A2) was measured. To evaluate the best purification conditions, the adsorption rate, adsorption capacity, resolution rate, desorption capacity and recovery were calculated as follows:
where M is the mass of resin; A0 is the absorbance value of pigment stock solution; V0 is the volume of pigment stock solution and V is the volume of desorption solution; A1 and A2 are the absorbance values of the supernatant after adsorption and desorption, respectively; Cα is the pigment concentration in the recovery solution; Vα is the volume of recovered solution; Cβ is the pigment concentration of the injection solution; and Vβ is the injection volume.
Adsorption rate (%) = (A0 − A1)/A0 × 100%;
Adsorption capacity = (A0 − A1) × V0/M;
Desorption rate (%) = A2/(A0 − A1) × 100%;
Desorption amount = A2 × V/M;
Recovery (%) = CαVα/CβVβ × 100%
2.4. Color Value of FPCS
The color value of FPCS was determined according to the Chinese standard GB15961-2005 by accurately weighing 0.05–0.1 g (accurate to 0.0002 g) pigment into a 50 mL beaker and dissolving the pigment in distilled water, then transferring it to a 100-mL vessel and shaking well. Absorbance was measured at 370 nm in a 1-cm cuvette and the color value of the pigment was calculated according to the following formula:
where E (370 nm) represents the color value of the sample, 1% is the sample concentration and 1 cm is the cuvette size; A is the absorbance value of the sample solution; n is the dilution ratio; and m is the mass of the sample in grams.
2.5. Antioxidant Capacity of FPCS
Using the Lambert–Beer Law, various volumes of a 1.0 mg/mL FPCS solution (0.25, 0.4, 0.55, 0.7, 0.85 and 1 mL) were mixed in 10 mL volumetric flasks with 2.5 mL of 2,2-diphenyl-1-picrylhydrazyl (DPPH) solution. The volume was adjusted with absolute ethanol, shaken well and the absorbance was measured. Then antioxidant activity, represented by DPPH clearance, was calculated using the Lambert–Beer law according to the formula:
where W represents DPPH clearance; A1 represents absorbance of the DPPH solution; and As is the absorbance of DPPH solution in the presence of the sample. Clearance of the free radical, 2,2′-azinobis-(3-ethylbenzthiazoline-6-sulphonate (ABTS), was measured in a similar way. IC50 is given by the W value when the clearance rate is 50% according to the formula above.
W% = A1 − As/A1 × 100%
2.6. Mice
Male and female Kunming (KM) mice [19] (Charles River, Beijing, China) were used in this study. Mice were housed in a climate-controlled room (25 °C) on a 12 h light–dark cycle (lights on at 8:00 a.m.) with ad libitum access to standard rodent chow. All animal experiments performed were approved by the Animal Care and Use Committee of Guangzhou University and followed the guidelines published in the National Institutes of Health Guide for the Care and Use of Laboratory Animals.
2.7. Acute Toxicity Test
Based on Horn’s method [20,21], thirty KM mice, which are often preferred for laboratory research on vaccines or drugs [22,23,24,25], were used. All animals were housed in a standard environment (12 h light/dark cycle, 25 ± 1 °C) and had free access to a standard rodent chow and fresh water. The mice were adaptively raised for seven days before the start of the actual experiment. Both male and female mice of 18–22 g weight were used. Mice were randomly divided into five groups with six mice in each group. After 48 h of normal feeding, mice were subjected to fasting for 12 h with freely available drinking water. Intragastric doses of 6.0, 3.25, 1.75 and 0.50 g/kg FPCS, dissolved in saline at 10 g/0.4 mL, were delivered by gavage to the four experimental groups. Vehicle-treated mice were used as a control group. The gavage volume used in this experiment was 10 g/0.4 mL. After gavage, mice were given ordinary pellet feed and drinking water. The clinical symptoms and the death of mice were recorded for one week. The acute toxicity classification was based on the LD50 (GB15193.3-2014). Experimental procedures were approved by the Institutional Animal Care and Use Committee at Guangzhou University and South China Normal University. The methods were carried out in compliance with the accepted recommendations published by the National Institutes of Health Guide for the Care and Use of Laboratory Animals.
2.8. FPCS and LPS Treatment
To confirm the antioxidant activity of FPCS in lipopolysaccharide (LPS)-challenged mice, purified FPCS was injected intraperitoneally (i.p.) at doses of 10 mg/kg, 30 mg/kg and 90 mg/kg daily for seven days [26]. LPS from Escherichia coli serotype O111:B4 (Sigma- Aldrich Shanghai Trading Co., Ltd., Shanghai, China) was diluted in saline and injected into mice at a dose of 0.83 mg/kg [27]. Saline (indicated as Ctrl in the text) or LPS was injected 3 h prior to experimental measurements. Animals were randomly divided into the following six groups:
- Group 1—Vehicle control (saline i.p) for 7 days;
- Group 2—Vehicle for 7 days and LPS (0.83 mg/kg i.p.) on the 8th day;
- Group 3—FPCS (10 mg/kg i.p.) for 7 days and LPS (0.83 mg/kg i.p.) on the 8th day;
- Group 4—FPCS (30 mg/kg i.p.) for 7 days and LPS (0.83 mg/kg i.p.) on the 8th day;
- Group 5—FPCS (90 mg/kg i.p.) for 7 days and LPS (0.83 mg/kg i.p.) on the 8th day;
- Group 6—FPCS (10 mg/kg i.p.) for 7 days.
The animals used for western blotting were killed by cervical dislocation after 3 h saline or LPS challenge.
Below is the table showing the chemicals (Damao Chemical Reagent Factory, Dongguan, China) used in this study.

2.9. Western Blotting
Mouse brains were rapidly dissected on ice and hippocampus tissues were homogenized in a lysis buffer (50 mM Tris pH 7.5, 150 mM NaCl, 5 mM EDTA pH 8.0, 1% SDS and protease inhibitors (Complete Mini; Roche, Basel, Switzerland). After centrifugation at 4 °C (14,000 rpm for 10 min), cellular debris was removed, and the supernatant was collected for western blotting. Tissue lysates were analyzed by sodium dodecyl sulfate-polyacrylamide gel electrophoresis (SDS-PAGE) and separated proteins were transferred to nitrocellulose membranes. Membranes were then blocked with 5% defatted milk in Tris-buffered saline with Tween 20 (TBST) for 1 h and incubated overnight at 4 °C with the following specific primary antibodies against iNos (Abcam, ab178945; dilution 1:1000), nitrotyrosine (Santa Cruz: sc-32757; dilution 1:1000) and Hsp60 (Abcam, ab46798; dilution 1:2000). Anti-GAPDH antibody (AF0006, Beyotime, Jiangsu, China) was used as a loading control. After three washes with TBST, an HRP-labeled secondary antibody (CWS, Taizhou, China) was added at room temperature for 1 h using 5% milk in TBST, followed by three additional washes with TBST. The Immobilon ECL western system (Millipore, Burlington, USA) was then used to visualize the bands, which were quantified and analyzed with Gel-Pro Analysis software (Media Cybernetics, Rockville, MD, USA).
2.10. Statistical Analysis
Prism 8.0 for Windows (GraphPad, San Diego, CA, USA) and OriginPro 2020 (OriginLab, Northampton, MA, USA) software was employed for graphing and the statistical analysis of all single factor tests. Design-Expert 12.0 (StAt-Ease Company, Minneapolis, MN, USA) was used to design and analyze the mathematical model of the RSM experiment. A two-sample t-test was used for statistical analyses between two-group comparisons. For western blotting analysis, One-Way ANOVA with Post-Hoc test was performed. p < 0.05 was considered statistically significant. The data are presented as mean ± SEM.
3. Results
3.1. Optimization of FPCS Extraction by Response Surface Methodology
The extraction process for FPCS was optimized as an improvement on the traditional solvent extraction method reported previously [28]. Response surface methodology (RSM) is commonly used to optimize complex extraction procedures as it can simultaneously evaluate the effects of different parameters, as well as their interactions [5,29,30]. Using this technique, the effects of ethanol concentration, SL ratio, temperature and time on the extraction rate of FPCS were first determined in single-factor experiments. The highest pigment extraction rate was obtained when the ethanol concentration was 75% (Figure 1A). Higher concentrations of ethanol (>75%) resulted in a decreased extraction rate. The SL ratio affects the solubility of the raw materials in the extraction solvent [31]. A low SL ratio results in a rapid increase in the liquid-phase concentration, thus reducing the solubility of the raw materials. On the other hand, when the SL ratio is high, the raw materials can be fully dissolved, but this may also result in the dissolution of other substances. Therefore, it is crucial to select the appropriate SL ratio by performing a single-factor experiment. The FPCS extraction rate was highest when the ratio was 1:70 (Figure 1B), which showed a significant difference with adjacent values (p < 0.05). Temperature is also a very important factor in the extraction process [31,32], which was confirmed by our results for FPCS. Below 70 °C, the extraction rate was positively correlated with temperature. Thereafter, the effect of temperature plateaued, suggesting that 70 °C is optimal for FPCS extraction (Figure 1C). Another crucial factor in the extraction process is time [33,34]. The FPCS extraction rate increased slightly between 15- and 45-min extraction time, and reached its highest level at 45 min (p < 0.05), but decreased with longer times (Figure 1D). This suggests that 45 min is the optimal time for FPCS extraction. Indeed, longer times could result in the extraction of other substances, thereby decreasing the relative extraction rate of FPCS.
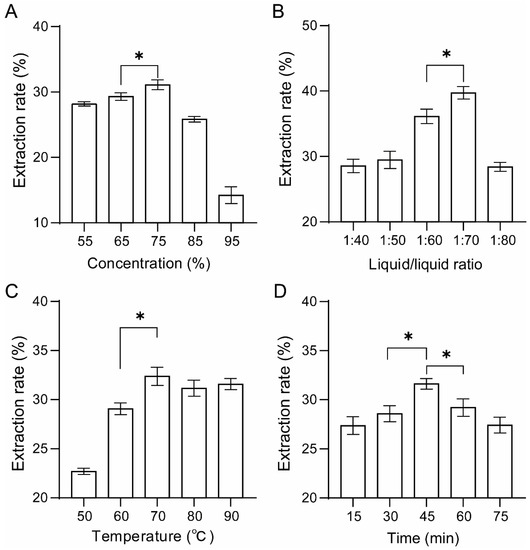
Figure 1.
Effects of different extraction conditions on the single-factor extraction rate of FPCS. (A) Ethanol concentration. (B) Solid/liquid ratio. (C) Extraction temperature. (D) Extraction time. An asterisk (*) indicates statistical significance at p < 0.05.
Using the Box–Behnken experimental design, the four factors of ethanol concentration, SL ratio, extraction temperature and time were used as the test factors for the response surface analysis, with the pigment extraction rate as the reference index, resulting in the optimization of the extraction process (Table 1). The corresponding quadratic equation model was obtained using Design Expert 12.0 software as follows:
Y = 48.46 − 1.63A + 0.6083B − 1.9C − 1.00D − 2.35AB − 0.5AC − 1.12AD − 2.32BC − 1.1BD + 1.12CD − 9.81A2 − 10.11B2 − 7.25C2 − 6.5D2.

Table 1.
Box–Behnken test and effect value.
Using analysis of variance (Table 2), it can be seen that the F value of the model was 9.00 and the p-value was less than 0.0001, indicating that the model was highly significant, fit the real situation very well, and thus could be used to predict the extraction rate.
Table 2.
ANOVA analysis of pigment extraction from exotic cotton by response surface analysis.
3.2. Interpretation of Response Surface Models
Response surfaces were plotted to study the effects of the parameters and their interactions on the extraction of FPCS. The fitting function produced three-dimensional response surface plots simultaneously showing the effect of two factors on the pigment extraction rate (Figure 2). Thus, Figure 2A–C shows the response surface plots of the effect of the ethanol concentration (65–85%) together with the SL ratio (1:60–1:80) (Figure 2A), temperature (60–80 °C) (Figure 2B) or extraction time (30–60 min) (Figure 2C). Clearly, ethanol concentration had a significant impact: the FPCS extraction rate increased slightly, then decreased with increasing ethanol concentration. At a given ethanol concentration, SL ratio and time, the extraction rate first went up slightly when the extraction temperature was increased (in the given range), suggesting that temperature does have a positive influence on the FPCS extraction rate. However, the extraction rate went down when the temperature was further increased (Figure 2B,D,F). Thus, a proper temperature is critical in FPCS extraction. The interaction effect, i.e., extraction time with concentration, SL ratio with temperature, on the extraction rate is also shown (Figure 2C,E,F). For example, in the 30–60 min range, time had a significant effect on the FPCS extraction rate, which first increased and then decreased.
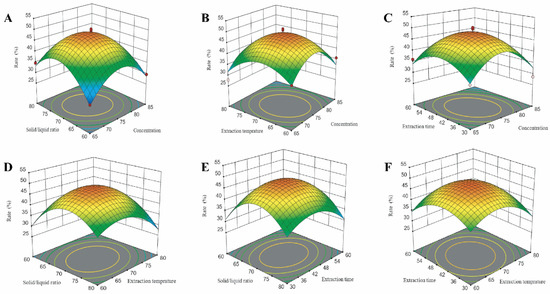
Figure 2.
The 3D response surface (RSM) analysis of the extraction rate of FPCS, showing the interactive effects of parameters including (A) Solid/liquid ratio and ethanol concentration. (B) Extraction temperature. (C) Extraction time. (D) Solid/liquid ratio and temperature. (E) Solid/liquid ratio and time. (F) Extraction time and temperature.
The regression model within the Design Expert 12.0 software package was used to optimize the levels of the above significant factors. Taking the pigment extraction rate as the investigation index, the optimized extraction conditions are shown in Table 3. For practical application, the conditions were rounded as follows: ethanol concentration, 76%; SL ratio, 1:75; temperature, 66 °C; and time, 39 min. Under these conditions, experimental validation was carried out with three repeats. The averaged extraction rate was 43.2% and the prediction accuracy was 95.68%. These results suggest that there was no significant difference between the measured average value and the predicted value, i.e., the fitting of the model was good and the prediction was accurate.
Table 3.
Optimized extraction conditions of FPCS.
3.3. Purification of FPCS by Macroporous Resin
3.3.1. Static Adsorption Experiment
To obtain high-purity pigment products and to expand the application range of such pigments, it is often necessary to further purify crude preparations of the pigment and remove impurities [35,36]. Using a macroporous resin as an adsorbent, the effects of different factors on the static and dynamic adsorption and desorption of FPCS were investigated. This allowed the optimal process for resin purification of pigment to be determined and provided a theoretical basis and some scientific data for the production and use of the pigment [37,38,39].
Based on the UV-vis spectrum obtained by full-band scanning (Figure 3A), FPCS had an absorption peak at 370 nm; this wavelength was used subsequently to assay pigment solutions. Three macroporous resins, D101, A8 and HPD100, were selected for static and dynamic adsorption experiments, and their absorbance was measured. The absorbance and pigment concentrations were transformed using a linear regression equation (Figure 3B). In the static test, the adsorption rate with HPD100 was flat after 6 h, with A8 after about 7 h and with D101 after about 10 h. Overall, D101 gave a higher adsorption rate than A8 or HPD100 (Figure 3C). In the static test, the desorption rates of D101 and HPD100 were significantly higher than that of A8, but there was no significant difference between D101 and HPD100 (Figure 3D). Taking above both results into account, the D101 macroporous resin was selected for purifying FPCS.
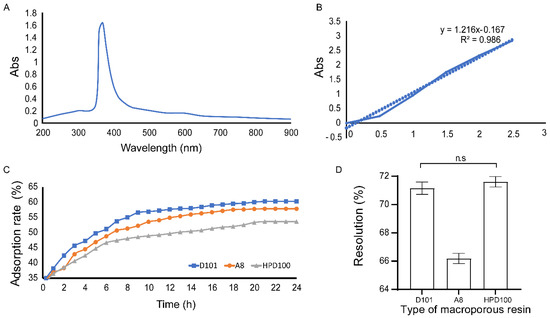
Figure 3.
Analysis of the adsorption of macroporous resin. (A) The UV-vis spectrum of FPCS showing an absorbance peak at 370 nm. (B) Linear regression of pigment concentration and adsorbance at 370 nm. (C) Adsorption rate of D101, A8 and HPD100 macroporous resins. (D) Higher desorption rates of D101 and HPD100 than A8 macroporous resin.
3.3.2. Dynamic Adsorption Experiment
The best loading volume to use with resin D101 was investigated (Figure 4A). The FPCS concentration in the effluent reached 0.124 mg/mL when the upper column volume was 60 mL. The FPCS concentration was 10% in the initial sample solution as the leakage point of D101; therefore, the upper column volume could be maintained at 60 mL. The adsorption capacity of D101 gradually became saturated as the sample solution volume was increased. However, when the sample volume reached 210 mL, the FCPS in the effluent concentration was 1.0 mg/mL, very similar to that of the sample solution, indicating that the saturation point of D101 had been reached [39,40].
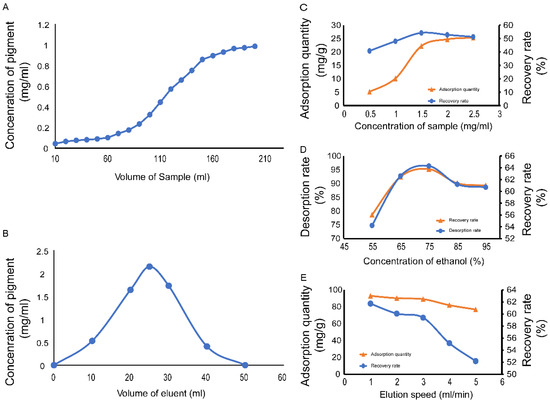
Figure 4.
Dynamic breakthrough curve of D101 macroporous resin adsorption. (A) D101 leakage curve. (B) D101 elution curve. (C) Effect of different sample concentrations on the adsorption performance of D101 resin. (D) Effect of eluent concentration on the desorption performance of D101 resin. (E) Effect of desorption flow rate on the desorption performance of D101 resin.
Using the optimum loading volume determined above, we examined the elution of FCPS from the D101 column (Figure 4B). The FPCS concentration in the eluent reached a maximum value at a total eluent volume of 25 mL. However, as the volume of eluent increased further, the concentration of the pigment in the eluent gradually decreased: when the eluent volume reached 50 mL, the FPCS content decreased to its minimum value in the eluent (<0.01 mg/mL), indicating that all the pigment adsorbed by the macroporous resin had been eluted. Considering that the elution peak was single, symmetrical and sharp, the obvious tailing phenomenon showed that the pigment could be completely eluted by 50 mL of 95% ethanol.
Having determined the appropriate loading and elution volumes for FPCS, the eluent concentration and elution rate were analyzed by single-factor analysis. The elution rate was determined by comprehensively considering the production cycle and recovery rate. After purification by D101, the yield of FPCS was 5.73%, and the color value was 29.41. The color value of the pigment increased nearly three-fold after purification. In the low mass concentration range, the resin adsorption capacity and recovery rate increased with increasing the FPCS concentration up to a concentration of 1.50 mg/mL, at which the resin reached its maximum adsorption capacity, remaining essentially unchanged thereafter (Figure 4C). However, when the FPCS concentration was greater than 1.50 mg/mL, recovery decreased because the sample concentration exceeded the adsorption saturation point of the resin. Together, the results suggest that an initial FPCS concentration of 1.50 mg/mL is appropriate. It is known that compounds such as polyphenols and compounds with glycosidic bonds show a weak polarity in aqueous solutions and are easy to elute from macroporous resins using ethanol [41]. We found that the amount of ethanol was critical: at a volume fraction of ethanol ≤ 75%, both the desorption rate and the recovery rate gradually increased, while at a volume fraction > 75% ethanol, there was a downward trend in the recovery rate (Figure 4D). An elution rate of 1.0 mL/min gave the best pigment recovery rate, with higher flow rates resulting in decreased desorption and recovery rates (Figure 4E).
3.4. The Stability of Purified and Unpurified FPCS
Plant extracts are an incredible source of key secondary metabolites including polyphenolics, alkaloids and terpenes, having significant biological activity. Growing demand for these phytochemicals requires a suitable method to efficiently extract and process various plant extracts. An important part of the quality control of natural pigment preparations is the assessment of the chemical stability of a final product during the storage period [42]. Moreover, the existence of enzymes such as glycosidases, esterases or oxidases plays a crucial role in the breakdown of secondary plant metabolites [43,44]. Pigments are sensitive to light which can change the functional groups in the pigments and affect their stability. High concentrations of metal ions interact with pigments, resulting in precipitation. Natural pigments are sensitive to light which can change the functional groups in the pigments and affect their stability; thus, most need to be stored in the dark [45]. Therefore, we next tested the sensitivity of FPCS to light. After one week of direct exposure to sunlight, the pigment retention rate was only 72.11% (Figure 5A). In contrast, natural light, which was indoor lighting in this study, decreased the retention rate by about 10% in a week, suggesting it had relatively little effect on the stability of FPCS (Figure 5B). Under dark conditions, the pigment stability was high, with FPCS retention rates after one week at 98.23% and 94.12% for unpurified and purified pigments, respectively (Figure 5C). Therefore, direct sunlight clearly had a detrimental effect on the stability of FPCS.
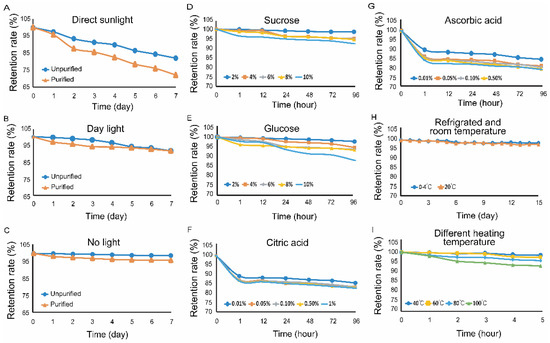
Figure 5.
Stability of purified and unpurified FPCS. (A) Retention rate of the purified pigment after one week of sunlight irradiation. (B) The retention rates of purified and unpurified pigments after one week of natural light irradiation. (C) The retention rates of purified and unpurified pigments after storage in the dark. (D) The effect of different concentrations of sucrose on the stability of FPCS. (E) The effect of different concentrations of glucose on the stability of FPCS. (F) The effect of different concentrations of citric acid on the stability of the pigment. (G) The effects of different concentrations of ascorbic acid on the stability of the pigment. (H) The retention rate of the pigment after 15 days of cold storage and at room temperature. (I) The effect of different temperatures on the stability of FPCS.
Sweeteners have also been shown to affect the stability of pigments [46,47]. The present study shows that a low concentration of glucose or sucrose had little effect on the stability of purified FPCS, with FPCS absorbance changing only slightly during storage. However, increasing concentrations of these two sugars had a negative effect: a significant difference (p = 0.0122) was observed between the experiments with 2% and 10% glucose, for example. In other words, FPCS is relatively stable in the presence of low concentrations of sucrose and glucose, but high concentrations have a marked impact on the stability of the pigment (Figure 5D,E).
Weak alkaline substances affect the overall pH of the solution, thereby changing the absorbance of the pigments and even achieving color enhancement [48]. Various edible acids are often used as food additives [49]. Therefore, the effects of citric acid and ascorbic acid on the stability of C. speciosa pigment were determined in this study. Even at a low concentration of 0.01%, both acids significantly decreased the levels of FPCS after 96 h, with residual levels of 82.65% (p = 0.0007) (Figure 5F) and 77.76% (p = 0.0047) (Figure 5G) for citric acid and ascorbic acid, respectively. Therefore, ascorbic acid, citric acid and other edible acids should be avoided during pigment storage.
Temperature can also affect the stability of pigments [50]. We found that when FPCS was stored either in a fridge (0–4 °C) or at room temperature (about 20 °C), there was no color change over a period of 15 days, with the retention rate of the pigment remaining above 97% (Figure 5H). This suggests that refrigeration and room temperature had no significant effect on the stability of FPCS, but after being stored at 40–80 °C for 5 h, the absorbance of the pigment decreased slightly, although the retention rate was still greater than 95%. However, when the temperature was increased to 100 °C, the retention rate decreased significantly compared to storage at 40 °C (p = 0.01185) (Figure 5I). It is likely that a high temperature might cause the denaturation of some chromoprotein structures of the pigment [51], and thus change the stability of FPSC. Therefore, these results suggest that high temperature storage should be avoided.
3.5. Impact of Oxidizing and Reducing Compounds, Preservatives and Metal Ions on the Stability of FPCS
The effect of redox-active compounds on the stability of FPCS was investigated next. When the concentration of H2O2, a powerful oxidant, was low (0.005%), the pigment was relatively stable, but above 0.05% H2O2 the retention rate decreased significantly compared to 0.005% H2O2 (p = 0.0029) (Figure 6A), indicating that FPCS may have a degree of antioxidant capacity. The reducing agent, Na2SO3, had little effect on the stability of the pigment at 0.5%, but, remarkably, lower concentrations of Na2SO3 (e.g., 0.005%) reduced its stability (p = 0.00209) (Figure 6B).
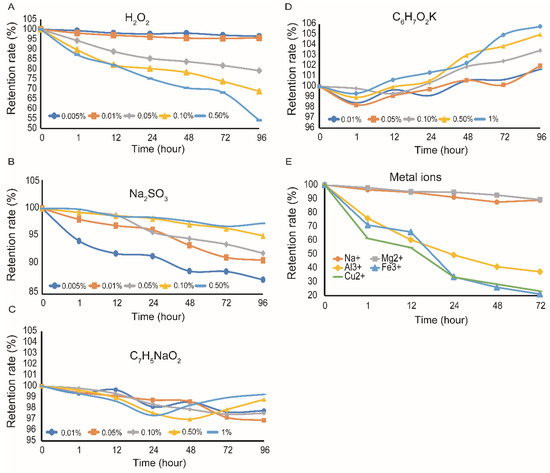
Figure 6.
Effects of oxidants and reductants, preservatives and metal ions on the stability of FPCS. (A) The effect of different concentrations of H2O2 on the stability of the pigment. (B) The effect of different concentrations of Na2SO3 on the stability of FPCS. (C) The effect of different concentrations of sodium benzoate on the stability of FPCS. (D) The effect of different concentrations of potassium sorbate on the stability of the pigment. (E) The effect of Na+, Mg2+, Al3+, Fe3+ and Cu2+ on the stability of the pigment.
Preservatives, the most common food additives, inevitably come into contact with pigments [52]. Various concentrations of sodium benzoate and potassium sorbate, for example, are known to affect the stability of pigments [53,54]. We found that sodium benzoate across a range of concentrations had no effect on FPCS, with the retention rate being statistically unchanged (Figure 6C). In the case of potassium sorbate, increasing concentrations gave an apparent increase in the retention rate of FPCS, with 1% potassium sorbate significantly increasing the retention rate over 96 h (p = 0.00119) (Figure 6D). Therefore, it seems that potassium sorbate has a protective effect against the fading of FPCS.
Metal ions can also affect the stability of pigments [55], but we observed no significant effect of Na+ and Mg2+ on the stability of the FPCS. In contrast, Al3+, Fe3+ and Cu2+, at concentrations less than 0.01 M, degraded the pigment with time (Figure 6E). Moreover, when the concentration was greater than 0.01 M, all three ions induced a brownish-red precipitation of the pigment, which may have been due to the formation of a complex between, or a reaction product of, the pigment and the metal ions [56].
3.6. Antioxidant Activity of FPCS In Vitro
The assessment of antioxidant capacity is well established and we therefore next used an in vitro evaluation model to determine whether FPCS had antioxidative capacity. Many in vitro evaluation methods are available, such as spectrophotometry, chemical fluorescence and electron spin resonance, to detect and quantitate free radicals [57,58]. Here, we used a well-known spectrophotometric assay involving the neutralization of the free-radical compounds, DPPH radical and ABTS+ radical.
3.6.1. Ability to Scavenge DPPH
The DPPH radical clearance rates with FPCS concentrations of 25, 40, 55, 70, 85 and 100 µg/mL were 35.78%, 41.06%, 54.88%, 61.38%, 73.98% and 81.30%, respectively (Figure 7A). It can be seen from the figure that the higher the pigment concentration, the higher the scavenging rate of free radicals and the stronger the antioxidant effect. Curve fitting showed a linear relationship between DPPH radical clearance and pigment concentration in the range tested, with the formula y = 0.634x + 18.437, where R2 = 0.9892 (Figure 7A). Using this linear regression equation, it can be calculated that FPCS scavenged the DPPH free radical with an IC50 of 49.78 µg/mL.
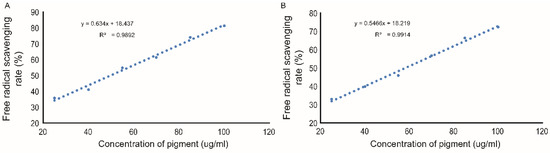
Figure 7.
Linear correlation plots of the antioxidant activity of FPCS in vitro. (A) DPPH radical scavenging activity of pigment. (B) Linear relationship between ABTS+ radical clearance rate and pigment concentration.
3.6.2. Ability to Scavenge ABTS+
With FPCS concentrations of 25, 40, 55, 70, 85 and 100 µg/mL, the ABTS+ radical clearance rates were 33.01%, 39.89%, 45.92%, 56.75%, 66.39% and 72.34%, respectively (Figure 7B). Again, the higher the FPCS concentration, the better the scavenging rate of free radicals and the stronger the antioxidant effect. There was a linear relationship between ABTS+ radical clearance rate and FPCS concentration, with the formula y = 0.5466x + 18.219, where R2 = 0.9914. Using this linear regression equation, the IC50 for FPCS scavenging of the ABTS+ free radical was 58.14 µg/mL.
3.7. Acute Toxicity Test in KM Mice
The oral LD50 of FPCS was determined by Horne’s method [20,21]. KM mice were given oral FPCS at 1.0–10.0 g/kg. There was no significant difference in body weight between the gavage group and the control group after seven days (p = 0.713); the mice were in a healthy condition with no adverse reactions, and no deaths were observed. It is worth noting that even at the highest dose, 10 g/kg, FPCS does not cause death in either male or female mice. The acute toxicity analysis of FPCS is summarized in Table 4.
Table 4.
Measurement of acute toxic effect of FPCS on mice.
3.8. FPCS Prevents LPS-Induced Oxidative Stress in KM Mice
Natural compounds, most of which are derived from plants, have long been known to have antioxidant properties. Based on the in vitro results, we speculated that FPCS might also reduce oxidative stress in vivo. It has been demonstrated that inflammatory mediators such as LPS and cytokines promote the production of inducible nitric oxide synthase (iNOS) in macrophages and microglia [59,60,61]. Nitrotyrosine, a biomarker of oxidative stress [62,63], is generated by the nitration of protein-bound and free tyrosine residues by reactive peroxynitrite molecules. Heat shock protein 60 (HSP60) is another regulator of oxidative stress and a potential modulator of neuroinflammation [64]. We thus evaluated the effect of FPCS on the levels of iNOS, nitrotyrosine and HSP60 in an LPS-induced oxidative-stress mouse model. The results showed that LPS significantly increased iNOS expression in KM mice (p = 0.003), but pretreatment with FPCS at 30 mg/kg (p < 0.001) and 90 mg/kg (p < 0.001) prevented LPS-induced iNOS expression (Figure 8A,B). There was a trend of increased HSP60 expression in LPS-injected KM mice, and pretreatment with FPCS at 10 mg/kg (p = 0.006), 30 mg/kg (p = 0.001) and 90 mg/kg (p = 0.002) significantly reduced LPS-induced HSP60 expression (Figure 8D). Levels of nitrotyrosine remained unchanged among the groups (Figure 8C). These results suggest that FPCS has a number of antioxidant properties.
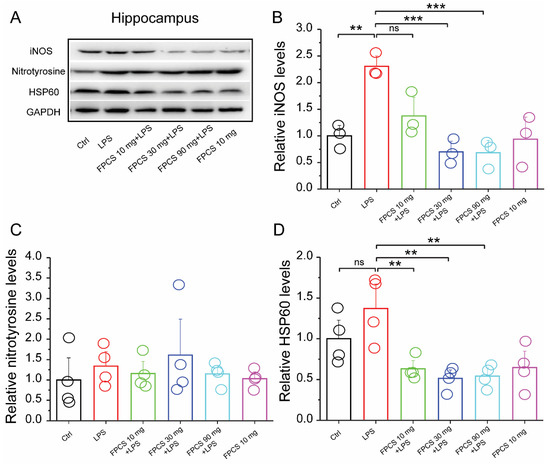
Figure 8.
FPCS treatment prevents LPS-induced oxidative stress in a mouse hippocampus. (A) Representative immunoblots of mPFC extracts from Ctrl, LPS, 10 mg FPCS + LPS, 30 mg FPCS + LPS, 90 mg FPCS + LPS and 10 mg FPCS alone. (B) Quantification of the immunoblots showing that LPS significantly increases iNOS expression, but pretreatment with 30 mg and 90 mg FPCS prevents this. (C) Identical expression of nitrotyrosine levels among groups. (D) Increased expression of HSP60 in LPS-treated mice is prevented by 10 mg, 30 mg and 90 mg FPCS treatment. One-way ANOVA followed by Tukey’s test for multiple group comparison. Data are presented as means ± SEM. ** p < 0.01, *** p < 0.001 and ns, not significant.
4. Discussion
Due to their supposed medicinal properties in humans, multiple parts of C. speciosa, including the seeds, bark and flowers, are used as a type of tea throughout North America and Asia, including China [16]. The present study described the extraction conditions and a quantitative analysis of the floral pigment, FPCS, from C. speciosa with further exploration of the potential of the extract as a new source of natural pigment. The antioxidative activity of FPCS in mice was also investigated. Our acute toxicological experiments showed that FPCS was nontoxic. Thus, we believe this study will contribute valuable knowledge about the extraction and biological effects of FPCS, and in particular that FPCS may be a safe source of natural color and may offer protection against oxidative stress damage.
The BBD was used to optimize the effect of the ethanol concentration, SL ratio, extraction temperature and extraction time on the extraction rate of FPCS. The results derived optimal extraction conditions that could be readily applied in a laboratory or production facility. For the purification of the pigment, three macroporous resins (D101, A8 and HPD100) were evaluated, and D101 was chosen due to its higher adsorption rate. The best purification procedure shown below was obtained through the dynamic adsorption single factor test: adding 60 mL pigment solution with a concentration of 1.50 mg/mL to the chromatography column at a flow rate of 1.0 mL/min, followed by 50 mL of wash detergent (75% ethanol) at a flow rate of 2.0 mL/min.
The FPCS yield using a traditional pure-water method was 23.1 ± 0.32% and we were able to improve this to 43.2 ± 0.21% by using ethanol in this study. The study shows that optimal extraction conditions were obtained when the ethanol concentration was 76%, SL ratio 1:75, temperature 66 °C and extraction time 39 min. Pigment stability was evaluated under various conditions, and our results allow us to provide guidance for the storage of FPCS. Briefly, (1) given that high temperature and direct sunlight have a marked impact on its stability, FPCS should be stored in cold storage in the dark. (2) FPCS is a strongly polar water-soluble pigment and remains stable when pH is acidic or neutral but is unstable in an alkaline environment. (3) FPCS is relatively stable in low concentrations of sweeteners, but high concentrations have a negative impact on pigment stability. (4) Edible acids have a significant negative influence on the pigment: both citric acid and ascorbic acid likely degrade FPCS over time. (5) H2O2 and Na2SO3 have relatively little effect on the stability of FPCS, indicating that FPCS has a degree of antioxidant and reducing capacity. (6) Sodium benzoate and potassium sorbate have protective effects on FPCS, especially potassium sorbate, which has a certain color increasing effect. (7) FPCS is relatively stable in the presence of Na+ and Mg2+, but Al3+, Fe3+ and Cu2+ have a significant negative influence on the stability of the pigment.
Worth noting is that our optimization of the extraction process increased the extraction rate of FPCS by about 20% compared to the traditional water extraction method. After purification by macroporous resin, the yield of FPCS was 5.73% and the color value was 29.41, which was nearly 3 times higher than the crude product. In addition, FPCS is not a carotenoid pigment since we could not obtain an extract when using ligroin as the solvent in a preliminary study. Given that we found that the color of FPCS solution became darker accompanied by bubbling when reacting with HCl-Zn, the FPCS may consist of flavonoids. Moreover, FPCS reacted with an FeCl3-induced brown solution with precipitation in our preliminary study, indicating it contained phenolic hydroxyl group [51]. The phytochemical analysis of the methanol extract of C. speciosa leaves showed the presence of bioactive compounds such as flavonoids, tannins glycosides, phenols, alkaloids, saponnins, steroids and terpernoids [65]. Proximate analysis of C. speciosa leaves showed 53% moisture, 2.5% ash, 24% carbohydrate, 12% fats and 8.5% protein [65]. The seed oil of C. speciosa contains linoleic acid (28.22%), palmitic acid (19.56%), malvalic acid (16.15%), sterculic acid (11.11%), and dihydrosterculic acid (2.74%) [16]. Together, these studies suggest the functional properties of C. speciosa and propose its use as an important bioactive compound.
Our acute in vivo toxicology experiments showed that gavage administration of FPCS is safe in both male and female mice. All mice survived seven days after gavage FPCS and were in healthy condition. Therefore, this study may provide valuable knowledge about the biological effects of FPCS.
The antioxidant activity of FPCS was investigated based on the Lambert–Beer law. This showed that the IC50 for the scavenging of DPPH free radicals by FPCS was 49.78 μg/mL, while the IC50 for the clearance of ABTS+ radicals was 58.14 μg/mL. Thus, FPCS had a scavenging effect on DPPH and ABTS+ free radicals, and this antioxidant capacity was concentration dependent. It is known that the ABTS antioxidant activity of Ceiba speciosa (A. St.-Hil.) seed oil is IC50 = 10.21 μg/mL, which is lower than FPCS. In contrast, the IC50 of its DPPH antioxidant activity is 77.44 μg/mL, which is higher than FPCS [16].
Increased oxidative stress has been linked to the development of a variety of diseases in humans, including neurodegenerative disorders, cancer, type 2 diabetes, inflammation, viral infections, autoimmune pathologies and digestive system disorders such as gastrointestinal inflammation and gastric ulcers [66,67,68,69]. Accordingly, the role of reactive oxygen species (ROS) in the etiology of a spectrum of diseases, together with the possibility of a protective effect of natural substances against such ROS, are currently major research topics. Antioxidants are among the most effective natural defenses against disease, offering protection against stressors that might otherwise harm cellular structures. Numerous fruits, vegetables and other plant materials are natural sources of compounds with protective activities, including antioxidant, anticancer, antibacterial, antiviral, antiseptic, anti-inflammatory and anti-allergic compounds [70,71,72,73,74]. Furthermore, the desire to increase fruit and vegetable consumption in the human diet is partially due to the favorable effects of beneficial antioxidants found in these foods on health promotion. Previous research on C. speciosa fruit and leaves has revealed anti-inflammatory and antioxidant properties [11,13,14,15], but whether FPCS, in addition to its role as a color additive, has similar activities was unknown before the current study.
Our work revealed that FPCS prevents LPS-induced oxidative stress in mice as indicated by reduced protein levels of iNOS and HSP60. Therefore, the antioxidant activity exhibited by the FPCS extract should be explored for potential pharmaceutical use in the future to elucidate its mechanism of action, and to isolate and characterize its active compounds.
5. Conclusions
This study showed that FPCS is nontoxic; therefore, C. speciosa flowers are a source of natural pigment that may be used as a color additive, and which can function as an antioxidant. The extension of the proposed production method to other sources of natural products will help to increase the availability and use of natural pigments and should yield a variety of functional compounds with applications in important industrial sectors such as food, cosmetics, medicine and biological components.
The optimal extraction results were obtained under the following conditions: ethanol concentration 76%, SL ratio 1:75, extraction temperature 66 °C and extraction time 39 min. This study increased the extraction rate of FPCS by about 20% compared to the traditional water extraction method. The results regarding the stability of FPCS in different chemical and physical environments may be instructive for its storage and processing.
Moreover, the results derived the optimal conditions for the extraction of FPCS that could be readily applied in laboratory research or a production facility, and future directions should involve the elucidation of its mechanism of action, and the isolation and characterization of its active compounds.
Author Contributions
Conceptualization, B.C., A.M. and L.Y.; methodology, B.C. and A.M.; software, B.C. and A.M.; validation, B.C.; formal analysis, B.C. and A.M.; writing—original draft preparation, B.C. and A.M.; writing—review and editing, A.M. and L.Y.; visualization, A.M.; supervision, C.L., Z.H., K.C. and L.Y.; project administration, L.Y.; funding acquisition, C.L. and L.Y. All authors have read and agreed to the published version of the manuscript.
Funding
The study was supported by grants from the National Natural Science Foundation of China (32170950, 31970915, 31771219, 31871170), the Guangdong Natural Science Foundation for Major Cultivation Project (2018B030336001) and the Guangdong Grant ‘Key Technologies for Treatment of Brain Disorders’ (2018B030332001).
Institutional Review Board Statement
This study was approved by the Institutional Review Board and Ethics Committee of Guangzhou University. The use of animals in experiments was approved by the Institutional Animal Care and Use Committee (IACUC) and followed by the National Institutes of Health (NIH) guidelines.
Informed Consent Statement
Not applicable.
Data Availability Statement
All data generated or analyzed during this study are included in this article.
Conflicts of Interest
The authors declare no conflict of interest.
References
- Zhang, H.; Bai, L.; He, J.; Zhong, L.; Duan, X.; Ouyang, L.; Zhu, Y.; Wang, T.; Zhang, Y.; Shi, J. Recent advances in discovery and development of natural products as source for anti-Parkinson’s disease lead compounds. Eur. J. Med. Chem. 2017, 141, 257–272. [Google Scholar] [CrossRef]
- Laraia, L.; Waldmann, H. Natural product inspired compound collections: Evolutionary principle, chemical synthesis, phenotypic screening, and target identification. Drug Discov. Today Technol. 2017, 23, 75–82. [Google Scholar] [CrossRef]
- Chopra, B.; Dhingra, A.K. Natural products: A lead for drug discovery and development. Phytother. Res. 2021, 35, 4660–4702. [Google Scholar] [CrossRef]
- Jugran, A.K.; Rawat, S.; Devkota, H.P.; Bhatt, I.D.; Rawal, R.S. Diabetes and plant-derived natural products: From ethnopharmacological approaches to their potential for modern drug discovery and development. Phytother. Res. 2021, 35, 223–245. [Google Scholar] [CrossRef]
- Zhou, Y.; Xu, X.Y.; Gan, R.Y.; Zheng, J.; Li, Y.; Zhang, J.J.; Xu, D.P.; Li, H.B. Optimization of ultrasound-assisted extraction of antioxidant polyphenols from the seed coats of red sword bean (Canavalia gladiate (Jacq.) DC.). Antioxidants 2019, 8, 200. [Google Scholar] [CrossRef]
- Zhang, H.; Wang, X.; He, D.; Zou, D.; Zhao, R.; Wang, H.; Li, S.; Xu, Y.; Abudureheman, B. Optimization of flavonoid extraction from Xanthoceras sorbifolia Bunge flowers, and the antioxidant and antibacterial capacity of the extract. Molecules 2021, 27, 113. [Google Scholar] [CrossRef]
- Garcia, M.L.; Carrion, M.H.; Escobar, S.; Rodriguez, A.; Cortina, J.R. Optimization of the antioxidant capacity of mangosteen peels (Garcinia mangostana L.) extracts: Management of the drying extraction processes. Food Sci. Technol. Int. 2021, 27, 404–412. [Google Scholar] [CrossRef]
- Lu, W.; Shi, Y.; Wang, R.; Su, D.; Tang, M.; Liu, Y.; Li, Z. Antioxidant activity and healthy benefits of natural pigments in fruits: A Review. Int. J. Mol. Sci. 2021, 22, 4945. [Google Scholar] [CrossRef]
- Hu, Y.L.; Luo, J.Y.; Hu, S.R.; Fu, H.; Yang, S.H.; Yang, M.H. Application of natural plant pigments in enlarged health industry. Zhongguo Zhong Yao Za Zhi 2017, 42, 2433–2438. [Google Scholar] [CrossRef]
- de Vasconcellos, T.J.; Da Cunha, M.; Callado, C.H. A comparative study of cambium histology of Ceiba speciosa (A. St.-Hil.) Ravenna (Malvaceae) under urban pollution. Environ. Sci. Pollut. Res. Int. 2017, 24, 12049–12062. [Google Scholar] [CrossRef]
- Beleski-Carneiro, E.; Sugui, J.; Reicher, F. Structural and biological features of a hydrogel from seed coats of Chorisia speciosa. Phytochemistry 2002, 61, 157–163. [Google Scholar] [CrossRef]
- Pasta, S.; La Mantia, T.; Badalamenti, E. A casual alien plant new to Mediterranean Europe: Ceiba speciosa (Malvaceae) in the suburban area of Palermo (NW Sicily, Italy). An. Jardin Bot. Madrid 2014, 71, 4. [Google Scholar] [CrossRef][Green Version]
- Dorr, J.A.; Bitencourt, S.; Bortoluzzi, L.; Alves, C.; Silva, J.; Stoll, S.; Pinteus, S.; Boligon, A.A.; Santos, R.C.V.; Laufer, S.; et al. In vitro activities of Ceiba speciosa (A.St.-Hil) Ravenna aqueous stem bark extract. Nat. Prod. Res. 2019, 33, 3441–3444. [Google Scholar] [CrossRef]
- Nasr, E.M.; Assaf, M.H.; Darwish, F.M.; Ramadan, M.A. Phytochemical and biological study of Chorisia speciosa A. St. Hil. Cultivated in Egypt. J. Pharmacogn. Phytochem. 2018, 7, 649–656. [Google Scholar]
- Parham, S.; Kharazi, A.Z.; Bakhsheshi-Rad, H.R.; Nur, H.; Ismail, A.F.; Sharif, S.; RamaKrishna, S.; Berto, F. Antioxidant, antimicrobial and antiviral properties of herbal materials. Antioxidants 2020, 9, 1309. [Google Scholar] [CrossRef]
- Rosselli, S.; Tundis, R.; Bruno, M.; Leporini, M.; Falco, T.; Gagliano Candela, R.; Badalamenti, N.; Loizzo, M.R. Ceiba speciosa (A. St.-Hil.) Seeds oil: Fatty acids profiling by GC-MS and NMR and bioactivity. Molecules 2020, 25, 1037. [Google Scholar] [CrossRef]
- Dos Santos, F.B.; Quines, C.B.; Pilissao, L.E.B.; Dal Forno, A.H.C.; Rodrigues, C.F.; Denardin, C.C.; Farias, F.M.; Avila, D.S. Aqueous bark extract of Ceiba speciosa (A. St.-Hill) ravenna protects against glucose toxicity in Caenorhabditis elegans. Oxid. Med. Cell Longev. 2020, 2020, 1321354. [Google Scholar] [CrossRef]
- Liu, T.; Ma, C.; Yang, L.; Wang, W.; Sui, X.; Zhao, C.; Zu, Y. Optimization of shikonin homogenate extraction from Arnebia euchroma using response surface methodology. Molecules 2013, 18, 466–481. [Google Scholar] [CrossRef]
- Zhou, Y.J.; Chang, Y.N.; You, J.Q.; Li, S.Z.; Zhuang, W.; Cao, C.J. Cold-pressed canola oil reduces hepatic steatosis by modulating cxidative stress and lipid metabolism in KM mice compared with refined bleached deodorized canola oil. J. Food Sci. 2019, 84, 1900–1908. [Google Scholar] [CrossRef]
- Lorke, D. A new approach to practical acute toxicity testing. Arch. Toxicol. 1983, 54, 275–287. [Google Scholar] [CrossRef]
- Erhirhie, E.O.; Ihekwereme, C.P.; Ilodigwe, E.E. Advances in acute toxicity testing: Strengths, weaknesses and regulatory acceptance. Interdiscip. Toxicol. 2018, 11, 5–12. [Google Scholar] [CrossRef] [PubMed]
- Yuan, Z.G.; Zhang, X.X.; Lin, R.Q.; Petersen, E.; He, S.; Yu, M.; He, X.H.; Zhou, D.H.; He, Y.; Li, H.X.; et al. Protective effect against toxoplasmosis in mice induced by DNA immunization with gene encoding Toxoplasma gondii ROP18. Vaccine 2011, 29, 6614–6619. [Google Scholar] [CrossRef]
- Qian, B.; Wang, C.; Zeng, Z.; Ren, Y.; Li, D.; Song, J.L. Ameliorative effect of sinapic acid on dextran sodium sulfate- (DSS-) induced ulcerative colitis in Kunming (KM) Mice. Oxid. Med. Cell Longev. 2020, 2020, 8393504. [Google Scholar] [CrossRef]
- Zhang, H.; Cheng, C.; Zheng, M.; Chen, J.L.; Meng, M.J.; Zhao, Z.Z.; Chen, Q.; Xie, Z.; Li, J.L.; Yang, Y.; et al. Enhancement of immunity to an Escherichia coli vaccine in mice orally inoculated with a fusion gene encoding porcine interleukin 4 and 6. Vaccine 2007, 25, 7094–7101. [Google Scholar] [CrossRef]
- Mei, X.; Zhang, Y.; Quan, C.; Liang, Y.; Huang, W.; Shi, W. Characterization of the pathology, biochemistry, and immune response in Kunming (KM) Mice following Fasciola gigantica infection. Front. Cell Infect. Microbiol. 2021, 11, 793571. [Google Scholar] [CrossRef] [PubMed]
- Masuelli, L.; Pantanella, F.; La Regina, G.; Benvenuto, M.; Fantini, M.; Mattera, R.; Di Stefano, E.; Mattei, M.; Silvestri, R.; Schippa, S.; et al. Violacein, an indole-derived purple-colored natural pigment produced by Janthinobacterium lividum, inhibits the growth of head and neck carcinoma cell lines both in vitro and in vivo. Tumour. Biol. 2016, 37, 3705–3717. [Google Scholar] [CrossRef]
- Jangra, A.; Lukhi, M.M.; Sulakhiya, K.; Baruah, C.C.; Lahkar, M. Protective effect of mangiferin against lipopolysaccharide-induced depressive and anxiety-like behaviour in mice. Eur. J. Pharmacol. 2014, 740, 337–345. [Google Scholar] [CrossRef]
- Zumahi, S.M.A.; Arobi, N.; Taha, H.; Hossain, M.K.; Kabir, H.; Matin, R.; Bashar, M.S.; Ahmed, F.; Hossain, M.A.; Rahman, M.M. Extraction, optical properties, and aging studies of natural pigments of various flower plants. Heliyon 2020, 6, e05104. [Google Scholar] [CrossRef]
- Belwal, T.; Dhyani, P.; Bhatt, I.D.; Rawal, R.S.; Pande, V. Optimization extraction conditions for improving phenolic content and antioxidant activity in Berberis asiatica fruits using response surface methodology (RSM). Food Chem. 2016, 207, 115–124. [Google Scholar] [CrossRef]
- Rajewski, J.; Dobrzynska-Inger, A. Application of response surface methodology (RSM) for the optimization of chromium(III) synergistic extraction by supported liquid membrane. Membranes 2021, 11, 854. [Google Scholar] [CrossRef]
- Onyebuchi, C.; Kavaz, D. Effect of extraction temperature and solvent type on the bioactive potential of Ocimum gratissimum L. extracts. Sci. Rep. 2020, 10, 21760. [Google Scholar] [CrossRef]
- Yan, J.K.; Yu, Y.B.; Wang, C.; Cai, W.D.; Wu, L.X.; Yang, Y.; Zhang, H.N. Production, physicochemical characteristics, and in vitro biological activities of polysaccharides obtained from fresh bitter gourd (Momordica charantia L.) via room temperature extraction techniques. Food Chem. 2021, 337, 127798. [Google Scholar] [CrossRef]
- Zhang, Q.W.; Lin, L.G.; Ye, W.C. Techniques for extraction and isolation of natural products: A comprehensive review. Chin. Med. 2018, 13, 20. [Google Scholar] [CrossRef]
- Spietelun, A.; Kloskowski, A.; Chrzanowski, W.; Namiesnik, J. Understanding solid-phase microextraction: Key factors influencing the extraction process and trends in improving the technique. Chem. Rev. 2013, 113, 1667–1685. [Google Scholar] [CrossRef]
- Liang, L.; Liu, G.; Yu, G.; Song, Y.; Li, Q. Simultaneous decoloration and purification of crude oligosaccharides from pumpkin (Cucurbita moschata Duch) by macroporous adsorbent resin. Food Chem. 2019, 277, 744–752. [Google Scholar] [CrossRef]
- Schimek, C.; Kubek, M.; Scheich, D.; Fink, M.; Brocard, C.; Striedner, G.; Cserjan-Puschmann, M.; Hahn, R. Three-dimensional chromatography for purification and characterization of antibody fragments and related impurities from Escherichia coli crude extracts. J. Chromatogr. A 2021, 1638, 461702. [Google Scholar] [CrossRef]
- Che Zain, M.S.; Lee, S.Y.; Teo, C.Y.; Shaari, K. Adsorption and desorption properties of total flavonoids from oil palm (Elaeis guineensis Jacq.) mature leaf on macroporous adsorption resins. Molecules 2020, 25, 778. [Google Scholar] [CrossRef]
- Wang, X.; Su, J.; Chu, X.; Zhang, X.; Kan, Q.; Liu, R.; Fu, X. Adsorption and desorption characteristics of total flavonoids from Acanthopanax senticosus on macroporous adsorption resins. Molecules 2021, 26, 4162. [Google Scholar] [CrossRef]
- Liu, J.; Meng, J.; Du, J.; Liu, X.; Pu, Q.; Di, D.; Chen, C. Preparative separation of flavonoids from Goji Berries by mixed-mode macroporous adsorption resins and effect on Abeta-expressing and anti-aging genes. Molecules 2020, 25, 3511. [Google Scholar] [CrossRef]
- Yang, Q.; Zhao, M.; Lin, L. Adsorption and desorption characteristics of adlay bran free phenolics on macroporous resins. Food Chem. 2016, 194, 900–907. [Google Scholar] [CrossRef]
- Sieminska-Kuczer, A.; Szymanska-Chargot, M.; Zdunek, A. Recent advances in interactions between polyphenols and plant cell wall polysaccharides as studied using an adsorption technique. Food Chem. 2022, 373, 131487. [Google Scholar] [CrossRef]
- Marsup, P.; Yeerong, K.; Neimkhum, W.; Sirithunyalug, J.; Anuchapreeda, S.; To-Anun, C.; Chaiyana, W. Enhancement of chemical stability and dermal delivery of Cordyceps militaris extracts by nanoemulsion. Nanomaterials 2020, 10, 1565. [Google Scholar] [CrossRef]
- Lopes, G.C.; Longhini, R.; Dos Santos, P.V.; Araujo, A.A.; Bruschi, M.L.; de Mello, J.C. Preliminary assessment of the chemical stability of dried extracts from Guazuma ulmifolia Lam. (Sterculiaceae). Int. J. Anal. Chem. 2012, 2012, 508945. [Google Scholar] [CrossRef]
- Weerawatanakorn, M.; Wu, J.C.; Pan, M.H.; Ho, C.T. Reactivity and stability of selected flavor compounds. J. Food Drug Anal. 2015, 23, 176–190. [Google Scholar] [CrossRef]
- Indrawati, R.; Zubaidah, E.; Sutrisno, A.; Limantara, L.; Yusuf, M.M.; Brotosudarmo, T.H.P. Visible light-induced antibacterial activity of pigments extracted from dregs of green and black teas. Scientifica 2021, 2021, 5524468. [Google Scholar] [CrossRef]
- Moldovan, B.; David, L. Influence of different sweeteners on the stability of anthocyanins from cornelian cherry juice. Foods 2020, 9, 1266. [Google Scholar] [CrossRef]
- Ertan, K.; Turkyilmaz, M.; Ozkan, M. Effect of sweeteners on anthocyanin stability and colour properties of sour cherry and strawberry nectars during storage. J. Food Sci. Technol. 2018, 55, 4346–4355. [Google Scholar] [CrossRef]
- Shi, K.; Song, D.; Chen, G.; Pistolozzi, M.; Wu, Z.; Quan, L. Controlling composition and color characteristics of Monascus pigments by pH and nitrogen sources in submerged fermentation. J. Biosci. Bioeng. 2015, 120, 145–154. [Google Scholar] [CrossRef]
- Quitmann, H.; Fan, R.; Czermak, P. Acidic organic compounds in beverage, food, and feed production. Adv. Biochem. Eng. Biotechnol. 2014, 143, 91–141. [Google Scholar] [CrossRef]
- Yusoff, A.; Kumara, N.T.; Lim, A.; Ekanayake, P.; Tennakoon, K.U. Impacts of temperature on the stability of tropical plant pigments as sensitizers for dye sensitized solar cells. J. Biophys. 2014, 2014, 739514. [Google Scholar] [CrossRef]
- Lin, S.M.; Lin, B.H.; Hsieh, W.M.; Ko, H.J.; Liu, C.D.; Chen, L.G.; Chiou, R.Y. Structural identification and bioactivities of red-violet pigments present in Basella alba fruits. J. Agric. Food Chem. 2010, 58, 10364–10372. [Google Scholar] [CrossRef]
- Mohammadzadeh-Aghdash, H.; Akbari, N.; Esazadeh, K.; Ezzati Nazhad Dolatabadi, J. Molecular and technical aspects on the interaction of serum albumin with multifunctional food preservatives. Food Chem. 2019, 293, 491–498. [Google Scholar] [CrossRef]
- Ahmadi, F.; Lee, W.H.; Kwak, W.S. A novel combination of sodium metabisulfite and a chemical mixture based on sodium benzoate, potassium sorbate, and sodium nitrite for aerobic preservation of fruit and vegetable discards and lactic acid fermentation in a total mixed ration for ruminants. Anim. Biosci. 2021, 34, 1479–1490. [Google Scholar] [CrossRef]
- Amirpour, M.; Arman, A.; Yolmeh, A.; Akbari Azam, M.; Moradi-Khatoonabadi, Z. Sodium benzoate and potassium sorbate preservatives in food stuffs in Iran. Food Addit. Contam. Part B Surveill. 2015, 8, 142–148. [Google Scholar] [CrossRef]
- Nishiike, T.; Kondo, S.; Yamamoto, T.; Shigeeda, A.; Yamamoto, Y.; Takamura, H.; Matoba, T. Effects of metal ions and pH on the stability of linoleic acid hydroperoxide in the water phase. Biosci. Biotechnol. Biochem. 1997, 61, 1973–1976. [Google Scholar] [CrossRef]
- Ye, M.Q.; Han, A.J.; Liu, Z.B.; Wang, C. Metal ions doped complex cobalt blue pigment research. Adv. Mater. Res. 2012, 415–417, 194–199. [Google Scholar] [CrossRef]
- Jeyaram, S.; Geethakrishnan, T. Solvent dependent linear and nonlinear optical characteristics of acid blue 3 dye. J. Fluoresc. 2020, 30, 1161–1169. [Google Scholar] [CrossRef]
- Xi, J.; He, L.; Yan, L.G. Continuous extraction of phenolic compounds from pomegranate peel using high voltage electrical discharge. Food Chem. 2017, 230, 354–361. [Google Scholar] [CrossRef]
- Saha, R.N.; Pahan, K. Regulation of inducible nitric oxide synthase gene in glial cells. Antioxid Redox Signal. 2006, 8, 929–947. [Google Scholar] [CrossRef]
- Pacher, P.; Beckman, J.S.; Liaudet, L. Nitric oxide and peroxynitrite in health and disease. Physiol. Rev. 2007, 87, 315–424. [Google Scholar] [CrossRef]
- Sierra, A.; Navascues, J.; Cuadros, M.A.; Calvente, R.; Martin-Oliva, D.; Ferrer-Martin, R.M.; Martin-Estebane, M.; Carrasco, M.C.; Marin-Teva, J.L. Expression of inducible nitric oxide synthase (iNOS) in microglia of the developing quail retina. PLoS ONE 2014, 9, e106048. [Google Scholar] [CrossRef]
- Bandookwala, M.; Sengupta, P. 3-Nitrotyrosine: A versatile oxidative stress biomarker for major neurodegenerative diseases. Int. J. Neurosci. 2020, 130, 1047–1062. [Google Scholar] [CrossRef]
- Darwish, R.S.; Amiridze, N.; Aarabi, B. Nitrotyrosine as an oxidative stress marker: Evidence for involvement in neurologic outcome in human traumatic brain injury. J. Trauma 2007, 63, 439–442. [Google Scholar] [CrossRef]
- Liyanagamage, D.; Martinus, R.D. Role of mitochondrial stress protein HSP60 in diabetes-induced neuroinflammation. Mediat. Inflamm. 2020, 2020, 8073516. [Google Scholar] [CrossRef]
- Anosike, C.A.; Ugwu, J.C.; Ojeli, P.C.; Abugu, S.C. Anti-ulcerogenic effects and anti-oxidative properties of Ceiba pentandra leaves on alloxan-induced diabetic rats. Eur. J. Med. Plants 2014, 4, 458–472. [Google Scholar] [CrossRef]
- Chen, X.; Guo, C.; Kong, J. Oxidative stress in neurodegenerative diseases. Neural Regen Res. 2012, 7, 376–385. [Google Scholar] [CrossRef]
- Arfin, S.; Jha, N.K.; Jha, S.K.; Kesari, K.K.; Ruokolainen, J.; Roychoudhury, S.; Rathi, B.; Kumar, D. Oxidative stress in cancer cell metabolism. Antioxidants 2021, 10, 642. [Google Scholar] [CrossRef]
- Bondia-Pons, I.; Ryan, L.; Martinez, J.A. Oxidative stress and inflammation interactions in human obesity. J. Physiol. Biochem. 2012, 68, 701–711. [Google Scholar] [CrossRef]
- Wang, H.; Wang, G.; Banerjee, N.; Liang, Y.; Du, X.; Boor, P.J.; Hoffman, K.L.; Khan, M.F. Aberrant Gut Microbiome Contributes to Intestinal Oxidative Stress, Barrier Dysfunction, Inflammation and Systemic Autoimmune Responses in MRL/lpr Mice. Front. Immunol. 2021, 12, 651191. [Google Scholar] [CrossRef]
- Maqsoudlou, A.; Assadpour, E.; Mohebodini, H.; Jafari, S.M. The influence of nanodelivery systems on the antioxidant activity of natural bioactive compounds. Crit. Rev. Food Sci. Nutr. 2022, 62, 3208–3231. [Google Scholar] [CrossRef]
- Martincic, R.; Kuzmanovski, I.; Wagner, A.; Novic, M. Development of models for prediction of the antioxidant activity of derivatives of natural compounds. Anal. Chim. Acta 2015, 868, 23–35. [Google Scholar] [CrossRef] [PubMed]
- White, P.A.; Oliveira, R.C.; Oliveira, A.P.; Serafini, M.R.; Araujo, A.A.; Gelain, D.P.; Moreira, J.C.; Almeida, J.R.; Quintans, J.S.; Quintans-Junior, L.J.; et al. Antioxidant activity and mechanisms of action of natural compounds isolated from lichens: A systematic review. Molecules 2014, 19, 14496–14527. [Google Scholar] [CrossRef] [PubMed]
- Orsavova, J.; Sytarova, I.; Mlcek, J.; Misurcova, L. Phenolic compounds, vitamins C and E and antioxidant activity of edible honeysuckle berries (Lonicera caerulea L. var. kamtschatica Pojark) in relation to their origin. Antioxidants 2022, 11, 433. [Google Scholar] [CrossRef] [PubMed]
- Raudone, L.; Liaudanskas, M.; Vilkickyte, G.; Kviklys, D.; Zvikas, V.; Viskelis, J.; Viskelis, P. Phenolic Profiles, Antioxidant Activity and Phenotypic Characterization of Lonicera caerulea L. Berries, Cultivated in Lithuania. Antioxidants 2021, 10, 115. [Google Scholar] [CrossRef] [PubMed]
Publisher’s Note: MDPI stays neutral with regard to jurisdictional claims in published maps and institutional affiliations. |
© 2022 by the authors. Licensee MDPI, Basel, Switzerland. This article is an open access article distributed under the terms and conditions of the Creative Commons Attribution (CC BY) license (https://creativecommons.org/licenses/by/4.0/).