
Effect-Directed Profiling of Monofloral Honeys from Ethiopia by High-Performance Thin-Layer Chromatography and High-Resolution Mass Spectrometry


Abstract
:1. Introduction
2. Results and Discussion
2.1. Development of the Physico-Chemical Profiling
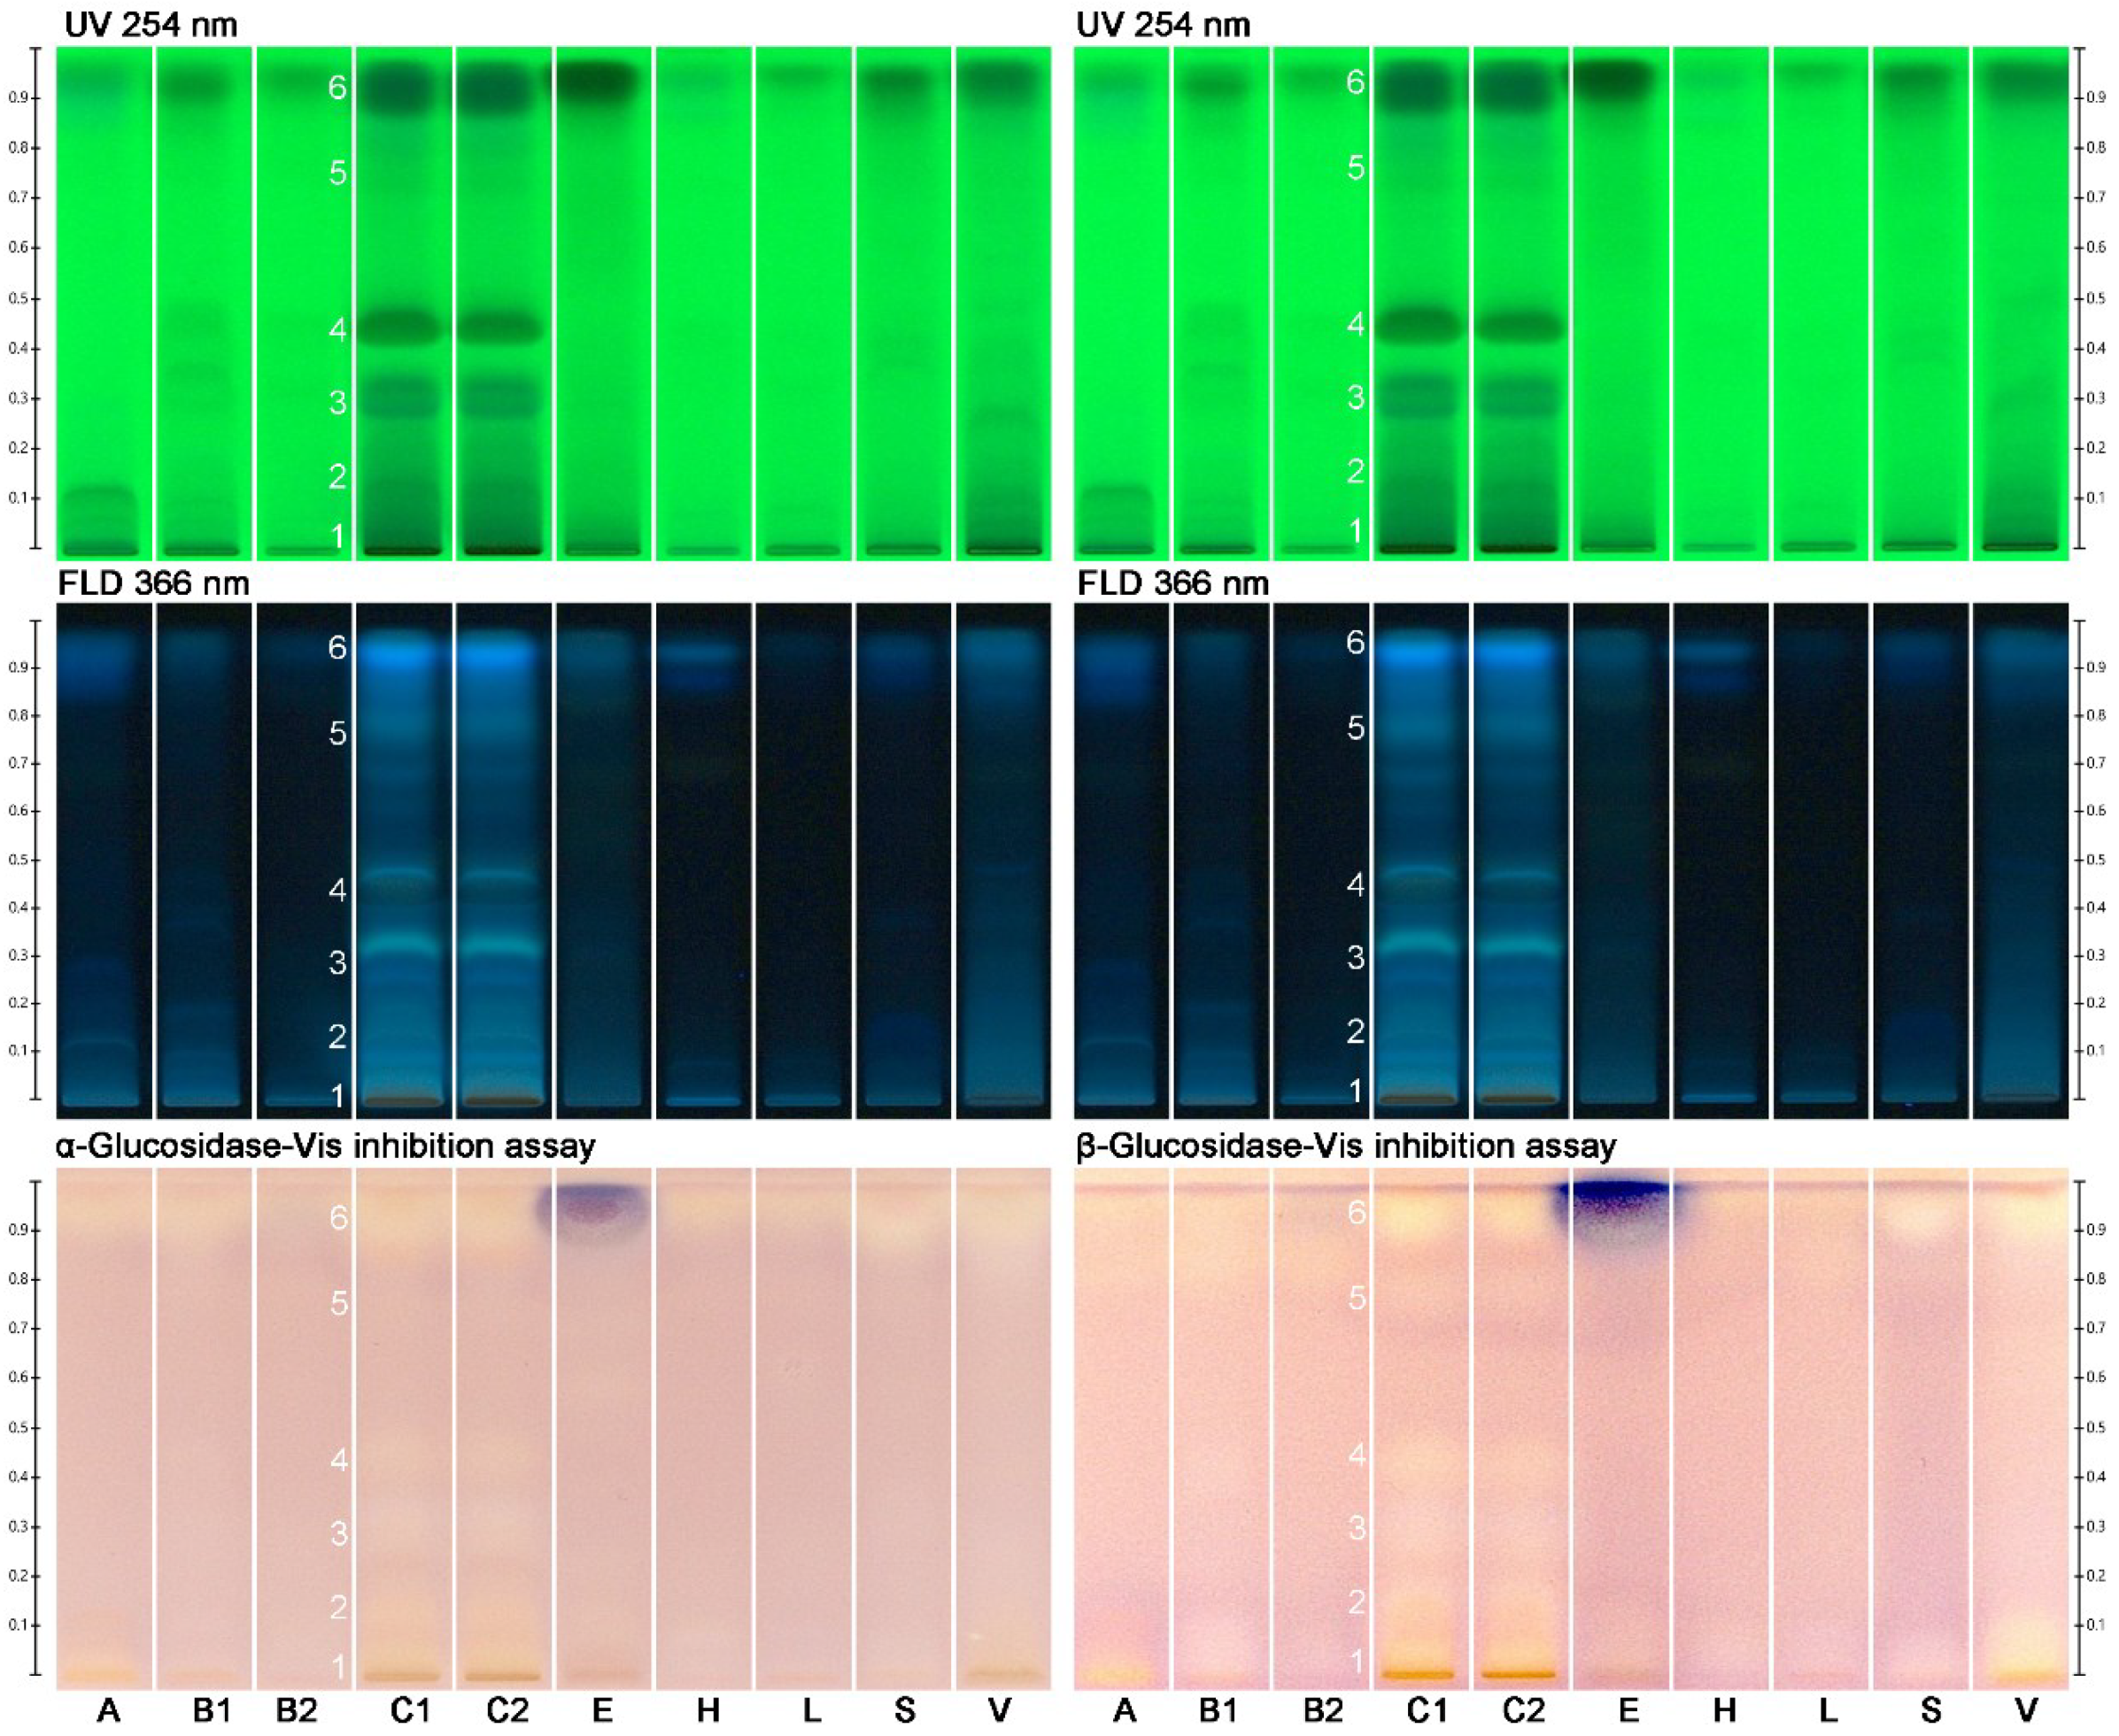
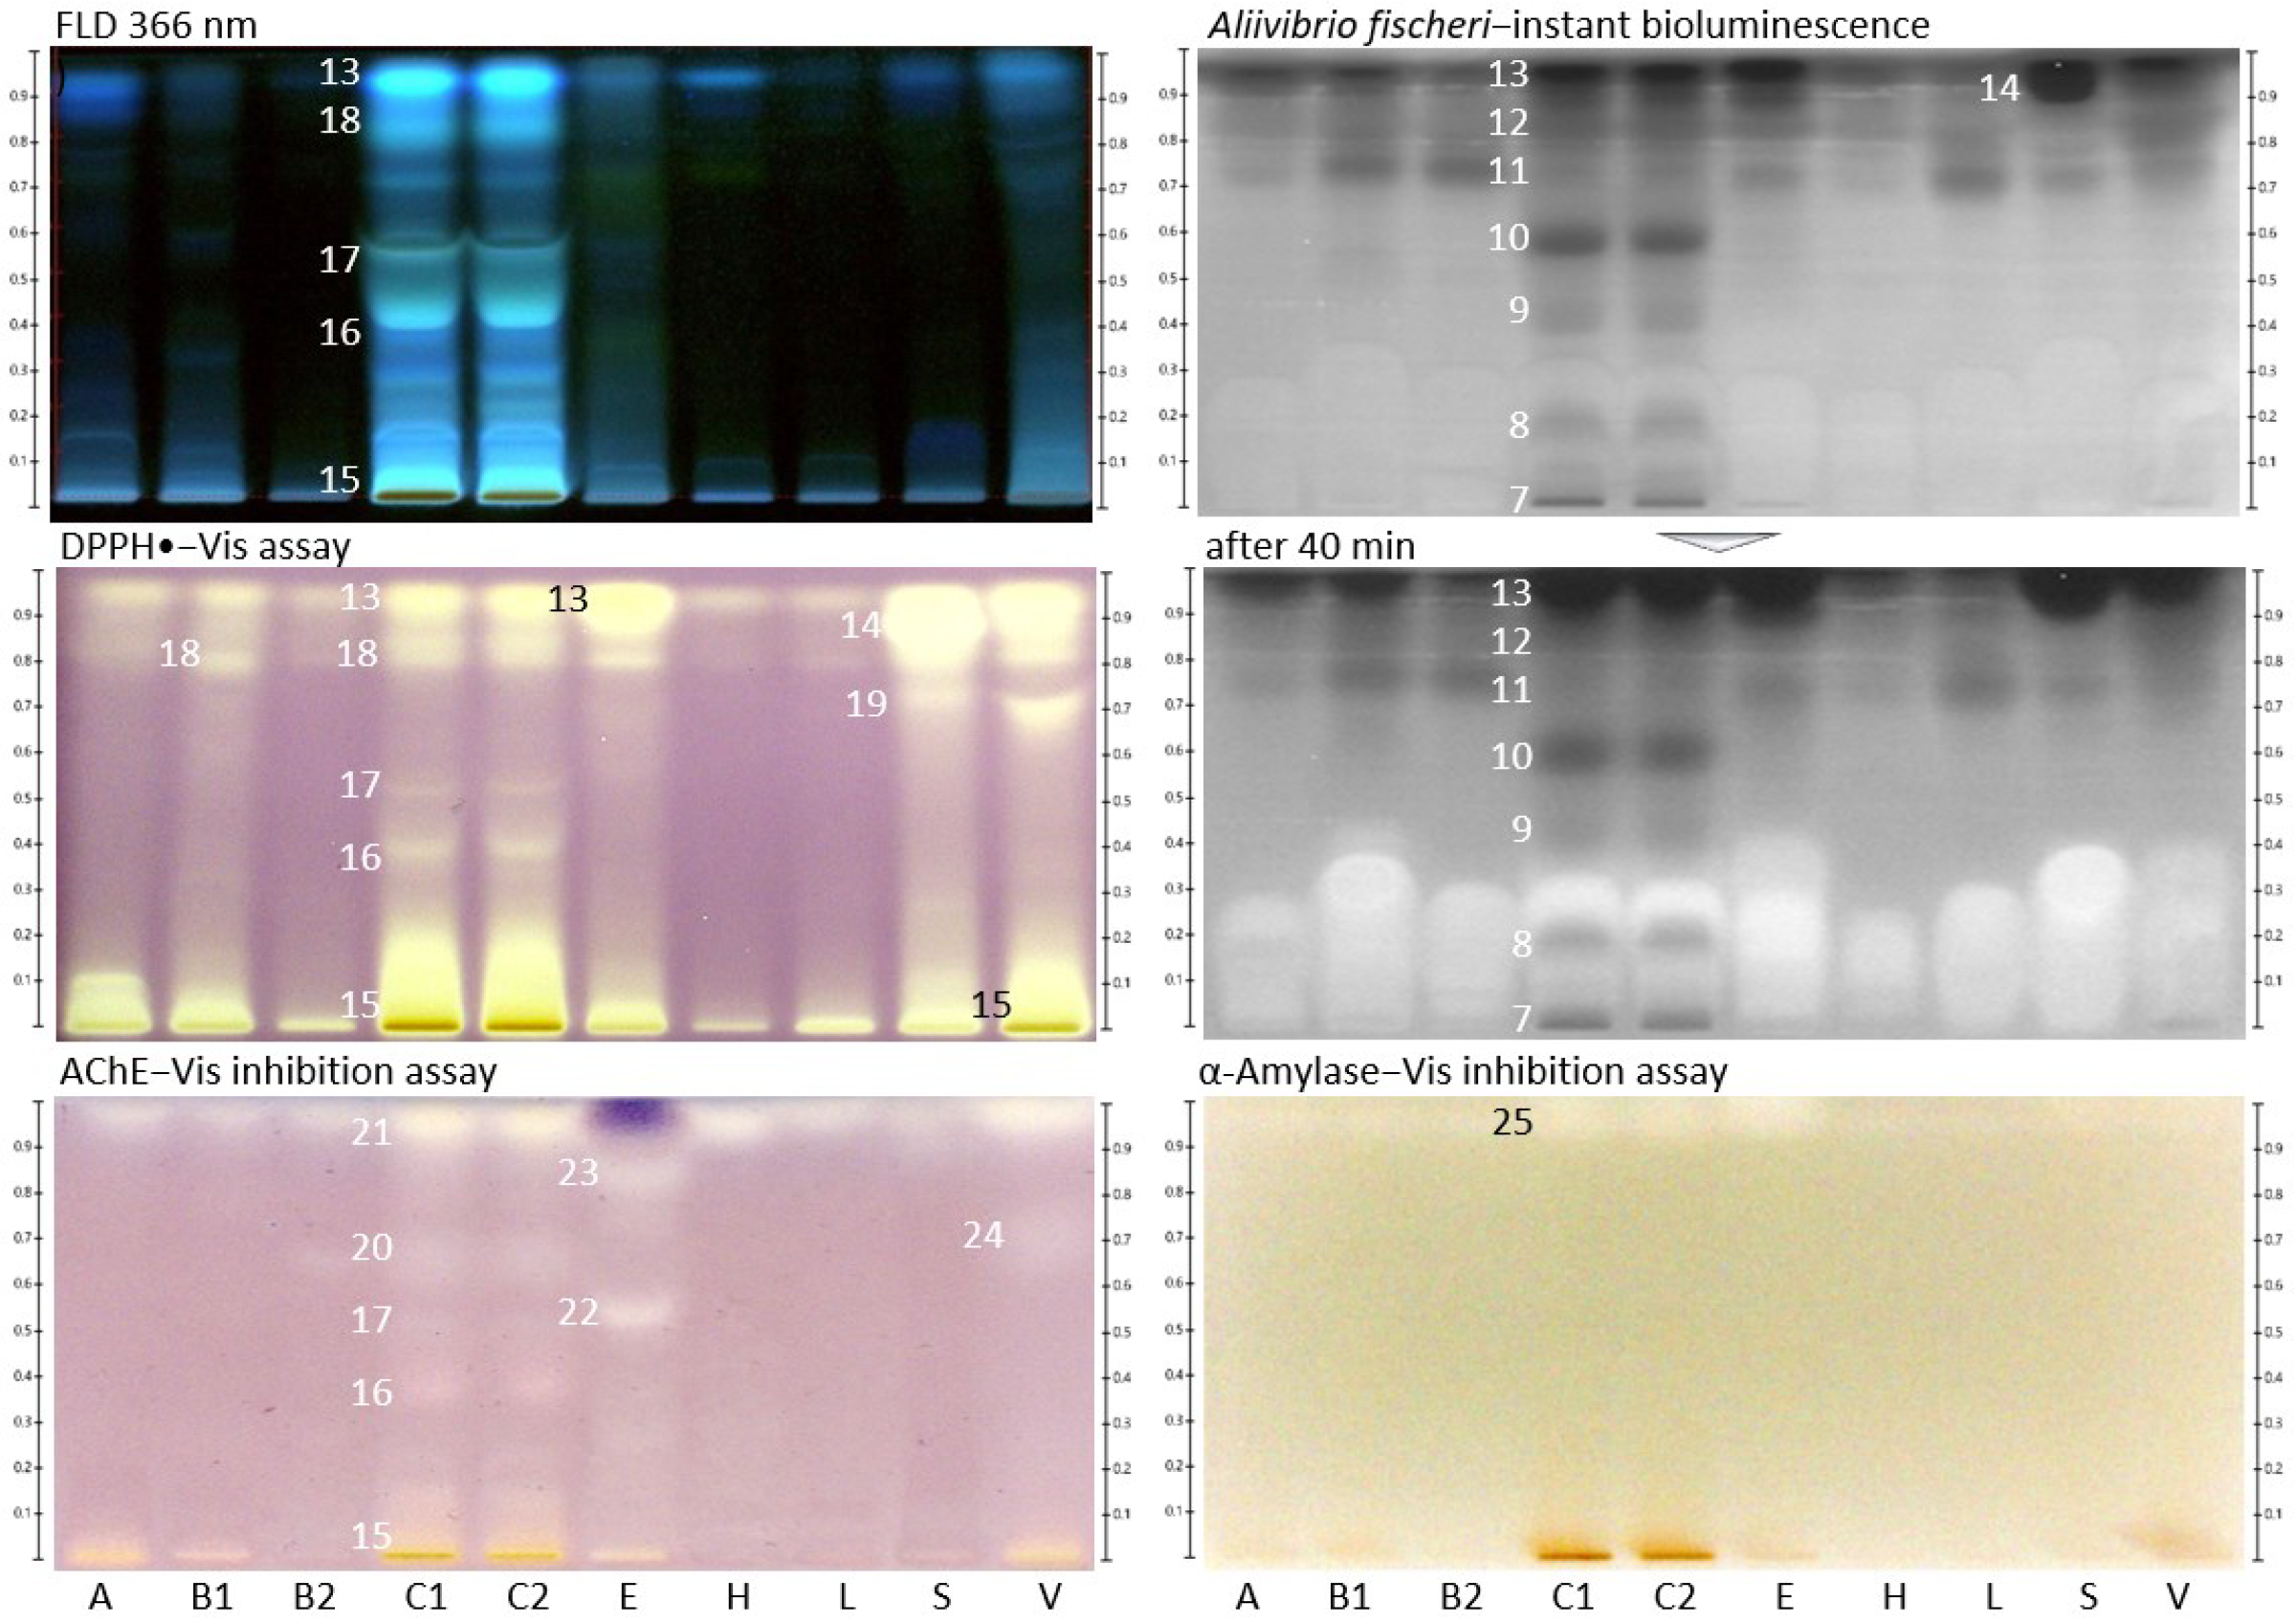
2.2. Effect-Directed Profiling of Nine Different Types of Monofloral Honey
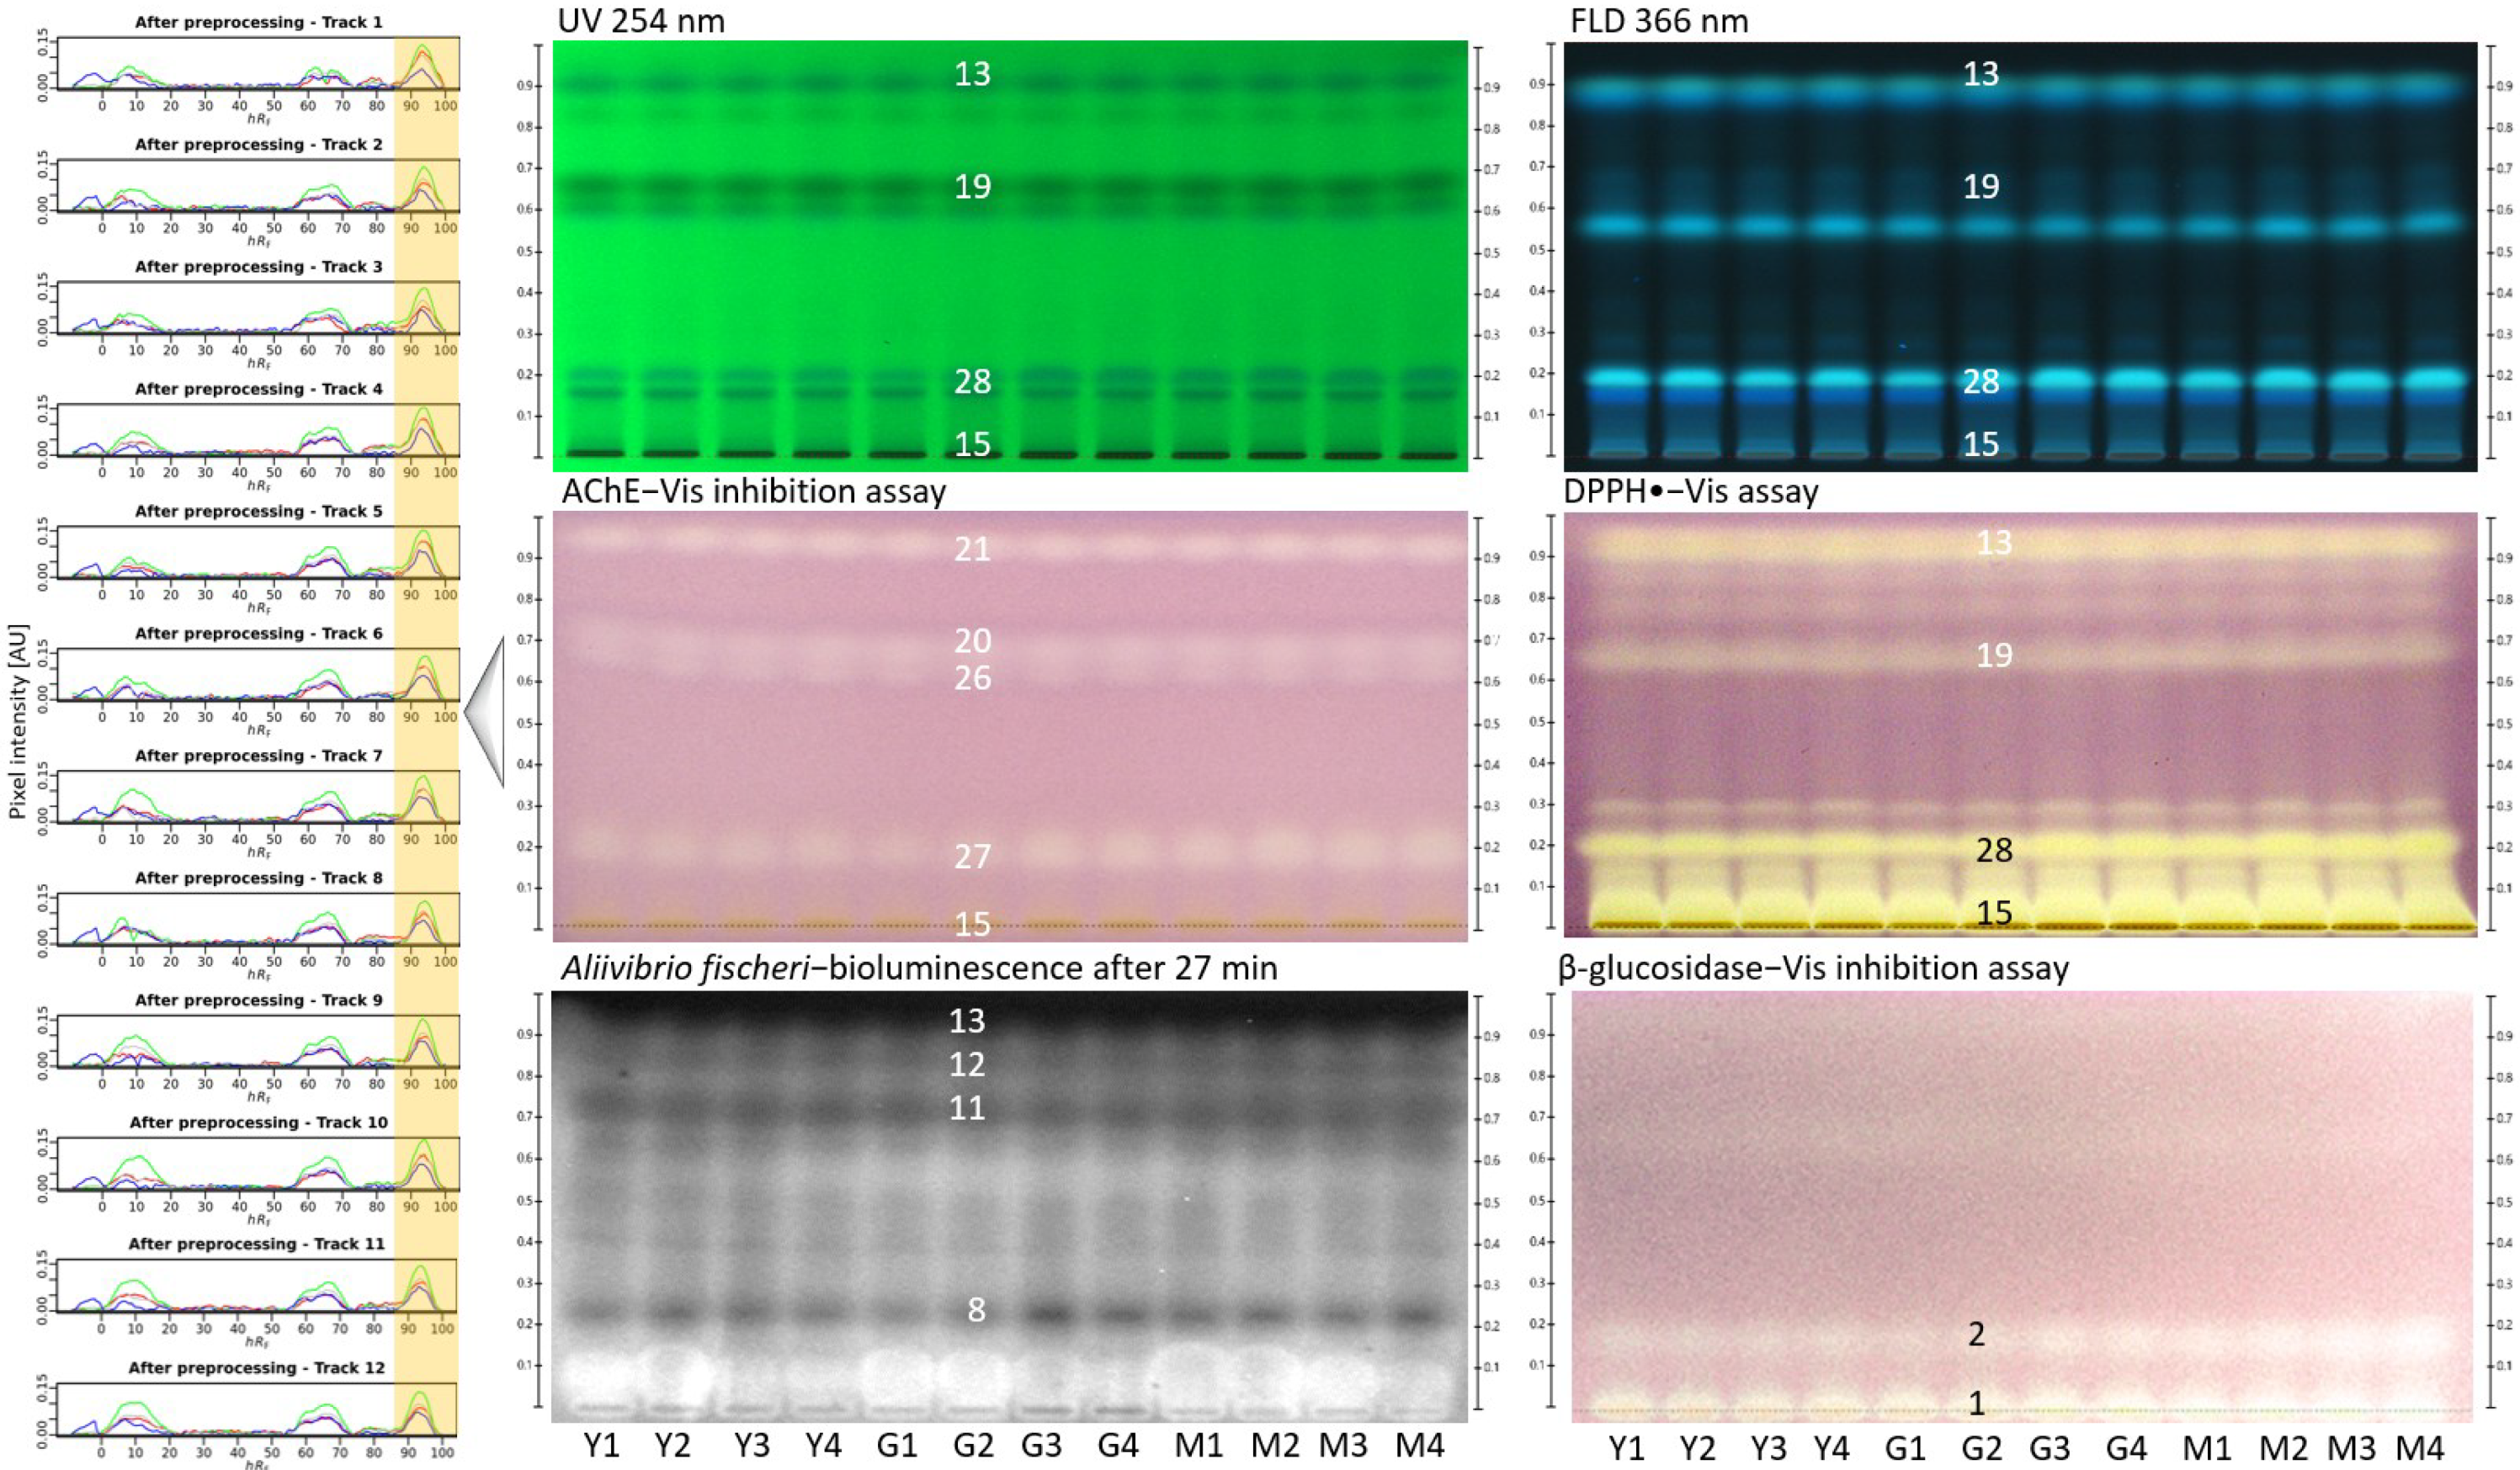
2.3. Effect-Directed Profiling within the Same Type of Monofloral Honey
2.4. Bioactivities Found in Monofloral Honeys
2.5. Optional On-Surface Extraction and Separation on the Same Plate
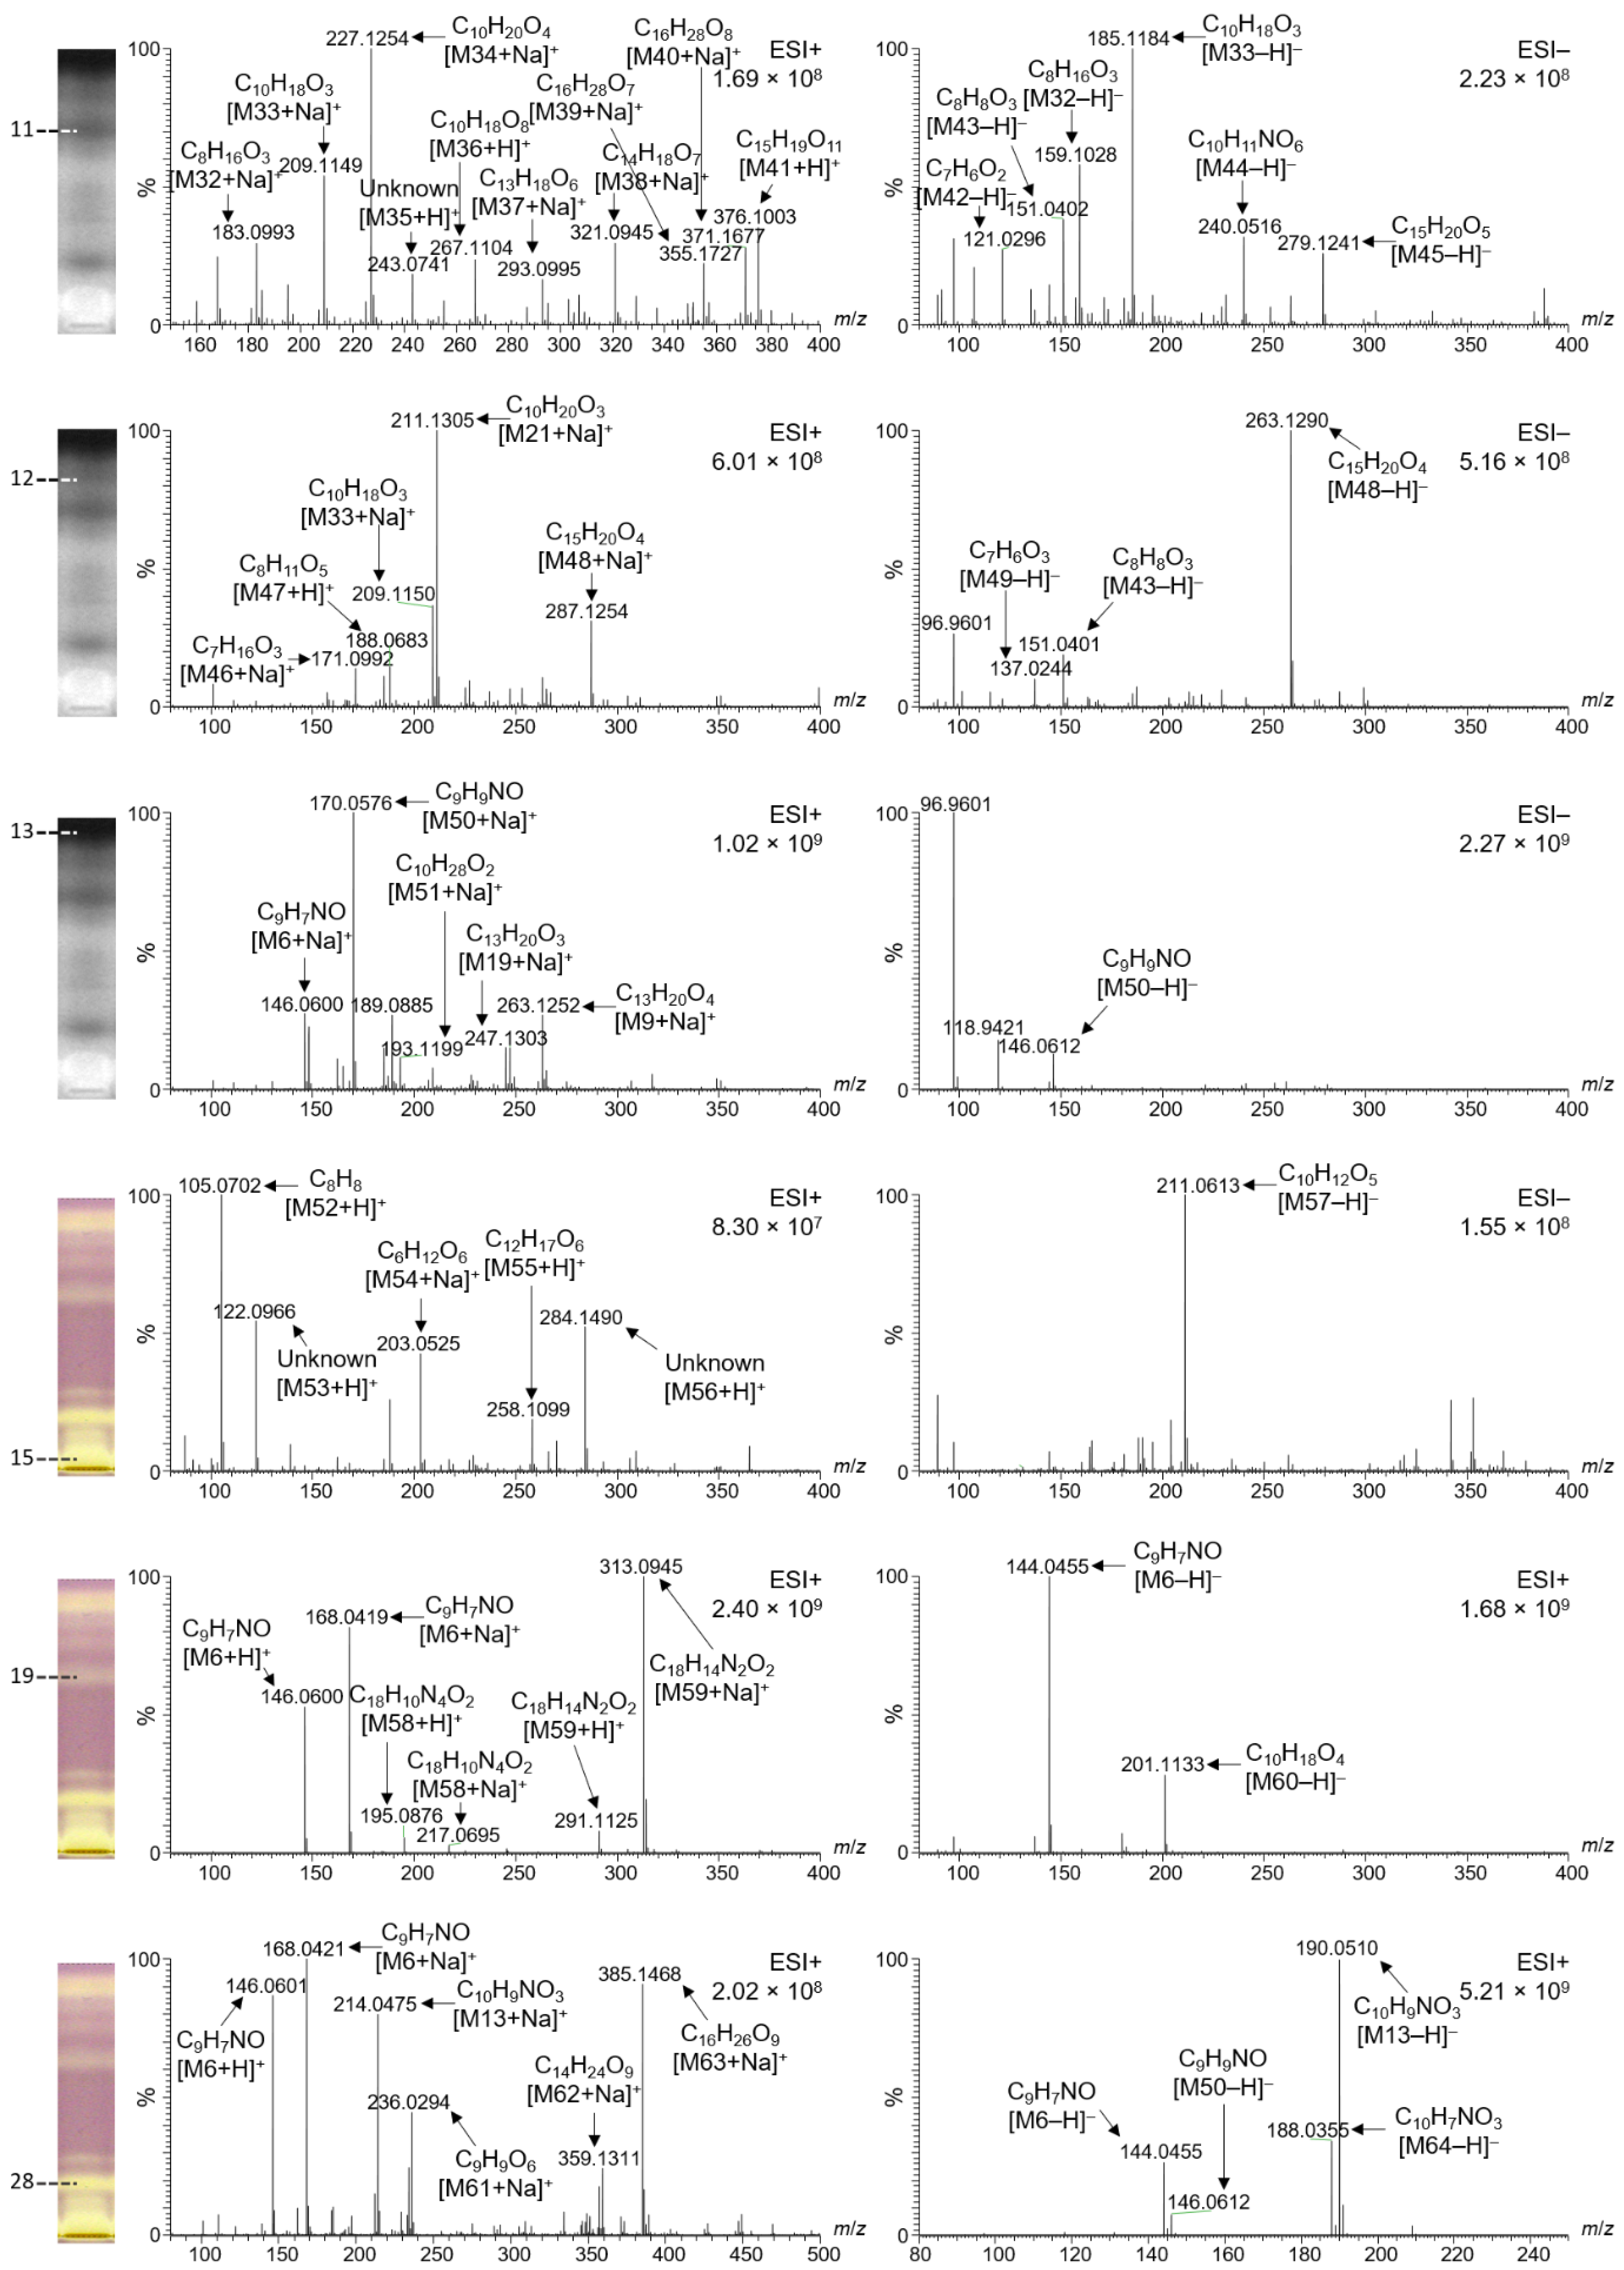
2.6. Characterization of Selected Bioactive Compounds by HPTLC–HESI–HRMS
2.7. Limitation of the Developed Effect-Directed Profiling Method
3. Materials and Methods
3.1. Chemicals and Reagents
3.2. Solid-Phase Extraction
3.3. HPTLC–UV/Vis/FLD Method
3.4. Optional On-Surface Extraction and Separation on the Same Plate
3.5. Effect-Directed Profiling
3.5.1. α- and β-Glucosidase Inhibition Assays
3.5.2. Radical Scavenging Assay
3.5.3. Aliivibrio fischeri Bioassay
3.5.4. AChE Inhibition Assay
3.5.5. α-Amylase Inhibition Assay
3.6. HPTLC–HESI–HRMS
4. Conclusions
Author Contributions
Funding
Institutional Review Board Statement
Informed Consent Statement
Data Availability Statement
Acknowledgments
Conflicts of Interest
Sample Availability
References
- Bogdanov, S. Honey Composition, Chapter 5. In The Honey Book; Bogdanov, S., Ed.; 2016; Available online: www.bee-hexagon.net (accessed on 31 March 2022).
- Oryan, A.; Alemzadeh, E.; Moshiri, A. Biological properties and therapeutic activities of honey in wound healing: A narrative review and meta-analysis. J. Tissue Viability 2016, 25, 98–118. [Google Scholar] [CrossRef]
- Iftikhar, A.; Nausheen, R.; Mukhtar, I.; Iqbal, R.K.; Raza, A.; Yasin, A.; Anwar, H. The regenerative potential of honey: A comprehensive literature review. J. Apic. Res. 2022, 1–16. [Google Scholar] [CrossRef]
- Belay, A.; Solomon, W.K.; Bultossa, G.; Adgaba, N.; Melaku, S. Botanical origin, colour, granulation, and sensory properties of the Harenna forest honey, Bale, Ethiopia. Food Chem. 2015, 167, 213–219. [Google Scholar] [CrossRef]
- Belay, A.; Haki, G.D.; Birringer, M.; Borck, H.; Addi, A.; Baye, K.; Melaku, S. Rheology and botanical origin of Ethiopian monofloral honey. J. Food Sci. Technol. 2017, 75, 393–401. [Google Scholar] [CrossRef]
- Fikru, S. Review of Honey Bee and Honey Production in Ethiopia. J. Anim. Sci. Adv. 2015, 5, 1413. [Google Scholar]
- Belay, A.; Haki, G.D.; Birringer, M.; Borck, H.; Lee, Y.-C.; Cho, C.-W.; Kim, K.-T.; Bayissa, B.; Baye, K.; Melaku, S. Sugar profile and physicochemical properties of Ethiopian monofloral honey. Int. J. Food Prop. 2017, 20, 2855–2866. [Google Scholar] [CrossRef]
- Belay, A.; Haki, G.D.; Birringer, M.; Borck, H.; Lee, Y.-C.; Kim, K.-T.; Baye, K.; Melaku, S. Enzyme activity; amino acid profiles and hydroxymethylfurfural content in Ethiopian monofloral honey. J. Food Sci. Technol. 2017, 54, 2769–2778. [Google Scholar] [CrossRef]
- Belay, A.; Solomon, W.K.; Bultossa, G.; Adgaba, N.; Melaku, S. Physicochemical properties of the Harenna forest honey, Bale, Ethiopia. Food Chem. 2013, 141, 3386–3392. [Google Scholar] [CrossRef]
- Hailu, D.; Belay, A.; O’Reilly, R.J. Melissopalynology and antioxidant properties used to differentiate Schefflera abyssinica and polyfloral honey. PLoS ONE 2020, 15, e0240868. [Google Scholar] [CrossRef]
- Joint Food and Agriculture Organization of the United Nations/World Health Organization (FAO/WHO) Codex Alimentarius Commission. Codex Alimentarius. Rome: FAO/WHO. 2022. Available online: www.fao.org/fao-who-codexalimentarius (accessed on 31 March 2022).
- Machado, A.M.; Miguel, M.G.; Vilas-Boas, M.; Figueiredo, A.C. Honey Volatiles as a Fingerprint for Botanical Origin − A Review on their Occurrence on Monofloral Honeys. Molecules 2020, 25, 374. [Google Scholar] [CrossRef] [Green Version]
- Bergamo, G.; Seraglio, S.K.T.; Gonzaga, L.V. Use of visible spectrophotometric fingerprint and chemometric approaches for the differentiation of Mimosa scabrella Bentham honeydew honey. J. Food Sci. Technol. 2020, 57, 3966–3972. [Google Scholar] [CrossRef]
- Cavazza, A.; Corradini, C.; Musci, M.; Salvadeo, P. High-performance liquid chromatographic phenolic compound fingerprint for authenticity assessment of honey. J. Sci. Food Agric. 2013, 93, 1169–1175. [Google Scholar] [CrossRef]
- Martos, I.; Ferreres, F.; Tomás-Barberán, F.A. Identification of Flavonoid Markers for the Botanical Origin of Eucalyptus Honey. J. Agric. Food Chem. 2000, 48, 1498–1502. [Google Scholar] [CrossRef]
- Karabagias, I.K.; Maia, M.; Karabagias, V.K.; Gatzias, I.; Badeka, A.V. Characterization of Eucalyptus, Chestnut and Heather Honeys from Portugal Using Multi-Parameter Analysis and Chemo-Calculus. Foods 2018, 7, 194. [Google Scholar] [CrossRef] [Green Version]
- Meda, A.; Lamien, C.E.; Romito, M.; Millogo, J.; Nacoulma, O.G. Determination of the total phenolic, flavonoid and proline contents in Burkina Fasan honey, as well as their radical scavenging activity. Food Chem. 2005, 91, 571–577. [Google Scholar] [CrossRef]
- Tsiapara, A.V.; Jaakkola, M.; Chinou, I.; Graikou, K.; Tolonen, T.; Virtanen, V.; Moutsatsou, P. Bioactivity of Greek honey extracts on breast cancer (MCF-7), prostate cancer (PC-3) and endometrial cancer (Ishikawa) cells: Profile analysis of extracts. Food Chem. 2009, 116, 702–708. [Google Scholar] [CrossRef]
- Noor, N.; Sarfraz, R.A.; Ali, S.; Shahid, M. Antitumour and antioxidant potential of some selected Pakistani honeys. Food Chem. 2014, 143, 362–366. [Google Scholar] [CrossRef]
- da Silva, B.; Caon, T.; Mohr, E.T.B.; Biluca, F.C.; Gonzaga, L.V.; Fett, R.; Costa, A.C.O. Phenolic profile and in vitro anti-inflammatory activity of Mimosa scabrella Bentham honeydew honey in RAW 264.7 murine macrophages. J. Food Biochem. 2022, 46, e14076. [Google Scholar] [CrossRef]
- Krüger, S.; Bergin, A.; Morlock, G.E. Effect-directed analysis of ginger (Zingiber officinale) and its food products, and quantification of bioactive compounds via high-performance thin-layer chromatography and mass spectrometry. Food Chem. 2018, 243, 258–268. [Google Scholar] [CrossRef]
- Schreiner, T.; Sauter, D.; Friz, M.; Heil, J.; Morlock, G.E. Is our Natural Food our Homeostasis? Array of A Thousand Effect-Directed Profiles of 68 Herbs and Spices. Front. Pharmacol. 2021, 12, 755941. [Google Scholar] [CrossRef]
- Jesionek, W.; Majer-Dziedzic, B.; Horváth, G.; Móricz, Á.M.; Choma, I.M. Screening of antibacterial compounds in Thymus vulgaris L. tincture using thin-layer chromatography—direct bioautography and liquid chromatography—tandem mass spectrometry techniques. J. Planar Chromat. Mod. TLC 2017, 30, 131–135. [Google Scholar] [CrossRef]
- Chandana, N.G.A.S.S.; Morlock, G.E. Eight different bioactivity profiles of 40 cinnamons to discover multipotent compounds by multi-imaging planar chromatography hyphenated with effect-directed analysis and high-resolution mass spectrometry. Food Chem. 2021, 357, 129135. [Google Scholar] [CrossRef] [PubMed]
- Rhee, I.K.; van Rijn, R.M.; Verpoorte, R. Qualitative determination of false-positive effects in the acetylcholinesterase assay using thin layer chromatography. Phytochem. Anal. 2003, 14, 127–131. [Google Scholar] [CrossRef] [PubMed]
- Rossi, D.; Guerrini, A.; Maietti, S.; Bruni, R.; Paganetto, G.; Poli, F.; Scalvenzi, L.; Radice, M.; Saro, K.; Sacchetti, G. Chemical fingerprinting and bioactivity of Amazonian Ecuador Croton lechleri Müll. Arg. (Euphorbiaceae) stem bark essential oil: A new functional food ingredient? Food Chem. 2011, 126, 837–848. [Google Scholar] [CrossRef]
- Nöller, L.; Borck, H. Comparison of Methods for Determining Antioxidant Capacity (AOC) Using the Example of Honey. Poster presentation, Proceedings of the German Nutrition Society 56. Wissenschaftlicher Kongress Volume 25. 2019. Available online: https://www.dge-medienservice.de/proceedings-of-the-german-nutrition-society-volume-25-2019-abstractband-zum-56-wissenschaftlichen-kongress.html (accessed on 25 May 2022).
- Fichou, D.; Morlock, G.E. quanTLC, an online open-source solution for videodensitometric quantification. J. Chromatogr. A 2018, 1560, 78–81. [Google Scholar] [CrossRef]
- Mehl, A.; Schmidt, L.; Schmidt, L.; Morlock, G.E. High-throughput planar solid-phase extraction coupled to orbitrap high-resolution mass spectrometry via the autoTLC-MS interface for screening of 66 multi-class antibiotic residues in food of animal origin. Food Chem. 2021, 351, 129211. [Google Scholar] [CrossRef]
- Morlock, G.; Prabha, S. Analysis and stability of sucralose in milk-based confection by a simple planar chromatographic method. J. Agric. Food Chem. 2007, 55, 7217–7223. [Google Scholar] [CrossRef] [PubMed]
- Leyva-Jimenez, F.J.; Lozano-Sanchez, J.; Borras-Linares, I.; Cadiz-Gurrea, M.L.; Mahmoodi-Khaledi, E. Potential antimicrobial activity of honey phenolic compounds against Gram positive and Gram negative bacteria. LWT Food Sci. Technol. 2018, 101, 236–245. [Google Scholar] [CrossRef]
- Schievano, E.; Morelato, E.; Facchin, C.; Mammi, S. Characterization of markers of botanical origin and other compounds extracted from unifloral honeys. J. Agric. Food Chem. 2013, 61, 1747–1755. [Google Scholar] [CrossRef]
- Seraglio, S.K.T.; Valese, A.C.; Daguer, H.; Bergamo, G.; Azevedo, M.S.; Gonzaga, L.V.; Fett, R.; Costa, A.C.O. Development and validation of a LC-ESI-MS/MS method for the determinaton of phenolic compounds in honeydew honeys with the diluted-and-shoot-approach. Food Res. Int. 2016, 87, 60–67. [Google Scholar] [CrossRef]
- Ciulu, M.; Spano, N.; Pilo, M.I.; Sanna, G. Recent advances in the analysis of phenolic compounds in unifloral honeys. Molecules 2016, 21, 451. [Google Scholar] [CrossRef] [PubMed]
- Lachmann, J.; Hejtmánková, A.; Sýkora, J.; Karban, J.; Orsák, M.; Rygerová, B. Contents of major phenolic and flavonoid antioxidants in selected Czech honey. Czech J. Food Sci. 2010, 28, 412–426. [Google Scholar] [CrossRef] [Green Version]
- Anand, S.; Deighton, M.; Livanos, G.; Morrison, P.D.; Pang, E.C.K.; Mantri, N. Antimicrobial activity of Agastache honey and characterization of its bioactive compounds in comparison with important commercial honeys. Front. Microbiol. 2019, 10, 263. [Google Scholar] [CrossRef]
- Klingelhöfer, I.; Morlock, G.E. Bioprofiling of surface/wastewater and bioquantitation of discovered endocrine-active compounds by streamlined direct bioautography. Anal. Chem. 2015, 87, 11098–11104. [Google Scholar] [CrossRef] [PubMed]
- Morlock, G.E.; Heil, J. HI-HPTLC-UV/Vis/FLD-HESI-HRMS and bioprofiling of steviol glycosides, steviol, and isosteviol in Stevia leaves and foods. Anal. Bioanal. Chem. 2020, 412, 6431–6448. [Google Scholar] [CrossRef] [Green Version]
- Morlock, G.E.; Heil, J.; Inarejos-Garcia, A.M.; Maeder, J. Effect-directed profiling of powdered tea extracts for catechins, theaflavins, flavonols and caffeine. Antioxidants 2021, 10, 117. [Google Scholar] [CrossRef]
- Subramanian, R.; Asmawi, M.Z.; Sadikun, A. In vitro alpha-glucosidase and alpha-amylase enzyme inhibitory effects of Andrographis paniculata extract and andrographolide. Acta Biochim. Pol. 2008, 55, 391–398. [Google Scholar] [CrossRef] [Green Version]
- Salazar, M.O.; Furlan, R.L.E. A rapid TLC autographic method for the detection of glucosidase inhibitors. Phytochem. Anal. 2007, 18, 209–212. [Google Scholar] [CrossRef]
- Teh, S.S.; Morlock, G. Analysis of Bioactive Components of Oilseed Cakes by High-Performance Thin-Layer Chromatography-(Bio)assay Combined with Mass Spectrometry. Chromatography 2015, 2, 125–140. [Google Scholar] [CrossRef]
- DIN EN ISO 11348-1; Water Quality—Determination of the Inhibitory Effect of Water Samples on the Light Emission of Vibrio fischeri (Luminescent bacteria test)—Part 1: Method Using Freshly Prepared Bacteria. Beuth Verlag: Berlin, Germany, 2009.
- Klöppel, A.; Grasse, W.; Brümmer, F.; Morlock, G. HPTLC coupled with bioluminescence and mass spectrometry for bioactivity-based analysis of secondary metabolites in marine sponges. J. Planar Chromat. Mod. TLC 2008, 21, 431–436. [Google Scholar] [CrossRef]
- Hage, S.; Morlock, G.E. Bioprofiling of Salicaceae bud extracts through high-performance thin-layer chromatography hyphenated to biochemical, microbiological and chemical detections. J. Chromatogr. A 2017, 1490, 201–211. [Google Scholar] [CrossRef] [PubMed]
- Móricz, Á.M.; Ott, P.G.; Morlock, G.E. Discovered acetylcholinesterase inhibition and antibacterial activity of polyacetylenes in tansy root extract via effect-directed chromatographic fingerprints. J. Chromatogr. A 2018, 1543, 73–80. [Google Scholar] [CrossRef] [PubMed]
- Morlock, G.E. Background mass signals in TLC/HPTLC–ESI-MS and practical advices for use of the TLC–MS interface. J. Liq. Chromatogr. Relat. Technol. 2014, 37, 2892–2914. [Google Scholar] [CrossRef]
- Mehl, A.; Schwack, W.; Morlock, G.E. On-surface autosampling for liquid chromatography−mass spectrometry. J. Chromatogr. A 2021, 1651, 462334. [Google Scholar] [CrossRef]


| Honey Color | ID | Floral Honey Source | Pollen Count (Out of 500) | Pollen Dominancy (%) | Harvested in 2018 | Sampling Site |
|---|---|---|---|---|---|---|
 | A | Acacia spp. | 310 | 62 | September, October | Zikwala |
 | B1 | Becium grandiflorum | 370 | 74 | August, September | Maychew |
 | B2 | Wukro | ||||
 | C1/2 | Croton macrostachyus | 300 | 60 | June, July | Dello Mena |
 | E | Eucalyptus globulus | 430 | 86 | April, May, June | Addis Ababa, Yeka |
 | H | Hypoestes spp. | 315 | 63 | September, October | Wukro |
 | L | Leucas abyssinica | 430 | 86 | September, October | Maychew |
 | S | Schefflera abyssinica | 450 | 90 | April, May | Sheka, Bonga |
 | V | Vernonia amygdalina | 390 | 78 | January, February | Becho, Anfillo, Gida-Ayana |
 | Y1–4 | Coffeaarabica | 75 | February, March | Yayu | |
 | G1–4 | 375 | Goma | |||
 | M1–4 | Mana |
| Zone | Radical Scavenger | Glucosidase Inhibitor | AChE Inhibitor | Amylase Inhibitor * | Antibacterial |
|---|---|---|---|---|---|
| 1 | A C V YGM | ||||
| 2 | C YGM | ||||
| 3 | C | ||||
| 4 | C | ||||
| 5 | C | ||||
| 6 | A B C S V | ||||
| 7 | C | ||||
| 8 | C YGM | ||||
| 9 | C | ||||
| 10 | C | ||||
| 11 | B L YGM | ||||
| 12 | C V YGM | ||||
| 13 | A B C E V YGM | C E V YGM | |||
| 14 | S | S | |||
| 15 | A B C E S V YGM | C YGM | |||
| 16 | C | C | |||
| 17 | C | C | |||
| 18 | B C E S V | ||||
| 19 | S V YGM | ||||
| 20 | C YGM | ||||
| 21 | C YGM | ||||
| 22 | E | ||||
| 23 | E | ||||
| 24 | V | ||||
| 25 | A B C E S V | ||||
| 26 | YGM | ||||
| 27 | YGM | ||||
| 28 | YGM |
| Focusing of the Start Area | Ratio (V/V) | Chromatogram at UV/Vis/FLD |
|---|---|---|
| Methanol | 1 |  |
| Acetonitrile | 1 |  |
| 2-Propanol | 1 |  |
| Acetonitrile–methanol–ammonium hydroxide | 5:3:2 |  |
| Acetonitrile–ethanol–ammonium hydroxide | 8:1:1 |  |
| Acetonitrile–ethanol–ammonium hydroxide | 1:3:1 |  |
| Acetonitrile–water | 9:1 |  |
| Ethanol–ammonium hydroxide | 9:1 |  |
| Methanol–ammonium hydroxide | 10:1 |  |
| Ethanol–formic acid–water | 7:1:2 |  |
| Mobile Phase System for Separation | ||
| Ethyl acetate–ethanol–water | 3.8:1:0.2 |  |
| Toluene–ethyl acetate–ethanol | 2.4:1.8:0.8 |  |
| Petroleum ether–ethyl acetate–acetone | 3.8:0.6:0.7 |  |
| Ethyl acetate–ethanol–ammonium hydroxide | 4.2:0.6:0.2 |  |
| Toluene–ethyl acetate–formic acid–water | 2:6:1:0.6 |  |
| Toluene–ethyl acetate–formic acid–water | 1.6:7:0.8:0.6 |  |
| On-Surface Extraction and Separation | ||
| 1. Focusing twice with acetonitrile–ethanol–ammonia to 3 cm, then plate cut at 1.5 cm | 8:1:2 |  |
| 2. Separation with toluene–ethyl acetate–formic acid–water | 1.6:7:0.8:0.6 | |
| Zone | Mass Signal m/z | Adduct | Molecular Formula (Neutral Molecule) | Δ ppm | Tentative Assignment According to the Literature | Lit. |
|---|---|---|---|---|---|---|
| 18 (B1), Figure 4 | 389.1780 | [M1 + Na]+ | C16H30O9 | 0.50 | ||
| 547.1999 | [M2 + Na]+ | C22H36O14 | −0.29 | |||
| 523.2045 | [M2 − H]− | −3.26 | ||||
| 209.0823 | [M3 − H]− | C11H14O4 | −2.61 | |||
| 342.1201 | [M4 − H]− | Unknown | - | |||
| 621.1722 | [M5 − H]− | C23H42O13S3 | −0.76 | |||
| 13 (C1), Figure 4 | 146.0601 | [M6 + H]+ | C9H7NO | −0.62 | 2-Hydroxyquinoline in various Iranian honeys | [31] |
| 144.0456 | −0.71 | |||||
| 199.0578 | [M7 + Na]+ | C7H12O5 | −0.47 | |||
| 213.0734 | [M8 + Na]+ | C8H14O5 | −0.16 | |||
| 263.1254 | [M9 + Na]+ | C13H20O4 | −0.07 | |||
| 289.1538 | [M10 + Na]+ | Unknown | - | |||
| 171.0566 | [M11 − H] − | C10H8N2O | −1.01 | |||
| 179.0351 | [M12 − H] − | C9H7O4 | −0.87 | Caffeic acid in various Iranian honeys | [31] | |
| 190.0511 | [M13 − H] − | C10H9NO3 | −0.85 | |||
| 199.0515 | [M14 − H] − | C11H8N2O2 | −0.89 | |||
| 13 (E), Figure 4 | 209.0821 | [M3 − H] − | C11H14O4 | −1.27 | ||
| 289.1534 | [M10 + Na] + | Unknown | - | |||
| 187.0728 | [M15 + H] + | C10H12O2 | 0.91 | |||
| 207.1376 | [M16 + Na] + | C13H19O2 | 1.48 | |||
| 237.1095 | [M17 + Na] + | C11H18O4 | 1.19 | |||
| 223.0938 | [M18 + Na] + | C10H16O4 | 1.13 | Succinic acid monocyclohexyl ester in various Iranian honeys | [31] | |
| (E)-2-Decenedioic acid in various Italian honeys | [32] | |||||
| 247.1301 | [M19 + Na] + | C13H20O3 | 1.48 | |||
| 497.2140 | [M20 + Na] + | C26H34O8 | 1.15 | |||
| 14 (S), Figure 4 | 211.1303 | [M21 + Na] + | C10H20O3 | −1.05 | Hydroxy decenoic acid in various Iranian honeys | [31] |
| 399.2714 | [2M21 + Na] + | 0.88 | ||||
| 187.1341 | [M21 − H] − | 0.75 | ||||
| 197.0821 | [M22 − H] − | C10H14O4 | −0.74 | |||
| 211.0614 | [M23 − H] − | C10H12O5 | −1.05 | Methyl syringate in various Iranian hones | [31] | |
| 242.0674 | [M24 − H] − | C10H13NO6 | −1.39 | |||
| 361.1511 | [M25 − H] − | C17H29O4S2 | 0.60 | |||
| 459.1187 | [M26 − H] − | C16H28O13S | −2.00 | |||
| 15 (V), Figure 4 | 190.1229 | [M27 + H] + | C12H15NO | −1.16 | ||
| 236.1284 | [M28 + H] + | C13H17NO3 | −1.31 | |||
| 234.1145 | [M28 − H] − | −3.94 | ||||
| 266.1389 | [M29 + H] + | C14H19NO4 | −0.51 | |||
| 264.1251 | [M29 − H] − | −3.74 | ||||
| 289.1184 | [M30 + H] + | C15H16N2O4 | −0.64 | |||
| 342.1549 | [M31 + H] + | C16H23NO7 | −0.53 | |||
| 11 (G), Figure 5 | 183.0993 | [M32 + Na] + | C8H16O3 | −0.84 | ||
| 159.1028 | [M32 − H] − | −0.51 | ||||
| 209.1149 | [M33 + Na] + | C10H18O3 | −0.59 | Royal jelly acid in various Iranian honeys | [31] | |
| 185.1184 | [M33 − H] − | −0.49 | ||||
| 227.1254 | [M34 + Na] + | C10H20O4 | −0.22 | |||
| 243.0741 | [M35 + H] + | Unknown | - | |||
| 267.1104 | [M36 + H] + | Unknown | - | |||
| 293.0995 | [M37 + Na] + | C13H18O6 | 0.14 | |||
| 321.0945 | [M38 + Na] + | C14H18O7 | −0.11 | |||
| 355.1727 | [M39 + Na] + | C16H28O7 | 0.07 | |||
| 371.1677 | [M40 + Na] + | C16H28O8 | −0.13 | |||
| 376.1003 | [M41 + H] + | C15H19O11 | −0.70 | |||
| 121.0296 | [M42 − H] − | C7H6O2 | −0.55 | Benzoic acid in honeydew honey from Brazil | [33] | |
| 151.0402 | [M43 − H] − | C8H8O3 | −0.60 | Mandelic acid in various honeys | [34] | |
| Vanillin in various Czech honeys | [35] | |||||
| 240.0516 | [M44 − H] − | C10H11NO6 | −1.03 | |||
| 279.1241 | [M45 − H] − | C15H20O5 | −0.90 | |||
| 12 (G), Figure 5 | 211.1305 | [M21 + Na] + | C10H20O3 | −0.26 | Hydroxy decanoic acid in various Iranian honeys | [31] |
| 209.1150 | [M33 + Na] + | C10H18O3 | −0.93 | Royal jelly acid in various Iranian honeys | [31] | |
| 151.0401 | [M43 − H] − | C8H8O3 | −0.21 | Mandelic acid in various honeys | [34] [35] | |
| Vanillin in various Czech honeys | ||||||
| 171.0992 | [M46 + H] + | C7H16O3 | −0.43 | |||
| 188.0683 | [M47 + H] + | C8H11O5 | −2.04 | |||
| 287.1254 | [M48 + Na] + | C15H20O4 | 0.04 | |||
| 263.1290 | [M48 − H] − | |||||
| 137.0244 | [M49 − H] − | C7H6O3 | −0.15 | Salicylic acid in honeydew honey from Brazil | [33] | |
| 4-Hydroxybenzoic acid in Agastache honey | [36] | |||||
| 13 (G), Figure 5 | 146.0600 | [M6 + Na] + | C9H7NO | 0.07 | 2-Hydroxyquinoline in various Iranian honeys | [31] |
| 263.1252 | [M9 + Na] + | C13H20O4 | 0.76 | |||
| 247.1303 | [M19 + Na] + | C13H20O3 | 0.71 | |||
| 170.0576 | [M50 + Na] + | C9H9NO | 0.26 | |||
| 146.0612 | [M50 − H] − | 0.07 | ||||
| 193.1199 | [M51 + Na] + | C10H28O2 | 0.21 | |||
| 15 (G), Figure 5 | 105.0702 | [M52 + H] + | C8H8 | −3.37 | ||
| 122.0966 | [M53 + H] + | Unknown | - | |||
| 203.0525 | [M54 + Na] + | C6H12O6 | 0.05 | Hexose | ||
| 258.1099 | [M55 + H] + | C12H17O6 | −0.89 | |||
| 284.1490 | [M56 + H] + | Unknown | - | |||
| 211.0613 | [M57–H] − | C10H12O5 | −0.24 | Methyl syringate in various Iranian honeys | [31] | |
| 19 (G), Figure 5 | 146.0600 | [M6 + H] + | C9H7NO | 0.07 | 2-Hydroxyquinoline in various Iranian honeys | [31] |
| 168.0419 | [M6 + Na] + | 0.15 | ||||
| 144.0455 | [M6 − H] − | −0.01 | ||||
| 195.0876 | [M58 + H] + | C18H10N4O2 | 0.27 | |||
| 217.0695 | [M58 + Na] + | 0.22 | ||||
| 291.1125 | [M59 + H] + | C18H14N2O2 | 0.67 | |||
| 313.0945 | [M59 + Na] + | 0.67 | ||||
| 201.1133 | [M60 − H] − | C10H18O4 | −0.23 | Decanedioic acid in various Italian honeys | [32] | |
| 28 (G), Figure 5 | 146.0601 | [M6 + H] + | C9H7NO | −1.57 | 2-Hydroxyquinoline in various Iranian honeys | [31] |
| 168.0421 | [M6 + Na] + | −1.52 | ||||
| 144.0455 | [M6 − H] − | −0.22 | ||||
| 214.0475 | [M13 + Na] + | C10H9NO3 | −1.14 | |||
| 190.0510 | [M13 − H] − | −0.22 | ||||
| 146.0612 | [M50 − H] − | C9H9NO | −0.22 | |||
| 236.0294 | [M61 + Na] + | C9H9O6 | −2.05 | |||
| 359.1311 | [M62 + Na] + | C14H24O9 | −0.68 | |||
| 385.1468 | [M63 + Na] + | C16H26O9 | −0.82 | |||
| 188.0355 | [M64 − H] − | C10H7NO3 | −1.02 | |||
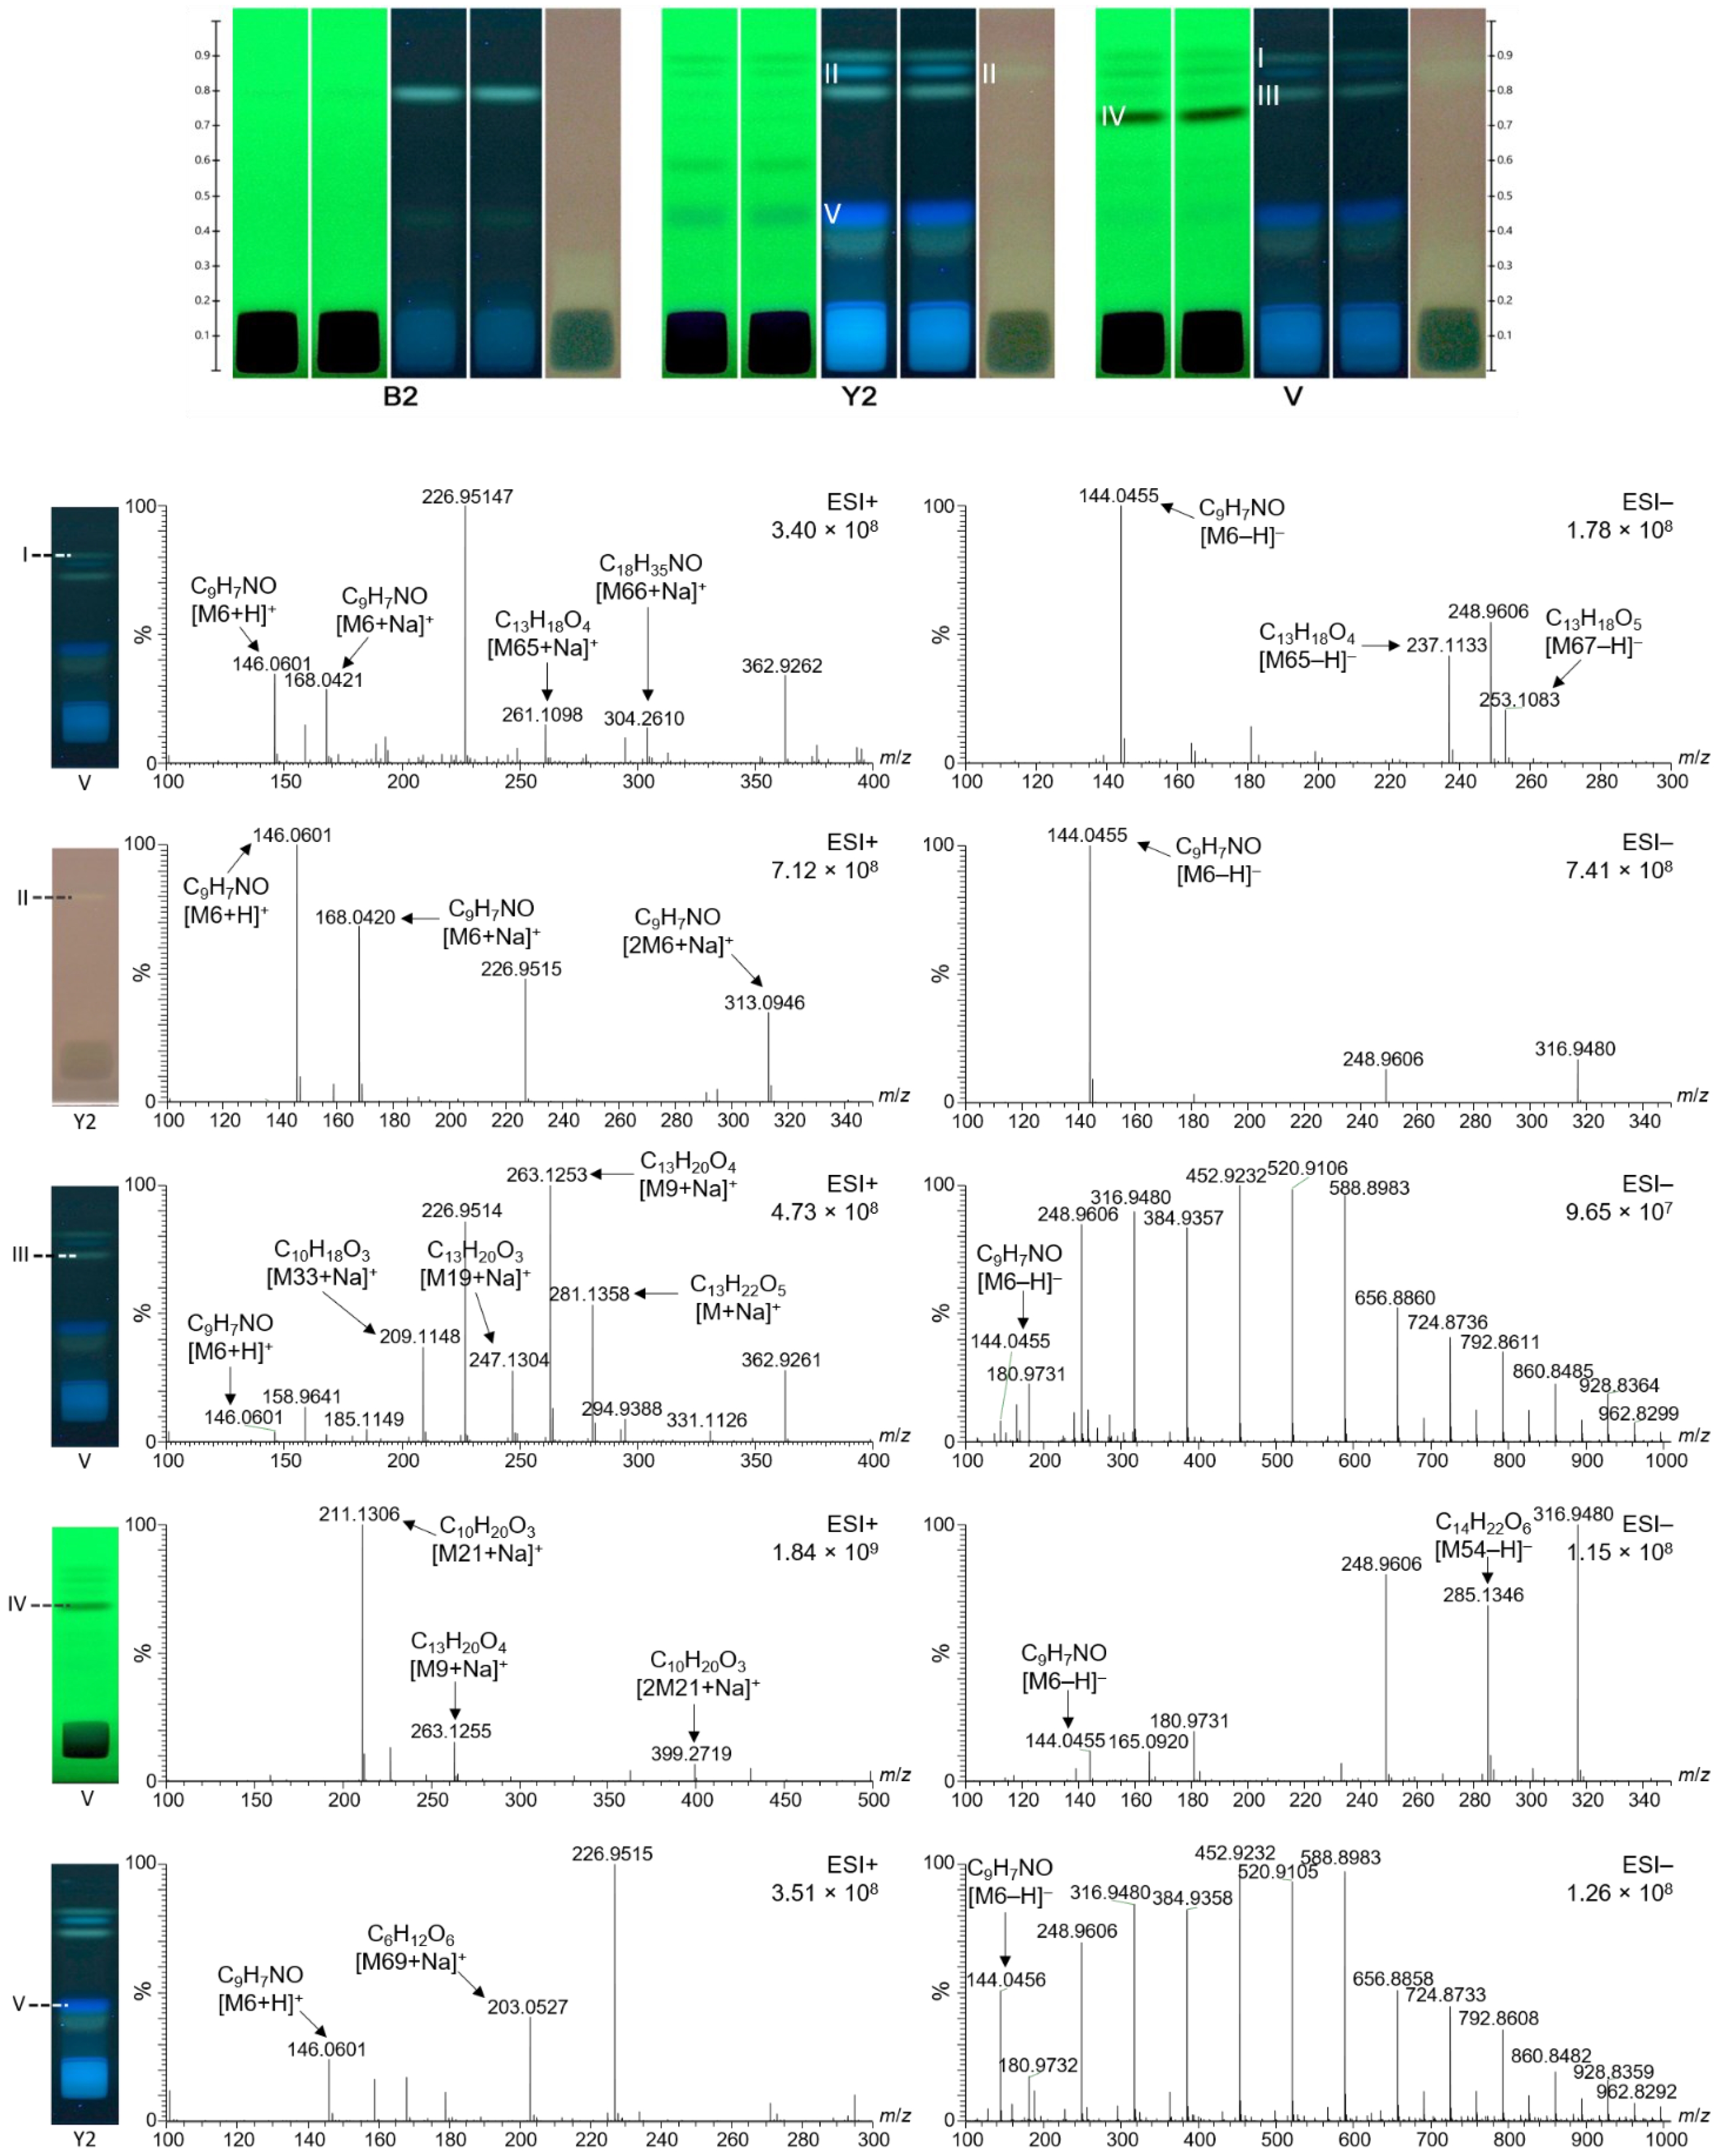
| I (V), Figure 6 | 146.0601 | [M6 + H] + | C9H7NO | −1.57 | 2-Hydroxyquinoline in various Iranian honeys | [31] |
| 168.0421 | [M6 + Na] + | −1.52 | ||||
| 144.0455 | [M6 − H] − | −0.22 | ||||
| 261.1098 | [M65 + Na] + | C13H18O4 | 0.00 | |||
| 237.1133 | [M65 − H] − | −0.40 | ||||
| 304.2610 | [M66 + Na] + | C18H35NO | 0.31 | |||
| 253.1083 | [M67 − H] − | C13H18O5 | −0.40 | |||
| II (Y2), Figure 6 | 146.0601 | [M6 + H] + | C9H7NO | −0.48 | 2-Hydroxyquinoline in various Iranian honeys | [31] |
| 168.0421 | [M6 + Na] + | −0.33 | ||||
| 313.0946 | [2M6 + Na] + | 0.35 | ||||
| 144.0455 | [M6 − H] − | 0.06 | ||||
| III (V), Figure 6 | 146.0601 | [M6 + H] + | C9H7NO | −0.48 | 2-Hydroxyquinoline in various Iranian honeys | [31] |
| 144.0455 | [M6 − H] − | 0.06 | ||||
| 263.1253 | [M9 + Na] + | C13H20O4 | 0.12 | |||
| 247.1304 | [M19 + Na] + | C13H20O3 | 0.27 | |||
| 209.1148 | [M33 + Na] + | C10H18O3 | −0.02 | Royal jelly acid in various Iranian honeys | [31] | |
| 281.1358 | [M68 + Na] + | C13H22O5 | 0.41 | |||
| IV (V), Figure 6 | 144.0455 | [M6 − H] − | C9H7NO | 0.12 | 2-Hydroxyquinoline in various Iranian honeys | [31] |
| 263.1255 | [M9 + Na] + | C13H20O4 | 0.12 | |||
| 211.1306 | [M21 + Na] + | C10H20O3 | −0.21 | Hydroxy decenoic acid in various Iranian honeys | [31] | |
| 399.2719 | [2M21 + Na] + | −0.05 | ||||
| V (Y2), Figure 6 | 146.0601 | [M6 + H] + | C9H7NO | −0.48 | 2-Hydroxyquinoline in various Iranian honeys | [31] |
| 144.0455 | [M6 − H] − | 0.12 | ||||
| 203.0527 | [M69 + Na] + | C6H12O6 | −0.39 | Hexose |
Publisher’s Note: MDPI stays neutral with regard to jurisdictional claims in published maps and institutional affiliations. |
© 2022 by the authors. Licensee MDPI, Basel, Switzerland. This article is an open access article distributed under the terms and conditions of the Creative Commons Attribution (CC BY) license (https://creativecommons.org/licenses/by/4.0/).
Share and Cite
Morlock, G.E.; Belay, A.; Heil, J.; Mehl, A.; Borck, H. Effect-Directed Profiling of Monofloral Honeys from Ethiopia by High-Performance Thin-Layer Chromatography and High-Resolution Mass Spectrometry. Molecules 2022, 27, 3541. https://doi.org/10.3390/molecules27113541
Morlock GE, Belay A, Heil J, Mehl A, Borck H. Effect-Directed Profiling of Monofloral Honeys from Ethiopia by High-Performance Thin-Layer Chromatography and High-Resolution Mass Spectrometry. Molecules. 2022; 27(11):3541. https://doi.org/10.3390/molecules27113541
Chicago/Turabian StyleMorlock, Gertrud E., Abera Belay, Julia Heil, Annabel Mehl, and Hannelore Borck. 2022. "Effect-Directed Profiling of Monofloral Honeys from Ethiopia by High-Performance Thin-Layer Chromatography and High-Resolution Mass Spectrometry" Molecules 27, no. 11: 3541. https://doi.org/10.3390/molecules27113541
APA StyleMorlock, G. E., Belay, A., Heil, J., Mehl, A., & Borck, H. (2022). Effect-Directed Profiling of Monofloral Honeys from Ethiopia by High-Performance Thin-Layer Chromatography and High-Resolution Mass Spectrometry. Molecules, 27(11), 3541. https://doi.org/10.3390/molecules27113541