Article

Coumarinolignans with Reactive Oxygen Species (ROS) and NF-κB Inhibitory Activities from the Roots of Waltheria indica

1
Department of Pharmaceutical Sciences, Daniel K. Inouye College of Pharmacy, University of Hawai‘i at Hilo, Hilo, HI 96720, USA
2
School of Life Sciences, Jiangsu Normal University, Xuzhou 221116, China
3
Department of Chemistry, 2545 McCarthy Mall, University of Hawai‘i at Manoa, Honolulu, HI 96822, USA
4
Daniel K. Inouye U.S. Pacific Basin Agricultural Research Center, USDA-ARS, Hilo, HI 96720, USA
5
Department of Pharmacy Practice, Daniel K. Inouye College of Pharmacy, University of Hawai‘i at Hilo, Hilo, HI 96720, USA
6
Department of Pharmacology and Toxicology, R. K. Coit College of Pharmacy, University of Arizona, Tucson, AZ 85715, USA
7
Hale Ola Pono, LLC, Keaau, HI 96749, USA
*
Author to whom correspondence should be addressed.
These authors contributed equally to this work.
Molecules 2022, 27(10), 3270; https://doi.org/10.3390/molecules27103270
Submission received: 11 March 2022 / Revised: 15 May 2022 / Accepted: 16 May 2022 / Published: 19 May 2022
(This article belongs to the Special Issue Bioactive Compounds from Natural Sources II)

Abstract

:
Seven new coumarinolignans, walthindicins A–F (1a, 1b, 25, 7), along with five known analogs (6, 811), were isolated from the roots of Waltheria indica. The structures of the new compounds are determined by detailed nuclear magnetic resonance (NMR), circular dichroism (CD) with extensive computational support, and mass spectroscopic data interpretation. Compounds were tested for their antioxidant activity in Human Cervical Cancer cells (HeLa cells). Compounds 1a and 6 showed higher reactive oxygen species (ROS) inhibitory activity at 20 μg/mL when compared with other natural compound-based antioxidants such as ascorbic acid. Considering the role of ROS in nuclear-factor kappa B (NF-κB) activation, compounds 1a and 6 were evaluated for NF-κB inhibitory activity and showed a concentration-dependent inhibition in Human Embryonic Kidney 293 cells (Luc-HEK-293).

1. Introduction

Waltheria indica L. (Malvaceae) is a short-lived shrub widespread in subtropical and tropical regions, including Hawai‘i [1,2]. In Hawaiian traditional medicinal practices, the indigenous ‘uhaloa, Waltheria indica var. americana is one of the most recognized plants and has been used to treat asthma, inflammation, neuralgia and pain [3,4]. ‘Uhaloa has been used in Hawaiian traditional medicine (lā‘au lapa‘au) by native healers to treat a variety of illnesses including asthma, skin inflammation, tuberculosis, tooth abscesses, as well as other infectious diseases. The root bark is used for sore throat relief, whereas tea made from the leaves helps fever and respiratory problems [5]. Furthermore, the roots, aerial parts, and whole plant are used in several countries for treating various conditions such as asthma, respiratory illness such as a sore throat and cough, inflammation, fever, pain, skin infections, and cancer [3,6].
A previous biological investigation of W. indica extracts showed potential anti-inflammatory activities by inhibiting the expression of key inflammatory cytokines and cytokine receptors such as interleukin (IL)-1 family: IL-1β, IL-1Ra, IL-18 and IL-6, and additionally, through the reduced expression of tumor necrosis factor alpha (TNF-α) and its receptor TNF RII, and inhibition of the mRNA and protein levels of NF-κB in human macrophages [7]. The IL-1 family is primarily associated with innate immunity [7]. Previous phytochemical studies of W. indica reported polyphenols [8], flavonoids [9,10,11], coumarins, terpenoids [12], cyclopeptides, and quinoline alkaloids [13,14,15]. In this context, flavonoids and quinoline alkaloids isolated from W. indica possess NF-κB inhibitory and quinone reductase inducing activities. [5]. There have been no phytochemical studies of coumarinolignans from roots of W. indica growing in Hawai‘i. In addition, coumarinolignans from Eurycorymbus cavaleriei L. (Sapindaceae) and Hyoscyamus niger L. (Solanaceae) have exhibited many interesting biological activities [16,17]. Most of the studies reported anti-inflammatory, cytotoxic, and hepatoprotective activities [16,17]. Considering these factors, we conducted this current study.

2. Results and Discussion

Walthindicin A (1) was obtained as a pale-yellow powder. A molecular formula of C20H18O8 with twelve degrees of unsaturation was established on the basis of the HRESIMS (m/z 387.1081 [M + H]+). The IR spectrum suggested the presence of hydroxy group (3422 cm−1), conjugated carbonyl (1718 cm−1), and aromatic ring (1620 and 1515 cm−1) functionalities. The 1H NMR data (in CDCl3, 400 MHz, Table 1) of 1 indicated the presence of three aromatic protons (δH 6.89, d, H-2′; δH 6.95, d, H-5′; δH 6.94, dd, H-6′) attributed to a 1,3,4-trisubstituted benzene ring, one singlet proton (δH 6.50, s, H-8) of another aromatic ring, four oxymethine/oxymethylene protons (δH 3.55, dd, H-9′a; δH 3.88, m, H-9′b; δH 3.98, m, H-8′; δH 5.03, d, H-7′), two methoxy groups (δH 3.90, s, OCH3-3′; δH 3.92, s, OCH3-7), and a pair of mutually coupled vinylic protons (δH 6.17, d, H-2; δH 7.90, d, H-3). The 13C NMR data (in CDCl3, 100 MHz, Table 2) of 1 displayed 20 carbons, including two methyls (δC 56.3 and 56.7), one methylene (δC 61.6), two oxymethines (δC 77.3 and 78.5), six olefinic methines (δC 93.1, 109.9, 112.3, 115.0, 121.0 and 138.3) and nine quaternary carbons (δC 103.7, 127.4, 129.6, 140.0, 146.8, 147.1, 149.9, 152.4 and 161.7). All of the proton signals were assigned to the corresponding carbons through direct 1H and 13C correlations in the HSQC spectrum. The spectroscopic data of 1 were closely related to those of reevesiacoumarin [18], a known lignanoid with a coumarinolignan skeleton, which was previously isolated from the root and stem of Reevesia formosana (Malvaceae). The molecular formula of compound 1 was C20H18O8. Its molecular formula is different from reevesiacoumarin by 16 mass units. Analysis of the NMR data revealed that a hydroxy group in reevesiacoumarin was absent, and an additional aromatic proton (δH 6.96, d, H-5′) was present in 1 (Figure 1). This conclusion was supported by the upfield shift of the C-5′ (δC 115.0 in 1 vs. 147.1 in reevesiacoumarin) and was confirmed by the correlations of H-5′ (δH 6.96) with C-1′ (δc 127.4) and C-3′ (δc 147.1) in the HMBC spectrum (Figure 2). The C-6–O–C-8′ (C-5–O–C-7′) linkages were confirmed through HMBC correlation signals from H-9′ (δH 3.55, 3.88) to C-6 (δc 129.6), C-7′ (δc 77.3) and C-8′ (δc 78.5). The coupling constant (J = 8.0 Hz) between the two vicinal oxymethine protons of C-7′ and C-8′ indicated that the phenyl group and the oxygenated methylene were trans diaxial [18,19]. The optical rotation of 1 was approximately zero, and the CD spectrum showed no strong signals, which proved that the compound was a racemic mixture. Further analysis by HPLC using a chiral column showed two peaks (tR = 11.8 and 14.3 min) with areas in a ratio of approximately 47:53, whose CD spectra, once separated, were almost mirror images (Figure 3).
With ECD spectra in hand, we sought to assign the absolute configuration of the two compounds (1a and 1b). Initially, when analyzing the experimental spectra, based on the literature precedent, it was expected that the UV absorptions at 310–340 and 275–290 nm were due to the coumarin and the substituted benzene, respectively, with interchromophoric interactions that were producing a non-degenerate exciton coupling [20]. That report had used MM2 calculations to determine the lowest energy conformers in order to interpret the ECD spectra. However, attempts to fit our experimental data to their model were generally unsuccessful. Extensive conformational analysis and thoughtful consideration of the orbitals involved for each significant excited state led us to conclude that the published model was not an appropriate approach for the coumarinolignans isolated for this paper.
Exciton coupling is predicated on two chromophores being connected through a chiral linker. The magnitude of the coupling is inversely proportional to the square of the interchromophoric distance and is maximal around a dihedral angle of 70° for the two transition moments [21]. The isolated coumarinolignans have two chromophores connected through a chiral linker, but the dihedral angle between the chromophores is generally large (in many cases close to 180°), which places them considerably far apart, leading to minimal exciton coupling.
The ECD spectra of 1a and 1b contains three cotton effects, which we assigned as follows. The UV transition observed at 250 nm corresponds to a π → π∗ transition of the substituted benzene ring, with the corresponding sign of the CE dependent on the orientation of benzene rings, with respect to the plane of the coumarin. This CE is largely independent from determining the CEs in the other two regions (290 nm and 305 nm). Based on our computational data, the other two UV absorbances and associated CEs correspond to different π → π∗ transitions, located mainly on the coumarin. An example of each transition for the lowest energy conformer of 1a is shown in Figure 4. These conclusions are supported by closer inspection of the orbitals involved in each transition for all conformers with >1% Boltzmann population for 1a and 1b. This conclusion does contradict the published assessment that the 310–340 and 275–290 nm CE are due to the coumarin and the substituted benzene, respectively, for this set of coumarinolignans would differently inform our approach when comparing the experimental and computational data. For this comparison, the π → π∗ absorption (250 nm) on the substituted benzene is well resolved from other the transitions and can serve as a good benchmark for aligning the experimental and computational spectra, thus ensuring the validity of the comparisons.
From the details above, the absolute configurations of the faster eluting enantiomer and the slower eluting enantiomer were assigned as 7′R,8′R (1a) and 7′S,8′S (1b), respectively, based on the ECD calculations and their comparison to the experimental data (Figure 5). The similarity score calculated for 1a was 0.67 with the enantiomer as 0.19 and for 1b was 0.49 with the enantiomer as 0.30. The distortions in the experimental data may be from other transitions (other π → π∗ or n → π∗) that overlap with the π → π∗ transitions identified by the computation, but do not appear as significant in the calculated data or for other reasons.
Walthindicin B (2) was shown to have the molecular formula, C21H20O8, by HRESIMS (m/z 401.1233 [M+H]+, calcd for C21H20O8, 401.1236) and 13C NMR data, differing from 1 by 14 mass units. The NMR spectroscopic data of 2 (Table 1 and Table 2) showed a close correlation with those of 1, except for an additional methoxy group (δH 3.86, δC 56.6, OCH3-4′). HMBC data analyses revealed that the methoxy was located on C-4′ and confirmed C-6–O–C-8′ (C-5–O–C-7′) linkages. The large coupling constant (J = 8.0 Hz) in 2 could be caused by the inflexible trans stereochemistry between H-7′ and H-8′ [18,19]. The absolute configuration of 2 was determined to be 7′R,8′R by comparison of its experimental ECD spectrum (Figure 3) with the calculated data (Figure S26, Supporting Information).
Walthindicin C (3) was obtained as a pale-yellow powder. The molecular formula of 3 was determined as C22H22O9 from the HRESIMS ion observed at m/z 431.1341 [M + H]+ (calcd for C22H22O9, 431.1342), differing from 2 by 30 mass units. Analysis of the NMR data (Table 1 and Table 2) revealed that an aromatic proton in 2 was absent, and, instead, one additional methoxy group (δH 3.87, δC 56.5, OCH3-5′) was present in 3 and substituted at C-5′. This observation was supported by the downfield shift of C-5′ (δC 153.9 in 3 vs. 113.1 in 2) and was confirmed by the HMBC correlation signal from OCH3-5′ to C-5′ (δc 153.9). The C-6–O–C-8′ (C-5–O–C-7′) linkages were confirmed by the HMBC correlations of H-9′ (δH 3.58 and 3.97) with C-6 (δC 129.6), C-7′ (δC 77.3) and C-8′ (δC 78.3). The trans diaxial orientation between H-7′ and H-8′ was inferred from their coupling constant (J = 8.0 Hz) [18,19]. The absolute configuration of 3 was determined to be 7′R,8′R by comparison of its experimental ECD spectrum (Figure 3) with the calculated data (Figure S36, Supporting Information).
Walthindicin D (4) was obtained as a pale-yellow powder and gave a protonated molecular ion at m/z 401.1231 [M + H]+ (calcd for C21H21O8, 401.1236) in the HRESIMS, corresponding to a molecular formula of C21H20O8. The 1H and 13C NMR spectra of 4 were closely related to those of compound 3. Analysis of the NMR data (Table 1 and Table 2) revealed that one methoxy group in 3H 3.86, δC 61.1, OCH3-4′) was absent, and an oxymethylene group (δH 3.58, 3.97, δC 61.5, OCH2-9′) in 3 was replaced by a methyl (δH 1.22, δC 17.5, CH3-9′) in 4. The HMBC correlations from CH3-9′ to C-6 (δC 131.2), C-7′ (δC 83.4) and C-8′ (δC 75.4) in conjunction with 1H-1H COSY correlation between H-8′ (δH 4.19) and CH3-9′ revealed that the methyl was located on C-8′ and a C-6–O–C-8′ (C-5–O–C-7′) linkage existed. The trans-form between H-7′ and H-8′ was deduced from their coupling constant (J = 8.0 Hz) [18,19].
Walthindicin E (5) was obtained as a pale-yellow powder. Its molecular formula was determined as C23H22O10 with thirteen degrees of unsaturation on the basis of HRESIMS and 13C NMR data. The UV, IR and 1D NMR spectroscopic data of 5 were very close to those of durantin C (6) [22], which was purified from same subfraction by HPLC. Fortunately, there existed a pattern that C-7 (δC 137.4 in 6 vs. 136.8 in 5) was shifted to high field and C-8 (δC 132.1 in 6 vs. 132.7 in 5) shifted to low field when the connection mode converted from C-7–O–C-7′ to C-7–O–C-8′ [23,24]. In view of these similarities, 5 was logically assumed to be the regioisomer of 6, which was further verified by the HMBC couplings between C-8 and H-7′ (δH 4.91), and between C-7 and H-9′ (δH 4.07) (Figure 2). The large coupling constant (J = 7.4 Hz) between H-7′ and H-8′ suggested that these protons were in a trans configuration [18,19].
The zero optical rotation suggested that 4 and 5 occurred as a racemic mixture, while compounds 4 and 5 were not further purified due to the limited quantities available of these compounds [25].
Walthindicin F (7) was obtained as a pale-yellow powder. The molecular formulas of 7 were determined as C21H20O8 from the HRESIMS ion observed at m/z 401.1235 [M+H]+ (calcd for C21H21O8, 401.1236). The UV, IR and 1D NMR spectroscopic data of 7 were very close to those of cleomiscosin A methyl ether (8) [17]. The same molecular formula and detailed 2D NMR analysis revealed that compound 7 shared an identical planar structure as that of 8. Compared to 8, the coupling constant between H-7′ and H-8′ was changed (J = 2.9 Hz in 7 vs. J = 8.0 Hz in 8), which indicated that the relative conformation of H-7′ and H-8′ was transformed from trans in 8 to cis in 7 [18,19,26,27]. The C-7–O–C-7′ and C-8–O–C-8′ linkages were confirmed by the HMBC correlations between C-7 and H-7′ (δH 4.91), and between C-8 and H-8′ (δH 4.07).
In terms of ECD analysis, the lowest energy conformer (Figure 6) of 7 (29.5% of the population) is representative of the majority of conformers that are present in a least > 1% abundance. The angle in this case is approximately 170°. The only important exceptions are conformers 3 (Figure 6) and 4 (combined 12.9% total of the Boltzmann population of 7), which have angles around 100° between the chromophores, similar to that previously reported [20]. This angle is closer to optimal than what was observed for the other compounds isolated here and would potentially explain the stronger exciton coupling observed in this case. In fact, the calculations do show a greater involvement of the π orbitals across the molecule in the 310 nm and 250 nm transitions, indicating there is greater coupling for those conformers (Figure S61, Supplementary Materials), which may indeed elicit a stronger exciton coupling for the ECD spectrum of 7.
The calculated ECD spectrum of 7′S,8′R showed a positive Cotton effect around 245 nm and a negative Cotton effect around 320 nm, similar to the experimentally recorded CD spectrum of 7 with a similarity score of 0.80, as determined by SpecDis [28] (Figure 7). Hence, the absolute configuration of 7 was unambiguously assigned as shown.
The other five isolates obtained were identified as the known compounds durantin C (6) [22], cleomiscosin A methyl ether (8) [17], jatrocin B (9) [29,30], venkatasin (10) [20], and 4′-O-methyl-cleomiscosin D (11) [31], by comparison of their physical and spectroscopic data with those reported in the literature. To date, only one coumarinolignan has been reported from the Malvaceae family [18]. Our study is the first report of coumarinolignans from a plant in the Waltheria genus.
It is widely accepted that chronic inflammation plays a vital role in metabolic disorders such as type 2 diabetes, cardiovascular diseases, atherosclerosis and cancer [32,33]. Studies suggest that NF-κB acts as a mediator in inflammation-induced pathological conditions [34]. Significantly, the activation of NF-κB leads to the up-regulation of pro-inflammatory genes such as cytokines, chemokines, and adhesion molecules, which are chemical messengers for pathogenesis [35]. Therefore, the regulation of the inhibition of NF-κB expression has been a central target for developing new anti-inflammatory drugs. Furthermore, reactive oxygen species (ROS) play a crucial role in NF-κB activation and, thus, assessing ROS level is also an indication of pro-inflammatory responses [36]. Plant-based natural compounds/extracts have long been studied for their antioxidant and anti-inflammatory activities. Therefore, we assessed the cytotoxic concentration of all the compounds for further bioassays. ROS inhibition of compounds was tested at 20 μg/mL concentration along with other plant-based (resveratrol and ascorbic acid) and synthetic (N-acetylcysteine) positive controls (Figure 8). Compounds 1a and 6 have shown significantly higher ROS inhibition compared to ascorbic acid and comparable activity with resveratrol. Considering the antioxidant activity of compounds 1a and 6, their anti-inflammatory activity was evaluated in Luc-HEK-293 cells. Tumor necrosis factor alpha (TNF-α)-induced NF-κB expression was assessed at different concentrations of compounds along with the positive control Tosyl phenylalanyl chloromethyl ketone (TPCK). Although the positive control was most potent in inhibiting NF-κB expression, 30 μg/mL of compounds 1a and 6 showed complete inhibition of TNF-α-induced NF-κB expression and a further reduction in NF-κB expression was observed at 40 μg/mL when compared to the only cell (Figure 9).
The results suggested that tested compounds can reduce ROS production and eventually affect NF-κB activation [36]. The natural coumarinolignans are the phenylpropanoid linked via a 1,4-dioxane bridge with the coumarin skeleton. These closely related coumarinolignans show promising biological activity. The fusion between the 1,4-dioxane bridge and coumarin may occur either at the 5 and 6 positions or at the 7 and 8 positions. Compared with 1a and 1b, chiral centers (7′R,8′R) play an important role in our ROS inhibition assay. When comparing compounds 1a and 6, structural differences presumably act through a different cellular mechanism that may affect ROS production and affect NF-κB activation. Furthermore, the fusion of a phenylpropanoid with two ortho-hydroxy groups may take place in two different manners giving rise to regioisomers (5 and 6). The C-7–O–C-8′ linked (6) showed better ROS inhibition activity than the C-7–O–C-7′ (5). The hydroxy group at C-4′ also contributes to the ROS inhibitory activity. However, the inhibition of ROS production by these compounds further confirms the potential of these compounds as chemo-preventive agents.

3. Materials and Methods

3.1. General Experimental Procedures

Optical rotations were recorded in CHCl3 on a Rudolph Research AUTOPOL IV multiwavelength polarimeter (Rudolph Research Analytical, Hackettstown, NJ, USA). Ultraviolet spectra were measured with a Shimadzu PharmaSpec-1800 UV-visible spectrophotometer (Shimadzu Scientific Instruments, Columbia, MD, USA). Electronic circular dichroism spectra were obtained at 20 °C on a JASCO J-815 spectropolarimeter (JASCO Inc., Tokyo, Japan). Infrared radiation spectra were recorded on a Thermo Scientific Nicolet iS 10 FT-IR spectrometer (Thermo Fisher Scientific, Waltham, MA, USA). One-dimensional- and two-dimensional-NMR spectra were collected on a Bruker AVANCE DRX-400 NMR spectrometer (Bruker, Billerica, MA, USA) at 400 MHz for 1H and 100 MHz for 13C, and the data were processed using TopSpin 3.2 software with CDCl3H 7.23, δC 77.16) or CD3OD (δH 3.31, δC 49.0) as solvents. High-resolution electrospray ionization mass spectra were performed with an Agilent 6530 LC-qTOF High Mass Accuracy mass spectrometer (Santa Clara, CA, USA) under the positive-ion mode. Silica gel (230–400 mesh, 480–800 mesh, Sorbent Technologies, Atlanta, GA, USA), Sephadex LH-20 (GE Healthcare, Piscataway, NJ, USA), and MCI gel (CHP-20P, Mitsubishi Chemical Corporation, Tokyo, Japan) were used for column chromatography. Preparative HPLC was performed on a Thermo Scientific Ultimate 3000 system equipped with a photodiode array detector, using a YMC reversed-phase C18 column (5 μm, 20 × 250 mm, YMC-pack ODS-A) with a flow rate of 5 mL/min or a reversed-phase C18 chiral column (250 × 10 mm, 5 μm, Cellulose-1), with a flow rate of 4 mL/min.

3.2. Plant Material

The fresh roots of W. indica were collected from Puako, Hawai‘i Island (Big Island), Hawaii, USA, in November 2019 and were identified by Kumu Dane Kaohelani Silva. A voucher specimen (No. WIS01) was deposited at the Natural Product Chemistry Laboratory, Daniel K. Inouye College of Pharmacy, University of Hawai‘i at Hilo.

3.3. Extraction and Isolation

The air-dried powdered roots (11.5 kg) of W. indica were extracted with methanol (60 L × 3) for 48 h at room temperature. The methanolic extract was filtered and concentrated under reduced pressure, to afford a crude extract (1620 g), and then successively extracted with n-hexane, ethyl acetate, and n-butanol. After solvent removal, the ethyl acetate-soluble partition (105.0 g) was purified on an MCI gel CHP-20P column, eluted with H2O-MeOH (1:0 to 0:1, v/v), and finally with acetone, to yield seven fractions. The 80% MeOH fraction (13.0 g) was chromatographed over a silica gel column (n-hexane-EtOAc, 100:0 to 0:100, and finally CHCl3-MeOH, 1:1) to yield 18 fractions (Fr. 1–18), which were combined on the basis of thin layer chromatography analysis. Fr. 4 (520.0 mg) was applied to a Sephadex LH-20 column eluting with MeOH to afford three fractions (4.1–4.3). Fraction 4.2 (31.0 mg) was separated on a silica gel column (CHCl3-MeOH, 200:1 to 50:1) and further purified by semipreparative HPLC (acetonitrile-H2O, 35:65 to 75:25) to yield compound 4 (2.1 mg). Fr. 5 (650.0 mg) was loaded on a Sephadex LH-20 column with MeOH as eluent to give two fractions (5.1–5.2). Fraction 5.1 (500.0 mg) was chromatographed on a silica gel column (n-hexane-acetone, 4:1 to 2:1) to yield five subfractions (5.1.1–5.1.5). Subfraction 5.1.5 (50.0 mg) was further purified on a silica gel column (CHCl3-acetone, 500:1) to yield compounds 9 (19.6 mg) and 10 (2.7 mg). Fr. 6 (1.84 g) was separated on a silica gel column (CH3Cl-acetone, 20:1 to 1:1) to obtain thirteen fractions (6.1-6.13). Fraction 6.1 (69.0 mg) was separated on a silica gel column (n-hexane-acetone, 2:1) and further purified by preparative HPLC (MeOH-H2O, 60:40 to 75:25) to furnish compounds 5 (2.0 mg) and 6 (14.3 mg). Fraction 6.3 (40.0 mg) was subjected to a silica gel column (CH3Cl-EtOAc, 10:1) to obtain compounds 2 (15.8 mg) and 3 (8.8 mg). Fraction 6.4 (118.0 mg) was chromatographed on a silica gel column (n-hexane-acetone, 4:1 to 1:1) to yield nine subfractions (6.4.1–6.4.9). Subfraction 6.4.5 (22.4 mg) was subjected to a silica gel column (CHCl3-acetone, 40:1 and 15:1) to yield compounds 8 (10.5 mg) and 11 (4.5 mg). Subfraction 6.4.6 (10.7 mg) was further purified on a silica gel column (n-hexane-isopropanol, 3:1) to yield compound 7 (4.2 mg). Fraction 6.6 (92.0 mg) was chromatographed on a silica gel column (n-hexane-acetone, 8:1 to 2:1) to yield compound 1 (12.5 mg). Compound 1 was further purified by preparative chiral HPLC (acetonitrile-H2O, 40:60) to furnish compounds 1a (3.4 mg) and 1b (3.8 mg).
Compound 1a: pale-yellow powder; [ α ] D 20 −43 (c 0.13, CHCl3); UVmax (CHCl3) λmax (log ε) 320 (4.26), 288 (4.03), 245 (4.33) nm; IR (film) νmax 3422, 2955, 2920, 2850, 1718, 1620, 1565, 1515, 1457, 1373, 1266, 1202, 1150, 1121, 1092, 1034, 825, 758 cm−1; CD (CHCl3) λmax (Δε) 257 (−0.44), 274 (+0.51), 307 (−0.22), 336(+0.18); 1H NMR date, see Table 1; 13C NMR data, see Table 2; HRESIMS m/z 387.1081 [M + H]+ (calcd for C20H19O8, 387.1080).
Compound 1b: pale-yellow powder; [ α ] D 20 49 (c 0.24, CHCl3); UVmax (CHCl3) λmax (log ε) 320 (4.15), 288 (4.06), 245 (4.42) nm; IR (film) νmax 3421, 2959, 2925, 2853, 1720, 1617, 1565, 1514, 1454, 1368, 1270, 1204, 1150, 1121, 1087, 1032, 826, 757 cm−1; CD (CHCl3) λmax (Δε) 257 (+1.39), 294 (+1.97), 330 (−0.78); 1H NMR date, see Table 1; 13C NMR data, see Table 2; HRESIMS m/z 387.1080 [M + H]+ (calcd for C20H19O8, 387.1080). Compound 2: pale-yellow powder; [ α ] D 20 −44 (c 0.53, CHCl3); UVmax (CHCl3) λmax (log ε) 320 (4.30), 288 (4.12), 245 (4.43) nm; IR (film) νmax 3459, 3014, 2960, 2922, 2845, 1720, 1617, 1564, 1517, 1455, 1366, 1257, 1142, 1118, 1089, 1018, 858, 805, 752 cm−1; CD (CHCl3) λmax (Δε) 242 (−3.63), 316 (−1.06); 1H NMR date, see Table 1; 13C NMR data, see Table 2; HRESIMS m/z 401.1233 [M + H]+ (calcd for C21H21O8, 401.1236).
Compound 3: pale-yellow powder; [ α ] D 20 −53 (c 0.29, CHCl3); UVmax (CHCl3) λmax (log ε) 320 (4.30), 245 (4.43) nm; IR (film) νmax 3458, 3008, 2962, 2925, 2841, 1726, 1622, 1590, 1567, 1509, 1452, 1426, 1368, 1342, 1241, 1143, 1120, 1086, 1034, 803, 754 cm−1; CD (CHCl3) λmax (Δε) 242 (−4.80), 338 (−1.22); 1H NMR date, see Table 1; 13C NMR data, see Table 2; HRESIMS m/z 431.1341 [M + H]+ (calcd for C22H23O9, 431.1342).
Compound 4: pale-yellow powder; [ α ] D 20 0 (c 0.07, CHCl3); UVmax (CHCl3) λmax (log ε) 320 (3.88), 245 (4.04) nm; IR (film) νmax 3427, 3013, 2958, 2924, 2852, 1721, 1620, 1566, 1517, 1450, 1367, 1341, 1255, 1209, 1149, 1114, 1085, 1033, 826, 757 cm−1; 1H NMR date, see Table 1; 13C NMR data, see Table 2; HRESIMS m/z 401.1231 [M + H]+ (calcd for C21H21O8, 401.1236).
Compound 5: pale-yellow powder; [ α ] D 20 0 (c 0.13, CHCl3); UVmax (CHCl3) λmax (log ε) 318 (3.81), 245 (4.04) nm; IR (film) νmax 3418, 3012, 2957, 2923, 2854, 1719, 1612, 1575, 1500, 1454, 1411, 1365, 1301, 1221, 1154, 1134, 1111, 1051, 835, 751 cm−1; 1H NMR date, see Table 1; 13C NMR data, see Table 2; HRESIMS m/z 459.1289 [M + H]+ (calcd for C23H23O10, 459.1291).
Compound 7: pale-yellow powder; [ α ] D 20 −120 (c 0.14, CHCl3); UVmax (CHCl3) λmax (log ε) 320 (3.85), 287 (3.67), 245 (4.06) nm; IR (film) νmax 3468, 3009, 2963, 2928, 2854, 1722, 1613, 1573, 1517, 1498, 1443, 1415, 1300, 1254, 1239, 1130, 1056, 1027, 837, 763 cm−1; CD (CHCl3) λmax (Δε) 246 (+2.55), 274 (+1.47), 316 (−4.97); 1H NMR date, see Table 1; 13C NMR data, see Table 2; HRESIMS m/z 401.1235 [M + H]+ (calcd for C21H21O8, 401.1236).

3.4. Computational Methods

For ECD prediction, conformers within 5 kcal/mol of the lowest energy conformer were searched using the Monte Carlo multiple minimum (MCMM) method [37] and the OPLS-2005 force field [38] in Schrodinger Inc.’s MacroModel [39] and then optimized in Gaussian 09 [40] at the CAM-B3LYP [41]/6-31+G(d,p) [42,43,44,45] level with a Polarizable Continuum Model (PCM) [46] in chloroform. The optimized conformers were subsequently verified by frequency calculations at the same level. The geometries of all conformers close in energy were checked for redundancy. For CD prediction, time-dependent density functional theory (TDDFT) [47,48] were conducted at the CAM-B3LYP [42,49]/def2-TZVPP [50] level to calculate the electronic excitation energies and rotational strengths with PCM in chloroform. Boltzmann weighted ECD spectra, where conformers with >1% Boltzmann population were calculated using SpecDis [28] for comparison by similarity factor with the experimentally determined data recorded in chloroform. The most up-to-date version (as of October 2021) of Multiwfn [51] software was used for visualization of the molecular orbitals (isovalue = 0.03) involved in UV and ECD transitions.

3.5. Assessment of ROS Inhibition in HeLa Cells

HeLa cells were seeded in a white-walled 96-well plate at 20 × 103 cells per well and maintained in 200 μL media. Cells were incubated for 48 h at 37 °C in 5% CO2, and then, the medium was replaced with fresh (190 µL media + 10 µL sample) media and incubated for 6 h. Sample stock was prepared in DMSO and diluted with PBS. Final concentration of tested samples was 20 µg/mL along with positive control Ascorbic acid (Sigma Aldrich, Allentown, PA, USA), resveratrol (ACROS Organics) and N-acetyl-l-Cysteine (ACROS Organics). Next, 5 µL (0.5 ng/well) of diluted TNF-α solution was added to each well. The plate was incubated for 5–6 h. The cells were washed in buffer and stained with 2′,7′–dichlorofluorescin diacetate (DCFDA, Abcam, Boston, MA, USA) for 45 min. A measurement was taken by a microplate reader (Synergy H1, BioTek, Winooski, VT, USA) with excitation/emission at 485 nm/535 nm. All samples were tested in triplicates. Experiments were conducted in triplicates to ensure the reproducibility of the results.

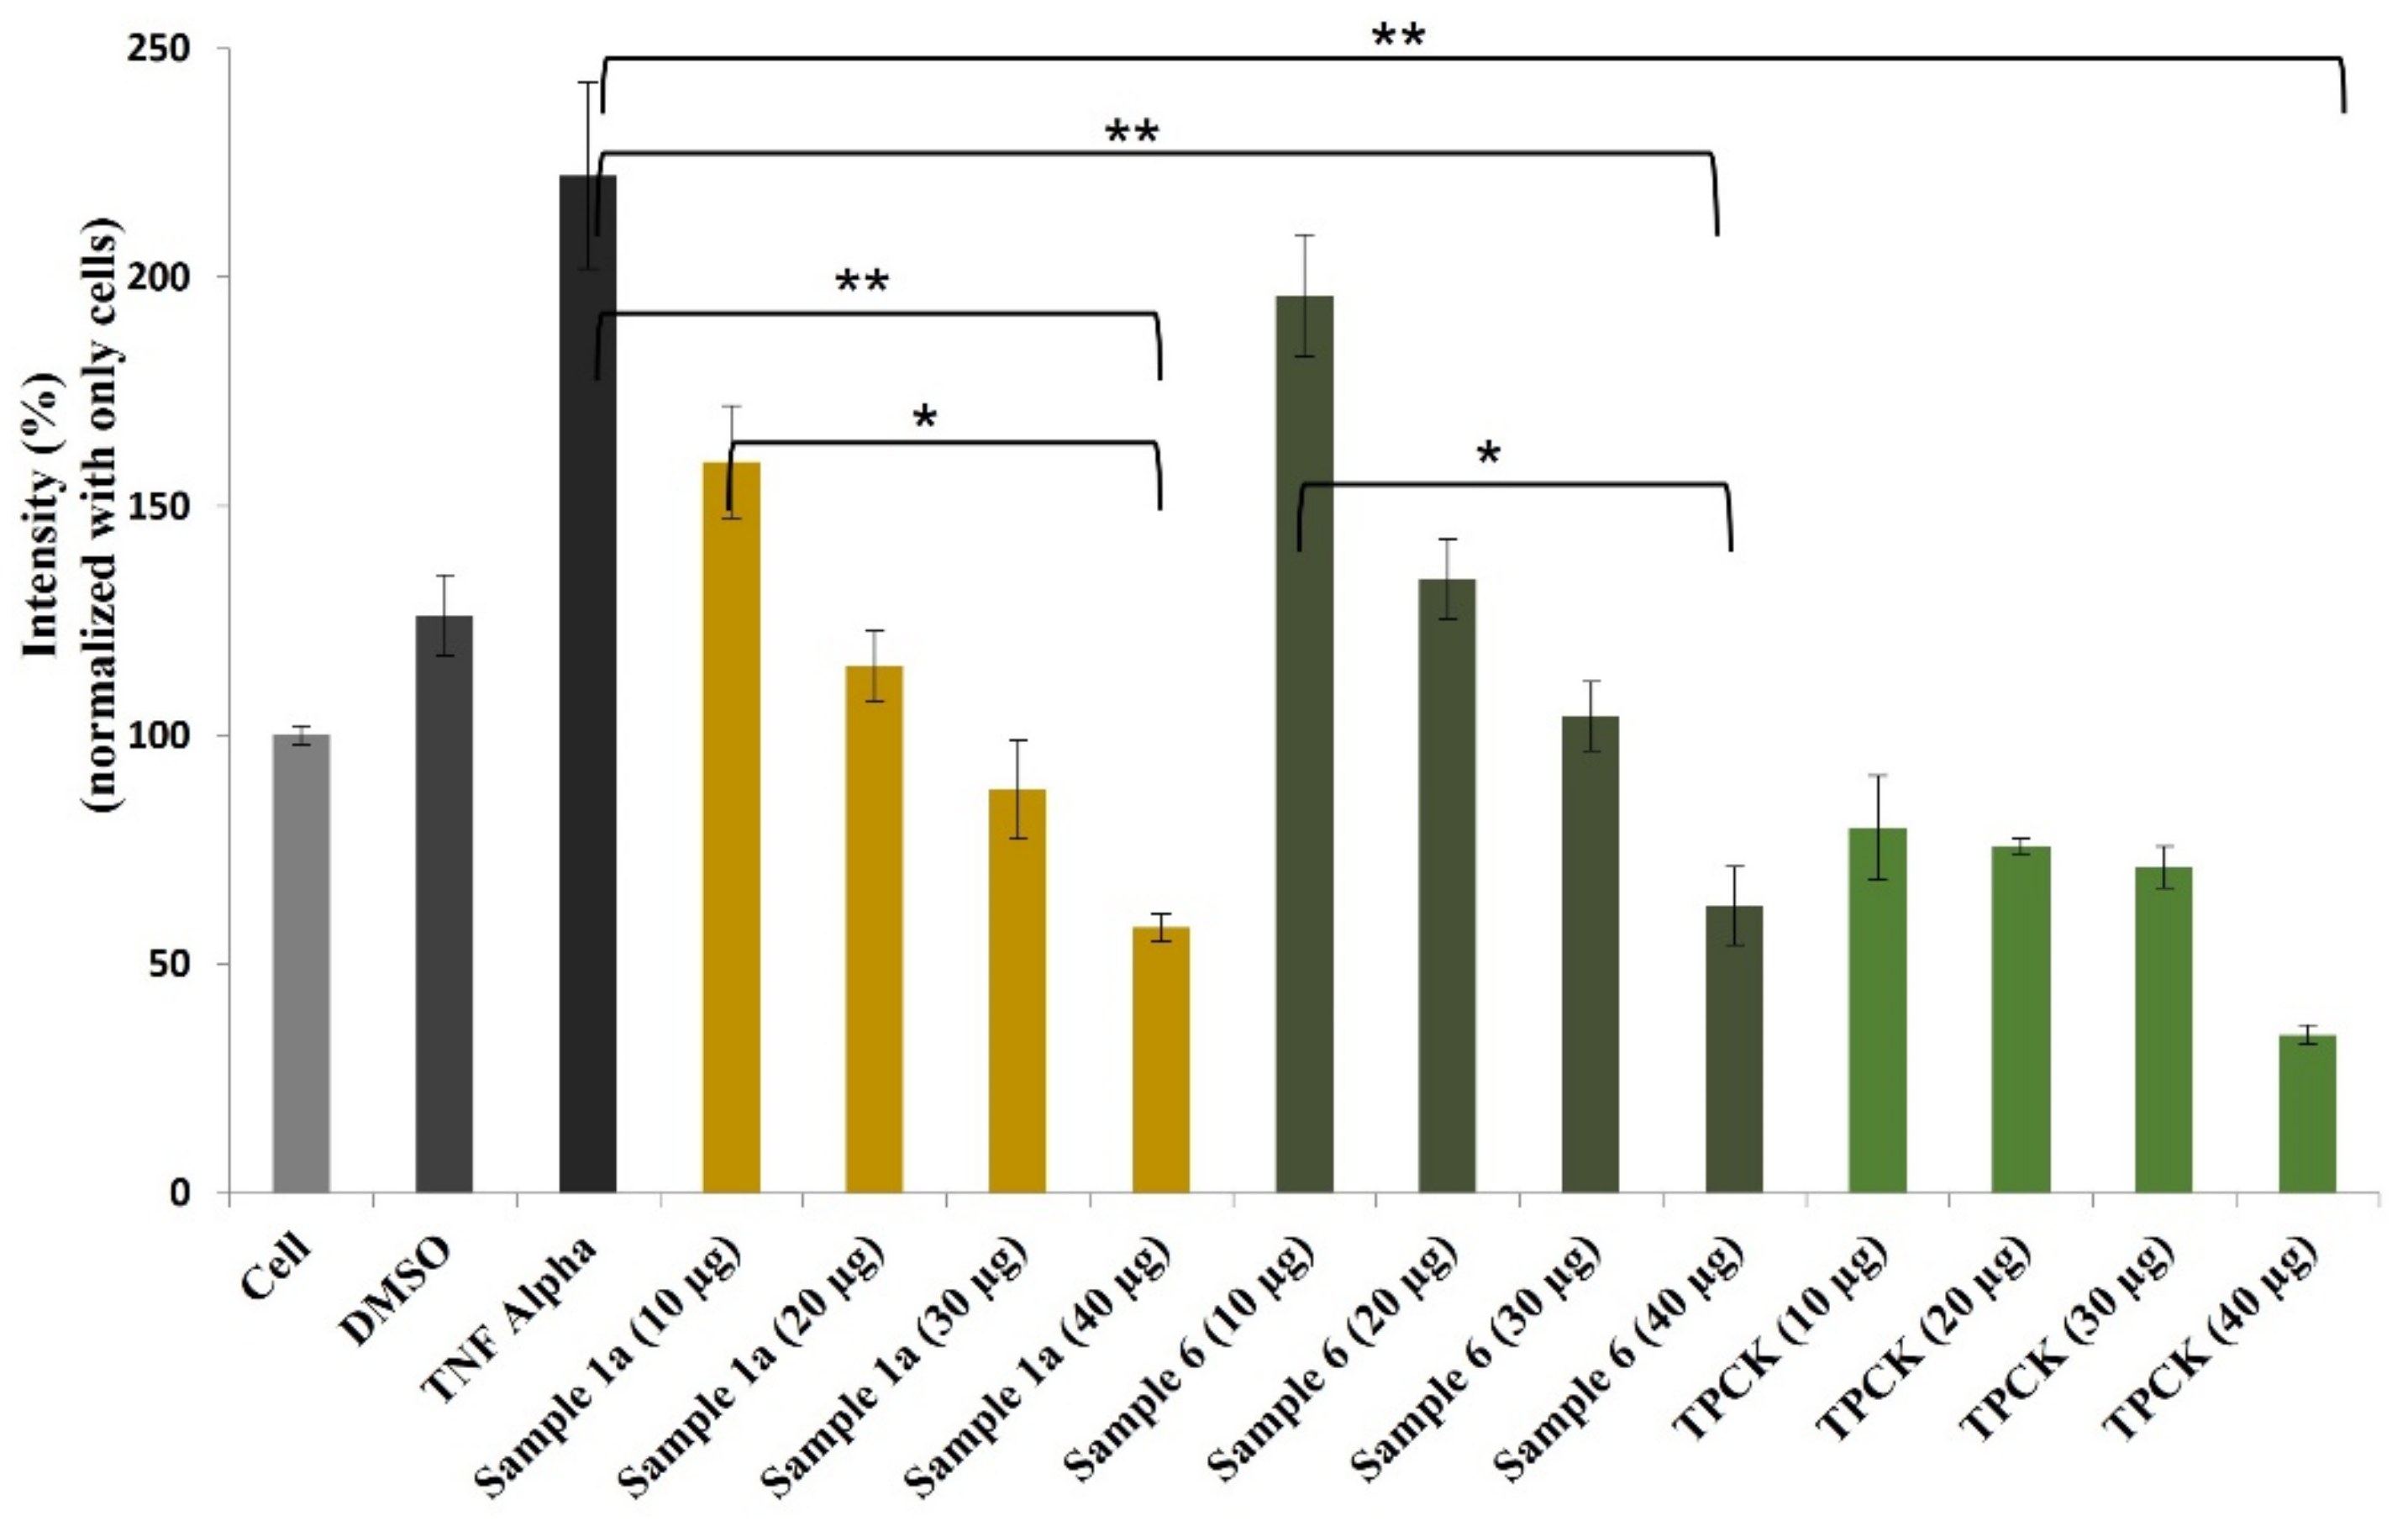
3.6. TNF-α Activated NF-κB Assay

Human embryonic kidney cells 293 (Panomic, Fremont, CA, USA) were employed for monitoring changes occurring in the NF-κB pathway [52]. Stable constructed cells were seeded into 96-well plates at 20 × 103 cells per well. Cells were maintained in Dulbecco’s modified Eagle’s medium (Invitrogen Co., Carlsbad, CA, USA), supplemented with 10% fetal bovine serum (FBS), 100 units/mL penicillin, 100 μg/mL streptomycin, and 2 mM L-glutamine. After 48 h of incubation, the medium was replaced with a fresh media containing different concentration of compounds (1a and 6) along with Tosyl phenylalanyl chloromethyl ketone (TPCK) as a positive control. TNF-α (recombinant, human, E. coli; Calbiochem, Gibbstown, NJ, USA) was used as an activator at a concentration of 2 ng/mL (0.14 nM). After 6 h incubated, the spent medium was discarded, and the cells were washed once with PBS. Cells were lysed using 50 μL (for 96-well plate) of Reporter Lysis Buffer from Promega, by incubating for 5 min on a shaker. The luciferase assay was performed using the Luc assay system (Promega). The gene product, luciferase enzyme, reacted with the luciferase substrate, emitting light that was detected using a luminometer (BioTek Synergy H1 Hybrid Multi-mode Microplate Reader, Winooski, VT, USA). All samples were tested in triplicates. Experiments were conducted in triplicates to ensure the reproducibility of the results.

3.7. Statistical Analysis

Data were analyzed using the GraphPad Prism version 8.0. Descriptive statistics were calculated for all relevant variables. One-way ANOVA with Tukey’s HSD test was used to compare the means of ROS and NF-κB inhibitory activity among and between compounds. The level of significance for all analyses was set at an alpha equal to 0.05.

4. Conclusions

A chemical investigation of the root of W. indica from Big Island, Hawaii, United States, yielded seven new coumarinolignans, walthindicins A–F (1a, 1b, 25, 7), together with five known compounds (6, 811). Except for compound 7, other compounds share the trans diaxial orientation between H-7′ and H-8′. Compounds 1a and 6 showed superior ROS inhibitory activity at 20 μg/mL in HeLa cells when compared with the positive control ascorbic acid. Compounds 1a and 6 showed moderate NF-κB inhibitory activity in a concentration-dependent manner in Luc-HEK-293 cells. Our findings identify natural products with antioxidant properties and provide evidence for the application of W. indica in the treatment of inflammatory-related diseases.

Supplementary Materials

The following supporting information can be downloaded at: https://www.mdpi.com/article/10.3390/molecules27103270/s1. Figures S1–S61: HRESIMS and NMR spectra for new compounds, low-energy conformers of compounds 2, 3 and 7, and experimental to calculated CD spectrum of compounds 2 and 3.

Author Contributions

F.L. performed the isolation and structure elucidation of the compounds. S.M. and A.D. did the bioactivity assay. T.J.O., Y.L., R.S. and P.G.W. performed the ECD calculations. R.R., M.W., S.W. and D.K.S. collected the plant. L.C.C. planned, designed and organized the whole research of this study. F.L., S.M., S.W. and L.C.C. wrote original draft. F.L., S.M., S.W., L.C.C., P.G.W. and M.W. reviewed and edited the manuscript. All authors have read and agreed to the published version of the manuscript.

Funding

This research was funded by the Hawaii Community Foundation Medical Research Program (No. 18CON-90817) and the United States Department of Agriculture (USDA) Extramural Agreement (No. NACA 58-2040-5-012). The research project was supported by the National Natural Science Foundation of China (No. 31900293). The APC was funded by United States Department of Agriculture (USDA) Extramural Agreement (No. NACA 58-2040-5-012).

Institutional Review Board Statement

Not applicable.

Informed Consent Statement

Not applicable.

Data Availability Statement

Not applicable.

Acknowledgments

We thank the Daniel K. Inouye College of Pharmacy for the research facility of the Mass Spectrometry and NMR Facility performed in this study. We thank the advanced computing resources provided by the University of Hawaii Information Technology Service Cyberinfrastructure. Dane Kaohelani Silva for donations in kind (e.g., plant materials used for experiments).

Conflicts of Interest

The authors declare no conflict of interest.

References

  1. Almeida, F.V.M.; Santos, J.C.; Silveira, F.A.O.; Fernandes, G.W. Distribution and frequency of galls induced by Anisodiplosis waltheriae Maia (Diptera: Cecidomyiidae) on the invasive plant Waltheria indica L. (Sterculiaceae). Neotrop. Entomol. 2006, 35, 435–439. [Google Scholar] [CrossRef] [PubMed] [Green Version]
  2. Jansen, O.; Angenot, L.; Tits, M.; Nicolas, J.P.; Mol, P.D.; Nikiéma, J.; Frédérich, M. Evaluation of 13 selected medicinal plants from Burkina Faso for their antiplasmodial properties. J. Ethnopharmacol. 2010, 130, 143–150. [Google Scholar] [CrossRef] [PubMed]
  3. Zongo, F.; Ribuot, C.; Boumendjel, A.; Guissou, I. Botany, traditional uses, phytochemistry and pharmacology of Waltheria indica L. (syn Waltheria americana): A review. J. Ethnopharmacol. 2013, 148, 14–26. [Google Scholar] [PubMed]
  4. Saunders, J.G. Sterculiaceae of Paraguay II. Waltheria. Bonplandia 2007, 16, 143–180. [Google Scholar] [CrossRef] [Green Version]
  5. Monteillier, A.; Cretton, S.; Ciclet, O.; Marcourt, L.; Ebrahimi, S.N.; Christen, P.; Cuendet, M. Cancer chemopreventive activity of compounds isolated from Waltheria indica. J. Ethnopharmacol. 2017, 203, 214–225. [Google Scholar] [CrossRef]
  6. Zongo, F.; Ribuot, C.; Boumendjel, A.; Guissou, I. Bioguidage search of active compounds from Waltheria indica L. (Malvaceae) used for asthma and inflammation treatment in Burkina Faso. Fundam. Clin. Pharmacol. 2014, 28, 323–330. [Google Scholar] [CrossRef]
  7. Laczko, R.; Chang, A.; Watanabe, L.; Petelo, M.; Csiszar, K. Anti-inflammatory activities of Waltheria indica extracts by modulating expression of IL-1B, TNF-α, TNFRII and NF-κB in human macrophages. Inflammopharmacology 2020, 28, 525–540. [Google Scholar] [CrossRef]
  8. Petrus, A.J.A. Polyphenolic components of Waltheria indica. Fitoterapia 1990, 61, 371. [Google Scholar]
  9. Rao, Y.K.; Fang, S.H.; Tzeng, Y.M. Inhibitory effects of the flavonoids isolated from Waltheria indica on the production of NO, TNF-α and IL-12 in activated macrophages. Biol. Pharm. Bull. 2005, 28, 912–915. [Google Scholar] [CrossRef] [Green Version]
  10. Maheswara, M.; Rao, Y.K.; Rao, V.M.; Rao, C.V. Antibacterial activity of acylated flavonol glycoside from Waltheria indica. Asian J. Chem. 2006, 18, 2761–2765. [Google Scholar]
  11. Ragasa, C.Y.; Cruz, C.; Chiong, I.; Tada, M.; Rideout, J. Antifungal flavonoids from Waltheria americana. Philipp. J. Sci. 1997, 126, 243–250. [Google Scholar]
  12. Hua, Y.M.; Zhang, X.W.; Zeng, K.W.; Zhang, Q.Y.; Tu, P.F. Chemical constituents from the aerial parts of Waltheria indica Linn. J. Chin. Pharm. Sci. 2019, 27, 468–475. [Google Scholar]
  13. Cretton, S.; Dorsaz, S.; Azzollini, A.; Favre-Godal, Q.; Marcourt, L.; Ebrahimi, S.N.; Voinesco, F.; Michellod, E.; Sanglard, D.; Gindro, K. Antifungal quinoline alkaloids from Waltheria indica. J. Nat. Prod. 2016, 79, 300–307. [Google Scholar] [CrossRef]
  14. Cretton, S.; Breant, L.; Pourrez, L.; Ambuehl, C.; Perozzo, R.; Marcourt, L.; Kaiser, M.; Cuendet, M.; Christen, P. Chemical constituents from Waltheria indica exert in vitro activity against Trypanosoma brucei and T. cruzi. Fitoterapia 2015, 105, 55–60. [Google Scholar] [CrossRef]
  15. Cretton, S.; Breant, L.; Pourrez, L.; Ambuehl, C.; Marcourt, L.; Ebrahimi, S.N.; Hamburger, M.; Perozzo, R.; Karimou, S.; Kaiser, M.; et al. Antitrypanosomal quinoline alkaloids from the roots of Waltheria indica. J. Nat. Prod. 2014, 77, 2304–2311. [Google Scholar] [CrossRef]
  16. Cheng, L.; Zhang, X.Y.; Zhang, M.; Zhang, P.; Song, Z.H.; Ma, Z.J.; Cheng, Y.Y.; Qu, H.B. Characterization of chemopreventive agents from the dichloromethane extract of Eurycorymbus cavaleriei by liquid chromatography–ion trap mass spectrometry. J. Chromatogr. A 2009, 1216, 4859–4867. [Google Scholar] [CrossRef]
  17. Begum, S.; Saxena, B.; Goyal, M.; Ranjan, R.; Joshi, V.B.; Rao, C.V.; Krishnamurthy, S.; Sahai, M. Study of anti-inflammatory, analgesic and antipyretic activities of seeds of Hyoscyamus niger and isolation of a new coumarinolignan. Fitoterapia 2010, 81, 178–184. [Google Scholar] [CrossRef]
  18. Chang, H.S.; Lin, C.H.; Hsiao, P.Y.; Peng, H.T.; Lee, S.J.; Cheng, M.J.; Chen, I.S. Bioactive composition of Reevesia formosana root and stem with cytotoxic activity potential. RSC Adv. 2017, 7, 27040–27047. [Google Scholar] [CrossRef] [Green Version]
  19. Ma, C.; Zhang, H.J.; Tan, G.T.; Hung, N.V.; Fong, H.H.S. Antimalarial compounds from Grewia bilamellata. J. Nat. Prod. 2006, 69, 346–350. [Google Scholar] [CrossRef]
  20. Sajeli, B.; Sahai, M.; Suessmuth, R.; Asai, T.; Hara, N.; Fujimoto, Y. Hyosgerin, a new optically active coumarinolignan, from the seeds of Hyoscyamus niger. Chem. Pharm. Bull. 2006, 54, 538–541. [Google Scholar] [CrossRef] [Green Version]
  21. Mándi, A.; Kurtán, T. Applications of OR/ECD/VCD to the structure elucidation of natural products. Nat. Prod. Rep. 2019, 36, 889–918. [Google Scholar] [CrossRef]
  22. Iqbal, K.; Anis, I.; Muhktar, N.; Malik, A.; Fatima, N.; Chaudhary, M.I. Phosphodiesterase inhibitory coumarinolignoids from Duranta repens. Heterocycles 2003, 60, 151–157. [Google Scholar]
  23. Arnoldi, A.; Arnone, A.; Merlini, L. Synthesis of the natural coumarinolignoids propacin and cleomiscosin A and B. An empirical spectroscopic method to distinguish regioisomers of natural benzodioxane lignoids. Heterocycles 1984, 22, 1537–1544. [Google Scholar]
  24. Wu, H.C.; Cheng, M.J.; Yen, C.H.; Chen, Y.; Chang, H.S. Chemical Constituents with GNMT-Promoter-Enhancing and NRF2-Reduction Activities from Taiwan Agarwood Excoecaria formosana. Molecules 2020, 25, 1746. [Google Scholar] [CrossRef] [Green Version]
  25. Begum, S.A.; Sahai, M.; Ray, A.B. Non-conventional lignans: Coumarinolignans, flavonolignans, and stilbenolignans. Prog. Chem. Org. Nat. Prod. 2010, 93, 1–70. [Google Scholar]
  26. Yin, H.L.; Li, J.H.; Li, J.; Li, B.; Chen, L.; Tian, Y.; Liu, S.J.; Zhang, T.; Dong, J.X. Four new coumarinolignoids from seeds of Solanum indicum. Fitoterapia 2013, 84, 360–365. [Google Scholar] [CrossRef]
  27. Arnoldi, A.; Camarda, L.; Merlini, L. Synthesis and sweet taste of some 2-phenylbenzodioxanes. J. Agric. Food Chem. 1986, 34, 339–344. [Google Scholar] [CrossRef]
  28. Bruhn, T.; Schaumlöffel, A.; Hemberger, Y. SpecDis, Version 1.63; University of Wuerzburg: Wurzburg, Germany, 2015.
  29. Patnam, R.; Kadali, S.S.; Koumaglo, K.H.; Roy, R. A chlorinated coumarinolignan from the African medicinal plant, Mondia whitei. Phytochemistry 2005, 66, 683–686. [Google Scholar] [CrossRef]
  30. Bai, B.; Gu, X.W.; Chen, Y.; Guan, F.Q.; Feng, X. Virginicin, a new naphthalene from Kosteletzkya virginica (Malvaceae). J. Braz. Chem. Soc. 2015, 26, 723–728. [Google Scholar]
  31. Bhandari, P.; Pant, P.; Rastogi, R.P. Aquillochin, a coumarinolignan from Aquilaria agallocha. Phytochemistry 1982, 21, 2147–2149. [Google Scholar] [CrossRef]
  32. Baker, R.G.; Hayden, M.S.; Ghosh, S. NF-kappaB, inflammation, and metabolic disease. Cell Metab. 2011, 13, 11–22. [Google Scholar] [CrossRef] [PubMed] [Green Version]
  33. Karin, M.; Greten, F.R. FRNF-B: Linking inflammation and immunity to cancer development and progression. Nat. Rev. Immunol. 2005, 5, 749–759. [Google Scholar] [CrossRef] [PubMed]
  34. Lawrence, T. The nuclear factor NF-κB pathway in Inflammation. Cold Spring Harb. Perspect. Biol. 2009, 1, a001651. [Google Scholar] [CrossRef] [PubMed] [Green Version]
  35. Marcu, K.B.; Otero, M.; Olivotto, E.; Borzi, R.M.; Goldring, M.B. NF-kappaB signaling: Multiple angles to target OA. Curr. Drug Targets 2010, 11, 599–613. [Google Scholar] [CrossRef]
  36. Higuchi, Y.; Otsu, K.; Nishida, K.; Hirotani, S.; Nakayama, H.; Yamaguchi, O.; Matsumura, Y.; Ueno, H.; Tada, M.; Hori, M. Involvement of reactive oxygen species-mediated NF-κB activation in TNF-α-induced cardiomyocyte hypertrophy. J. Mol. Cell. Cardiol. 2002, 34, 233–240. [Google Scholar] [CrossRef]
  37. Li, Z.Q.; Scheraga, H.A. Monte carlo-minimization approach to the multiple-minima problem in protein folding. Proc. Natl. Acad. Sci. USA 1987, 84, 6611–6615. [Google Scholar] [CrossRef] [Green Version]
  38. Kaminski, G.A.; Friesner, R.A.; Tirado-Rives, J.; Jorgensen, W.L. Evaluation and reparametrization of the OPLS-AA force field for proteins via comparison with accurate quantum chemical calculations on peptides. J. Phys. Chem. B 2001, 105, 6474–6487. [Google Scholar] [CrossRef]
  39. Schrödinger Release 2020-4; MacroModel. Schrödinger, LLC: New York, NY, USA, 2020.
  40. Frisch, M.J.; Trucks, G.W.; Schlegel, H.B.; Scuseria, G.E.; Robb, M.A.; Cheeseman, J.R.; Scalmani, G.; Barone, V.; Mennucci, B.; Petersson, G.A.; et al. Gaussian 09, Revision, B.01; Gaussian Inc.: Wallingford, CT, USA, 2009.
  41. Yanai, T.; Tew, D.P.; Handy, N.C. A new hybrid exchange-correlation functional using the Coulomb-attenuating method (CAM-B3LYP). Chem. Phys. Lett. 2004, 393, 51–57. [Google Scholar] [CrossRef] [Green Version]
  42. Clark, T.; Chandrasekhar, J.; Spitznagel, G.W.; Schleyer, P.V.R. Efficient diffuse function-augmented basis sets for anion calculations. III. The 3-21+G basis set for first-row elements, Li–F. J. Comput. Chem. 1983, 4, 294–301. [Google Scholar] [CrossRef]
  43. Ditchfield, R.; Hehre, W.J.; Pople, J.A. Self-consistent molecular-orbital methods. IX. An extended gaussian-type basis for molecular-orbital studies of organic molecules. J. Chem. Phys. 1971, 54, 724–728. [Google Scholar] [CrossRef]
  44. Hehre, W.J.; Ditchfield, R.; Pople, J.A. Self-consistent molecular orbital methods. XII. Further extensions of gaussian—Type basis sets for use in molecular orbital studies of organic molecules. J. Chem. Phys. 1972, 56, 2257–2261. [Google Scholar] [CrossRef]
  45. Hariharan, P.C.; Pople, J.A. The influence of polarization functions on molecular orbital hydrogenation energies. Theor. Chim. Acta 1973, 28, 213–222. [Google Scholar] [CrossRef]
  46. Tomasi, J.; Mennucci, B.; Cammi, R. Quantum mechanical continuum solvation models. Chem. Rev. 2005, 105, 2999–3094. [Google Scholar] [CrossRef]
  47. Runge, E.; Gross, E.K.U. Density-functional theory for time-dependent systems. Phys. Rev. Lett. 1984, 52, 997–1000. [Google Scholar] [CrossRef]
  48. Gross, E.K.U.; Dobson, J.F.; Petersilka, M. Density functional theory of time-dependent phenomena. Top. Curr. Chem. 1996, 181, 81–159. [Google Scholar]
  49. Grauso, L.; Teta, R.; Esposito, G.; Menna, M.; Mangoni, A. Computational prediction of chiroptical properties in structure elucidation of natural products. Nat. Prod. Rep. 2019, 36, 1005–1030. [Google Scholar] [CrossRef]
  50. Weigend, F.; Ahlrichs, R. Balanced basis sets of split valence, triple zeta valence and quadruple zeta valence quality for H to Rn: Design and assessment of accuracy. Phys. Chem. Chem. Phys. 2005, 7, 3297–3305. [Google Scholar] [CrossRef]
  51. Tian, L.; Chen, F. Multiwfn: A multifunctional wavefunction analyzer. J. Comput. Chem. 2012, 33, 580–592. [Google Scholar]
  52. Youn, U.J.; Park, E.J.; Kondratyuk, T.P.; Sang-Ngern, M.; Wall, M.M.; Wei, Y.Z.; Pezzuto, J.M.; Chang, L.C. Anti-inflammatory and quinone reductase inducing compounds from fermented noni (Morinda citrifolia) juice exudates. J. Nat. Prod. 2016, 79, 1508–1513. [Google Scholar] [CrossRef]
Figure 1. Structures of compounds 1a11 from the roots of Waltheria indica.
Molecules 27 03270 g001
Figure 2. Key 1H-1H COSY and HMBC correlations of compounds 1 and 5.
Molecules 27 03270 g002
Figure 3. Experimental UV and ECD spectra (CHCl3) of compounds 1a, 1b, 2 and 3.
Molecules 27 03270 g003
Figure 4. Orbitals involved in the excited states for the lowest energy conformer of 1a.
Molecules 27 03270 g004
Figure 5. Experimental ECD to calculated ECD spectra for 1a and 1b.
Molecules 27 03270 g005
Figure 6. Conformer 1 (29.5%) vs. conformer 3 (8.9%) for 7 determined by TDDFT calculations.
Molecules 27 03270 g006
Figure 7. Experimental to calculated ECD spectra for 7.
Molecules 27 03270 g007
Figure 8. Effects of compounds 1a11 (20 µg/mL) against ROS production in HeLa cells. Results are expressed as mean ± SD., ** p < 0.01 control group Cell + H2O2 versus samples.
Molecules 27 03270 g008
Figure 9. Effects of compounds 1a and 6 against NF-κB production in Luc-HEK-293 cells. Results are expressed as mean ± SD. * p < 0.05, ** p < 0.01 control group Cell + TNF alpha versus samples.
Molecules 27 03270 g009
Table 1. 1H NMR (400 MHz) Data for Compounds 1a5 and 7 (δ in ppm, J in Hz).
Position1a a1b a2 b3 a4 b5 a7 a
36.17, d (9.6)6.18, d (9.6)6.16, d (9.6)6.18, d (9.6)6.16, d (9.6)6.28, d (9.5)6.29, d (9.5)
47.90, d (9.6)7.90, d (9.6)7.96, d (9.6)7.92, d (9.6)7.98, d (9.6)7.58, d (9.5)7.59, d (9.5)
5 6.53, (s)6.53, (s)
86.50, (s)6.51, (s)6.62, (s)6.52, (s)6.63, (s)
2′6.89, d (1.5)6.90, (brs)7.06, d (1.4)6.65, (s)6.74, (s)6.58, (s)6.86, d (2.0)
5′6.95, d (8.0)6.96, d (8.2)7.01, d (8.2) 6.81, d (8.3)
6′6.94, dd (1.5, 8.0)6.95, d (8.2)7.03, dd (1.4, 8.2)6.65, (s)6.74, (s)6.58, (s)6.92, dd (2.0, 8.3)
7′5.03, d (8.0)5.04, d (8.0)5.07, d (8.0)5.05, d (8.0)4.70, d (8.0)4.91, d (7.4)5.34, d (2.9)
8′3.98, ddd (2.9, 3.5, 8.0)3.99, (m)4.08, ddd (2.4, 4.0, 8.0)4.00, (m)4.19, dq (8.0, 6.4)4.36, (m)4.63, ddd (2.9, 4.0, 8.3)
9′3.55, dd (3.5, 12.8)
3.88, dd (2.9, 12.8)
3.56, dd (3.4, 12.5)
3.89, (m)
3.49, dd (4.0, 12.5)
3.78, dd (2.4, 12.5)
3.58, dd (3.0, 12.5)
3.97, (m)
1.22, d (6.4)4.07, dd (5.4, 13.3)
4.35, (m)
3.57, dd (4.0, 12.3)
3.79, dd (8.3, 12.3)
Ac-9′ 2.05 (s)
OCH3-5 3.90 (s)3.87 (s)
OCH3-73.92 (s)3.93 (s)3.93 (s)3.93 (s)3.93 (s)
OCH3-3′3.90 (s)3.91 (s)3.85 (s)3.87 (s)3.87 (s)3.87 (s)3.82 (s)
OCH3-4′ 3.86 (s)3.86 (s) 3.83 (s)
OCH3-5′ 3.87 (s)3.87 (s)3.87 (s)
a Compounds 1a, 1b, 3, 5 and 7 were measured in CDCl3. b Compounds 2 and 4 were measured in MeOD.
Table 2. 13C NMR (100 MHz) Data for Compounds 1a5 and 7 (δC in ppm, type).
Position1a a1b a2 b3 a4 b5 a7 a
2161.7, C161.7, C163.8, C161.6, C163.9, C160.8, C160.9, C
3112.3, CH112.3, CH112.4, CH112.4, CH112.3, CH114.6, CH114.5, CH
4138.3 CH138.3 CH140.0, CH138.1, CH140.2, CH143.8, CH144.0, CH
5140.0, C140.0, C141.4, C139.8, C141.5, C100.9, CH101.0, CH
6129.6, C129.6, C131.4, C129.6, C131.2, C146.0, C146.1, C
7152.4, C152.4, C154.4, C152.4, C154.3, C136.8, C137.0, C
893.1, CH93.1, CH94.0, CH93.2, CH93.9, CH132.7, C130.9, C
9149.9, C149.9, C150.9, C149.9, C150.8, C139.2, C139.3, C
10103.7, C103.7, C104.7, C103.7, C104.7, C112.0, C112.0, C
1′127.4, C127.4, C130.1, C131.1, C128.4, C125.8, C127.6, C
2′109.9, CH109.8, CH112.5, CH104.6, CH106.3, CH104.6, CH110.2, CH
3′147.1, C147.1, C150.9, C153.9, C149.7, C147.6, C149.4, C
4′146.8, C146.8, C151.4, C138.9, C137.8, C136.1, C149.7, C
5′115.0, CH115.0, CH113.1, CH153.9, C149.7, C147.6, C111.6, CH
6′121.0, CH121.0, CH121.8, CH104.6, CH106.3, CH104.6, CH119.4, CH
7′77.3, CH77.3, CH78.6, CH77.3, CH83.4, CH76.7, CH76.4, CH
8′78.5, CH78.5, CH79.8, CH78.3, CH75.4, CH76.2, CH77.6, CH
9′61.6, CH261.6, CH262.0, CH261.5, CH217.5, CH363.0, CH260.0, CH2
Ac-9′ 170.6, C
Ac-9′ 21.0, CH3
OCH3-5 56.7, CH356.6, CH3
OCH3-756.7, CH356.5, CH357.2, CH356.7, CH357.1, CH3
OCH3-3′56.3, CH356.3, CH356.7, CH356.5, CH357.1, CH356.7, CH356.3, CH3
OCH3-4′ 56.6, CH361.1, CH3 56.1, CH3
OCH3-5′ 56.5, CH357.1, CH356.7, CH3
a Compounds 1a, 1b, 3, 5 and 7 were measured in CDCl3. b Compounds 2 and 4 were measured in MeOD.
Publisher’s Note: MDPI stays neutral with regard to jurisdictional claims in published maps and institutional affiliations.

