
Development of a Microsphere-Based Immunoassay Authenticating A2 Milk and Species Purity in the Milk Production Chain

 , , and
Abstract
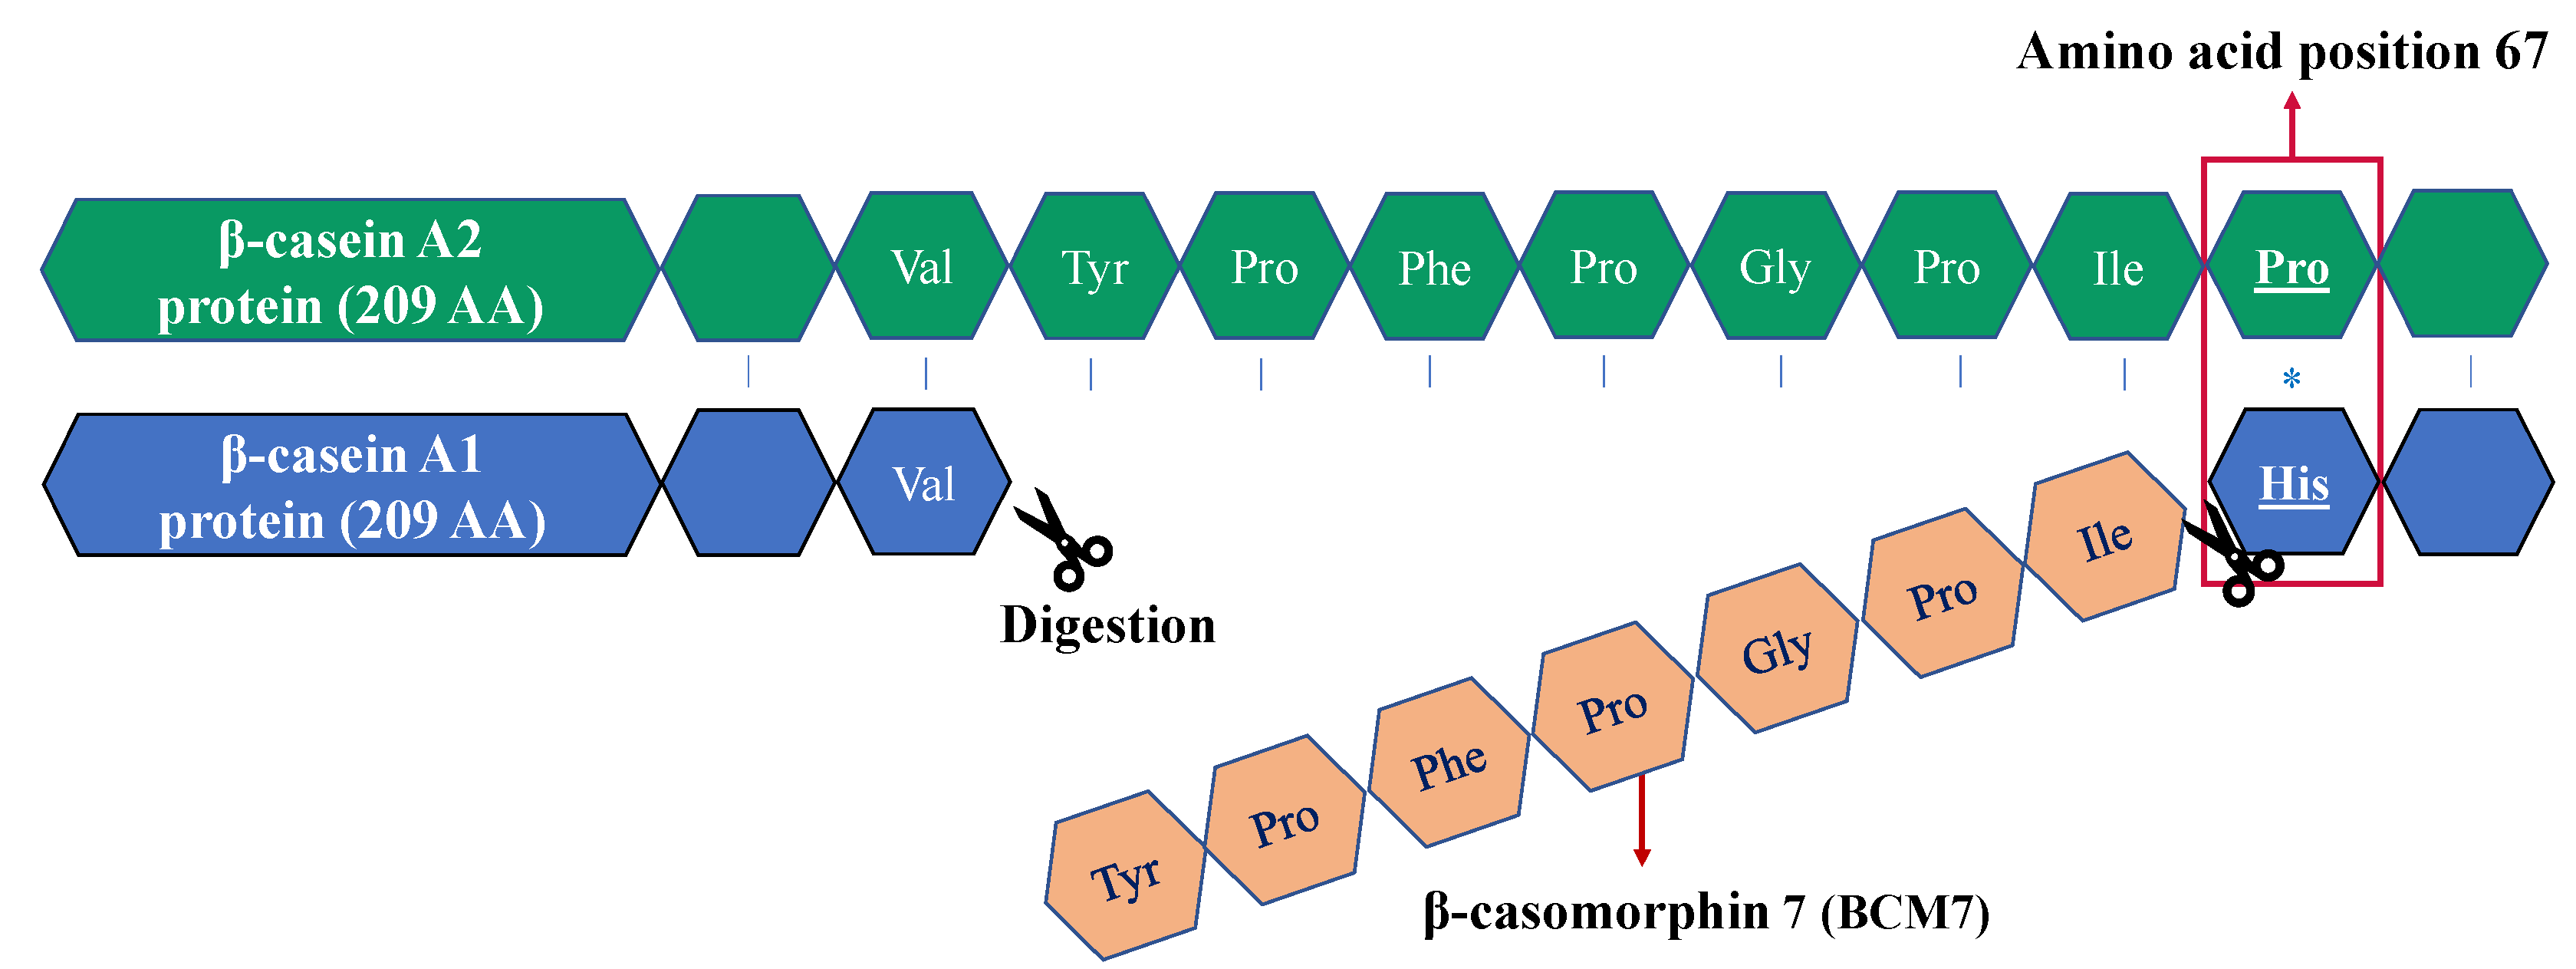
:1. Introduction
2. Results and Discussion
2.1. General
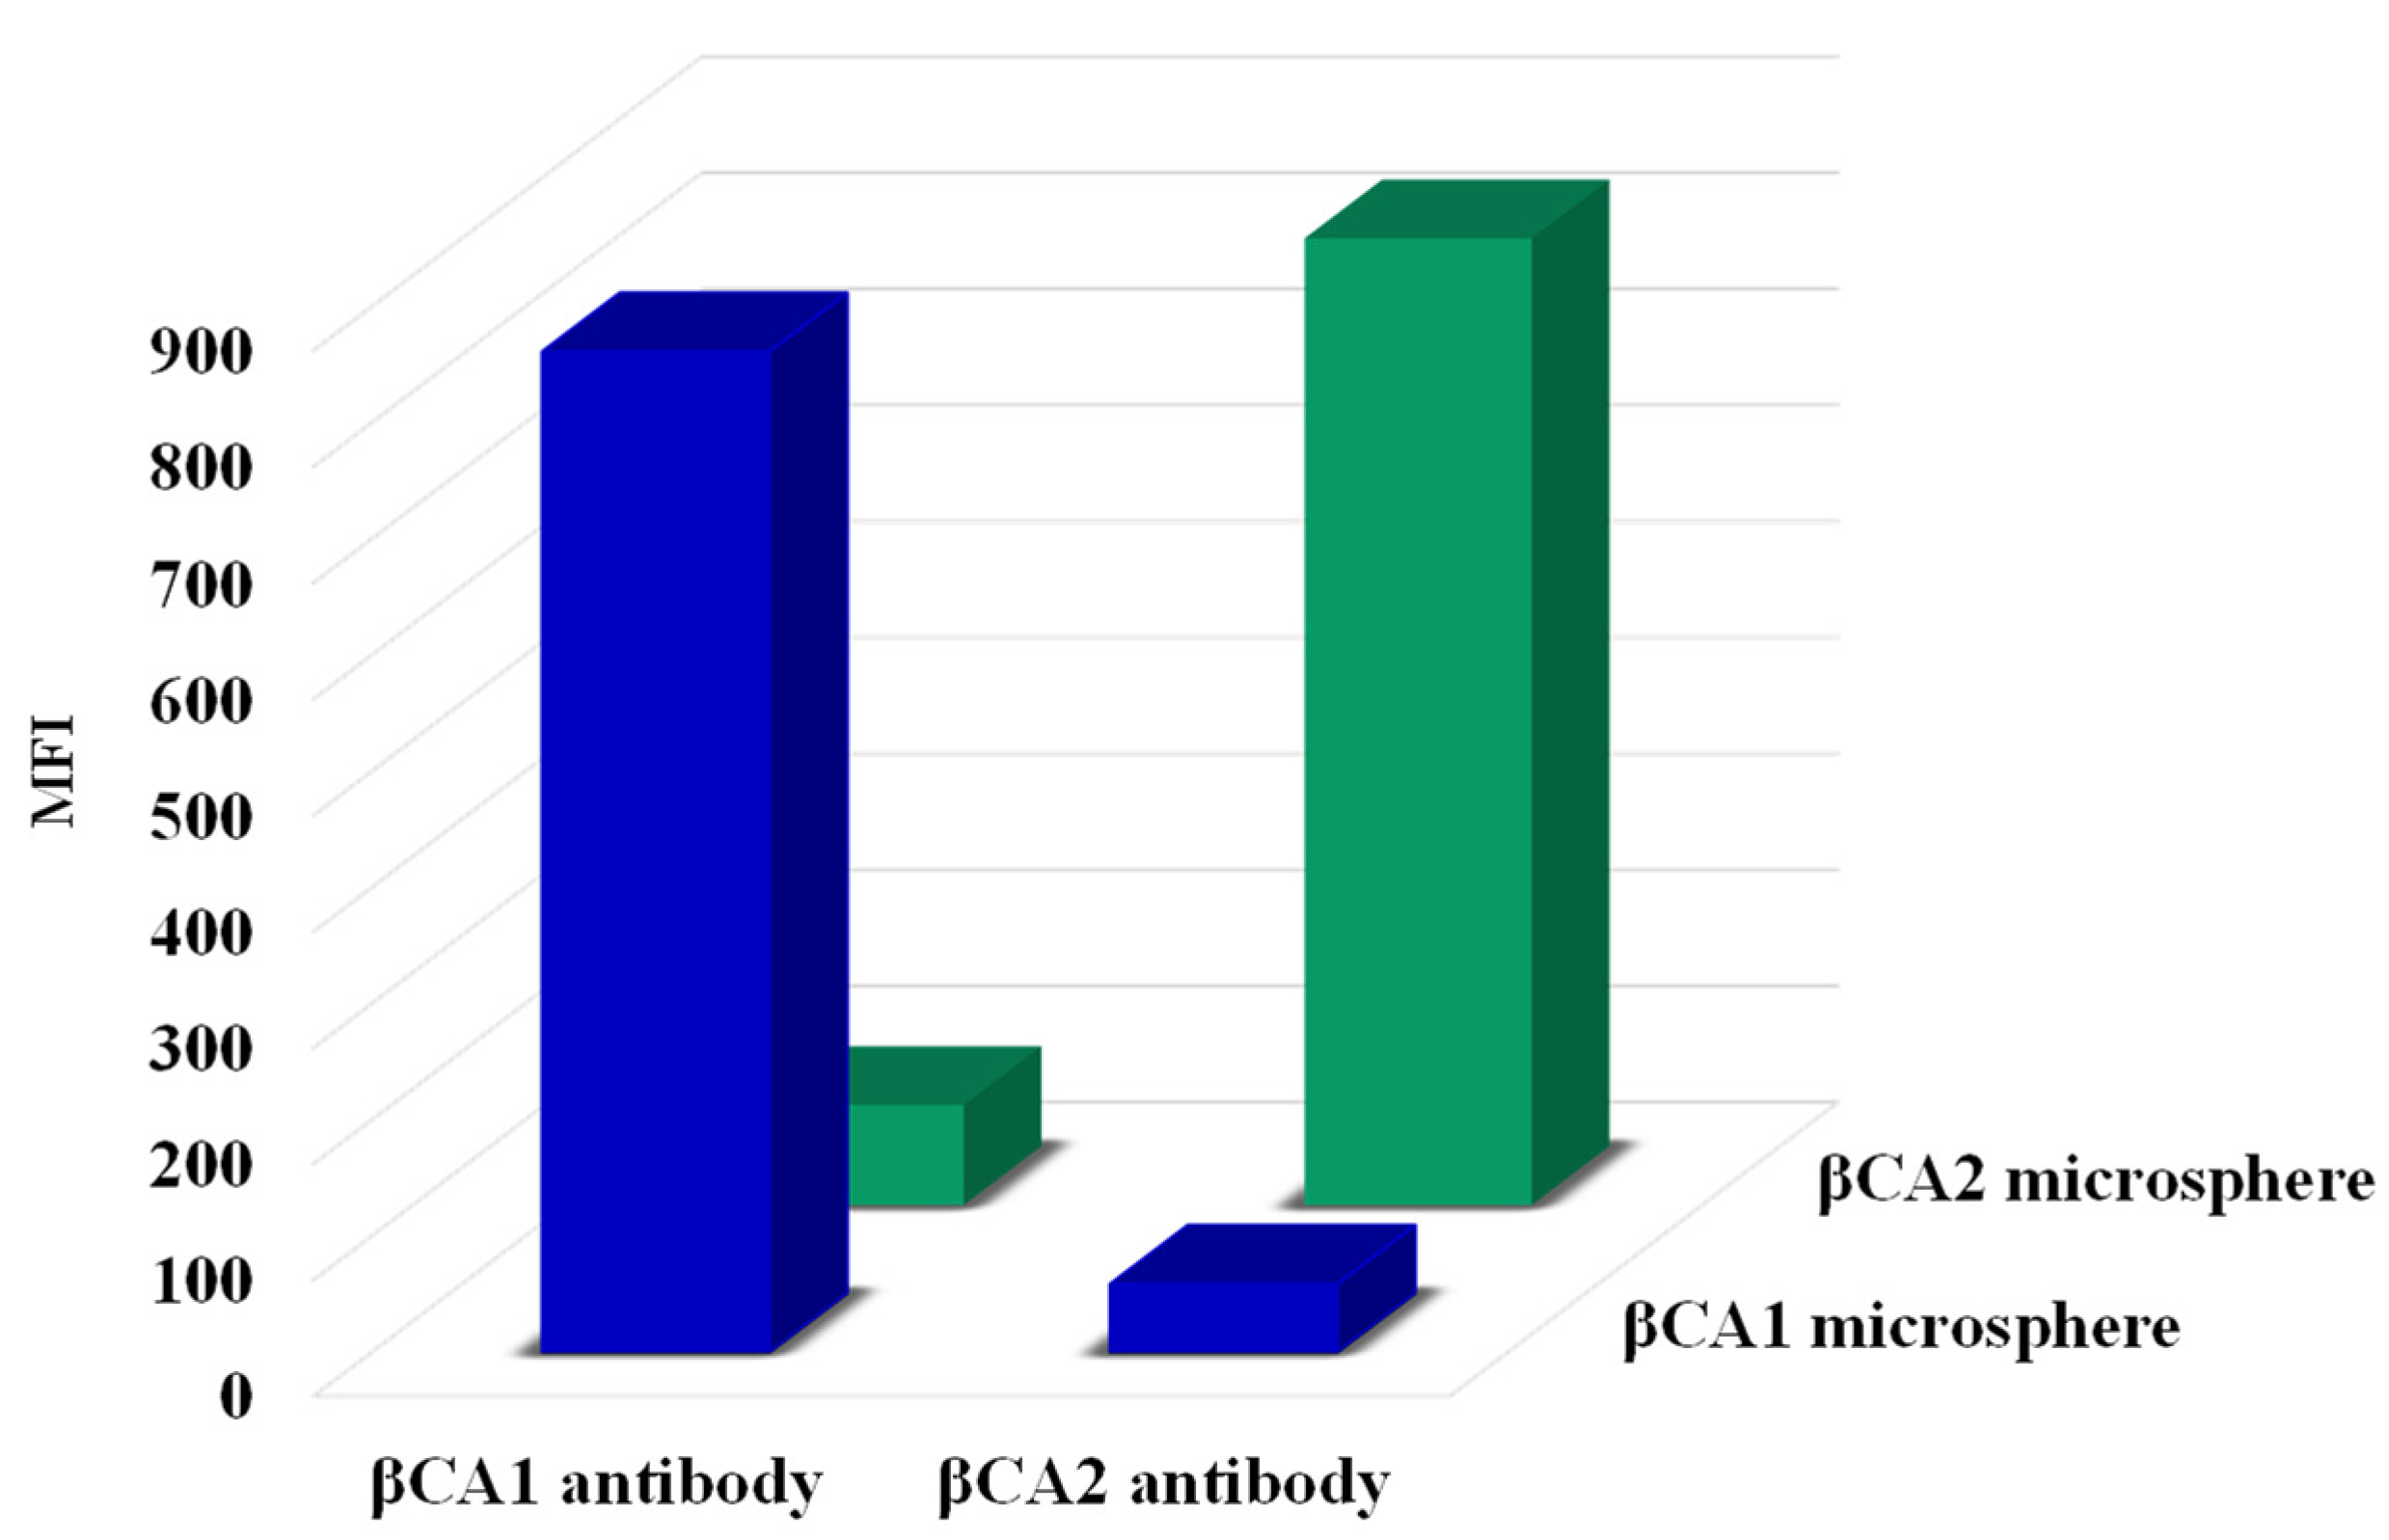
2.2. Antibody Specificity
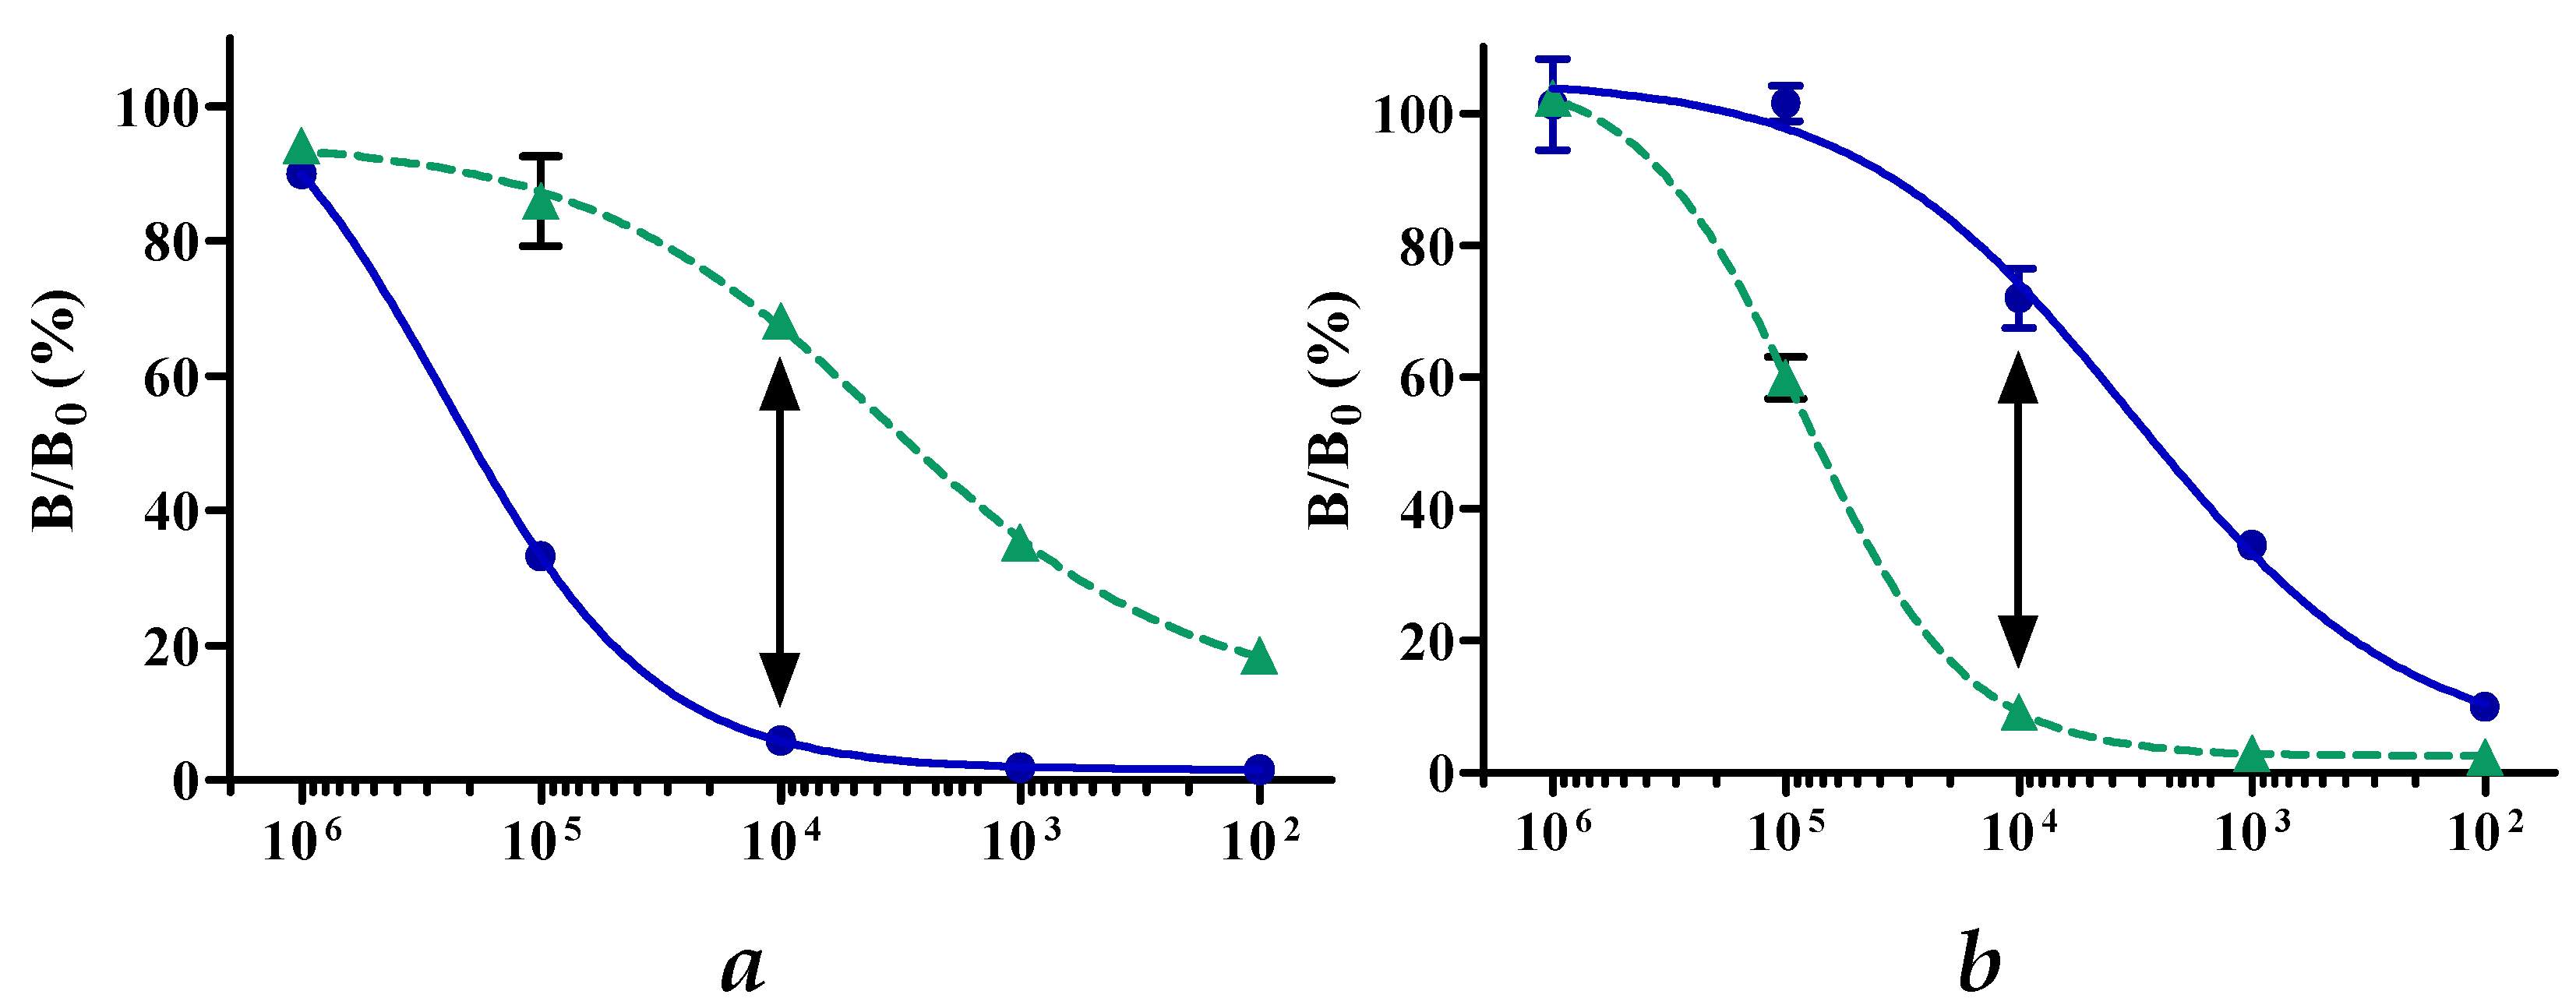
2.3. Determination of Optimal Milk Sample Dilution
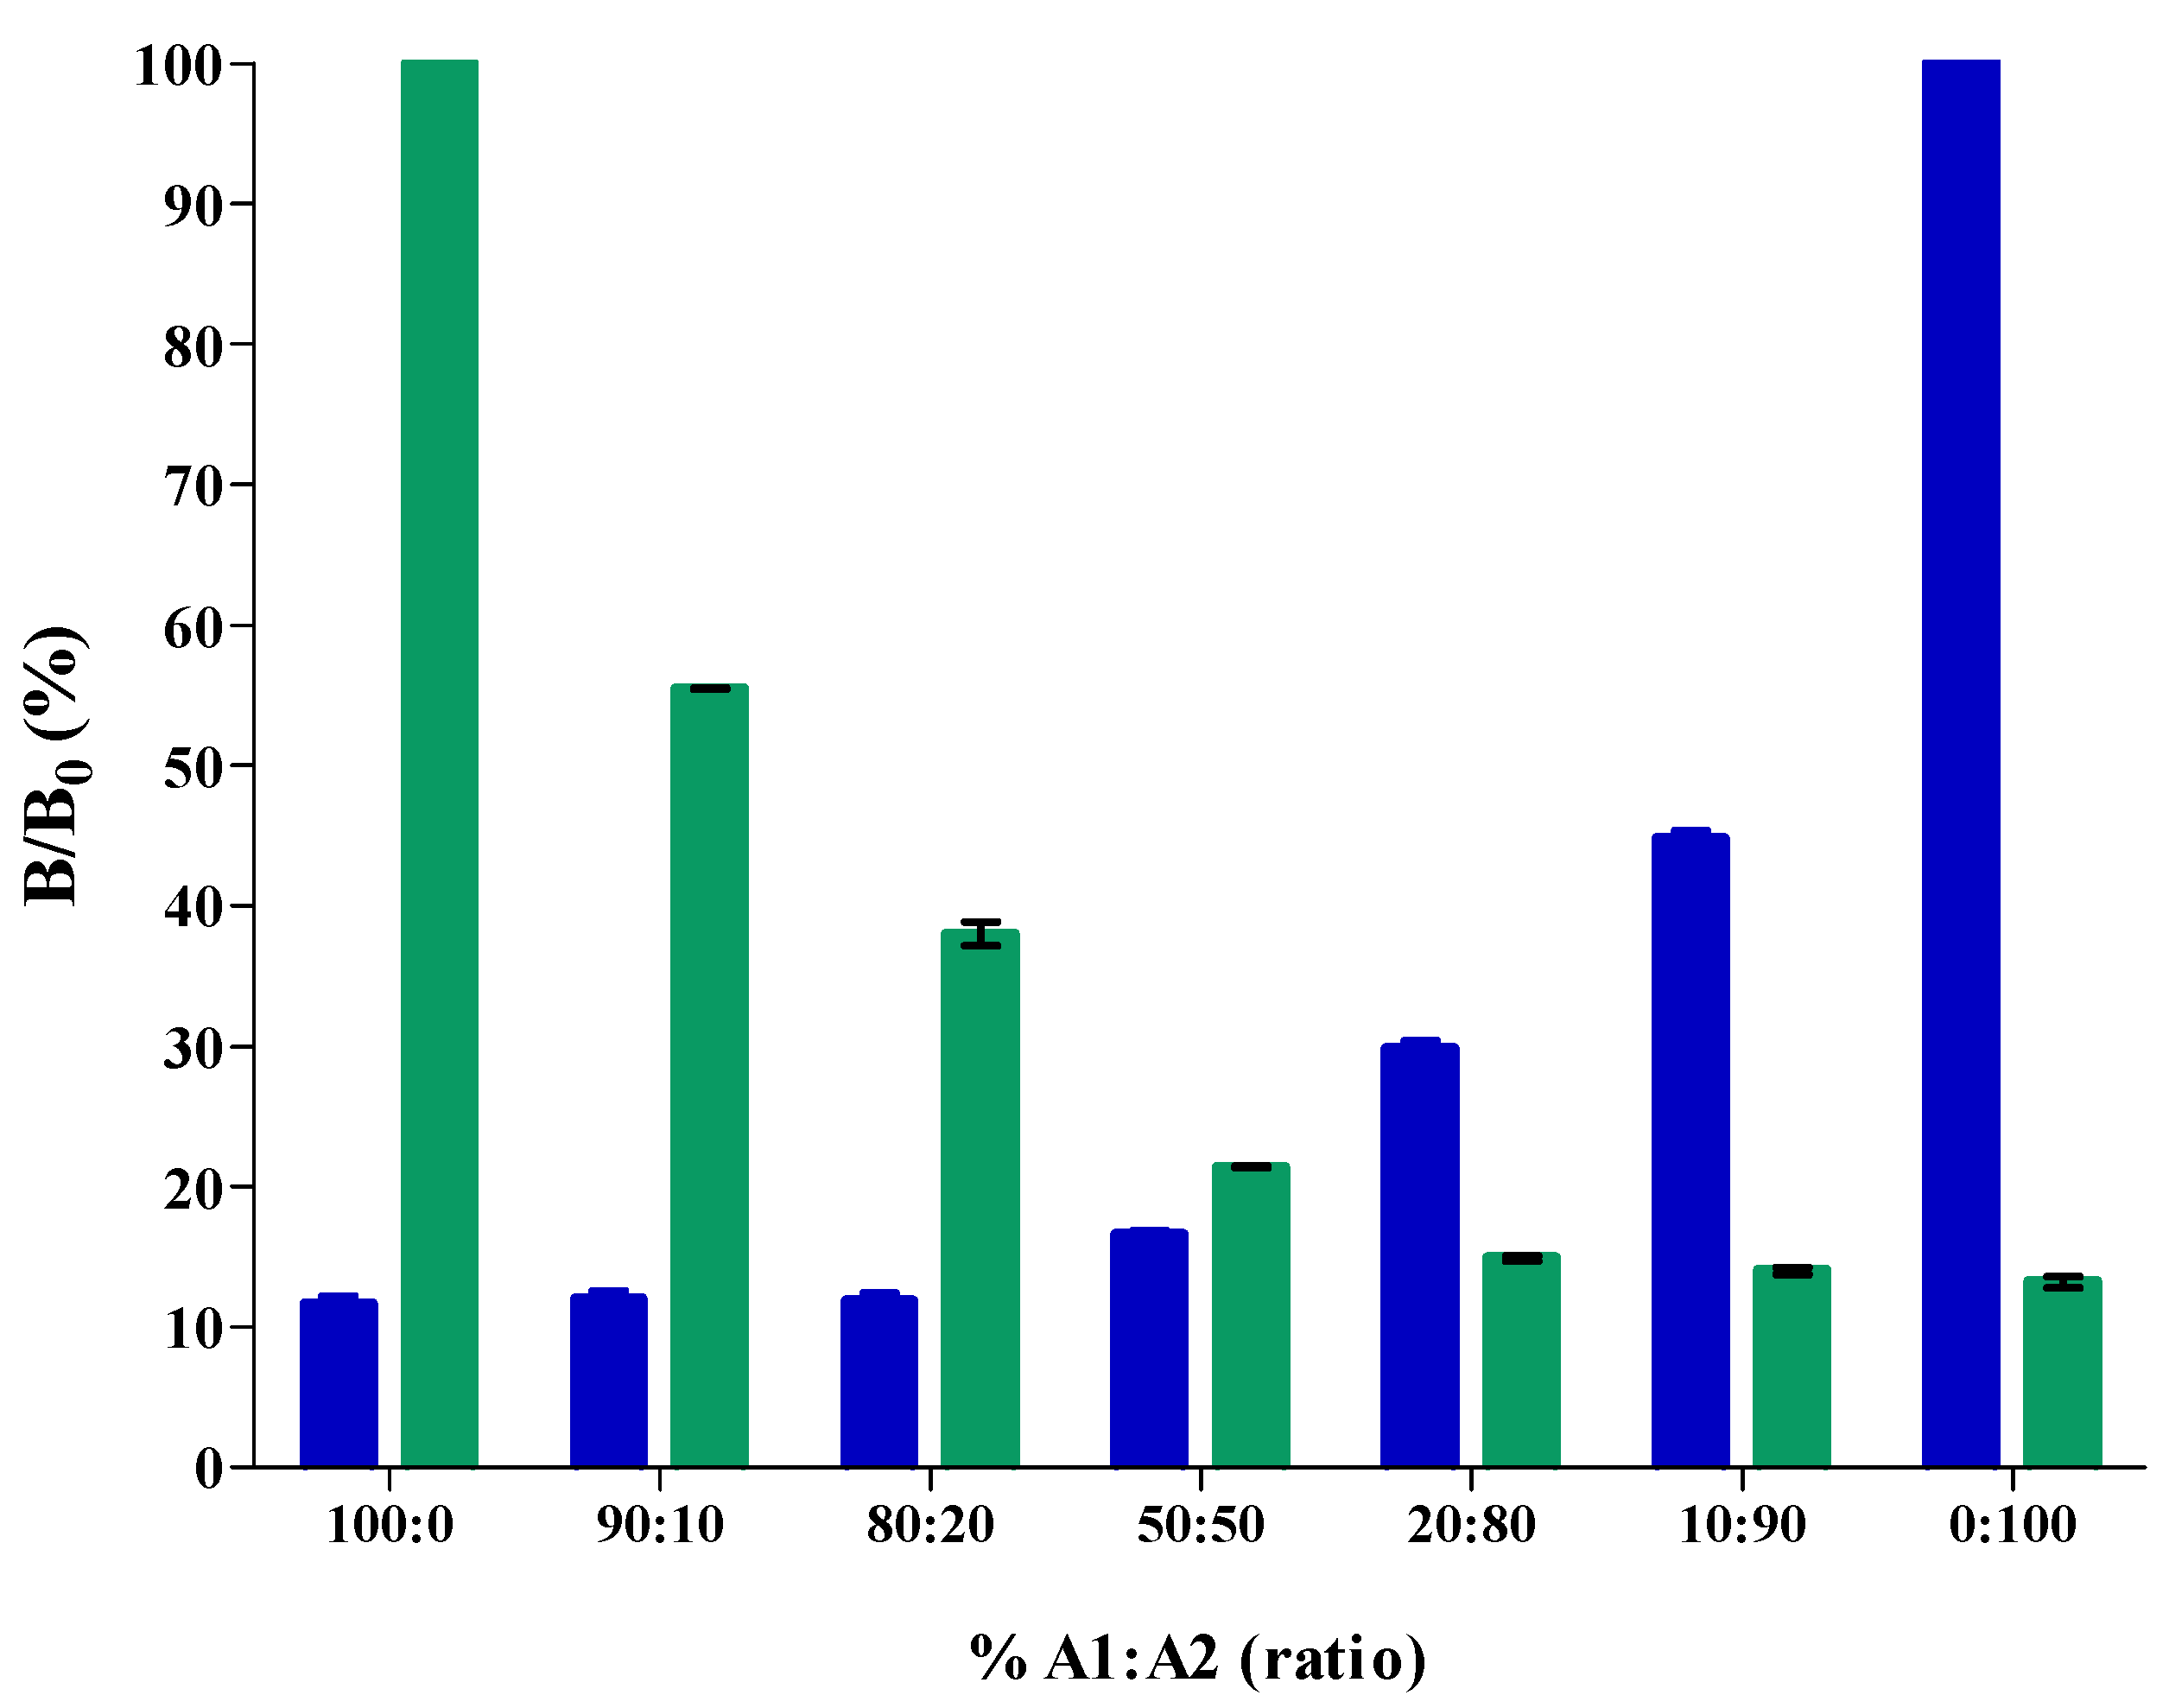
2.4. Application of the cMIA to A1A1/A2A2 Mixed Raw Milk Samples
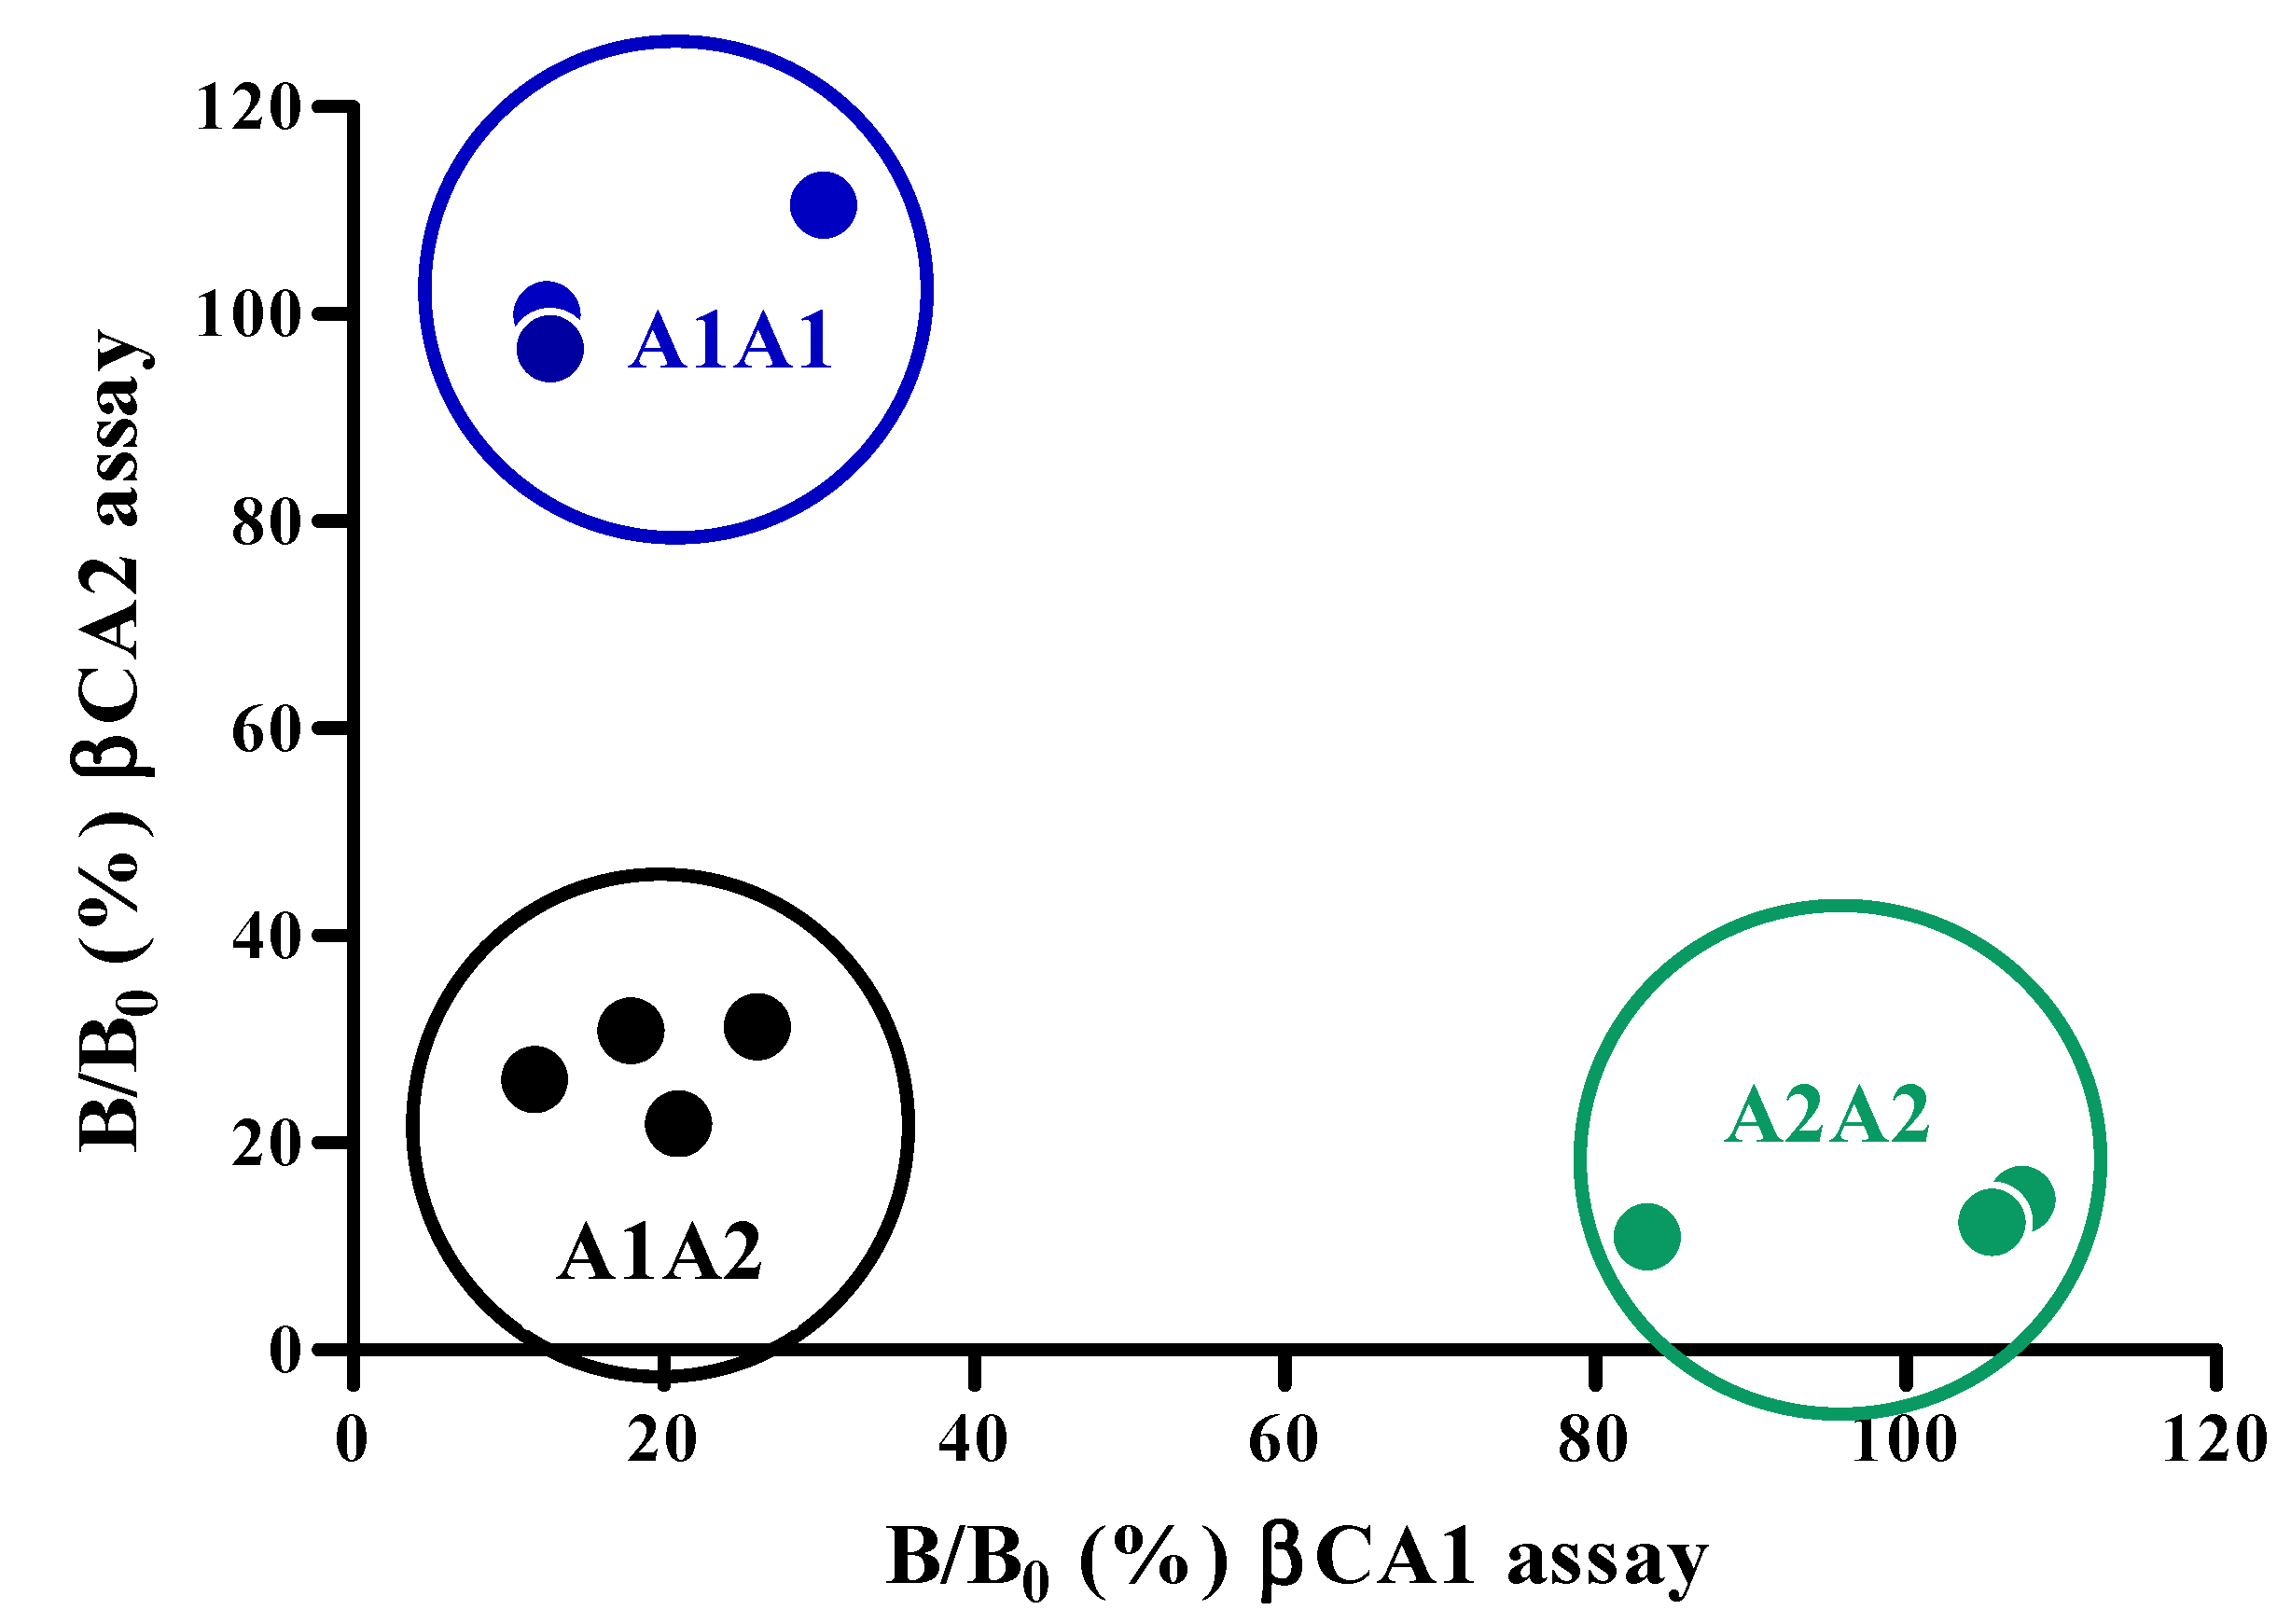
2.5. Application to Supermarket- and β-Casein Phenotyped Milk Samples
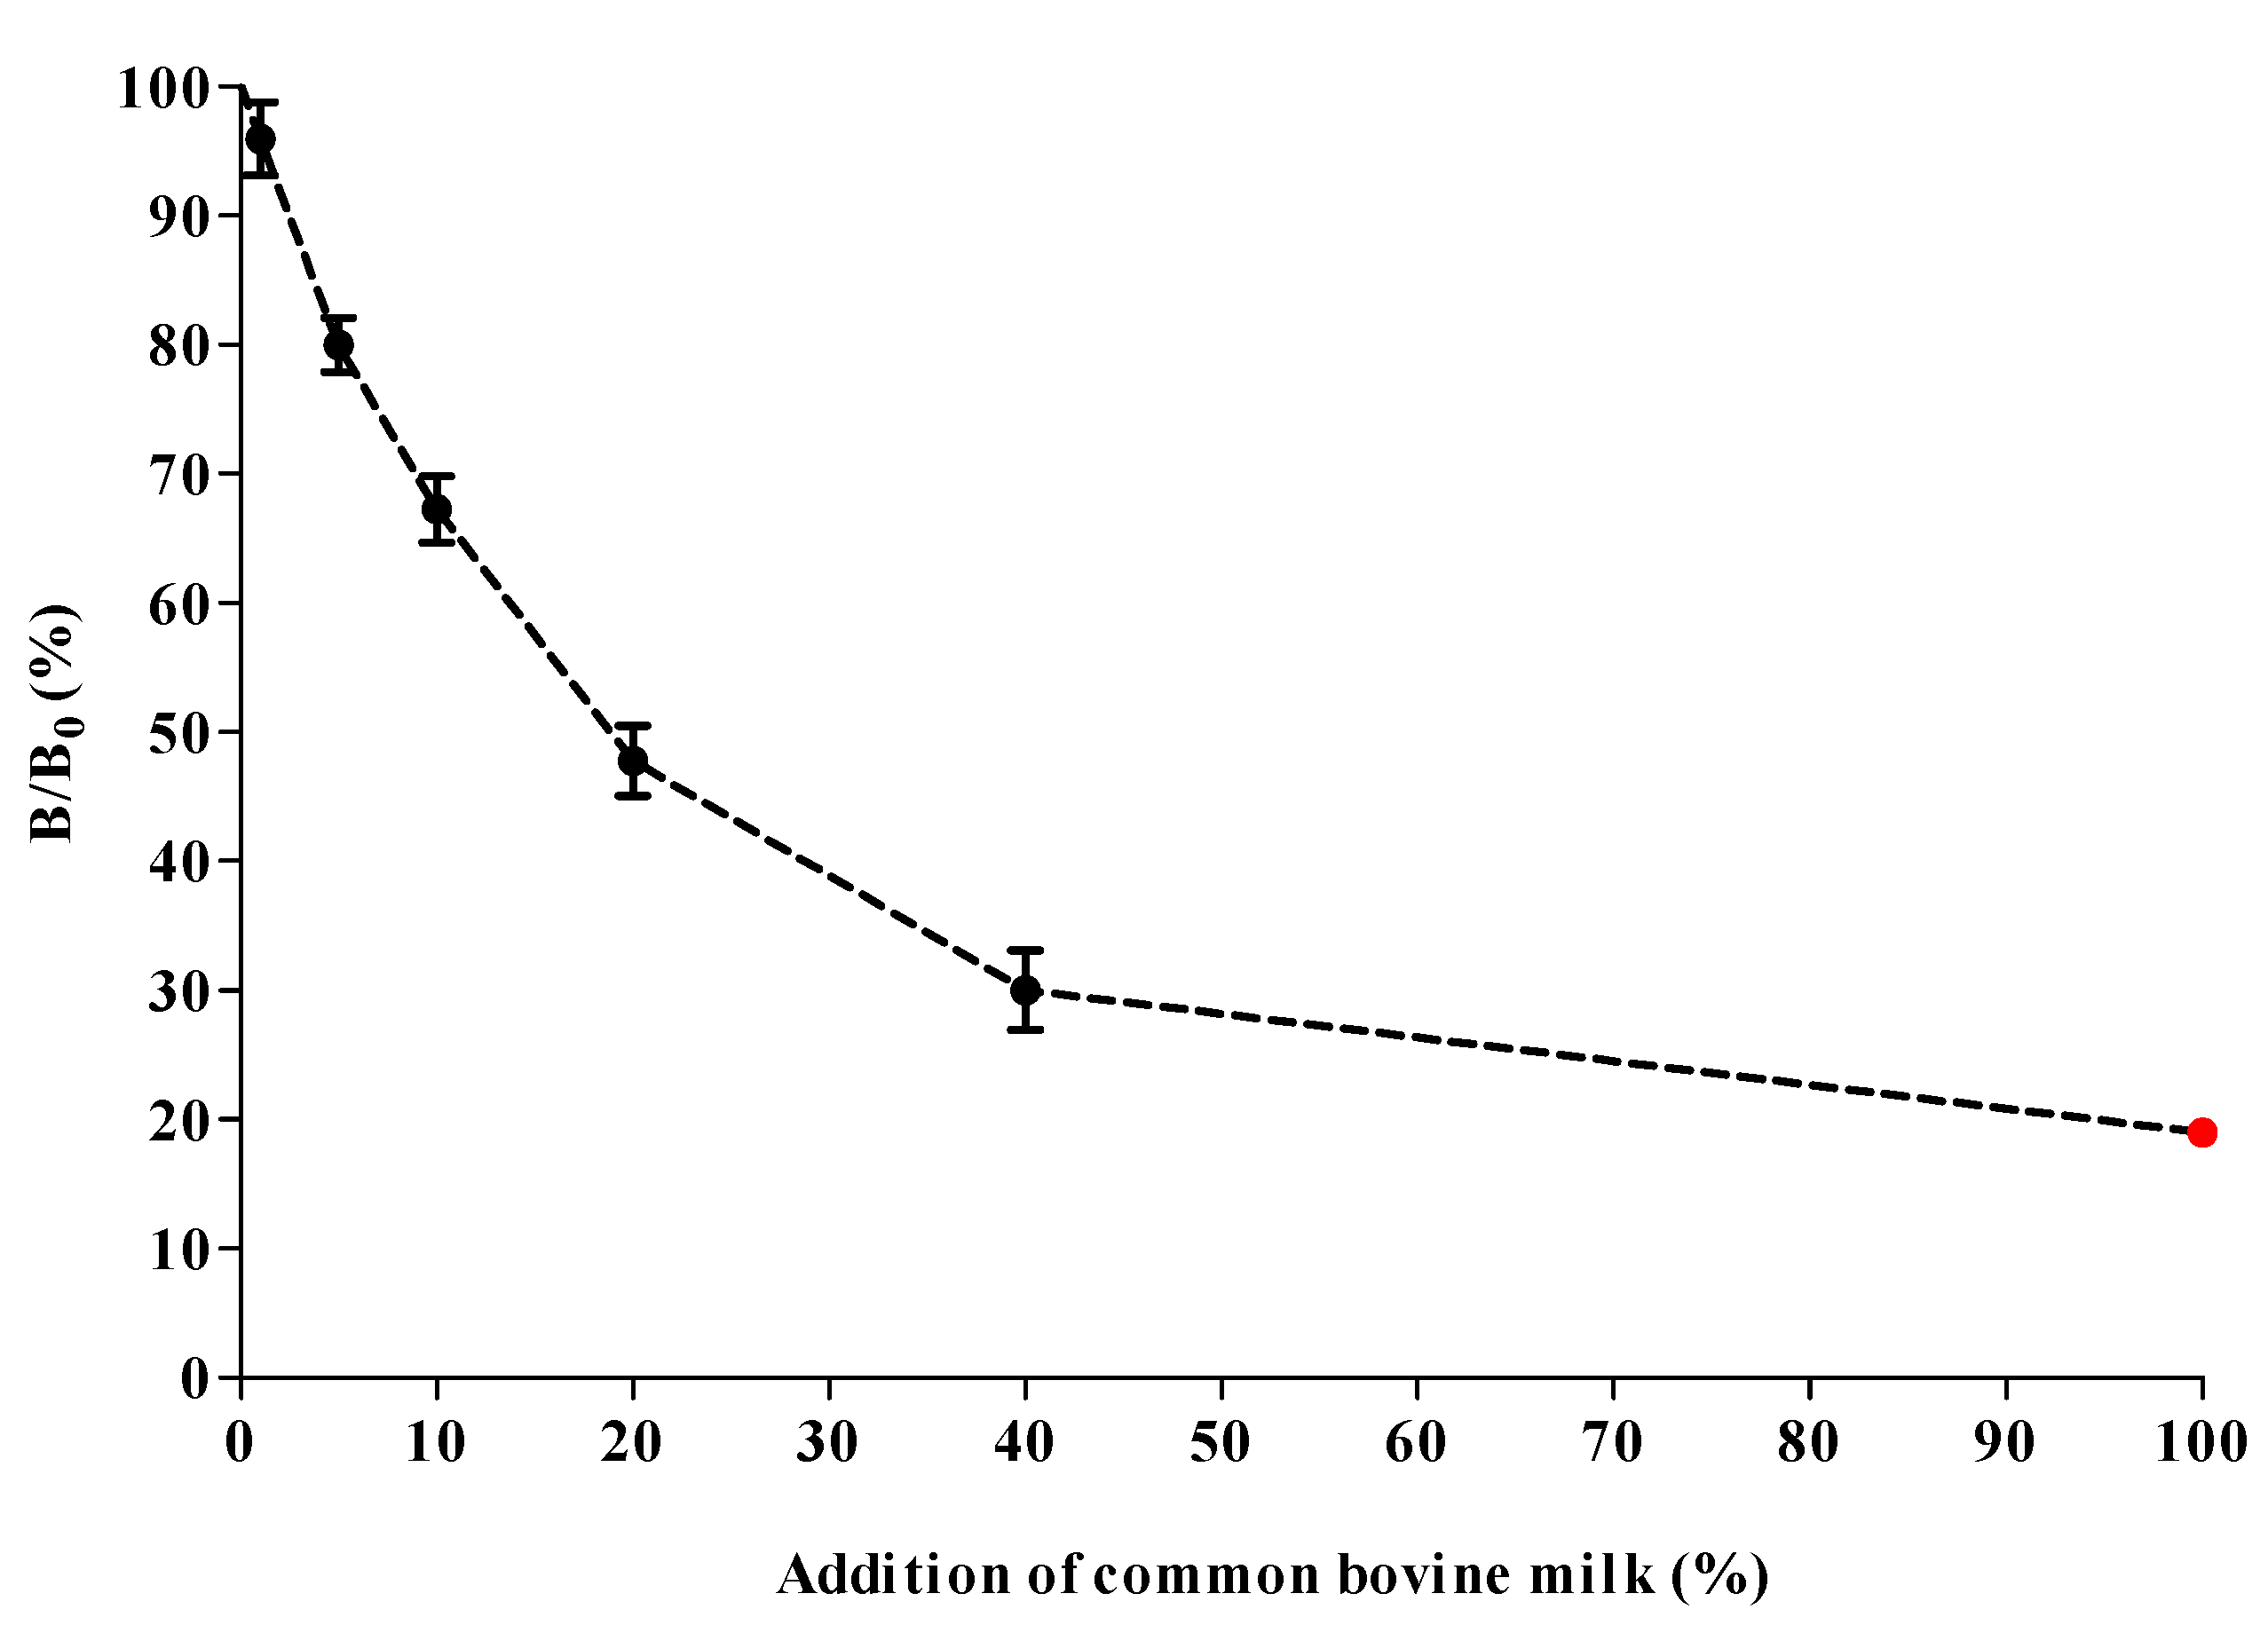
2.6. cMIA Applicability for Species’ Milk Authenticity
2.7. Initial In-house Interassay Repeatability Testing of Species’ Milk Authentication
3. Materials and Methods
3.1. Instrumentation
3.2. Chemicals and Reagents
3.3. Milk Samples
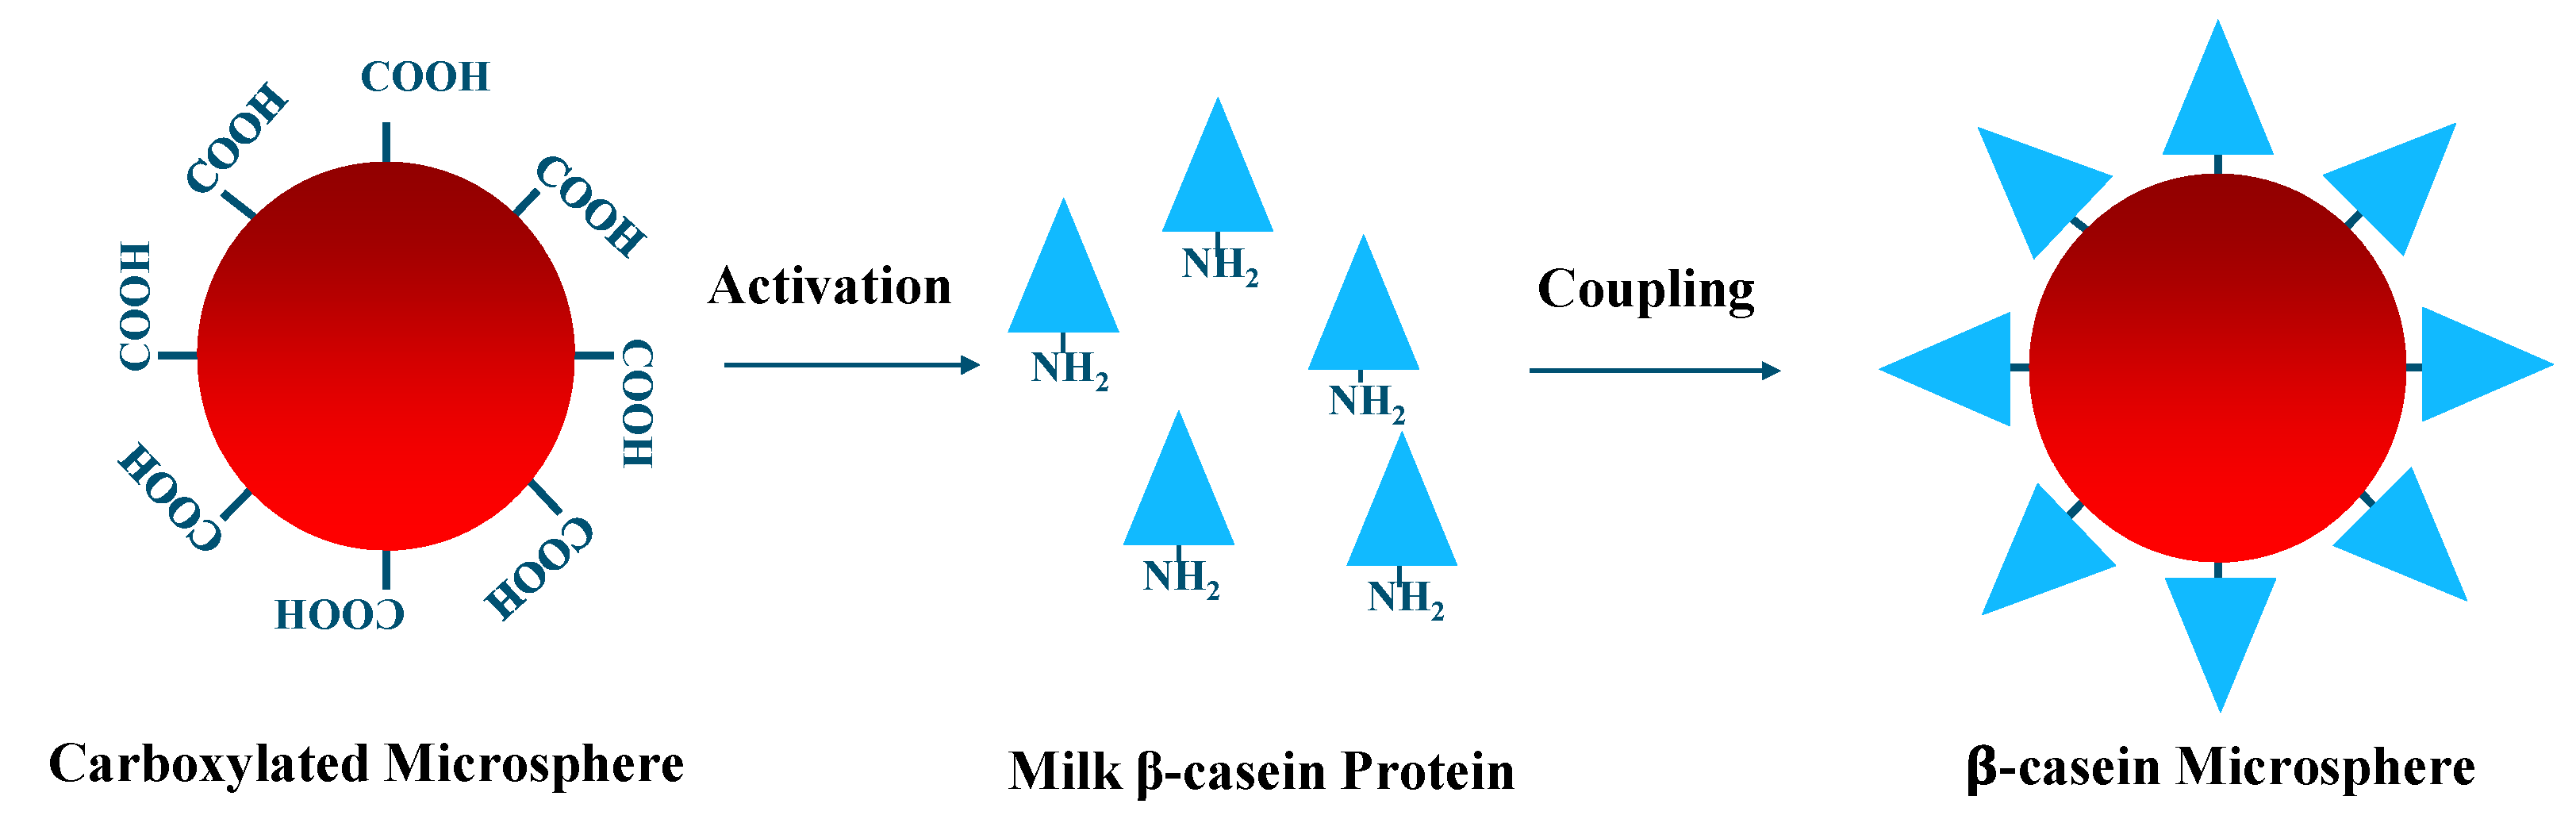
3.4. Coupling of Microspheres
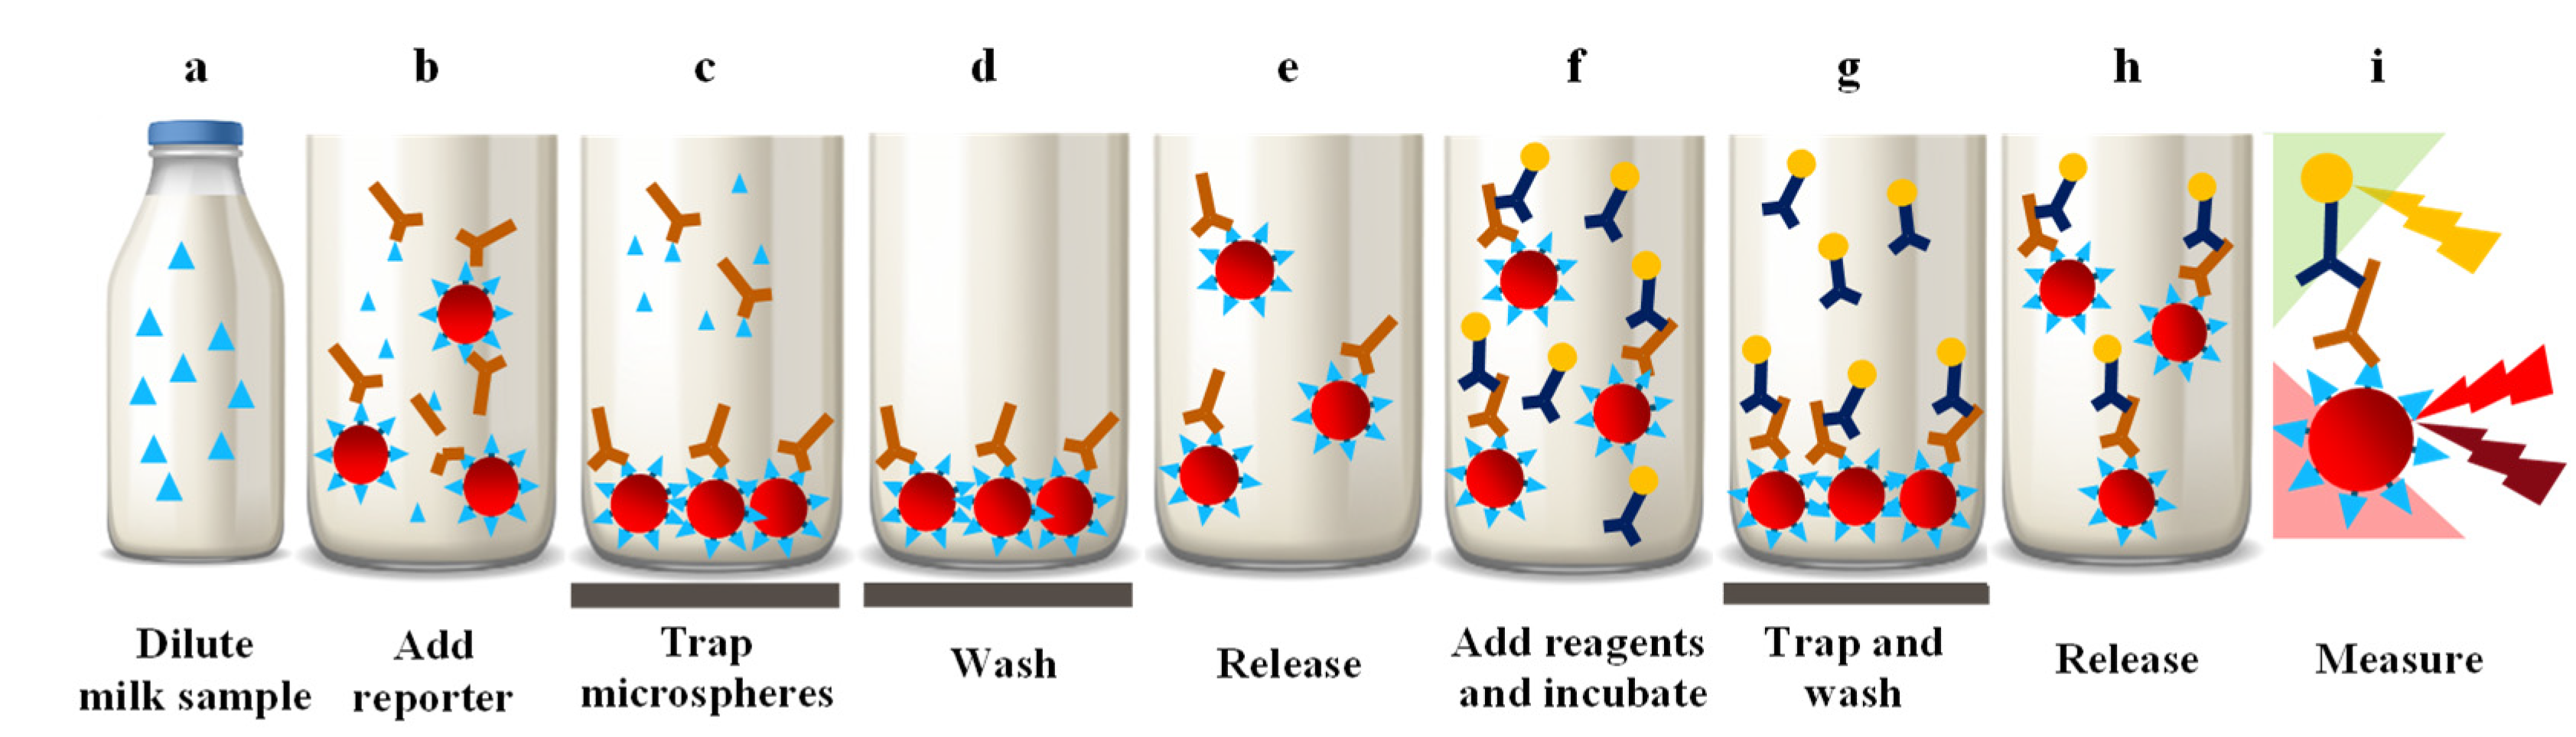
3.5. Multiplex Immunoassay
4. Conclusions
Supplementary Materials
Author Contributions
Funding
Institutional Review Board Statement
Informed Consent Statement
Data Availability Statement
Acknowledgments
Conflicts of Interest
Sample Availability
References
- Clemens, R.A. Milk A1 and A2 peptides and diabetes. Nestle Nutr. Workshop Ser. Pediatr. Program 2011, 67, 187–195. [Google Scholar] [CrossRef] [PubMed] [Green Version]
- Handford, C.E.; Campbell, K.; Elliott, C.T. Impacts of Milk Fraud on Food Safety and Nutrition with Special Emphasis on Developing Countries. Compr. Rev. Food Sci. Food Saf. 2016, 15, 130–142. [Google Scholar] [CrossRef] [PubMed] [Green Version]
- Massella, E.; Piva, S.; Giacometti, F.; Liuzzo, G.; Zambrini, A.V.; Serraino, A. Evaluation of bovine beta casein polymorphism in two dairy farms located in northern Italy. Ital. J. Food Saf. 2017, 6, 6904. [Google Scholar] [CrossRef] [PubMed] [Green Version]
- Fox, P.F.; Guinee, T.P.; Cogan, T.M.; McSweeney, P.L.H. Fundamentals of Cheese Science; 1 Online Resource (XV, 799 Pages 271 Illustrations, 778 Illustrations in Color; Springer: Boston, MA, USA, 2017. [Google Scholar] [CrossRef]
- Kruif de, C.G.; Huppertz, T.; Urban, V.S.; Petukhov, A.V. Casein micelles and their internal structure. Adv. Colloid Interface Sci. 2012, 171–172, 36–52. [Google Scholar] [CrossRef] [PubMed]
- Aschaffenburg, R. Inherited casein variants in cow’s milk. Nature 1961, 192, 431–432. [Google Scholar] [CrossRef]
- Peterson, R.F.; Kopfler, F.C. Detection of new types of β-casein by polyacrylamide gel electrophoresis at acid pH: A proposed nomenclature. Biochem. Biophys. Res. Commun. 1966, 22, 388–392. [Google Scholar] [CrossRef]
- Firouzamandi, M.; Gholami, M.; Toloui, M.; Eshghi, D. Genetic Variation of β-Casein Gene Using AS-PCR and ARMS-PCR Techniques in Bovine Populations. Russ. J. Genet. 2018, 54, 1352–1357. [Google Scholar] [CrossRef]
- Farrell, H.M., Jr.; Jimenez-Flores, R.; Bleck, G.T.; Brown, E.M.; Butler, J.E.; Creamer, L.K.; Hicks, C.L.; Hollar, C.M.; Ng-Kwai-Hang, K.F.; Swaisgood, H.E. Nomenclature of the proteins of cows’ milk—Sixth revision. J. Dairy Sci. 2004, 87, 1641–1674. [Google Scholar] [CrossRef] [Green Version]
- Sebastiani, C.; Arcangeli, C.; Ciullo, M.; Torricelli, M.; Cinti, G.; Fisichella, S.; Biagetti, M. Frequencies Evaluation of beta-Casein Gene Polymorphisms in Dairy Cows Reared in Central Italy. Animals 2020, 10, 252. [Google Scholar] [CrossRef] [Green Version]
- Brooke-Taylor, S.; Dwyer, K.; Woodford, K.; Kost, N. Systematic Review of the Gastrointestinal Effects of A1 Compared with A2 beta-Casein. Adv. Nutr. 2017, 8, 739–748. [Google Scholar] [CrossRef]
- Jianqin, S.; Leiming, X.; Lu, X.; Yelland, G.W.; Ni, J.; Clarke, A.J. Effects of milk containing only A2 beta casein versus milk containing both A1 and A2 beta casein proteins on gastrointestinal physiology, symptoms of discomfort, and cognitive behavior of people with self-reported intolerance to traditional cows’ milk. Nutr. J. 2016, 15, 35. [Google Scholar] [CrossRef] [PubMed] [Green Version]
- McLachlan, C.N.S. β-casein A1, ischaemic heart disease mortality, and other illnesses. Med. Hypotheses 2001, 56, 262–272. [Google Scholar] [CrossRef] [PubMed] [Green Version]
- Daniloski, D.; Cunha, N.M.D.; McCarthy, N.A.; O’Callaghan, T.F.; McParland, S.; Vasiljevic, T. Health-related outcomes of genetic polymorphism of bovine β-casein variants: A systematic review of randomised controlled trials. Trends Food Sci. Technol. 2021, 111, 233–248. [Google Scholar] [CrossRef]
- Ul Haq, M.R.; Kapila, R.; Sharma, R.; Saliganti, V.; Kapila, S. Comparative evaluation of cow beta-casein variants (A1/A2) consumption on Th-2-mediated inflammatory response in mouse gut. Eur. J. Nutr. 2014, 53, 1039–1049. [Google Scholar] [CrossRef]
- Pal, S.; Woodford, K.; Kukuljan, S.; Ho, S. Milk Intolerance, Beta-Casein and Lactose. Nutrients 2015, 7, 7285–7297. [Google Scholar] [CrossRef]
- Lambers, T.T.; Broeren, S.; Heck, J.; Bragt, M.; Huppertz, T. Processing affects beta-casomorphin peptide formation during simulated gastrointestinal digestion in both A1 and A2 milk. Int. Dairy J. 2021, 121, 105099. [Google Scholar] [CrossRef]
- Truswell, A.S. The A2 milk case: A critical review. Eur. J. Clin. Nutr. 2005, 59, 623–631. [Google Scholar] [CrossRef] [Green Version]
- Ng-Kwai-Hang, K.F.; Grosclaude, F. Genetic Polymorphism of Milk Proteins. In Advanced Dairy Chemistry; 1, Proteins; Fox, P.F., McSweeney, P.L.H., Eds.; Springer: Boston, MA, USA, 2003; pp. 739–816. [Google Scholar] [CrossRef]
- Kaskous, S. A1- and A2-Milk and Their Effect on Human Health. J. Food Eng. Technol. 2020, 9, 15–21. [Google Scholar] [CrossRef]
- Bentivoglio, D.; Finco, A.; Bucci, G.; Staffolani, G. Is There a Promising Market for the A2 Milk? Analysis of Italian Consumer Preferences. Sustainability 2020, 12, 6763. [Google Scholar] [CrossRef]
- Kamthania, M. Milk Adultration: Methods of Detection & Remedial Measures. Int. J. Eng. Tech. Res. 2014, 1, 2321–2869. [Google Scholar]
- Armstrong, D.J. Food chemistry and U.S. food regulations. J. Agric. Food Chem. 2009, 57, 8180–8186. [Google Scholar] [CrossRef] [PubMed]
- Spink, J.; Moyer, D.C. Defining the public health threat of food fraud. J. Food Sci. 2011, 76, R157–R163. [Google Scholar] [CrossRef] [PubMed]
- European Commission. Commission Implementing Regulation (EU) 2018/150 of 30 January 2018 Amending Implementing Regulation (EU) 2016/1240 as Regards Methods for the Analysis and Quality Evaluation of Milk and Milk Products Eligible for Public Intervention and Aid for Private Storage (OJ 2018, p. 26). Available online: https://eur-lex.europa.eu/legal-content/EN/TXT/?uri=CELEX%3A32018R0150 (accessed on 29 March 2022).
- Haasnoot, W.; Smits, N.G.; Kemmers-Voncken, A.E.; Bremer, M.G. Fast biosensor immunoassays for the detection of cows’ milk in the milk of ewes and goats. J. Dairy Res. 2004, 71, 322–329. [Google Scholar] [CrossRef] [PubMed] [Green Version]
- Hurley, I.P.; Coleman, R.C.; Ireland, H.E.; Williams, J.H.H. Measurement of Bovine IgG by Indirect Competitive ELISA as a Means of Detecting Milk Adulteration. J. Dairy Sci. 2004, 87, 543–549. [Google Scholar] [CrossRef] [Green Version]
- Chen, R.K.; Chang, L.W.; Chung, Y.Y.; Lee, M.H.; Ling, Y.C. Quantification of cow milk adulteration in goat milk using high-performance liquid chromatography with electrospray ionization mass spectrometry. Rapid Commun. Mass Spectrom. 2004, 18, 1167–1171. [Google Scholar] [CrossRef]
- Bania, J.; Ugorski, M.; Polanowski, A.; Adamczyk, E. Application of polymerase chain reaction for detection of goats’ milk adulteration by milk of cow. J. Dairy Res. 2001, 68, 333–336. [Google Scholar] [CrossRef]
- Lopez-Calleja, I.; Gonzalez, I.; Fajardo, V.; Rodriguez, M.A.; Hernandez, P.E.; Garcia, T.; Martin, R. Rapid detection of cows’ milk in sheeps’ and goats’ milk by a species-specific polymerase chain reaction technique. J. Dairy Sci. 2004, 87, 2839–2845. [Google Scholar] [CrossRef] [Green Version]
- Mayer, H.K.; Lenz, K.; Halbauer, E.M. “A2 milk” authentication using isoelectric focusing and different PCR techniques. Food Res. Int. 2021, 147, 110523. [Google Scholar] [CrossRef]
- Giglioti, R.; Gutmanis, G.; Katiki, L.M.; Okino, C.H.; de Sena Oliveira, M.C.; Vercesi Filho, A.E. New high-sensitive rhAmp method for A1 allele detection in A2 milk samples. Food Chem. 2020, 313, 126167. [Google Scholar] [CrossRef]
- Daniloski, D.; McCarthy, N.A.; O’Callaghan, T.F.; Vasiljevic, T. Authentication of β-casein milk phenotypes using FTIR spectroscopy. Int. Dairy J. 2022, 129, 105350. [Google Scholar] [CrossRef]
- Ng-Kwai-Hang, K.F.; Hayes, J.F.; Moxley, J.E.; Monardes, H.G. Variation in milk protein concentrations associated with genetic polymorphism and environmental factors. J. Dairy Sci. 1987, 70, 563–570. [Google Scholar] [CrossRef]
- Selby, C. Interference in immunoassay. Ann. Clin. Biochem. 1999, 36, 704–721. [Google Scholar] [CrossRef] [PubMed]
- Andrew, S.M. Effect of fat and protein content of milk from individual cows on the specificity rates of antibiotic residue screening tests. J. Dairy Sci. 2000, 83, 2992–2997. [Google Scholar] [CrossRef]
- Gantner, V.; Mijić, P.; Baban, M.; Škrtić, Z.; Turalija, A. The overall and fat composition of milk of various species. Mljekarstvo 2015, 65, 223–231. [Google Scholar] [CrossRef] [Green Version]


| Species | 5% Addition A1A2 Milk | 10% Addition A1A2 Milk | ||
|---|---|---|---|---|
| Mean B/B0 (%) | CV (%) | Mean B/B0 (%) | CV (%) | |
| Bovine (A2) | 75 | 3 | 62 | 6 |
| Sheep | 81 | 8 | 65 | 5 |
| Horse | 77 | 7 | 62 | 5 |
| Buffalo | 77 | 5 | 61 | 5 |
| Donkey | 79 | 6 | 65 | 6 |
| Goat | 80 | 8 | 65 | 7 |
Publisher’s Note: MDPI stays neutral with regard to jurisdictional claims in published maps and institutional affiliations. |
© 2022 by the authors. Licensee MDPI, Basel, Switzerland. This article is an open access article distributed under the terms and conditions of the Creative Commons Attribution (CC BY) license (https://creativecommons.org/licenses/by/4.0/).
Share and Cite
Elferink, A.J.W.; Entiriwaa, D.; Bulgarelli, P.; Smits, N.G.E.; Peters, J. Development of a Microsphere-Based Immunoassay Authenticating A2 Milk and Species Purity in the Milk Production Chain. Molecules 2022, 27, 3199. https://doi.org/10.3390/molecules27103199
Elferink AJW, Entiriwaa D, Bulgarelli P, Smits NGE, Peters J. Development of a Microsphere-Based Immunoassay Authenticating A2 Milk and Species Purity in the Milk Production Chain. Molecules. 2022; 27(10):3199. https://doi.org/10.3390/molecules27103199
Chicago/Turabian StyleElferink, Alexander J. W., Deborah Entiriwaa, Paolo Bulgarelli, Nathalie G. E. Smits, and Jeroen Peters. 2022. "Development of a Microsphere-Based Immunoassay Authenticating A2 Milk and Species Purity in the Milk Production Chain" Molecules 27, no. 10: 3199. https://doi.org/10.3390/molecules27103199
APA StyleElferink, A. J. W., Entiriwaa, D., Bulgarelli, P., Smits, N. G. E., & Peters, J. (2022). Development of a Microsphere-Based Immunoassay Authenticating A2 Milk and Species Purity in the Milk Production Chain. Molecules, 27(10), 3199. https://doi.org/10.3390/molecules27103199