
Novel NIR-Phosphorescent Ir(III) Complexes: Synthesis, Characterization and Their Exploration as Lifetime-Based O2 Sensors in Living Cells


 ,
,
Abstract
:1. Introduction
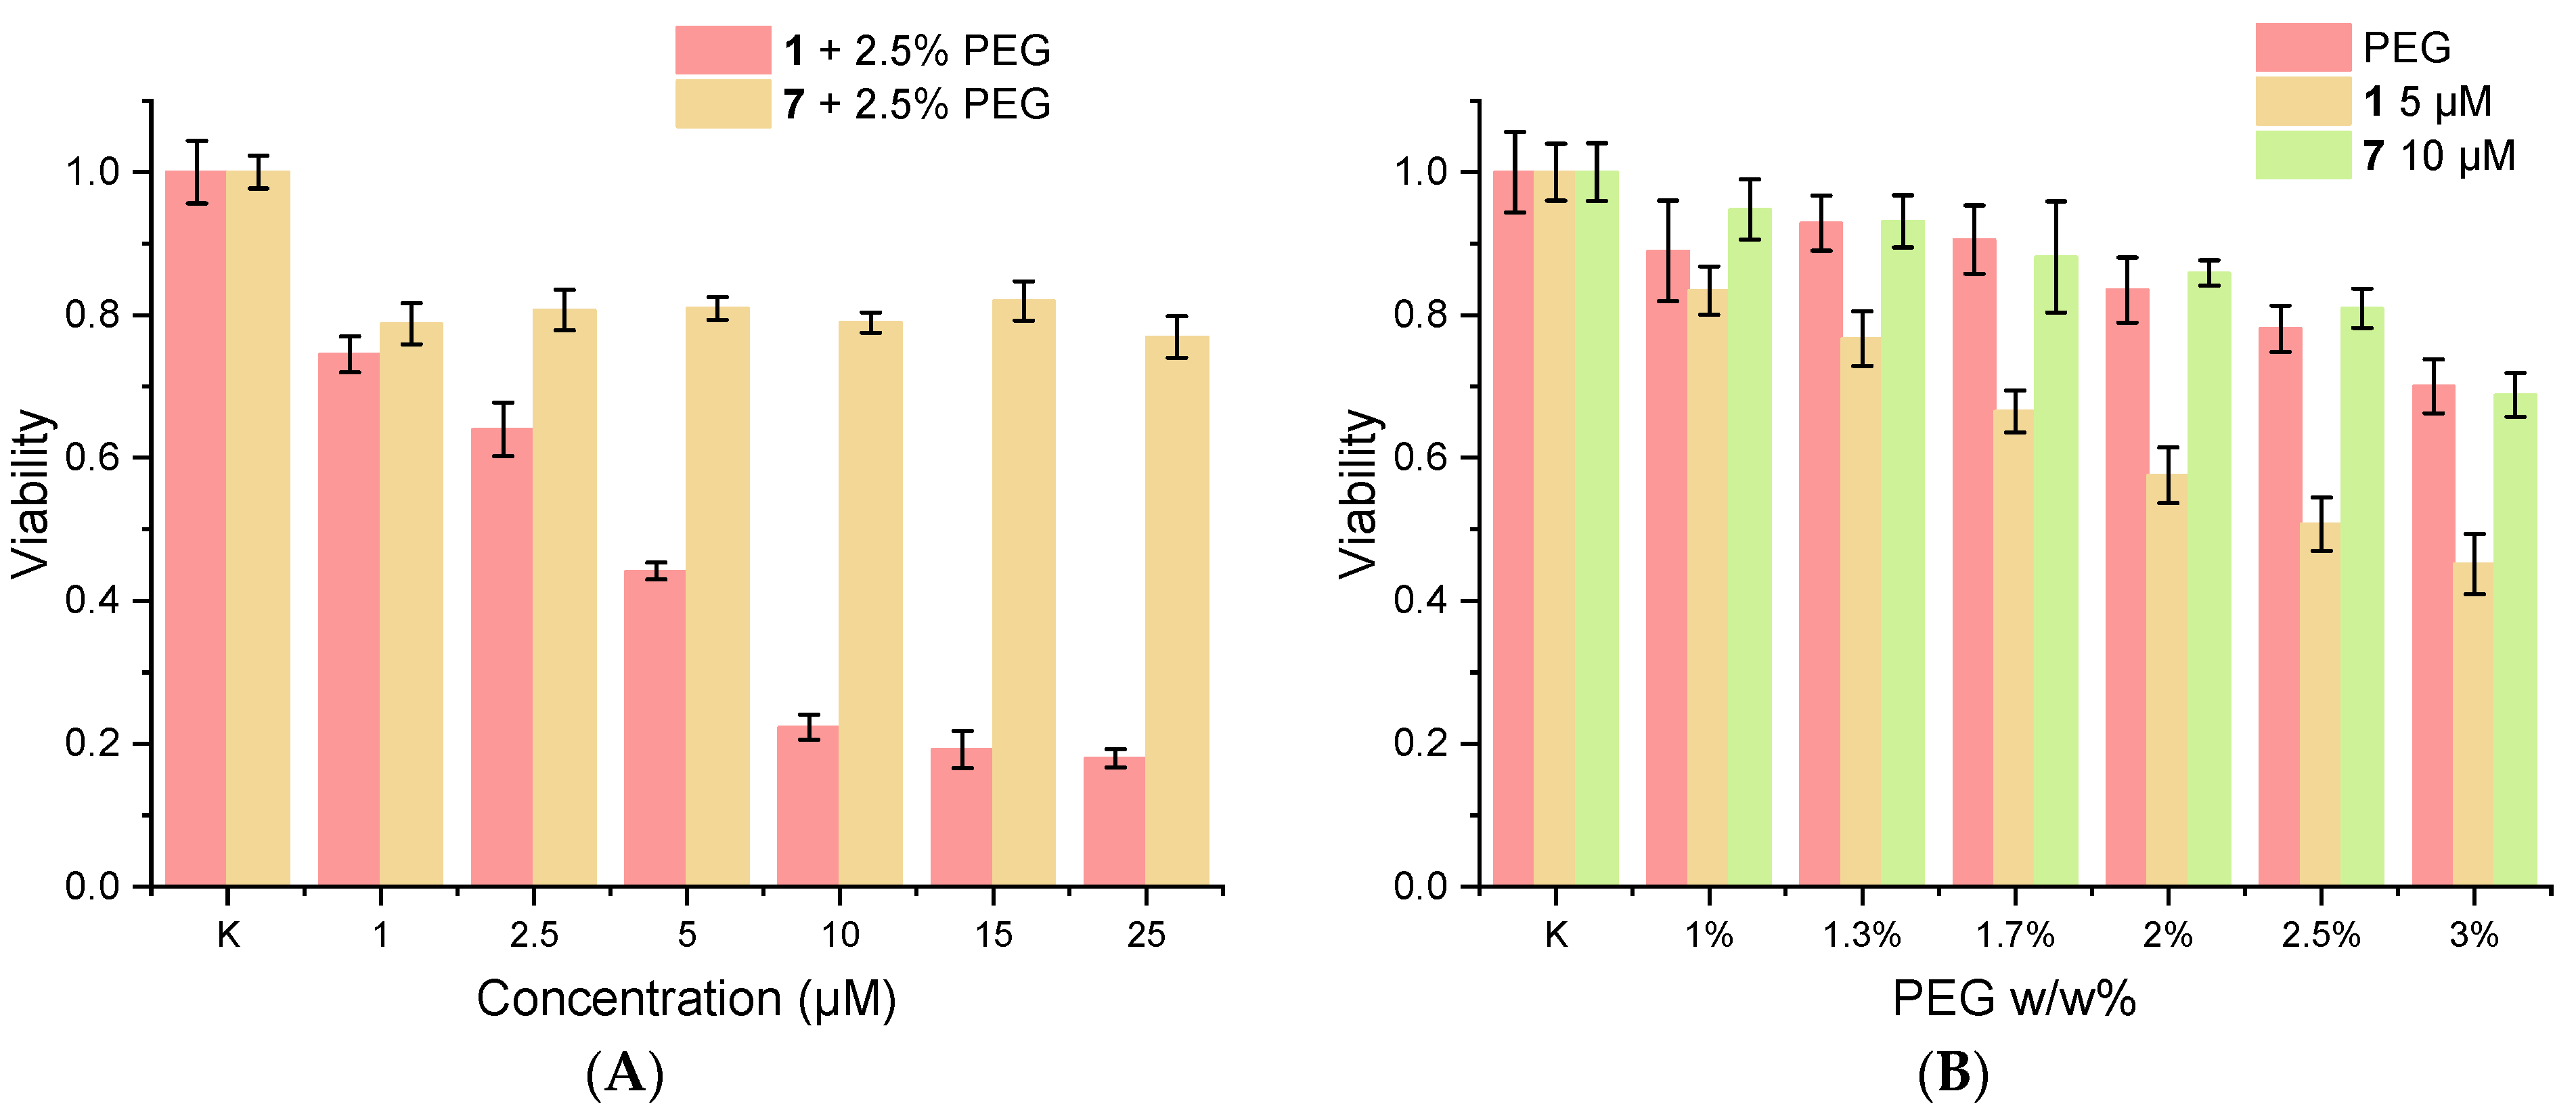
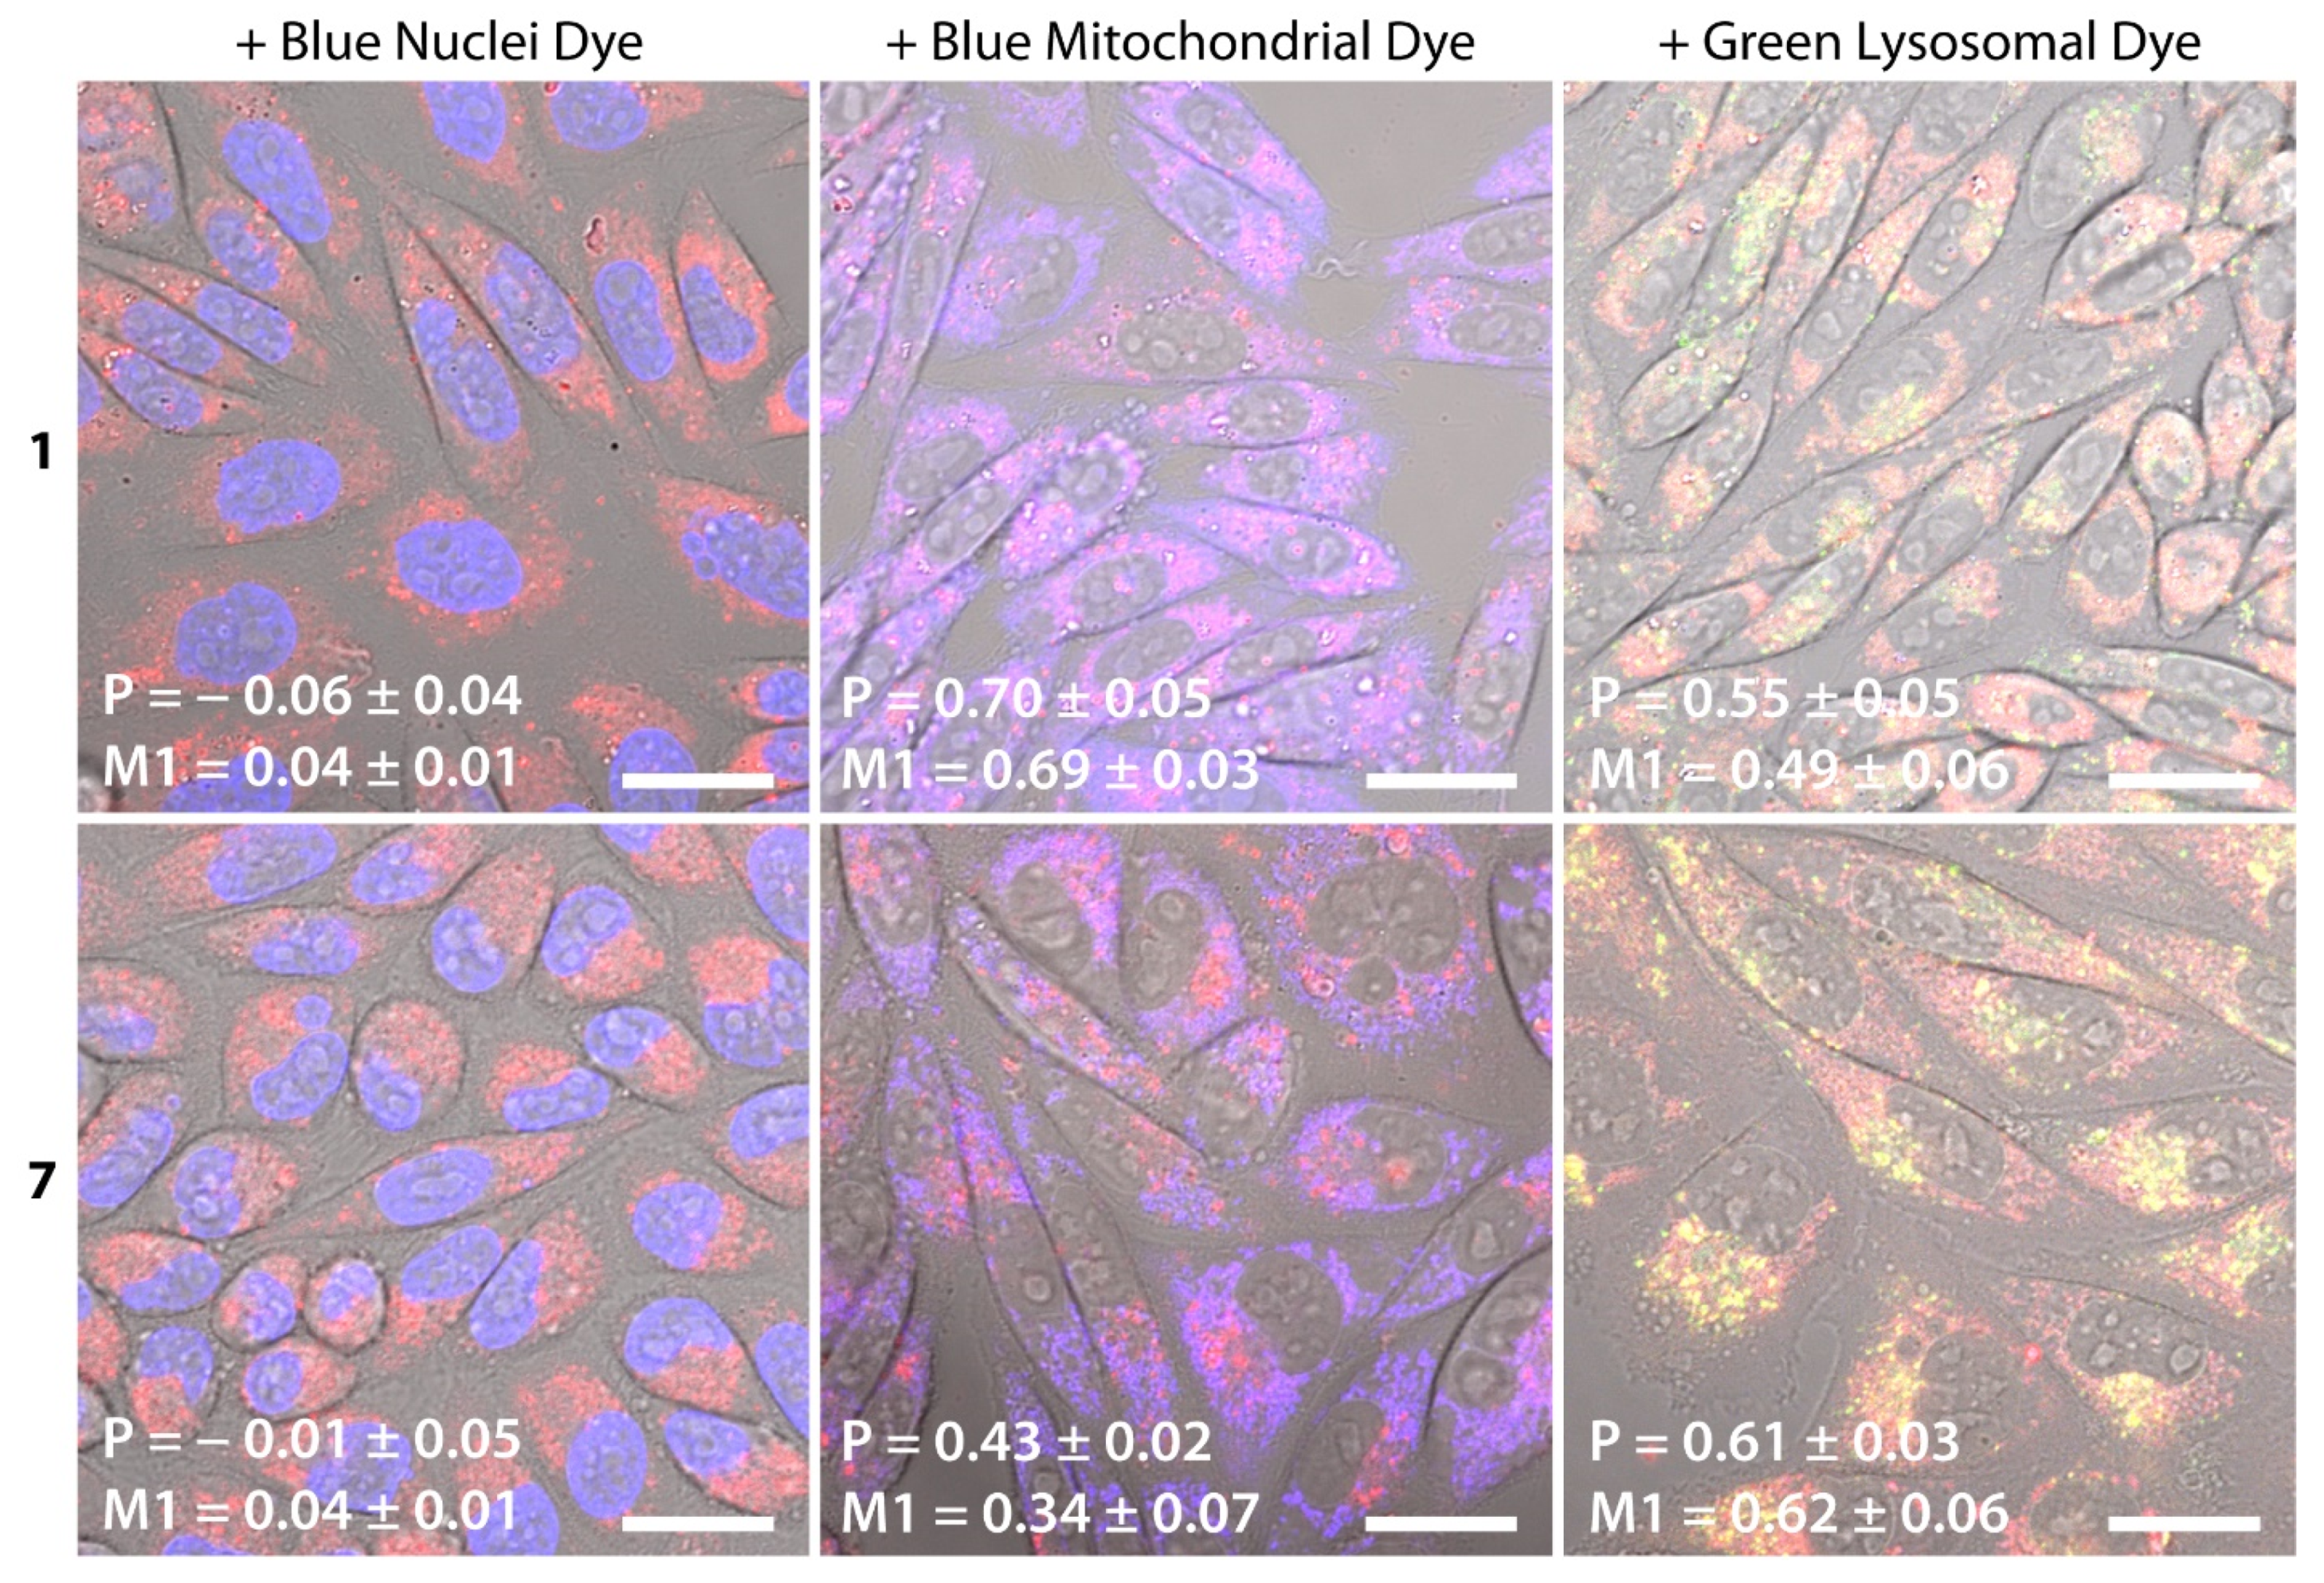
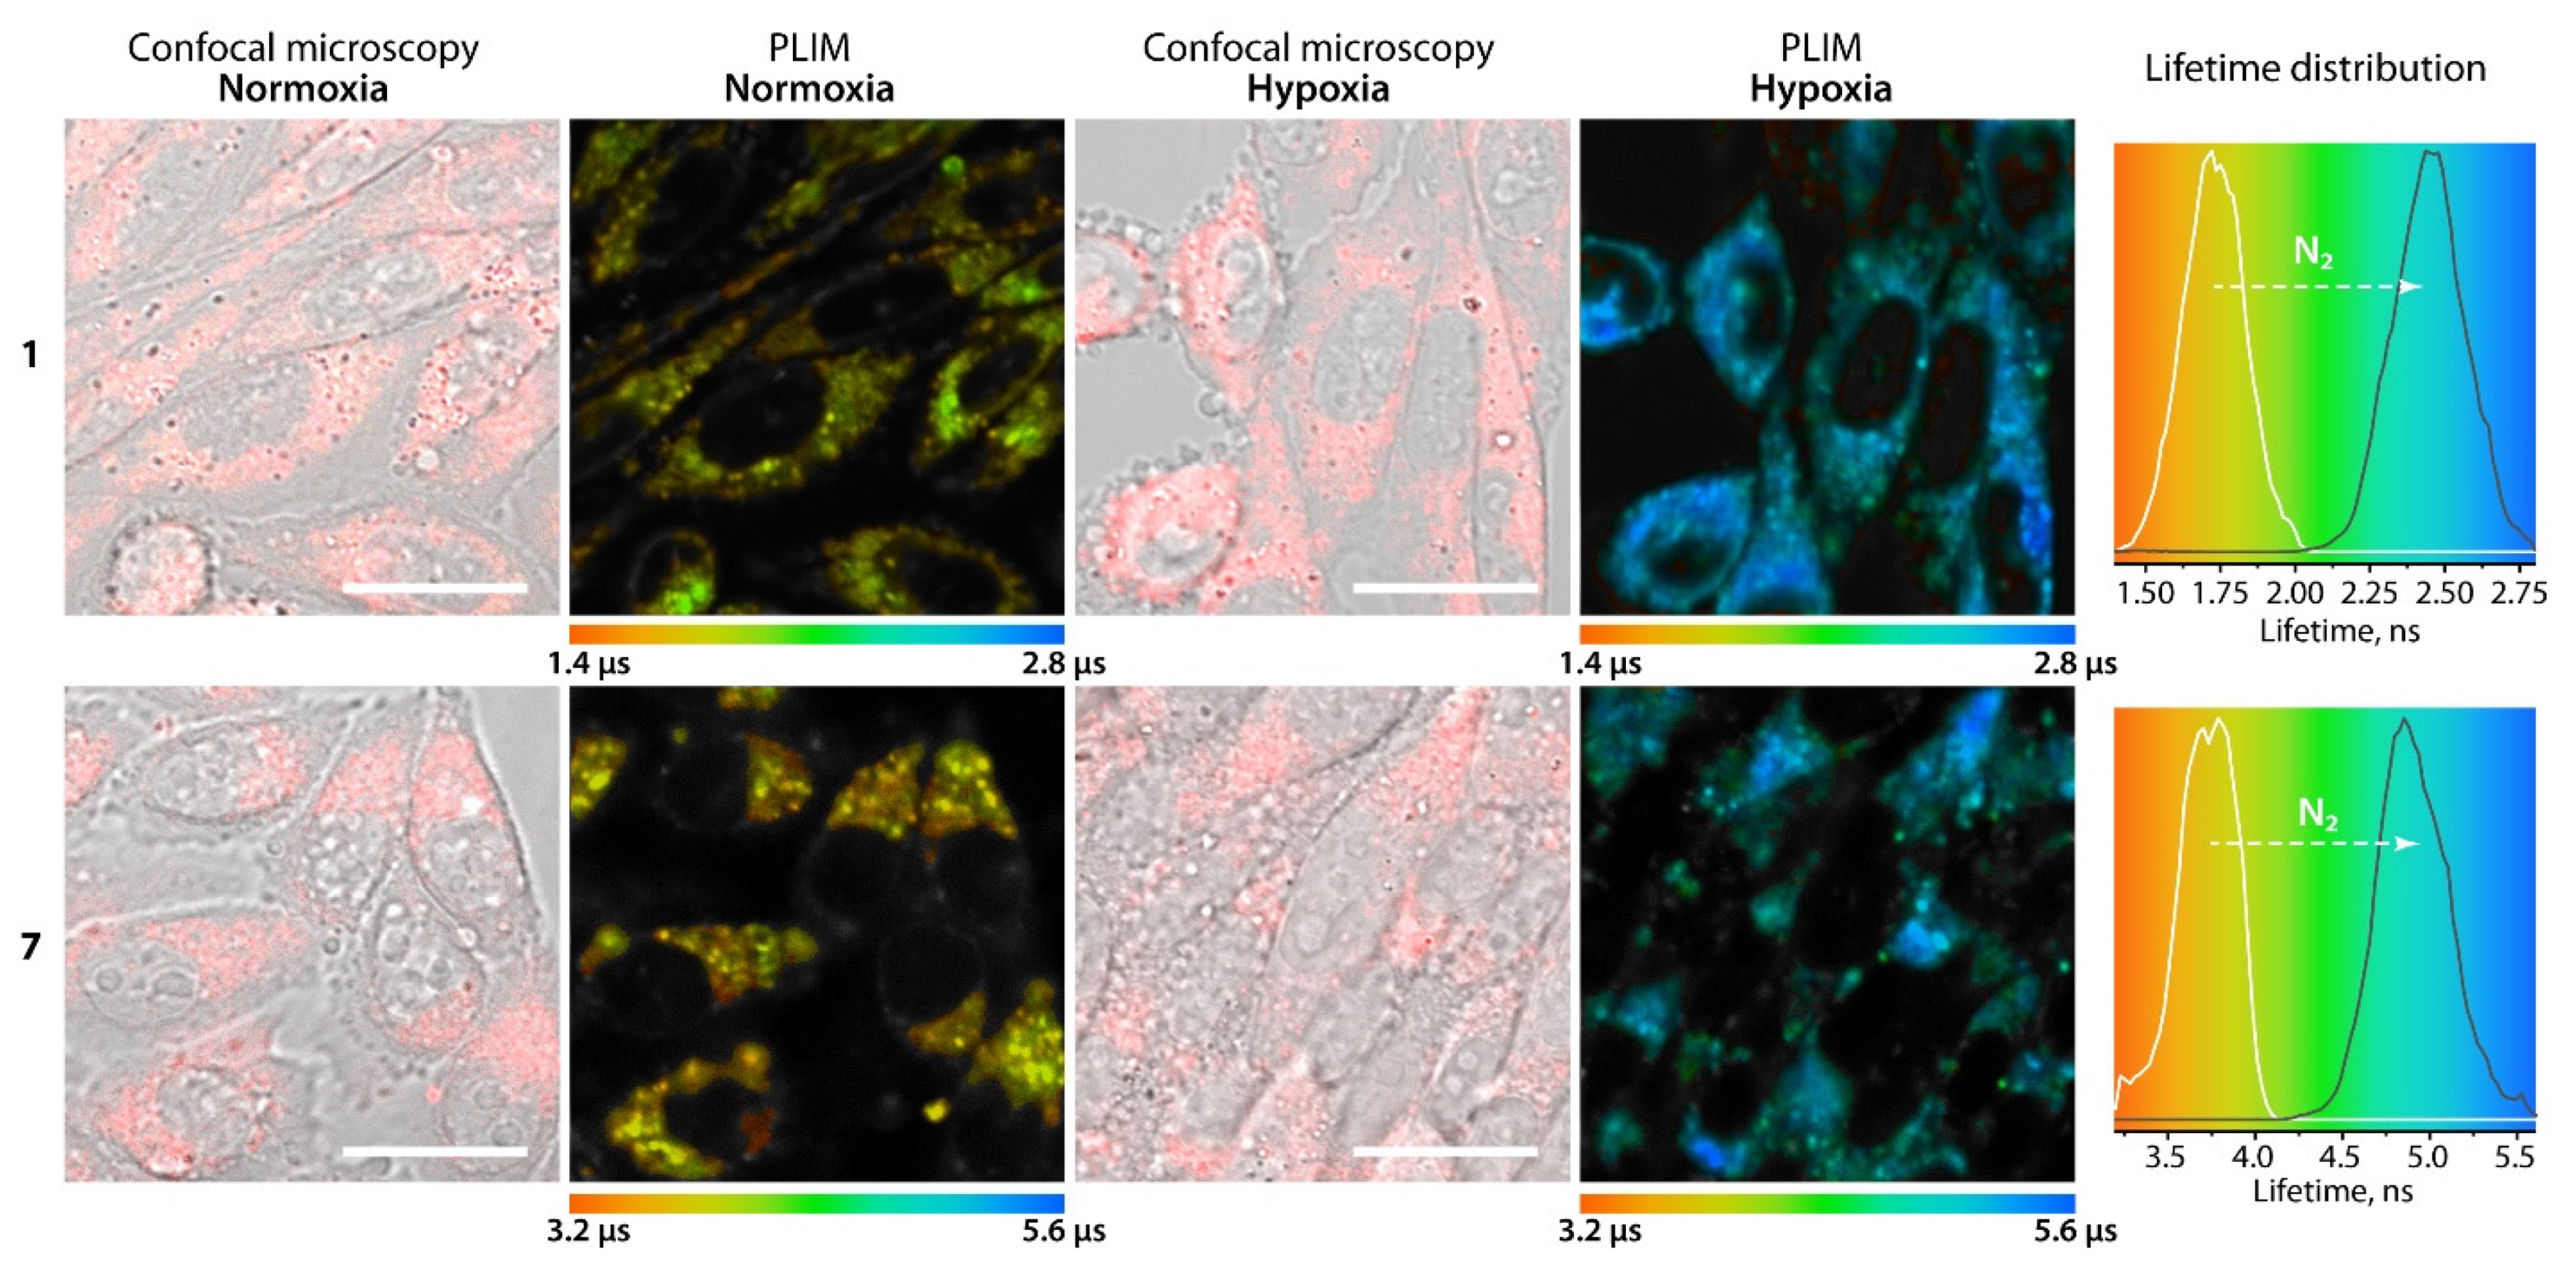
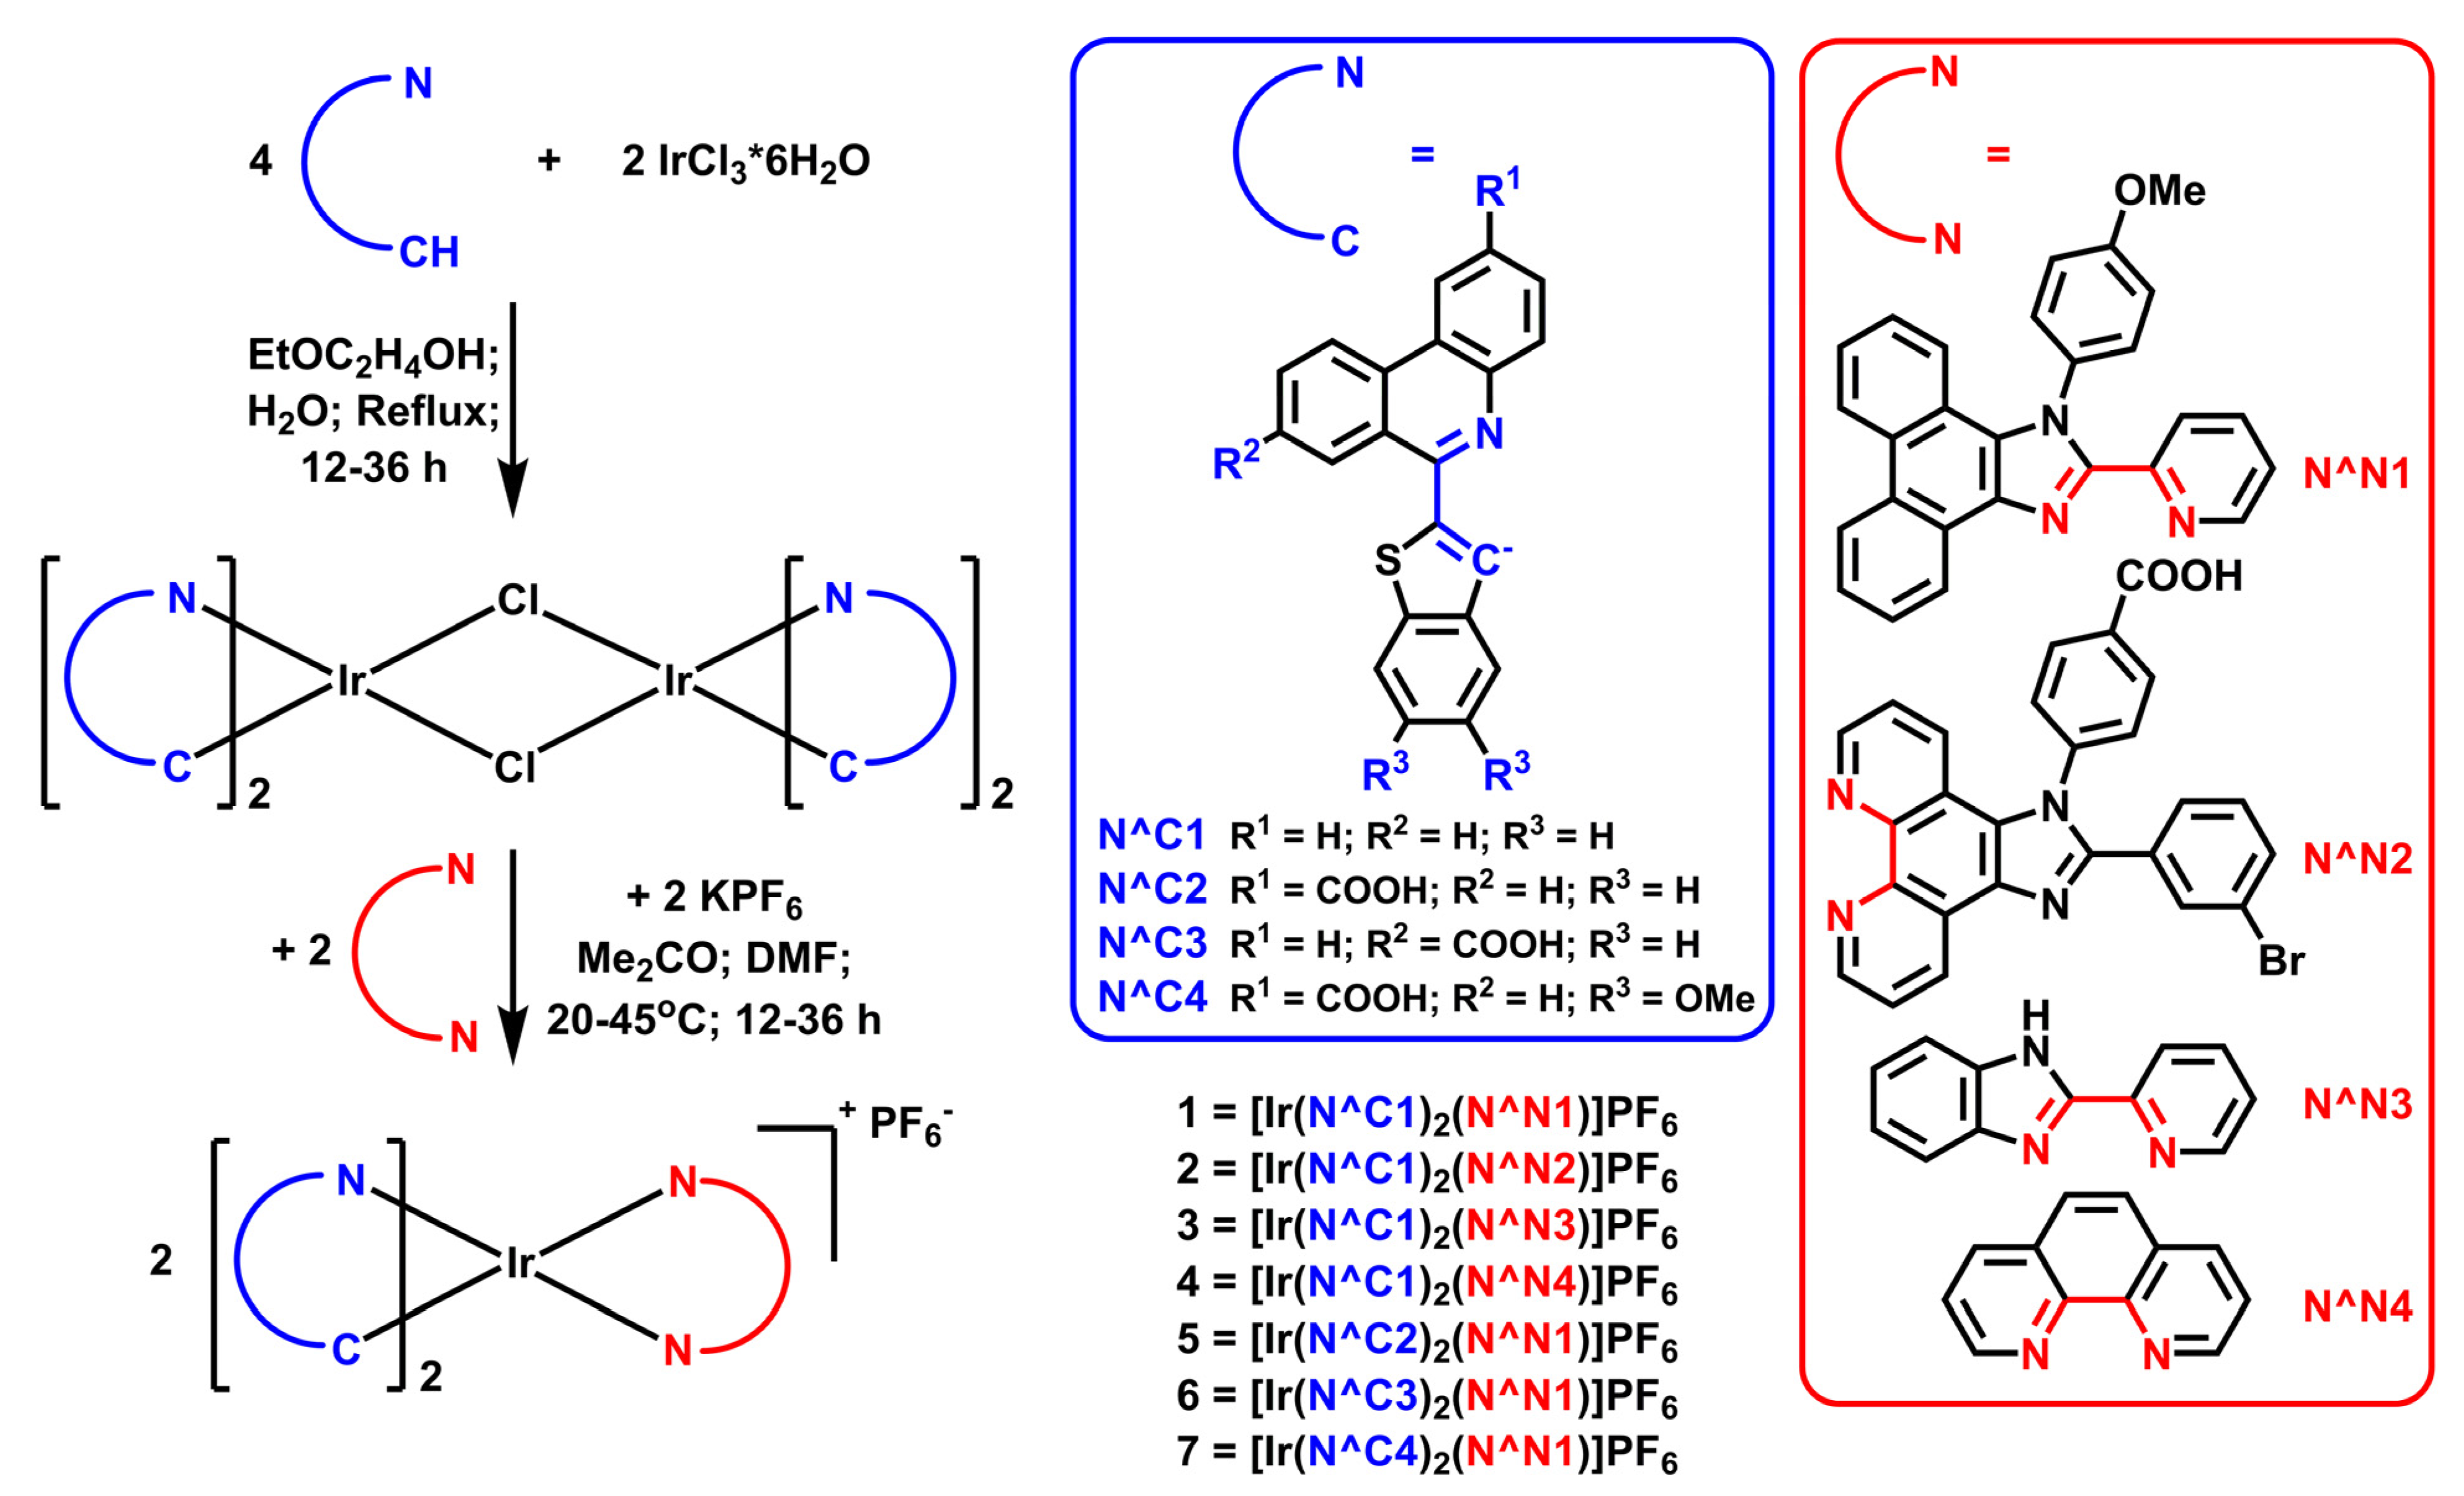
2. Results and Discussion
3. Conclusions
4. Materials and Methods
Supplementary Materials
Author Contributions
Funding
Institutional Review Board Statement
Informed Consent Statement
Acknowledgments
Conflicts of Interest
Sample Availability
References
- Semenza, G.L. Life with Oxygen. Science 2007, 318, 62–64. [Google Scholar] [CrossRef] [PubMed]
- Semenza, G.L. Hypoxia-Inducible Factors in Physiology and Medicine. Cell 2012, 148, 399–408. [Google Scholar] [CrossRef] [PubMed] [Green Version]
- Clanton, T.L.; Hogan, M.C.; Gladden, L.B. Regulation of Cellular Gas Exchange, Oxygen Sensing, and Metabolic Control. Compr. Physiol. 2013, 3, 1135–1190. [Google Scholar] [PubMed]
- Jenkins, J.; Dmitriev, R.I.; Papkovsky, D.B. Imaging cell and tissue O2 by TCSPC-PLIM. Springer Ser. Chem. Phys. 2015, 111, 225–247. [Google Scholar] [CrossRef]
- Chelushkin, P.S.; Tunik, S.P. Phosphorescence Lifetime Imaging (PLIM): State of the Art and Perspectives. In Progress in Photon Science: Recent Advances; Yamanouchi, K., Tunik, S., Makarov, V., Eds.; Springer International Publishing: Cham, Switzerland, 2019; pp. 109–128. ISBN 978-3-030-05974-3. [Google Scholar]
- Rück, A.; Breymayer, J.; Kalinina, S. TCSPC FLIM and PLIM for metabolic imaging and oxygen sensing. In Multiphoton Microscopy and Fluorescence Lifetime Imaging: Applications in Biology and Medicine; De Gruyter: Berlin, Germany, 2018. [Google Scholar]
- Becker, W.; Shcheslavskiy, V.; Rück, A. Simultaneous Phosphorescence and Fluorescence Lifetime Imaging by Multi-Dimensional TCSPC and Multi-Pulse Excitation BT—Multi-Parametric Live Cell Microscopy of 3D Tissue Models; Dmitriev, R.I., Ed.; Springer International Publishing: Cham, Switzerland, 2017; pp. 19–30. ISBN 978-3-319-67358-5. [Google Scholar]
- Papkovsky, D.B.; Dmitriev, R.I. Imaging of oxygen and hypoxia in cell and tissue samples. Cell. Mol. Life Sci. 2018, 75, 2963–2980. [Google Scholar] [CrossRef]
- Papkovsky, D.B.; Zhdanov, A.V. Phosphorescence based oxygen sensors and probes for biomedical research. Adv. Environ. Chem. Biol. Sens. Technol. XIV 2017, 10215, 102150R. [Google Scholar] [CrossRef]
- Chelushkin, P.S.; Shakirova, J.R.; Kritchenkov, I.S.; Baigildin, V.A.; Tunik, S.P. Phosphorescent NIR emitters for biomedicine: Applications, advances and challenges. Dalt. Trans. 2022, 51, 1257–1280. [Google Scholar] [CrossRef]
- Dmitriev, R.I.; Papkovsky, D.B. Intracellular probes for imaging oxygen concentration: How good are they? Methods Appl. Fluoresc. 2015, 3, 34001. [Google Scholar] [CrossRef]
- Cheng, M.H.Y.; Mo, Y.; Zheng, G. Nano versus Molecular: Optical Imaging Approaches to Detect and Monitor Tumor Hypoxia. Adv. Healthc. Mater. 2021, 10, 2001549. [Google Scholar] [CrossRef]
- Baggaley, E.; Weinstein, J.A.; Williams, J.A.G. Time-Resolved Emission Imaging Microscopy Using Phosphorescent Metal Complexes: Taking FLIM and PLIM to New Lengths. Struct. Bond. 2015, 165, 205–256. [Google Scholar] [CrossRef]
- Ibrahim-Ouali, M.; Dumur, F. Recent Advances on Metal-Based Near-Infrared and Infrared Emitting OLEDs. Molecules 2019, 24, 1412. [Google Scholar] [CrossRef] [PubMed] [Green Version]
- Pashaei, B.; Karimi, S.; Shahroosvand, H.; Pilkington, M. Molecularly Engineered Near-Infrared Light-Emitting Electrochemical Cells. Adv. Funct. Mater. 2020, 30, 1908103. [Google Scholar] [CrossRef]
- Zhang, Y.; Wang, Y.; Song, J.; Qu, J.; Li, B.; Zhu, W.; Wong, W.-Y. Near-Infrared Emitting Materials via Harvesting Triplet Excitons: Molecular Design, Properties, and Application in Organic Light Emitting Diodes. Adv. Opt. Mater. 2018, 6, 1800466. [Google Scholar] [CrossRef]
- Xiang, H.; Cheng, J.; Ma, X.; Zhou, X.; Chruma, J.J. Near-infrared phosphorescence: Materials and applications. Chem. Soc. Rev. 2013, 42, 6128–6185. [Google Scholar] [CrossRef]
- Yip, A.M.-H.; Lo, K.K.-W. Luminescent rhenium(I), ruthenium(II), and iridium(III) polypyridine complexes containing a poly(ethylene glycol) pendant or bioorthogonal reaction group as biological probes and photocytotoxic agents. Coord. Chem. Rev. 2018, 361, 138–163. [Google Scholar] [CrossRef]
- Zheng, X.; Jiang, X. CHAPTER 12 Tracking of Hypoxia and Cancer Metastasis with Iridium(iii)-based O2 Probes. In Quenched-phosphorescence Detection of Molecular Oxygen: Applications in Life Sciences; The Royal Society of Chemistry: London, UK, 2018; pp. 244–258. ISBN 978-1-78801-175-4. [Google Scholar]
- Flamigni, L.; Barbieri, A.; Sabatini, C.; Ventura, B.; Barigelletti, F. Photochemistry and Photophysics of Coordination Compounds: Iridium. In Topics in Current Chemistry; Balzani, V., Campagna, S., Eds.; Springer: Berlin/Heidelberg, Germany, 2007; pp. 143–203. ISBN1 978-3-540-73348-5. ISBN2 978-3-540-73349-2. [Google Scholar]
- Yoshihara, T.; Karasawa, Y.; Zhang, S.; Hosaka, M.; Takeuchi, T.; Iida, Y.; Endo, K.; Imamura, T.; Tobita, S. In vivo phosphorescence imaging of cancer using iridium complexes. In Proceedings of the Reporters, Markers, Dyes, Nanoparticles, and Molecular Probes for Biomedical Applications; Achilefu, S., Raghavachari, R., Eds.; Society of Photo Optical: San Jose, CA, USA; p. 71900.
- Zhang, K.Y.; Liu, S.; Zhao, Q.; Li, F.; Huang, W. Phosphorescent Iridium(III) Complexes for Bioimaging BT—Luminescent and Photoactive Transition Metal Complexes as Biomolecular Probes and Cellular Reagents; Lo, K.K.-W., Ed.; Springer: Berlin/Heidelberg, Germany, 2015; pp. 131–180. ISBN 978-3-662-46718-3. [Google Scholar]
- Tobita, S.; Yoshihara, T. Intracellular and in vivo oxygen sensing using phosphorescent iridium(III) complexes. Curr. Opin. Chem. Biol. 2016, 33, 39–45. [Google Scholar] [CrossRef]
- Ma, D.-L.; Wu, C.; Tang, W.; Gupta, A.-R.; Lee, F.-W.; Li, G.; Leung, C.-H. Recent advances in iridium(iii) complex-assisted nanomaterials for biological applications. J. Mater. Chem. B 2018, 6, 537–544. [Google Scholar] [CrossRef]
- Chen, Y.; Rees, T.W.; Ji, L.; Chao, H. Mitochondrial dynamics tracking with iridium(III) complexes. Curr. Opin. Chem. Biol. 2018, 43, 51–57. [Google Scholar] [CrossRef]
- Kritchenkov, I.S.; Chelushkin, P.S.; Sokolov, V.V.; Pavlovskiy, V.V.; Porsev, V.V.; Evarestov, R.A.; Tunik, S.P. Near-Infrared [Ir(N∧C)2(N∧N)]+ Emitters and Their Noncovalent Adducts with Human Serum Albumin: Synthesis and Photophysical and Computational Study. Organometallics 2019, 38, 3740–3751. [Google Scholar] [CrossRef]
- Kritchenkov, I.S.; Elistratova, A.A.; Sokolov, V.V.; Chelushkin, P.S.; Shirmanova, M.V.; Lukina, M.M.; Dudenkova, V.V.; Shcheslavskiy, V.I.; Kalinina, S.; Reeß, K.; et al. A biocompatible phosphorescent Ir(iii) oxygen sensor functionalized with oligo(ethylene glycol) groups: Synthesis, photophysics and application in PLIM experiments. New J. Chem. 2020, 44, 10459–10471. [Google Scholar] [CrossRef]
- Kritchenkov, I.S.; Solomatina, A.I.; Kozina, D.O.; Porsev, V.V.; Sokolov, V.V.; Shirmanova, M.V.; Lukina, M.M.; Komarova, A.D.; Shcheslavskiy, V.I.; Belyaeva, T.N.; et al. Biocompatible Ir(III) Complexes as Oxygen Sensors for Phosphorescence Lifetime Imaging. Molecules 2021, 26, 2898. [Google Scholar] [CrossRef] [PubMed]
- Zhang, H.; Zhang, D.-Y.; Shen, J.; Mao, Z.-W. 3D CoPt nanostructures hybridized with iridium complexes for multimodal imaging and combined photothermal-chemotherapy. J. Inorg. Biochem. 2021, 219, 111429. [Google Scholar] [CrossRef] [PubMed]
- Zhang, Q.; Cao, R.; Fei, H.; Zhou, M. Mitochondria-targeting phosphorescent iridium(iii) complexes for living cell imaging. Dalton Trans. 2014, 43, 16872–16879. [Google Scholar] [CrossRef] [PubMed]
- Zhou, Y.; Xie, K.; Leng, R.; Kong, L.; Liu, C.; Zhang, Q.; Wang, X. Highly efficient electrochemiluminescence labels comprising iridium(iii) complexes. Dalton Trans. 2017, 46, 355–363. [Google Scholar] [CrossRef]
- Liu, F.; Wen, J.; Chen, S.-S.; Sun, S. A luminescent bimetallic iridium(iii) complex for ratiometric tracking intracellular viscosity. Chem. Commun. 2018, 54, 1371–1374. [Google Scholar] [CrossRef]
- Kritchenkov, I.S.; Zhukovsky, D.D.; Mohamed, A.; Korzhikov-Vlakh, V.A.; Tennikova, T.B.; Lavrentieva, A.; Scheper, T.; Pavlovskiy, V.V.; Porsev, V.V.; Evarestov, R.A.; et al. Functionalized Pt(II) and Ir(III) NIR Emitters and Their Covalent Conjugates with Polymer-Based Nanocarriers. Bioconjug. Chem. 2020, 31, 1327–1343. [Google Scholar] [CrossRef]
- Kuznetsov, K.M.; Kritchenkov, I.S.; Shakirova, J.R.; Gurzhiy, V.V.; Pavlovskiy, V.V.; Porsev, V.V.; Sokolov, V.V.; Tunik, S.P. Red-to-NIR Iridium(III) Emitters: Synthesis, Photophysical and Computational Study, the Effects of Cyclometallating and β-Diketonate Ligands. Eur. J. Inorg. Chem. 2021, 2021, 2163–2170. [Google Scholar] [CrossRef]
- Zheng, X.; Wang, X.; Mao, H.; Wu, W.; Liu, B.; Jiang, X. Hypoxia-specific ultrasensitive detection of tumours and cancer cells in vivo. Nat. Commun. 2015, 6, 5834. [Google Scholar] [CrossRef]
- Wang, X.; Yang, H.; Wen, Y.; Wang, L.; Li, J.; Zhang, J. Comprehension of the Effect of a Hydroxyl Group in Ancillary Ligand on Phosphorescent Property for Heteroleptic Ir(III) Complexes: A Computational Study Using Quantitative Prediction. Inorg. Chem. 2017, 56, 8986–8995. [Google Scholar] [CrossRef]
- Chen, P.; Meyer, T.J. Medium Effects on Charge Transfer in Metal Complexes. Chem. Rev. 1998, 98, 1439–1478. [Google Scholar] [CrossRef]
- Esipova, T.V.; Karagodov, A.; Miller, J.; Wilson, D.F.; Busch, T.M.; Vinogradov, S.A. Two new “protected” oxyphors for biological oximetry: Properties and application in tumor imaging. Anal. Chem. 2011, 83, 8756–8765. [Google Scholar] [CrossRef] [PubMed] [Green Version]
- Esipova, T.V.; Barrett, M.J.P.; Erlebach, E.; Masunov, A.E.; Weber, B.; Vinogradov, S.A. Oxyphor 2P: A High-Performance Probe for Deep-Tissue Longitudinal Oxygen Imaging. Cell Metab. 2019, 29, 736–744.e7. [Google Scholar] [CrossRef] [PubMed] [Green Version]
- Roussakis, E.; Spencer, J.A.; Lin, C.P.; Vinogradov, S.A. Two-Photon Antenna-Core Oxygen Probe with Enhanced Performance. Anal. Chem. 2014, 86, 5937–5945. [Google Scholar] [CrossRef] [PubMed]
- Chelushkin, P.S.; Krupenya, D.V.; Tseng, Y.J.; Kuo, T.Y.; Chou, P.T.; Koshevoy, I.O.; Burov, S.V.; Tunik, S.P. Water-soluble noncovalent adducts of the heterometallic copper subgroup complexes and human serum albumin with remarkable luminescent properties. Chem. Commun. 2014, 50, 849–851. [Google Scholar] [CrossRef]
- Solomatina, A.I.; Baigildin, V.A.; Zhukovsky, D.D.; Krupenya, D.V.; Koshel, E.I.; Shcheslavskiy, V.I.; Tunik, S.P.; Chelushkin, P.S. How to avoid protein aggregation to improve cellular uptake of albumin-based conjugates: Towards the rational design of cell-penetrable phosphorescent probes. Colloid Polym. Sci. 2019, 297, 325–337. [Google Scholar] [CrossRef]
- Mahanta, S.; Balia Singh, R.; Bagchi, A.; Nath, D.; Guchhait, N. Study of protein–probe complexation equilibria and protein–surfactant interaction using charge transfer fluorescence probe methyl ester of N,N-dimethylamino naphthyl acrylic acid. J. Lumin. 2010, 130, 917–926. [Google Scholar] [CrossRef]
- Fasano, M.; Curry, S.; Terreno, E.; Galliano, M.; Fanali, G.; Narciso, P.; Notari, S.; Ascenzi, P. The extraordinary ligand binding properties of human serum albumin. IUBMB Life 2005, 57, 787–796. [Google Scholar] [CrossRef]
- Agudelo, D.; Bérubé, G.; Tajmir-Riahi, H.A. An overview on the delivery of antitumor drug doxorubicin by carrier proteins. Int. J. Biol. Macromol. 2016, 88, 354–360. [Google Scholar] [CrossRef]
- Krytchankou, I.S.; Krupenya, D.V.; Gurzhiy, V.V.; Belyaev, A.A.; Karttunen, A.J.; Koshevoy, I.O.; Melnikov, A.S.; Tunik, S.P. Synthesis, characterization and photophysical properties of gold(I)-copper(I) alkynyl clusters with 1,4-bis(diphenylphosphino)butane, effect of the diphosphine ligand on luminescence characteristics. J. Organomet. Chem. 2013, 723, 65–71. [Google Scholar] [CrossRef]
- Gupta, T.; Singh, J.B.; Mishra, K.; Maiti, B.; Singh, R.M. Facile Metal-Free Synthesis of Phenanthridines by SN2′ Reaction/C–H Functionalization/Aromatization through the Reaction of Morita–Baylis–Hillman Acetates with Nitroalkanes. Eur. J. Org. Chem. 2018, 2018, 1130–1135. [Google Scholar] [CrossRef]
- Jakkaraj, S.R.; Young, V.G.; Georg, G.I. Syntheses of PDE3A inhibitor ORG9935 and determination of the absolute stereochemistries of its enantiomers by X-ray crystallography. Tetrahedron 2018, 74, 2769–2774. [Google Scholar] [CrossRef] [PubMed]
- Treatments, M.O.F. US 020140256733 A1, 7 March 2014.
- Wang, C.; Lystrom, L.; Yin, H.; Hetu, M.; Kilina, S.; McFarland, S.A.; Sun, W. Increasing the triplet lifetime and extending the ground-state absorption of biscyclometalated Ir(iii) complexes for reverse saturable absorption and photodynamic therapy applications. Dalton Trans. 2016, 45, 16366–16378. [Google Scholar] [CrossRef] [PubMed]
- Frisch, M.J.; Trucks, G.W.; Schlegel, H.B.; Scuseria, G.E.; Robb, M.A.; Cheeseman, J.R.; Scalmani, G.; Barone, V.; Petersson, G.A.; Nakatsuji, H.; et al. Gaussian 16, Revision B.01; Gaussian, Inc.: Wallingford, CT, USA, 2016. [Google Scholar]
- Austin, A.; Petersson, G.A.; Frisch, M.J.; Dobek, F.J.; Scalmani, G.; Throssell, K. A Density Functional with Spherical Atom Dispersion Terms. J. Chem. Theory Comput. 2012, 8, 4989–5007. [Google Scholar] [CrossRef] [PubMed]
- Peverati, R.; Truhlar, D.G. Screened-exchange density functionals with broad accuracy for chemistry and solid-state physics. Phys. Chem. Chem. Phys. 2012, 14, 16187–16191. [Google Scholar] [CrossRef] [PubMed]
- Dolg, M.; Wedig, U.; Stoll, H.; Preuss, H. Energy-adjusted ab initio pseudopotentials for the first row transition elements. J. Chem. Phys. 1987, 86, 866–872. [Google Scholar] [CrossRef]
- Tomasi, J.; Mennucci, B.; Cammi, R. Quantum Mechanical Continuum Solvation Models. Chem. Rev. 2005, 105, 2999–3094. [Google Scholar] [CrossRef] [PubMed]
- O’boyle, N.M.; Tenderholt, A.L.; Langner, K.M. Cclib: A library for package-independent computational chemistry algorithms. J. Comput. Chem. 2008, 29, 839–845. [Google Scholar] [CrossRef]
- Martin, R.L. Natural transition orbitals. J. Chem. Phys. 2003, 118, 4775–4777. [Google Scholar] [CrossRef]
- Lu, T.; Chen, F. Multiwfn: A multifunctional wavefunction analyzer. J. Comput. Chem. 2012, 33, 580–592. [Google Scholar] [CrossRef]


| τaer (µs) a | τdeg (µs) a | τdeg/ τaer | QYaer (%) b | QYdeg (%) b | λex (nm) c | λem (nm) b | krad s−1 * 104 | knonrad s−1 * 105 | |
|---|---|---|---|---|---|---|---|---|---|
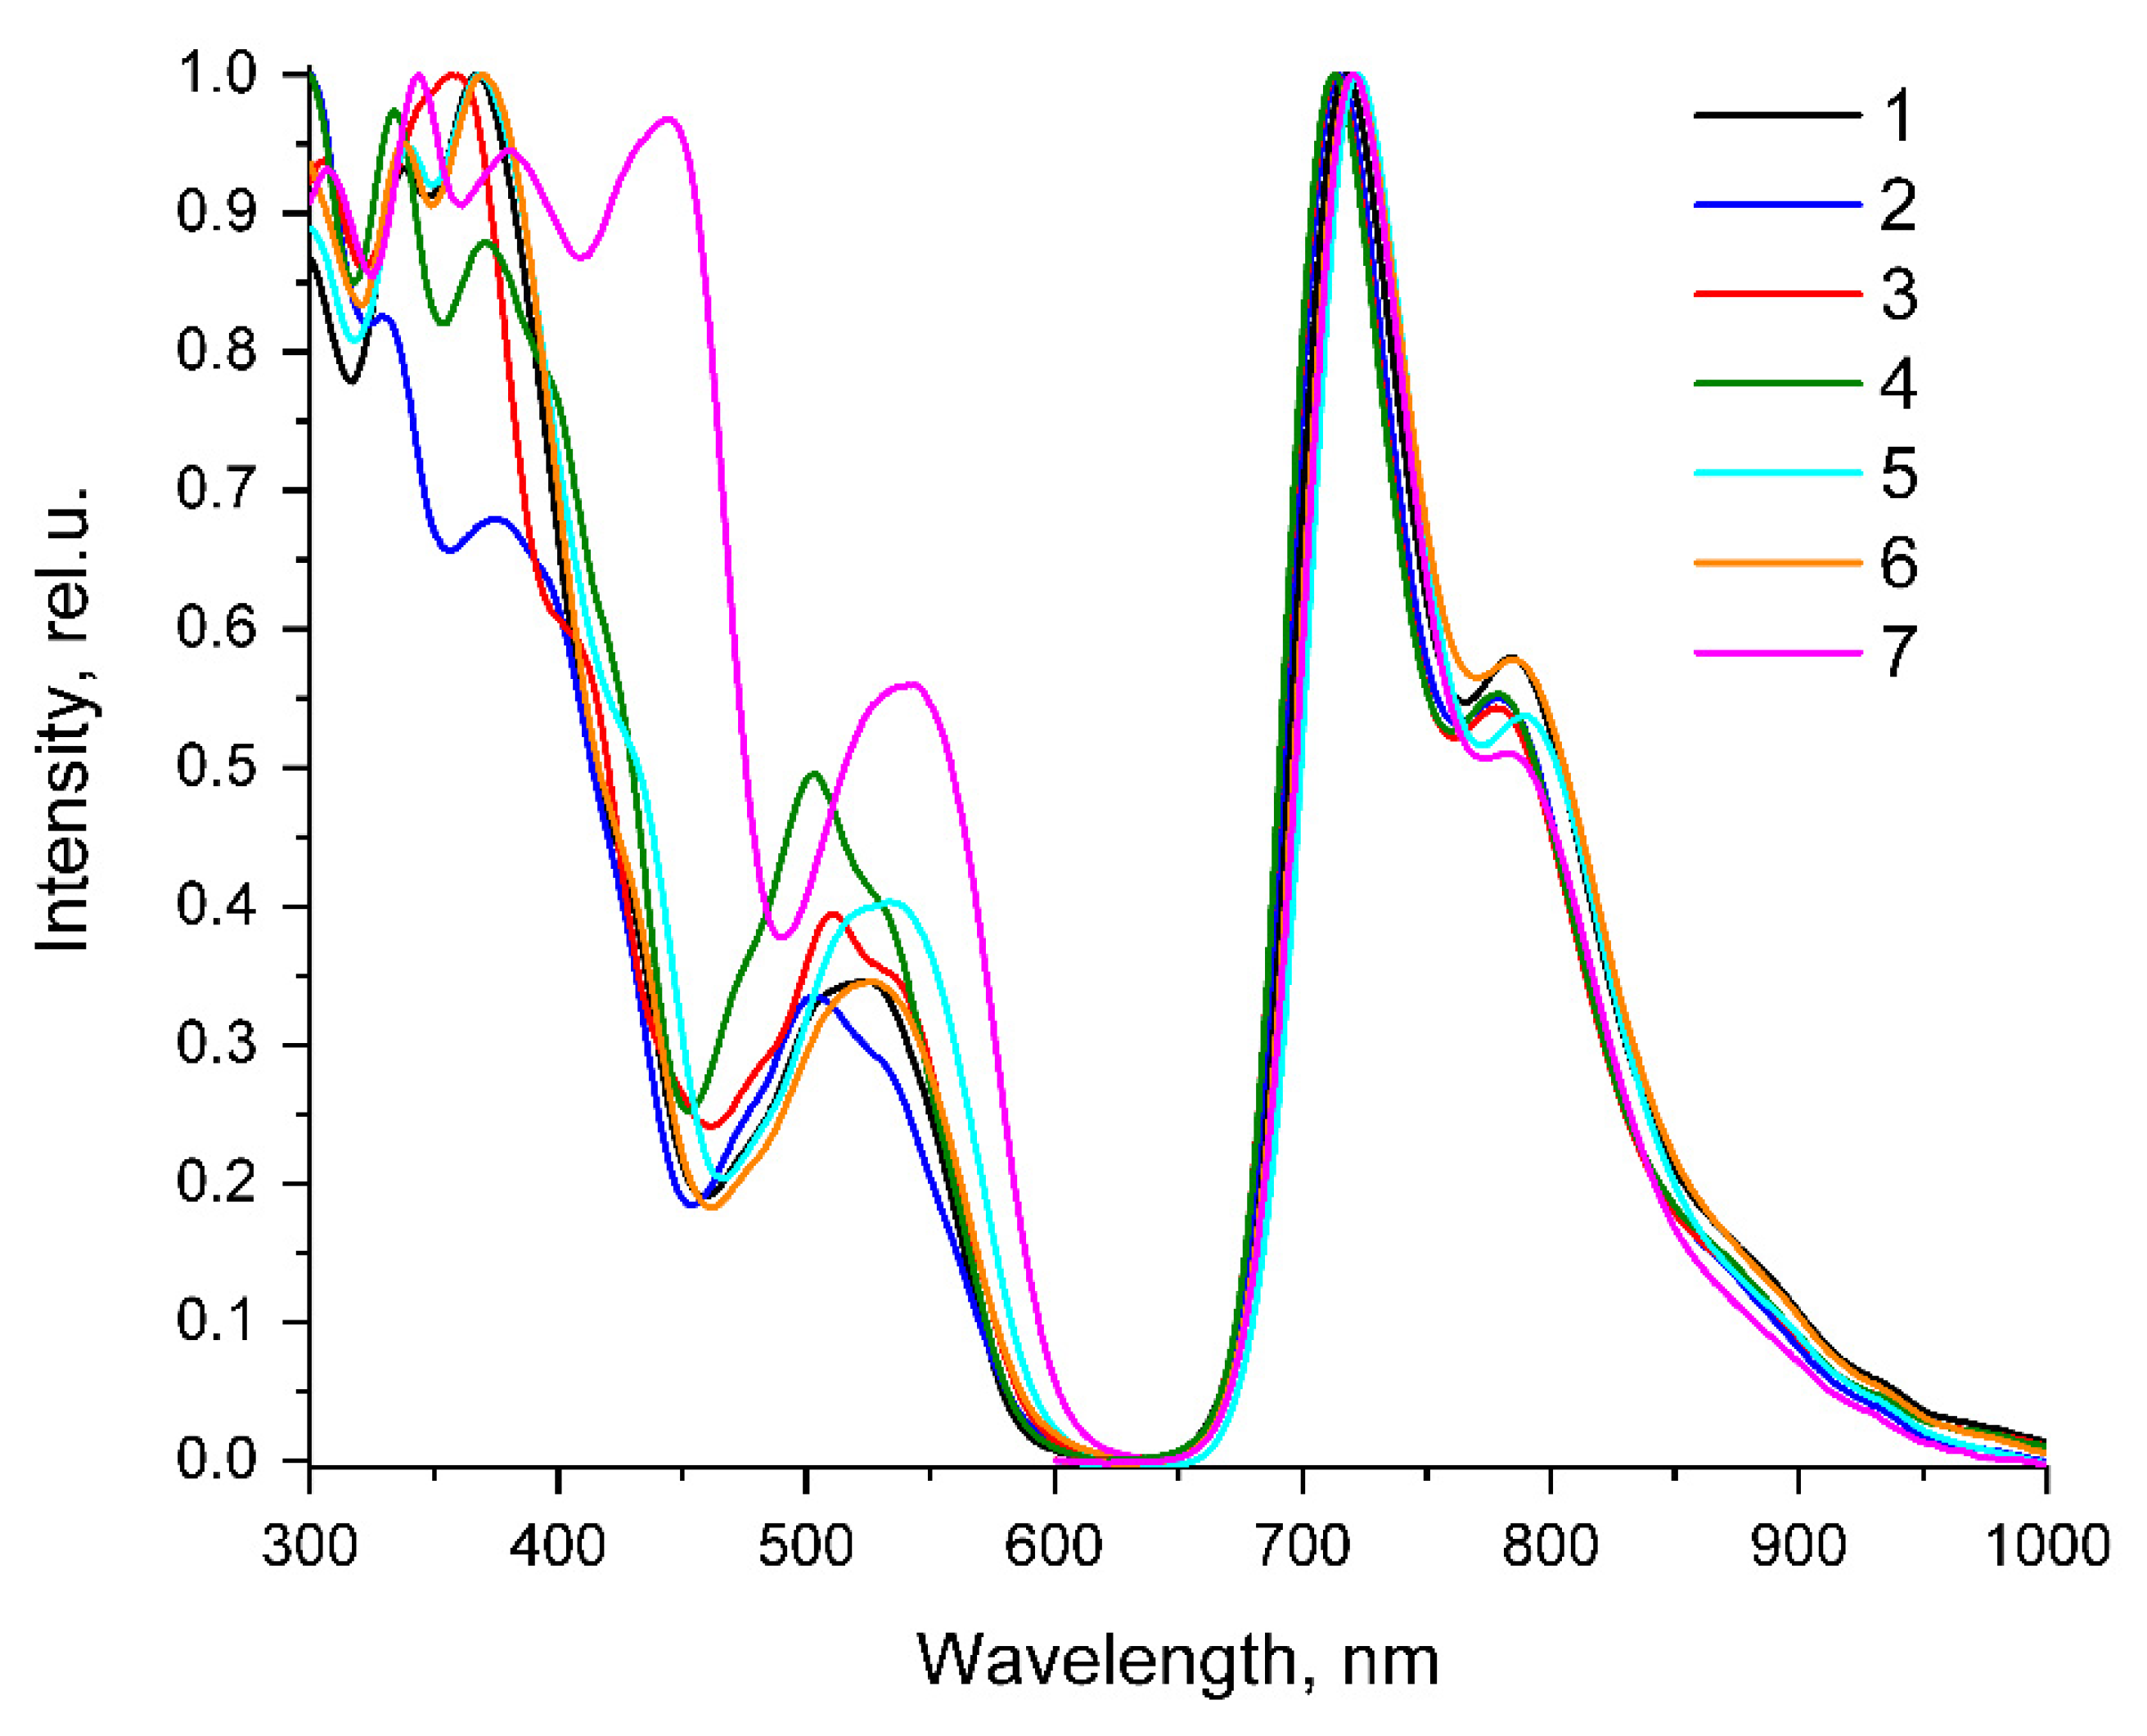
| 1 | 0.41 | 3.32 | 8.2 | 1.7 | 13.6 | 263, 298, 338, 367, 430sh, 475sh, 505sh, 525 | 717, 784, 885sh | 4.10 | 2.60 |
| 2 | 0.28 | 2.34 | 8.4 | 1.6 | 12.9 | 277, 297, 330, 375, 398sh, 426sh, 473sh, 504, 532sh | 715, 779, 875sh | 5.51 | 3.72 |
| 3 | 0.25 | 1.76 | 7.0 | 1.5 | 10.3 | 264, 293sh, 306, 344sh, 358, 410sh, 478sh, 511, 537sh | 713, 778, 880sh | 5.85 | 5.10 |
| 4 | 0.27 | 2.22 | 8.2 | 1.6 | 12.7 | 266, 270sh, 297sh, 334, 371, 410sh, 473sh, 503, 533sh | 713, 779, 870sh | 5.72 | 3.93 |
| 5 | 0.43 | 3.37 | 7.9 | 1.6 | 12.2 | 264, 300, 340, 369, 433sh, 480sh, 518sh, 534 | 720, 790, 890sh | 3.62 | 2.61 |
| 6 | 0.41 | 3.18 | 7.7 | 1.5 | 11.1 | 267, 305sh, 338, 370, 430sh, 477sh, 508sh, 527 | 722, 785, 895sh | 3.49 | 2.80 |
| 7 | 0.58 | 5.39 | 9.2 | 2.3 | 20.5 | 263, 307, 344, 380, 430sh, 445, 525sh, 541 | 720, 783, 890sh | 3.80 | 1.47 |
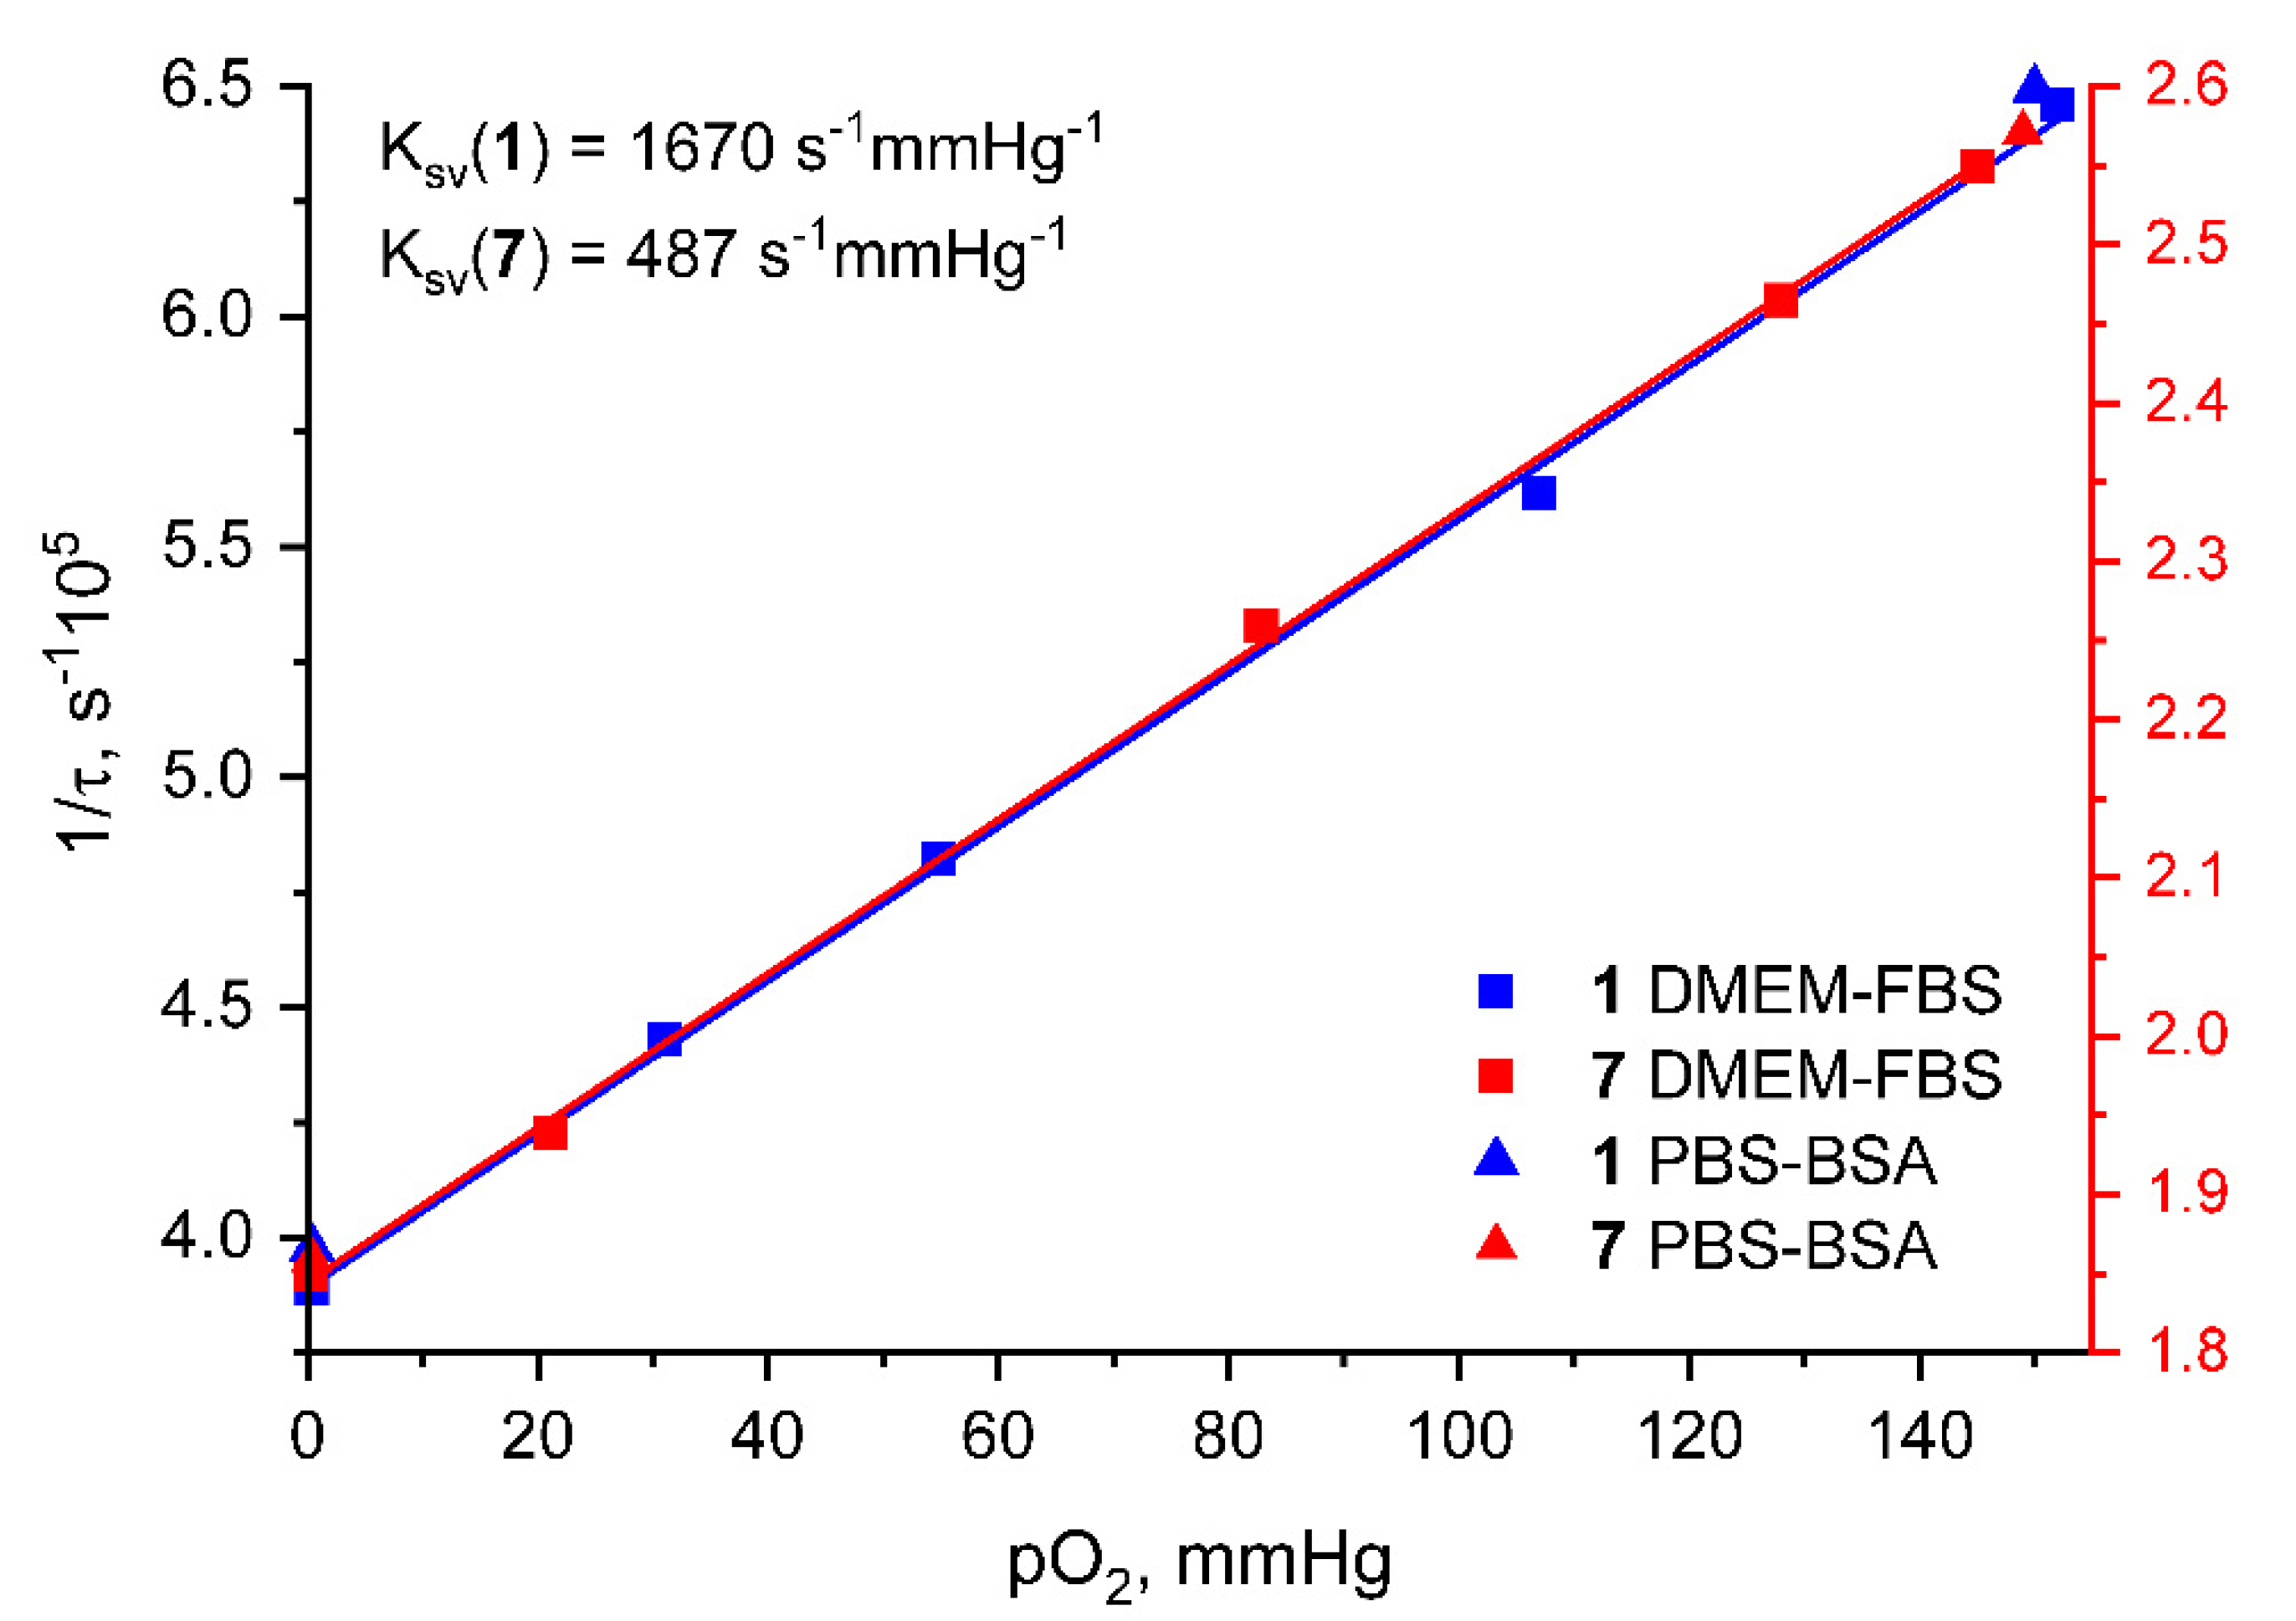
| DMEM 88.5 % v/v; FBS 10% v/v; PEG-200 1.5 % v/v; C(1) = 5 µM | DMEM 87.5% v/v; FBS 10% v/v; PEG-200 2.5 % v/v; C(7) = 10 µM | ||
| p(O2), mmHg | τaer (µs) | p(O2), mmHg | τaer (µs) |
| 152 | 1.55 | 145 | 3.92 |
| 107 | 1.78 | 128 | 4.06 |
| 54.8 | 2.07 | 82.9 | 4.43 |
| 31.1 | 2.26 | 21.1 | 5.16 |
| 0.39 | 2.57 | 0.36 | 5.41 |
| PBS (0.01 M, pH 7.4) 98.5 % v/v; BSA 50 µM; PEG-200 1.5 % v/v; C(1) = 5 µM | PBS (0.01 M, pH 7.4) 97.5 % v/v; BSA 50 µM; PEG-200 2.5 % v/v; C(7) = 10 µM | ||
| p(O2), mmHg | τaer (µs) | p(O2), mmHg | τaer (µs) |
| 150 | 1.55 | 149 | 3.89 |
| 0.40 | 2.51 | 0.38 | 5.38 |
Publisher’s Note: MDPI stays neutral with regard to jurisdictional claims in published maps and institutional affiliations. |
© 2022 by the authors. Licensee MDPI, Basel, Switzerland. This article is an open access article distributed under the terms and conditions of the Creative Commons Attribution (CC BY) license (https://creativecommons.org/licenses/by/4.0/).
Share and Cite
Kritchenkov, I.S.; Mikhnevich, V.G.; Stashchak, V.S.; Solomatina, A.I.; Kozina, D.O.; Sokolov, V.V.; Tunik, S.P. Novel NIR-Phosphorescent Ir(III) Complexes: Synthesis, Characterization and Their Exploration as Lifetime-Based O2 Sensors in Living Cells. Molecules 2022, 27, 3156. https://doi.org/10.3390/molecules27103156
Kritchenkov IS, Mikhnevich VG, Stashchak VS, Solomatina AI, Kozina DO, Sokolov VV, Tunik SP. Novel NIR-Phosphorescent Ir(III) Complexes: Synthesis, Characterization and Their Exploration as Lifetime-Based O2 Sensors in Living Cells. Molecules. 2022; 27(10):3156. https://doi.org/10.3390/molecules27103156
Chicago/Turabian StyleKritchenkov, Ilya S., Vitaliya G. Mikhnevich, Victoria S. Stashchak, Anastasia I. Solomatina, Daria O. Kozina, Victor V. Sokolov, and Sergey P. Tunik. 2022. "Novel NIR-Phosphorescent Ir(III) Complexes: Synthesis, Characterization and Their Exploration as Lifetime-Based O2 Sensors in Living Cells" Molecules 27, no. 10: 3156. https://doi.org/10.3390/molecules27103156
APA StyleKritchenkov, I. S., Mikhnevich, V. G., Stashchak, V. S., Solomatina, A. I., Kozina, D. O., Sokolov, V. V., & Tunik, S. P. (2022). Novel NIR-Phosphorescent Ir(III) Complexes: Synthesis, Characterization and Their Exploration as Lifetime-Based O2 Sensors in Living Cells. Molecules, 27(10), 3156. https://doi.org/10.3390/molecules27103156