
Transcriptomics Reveals Host-Dependent Differences of Polysaccharides Biosynthesis in Cynomorium songaricum


Abstract
:1. Introduction
2. Results
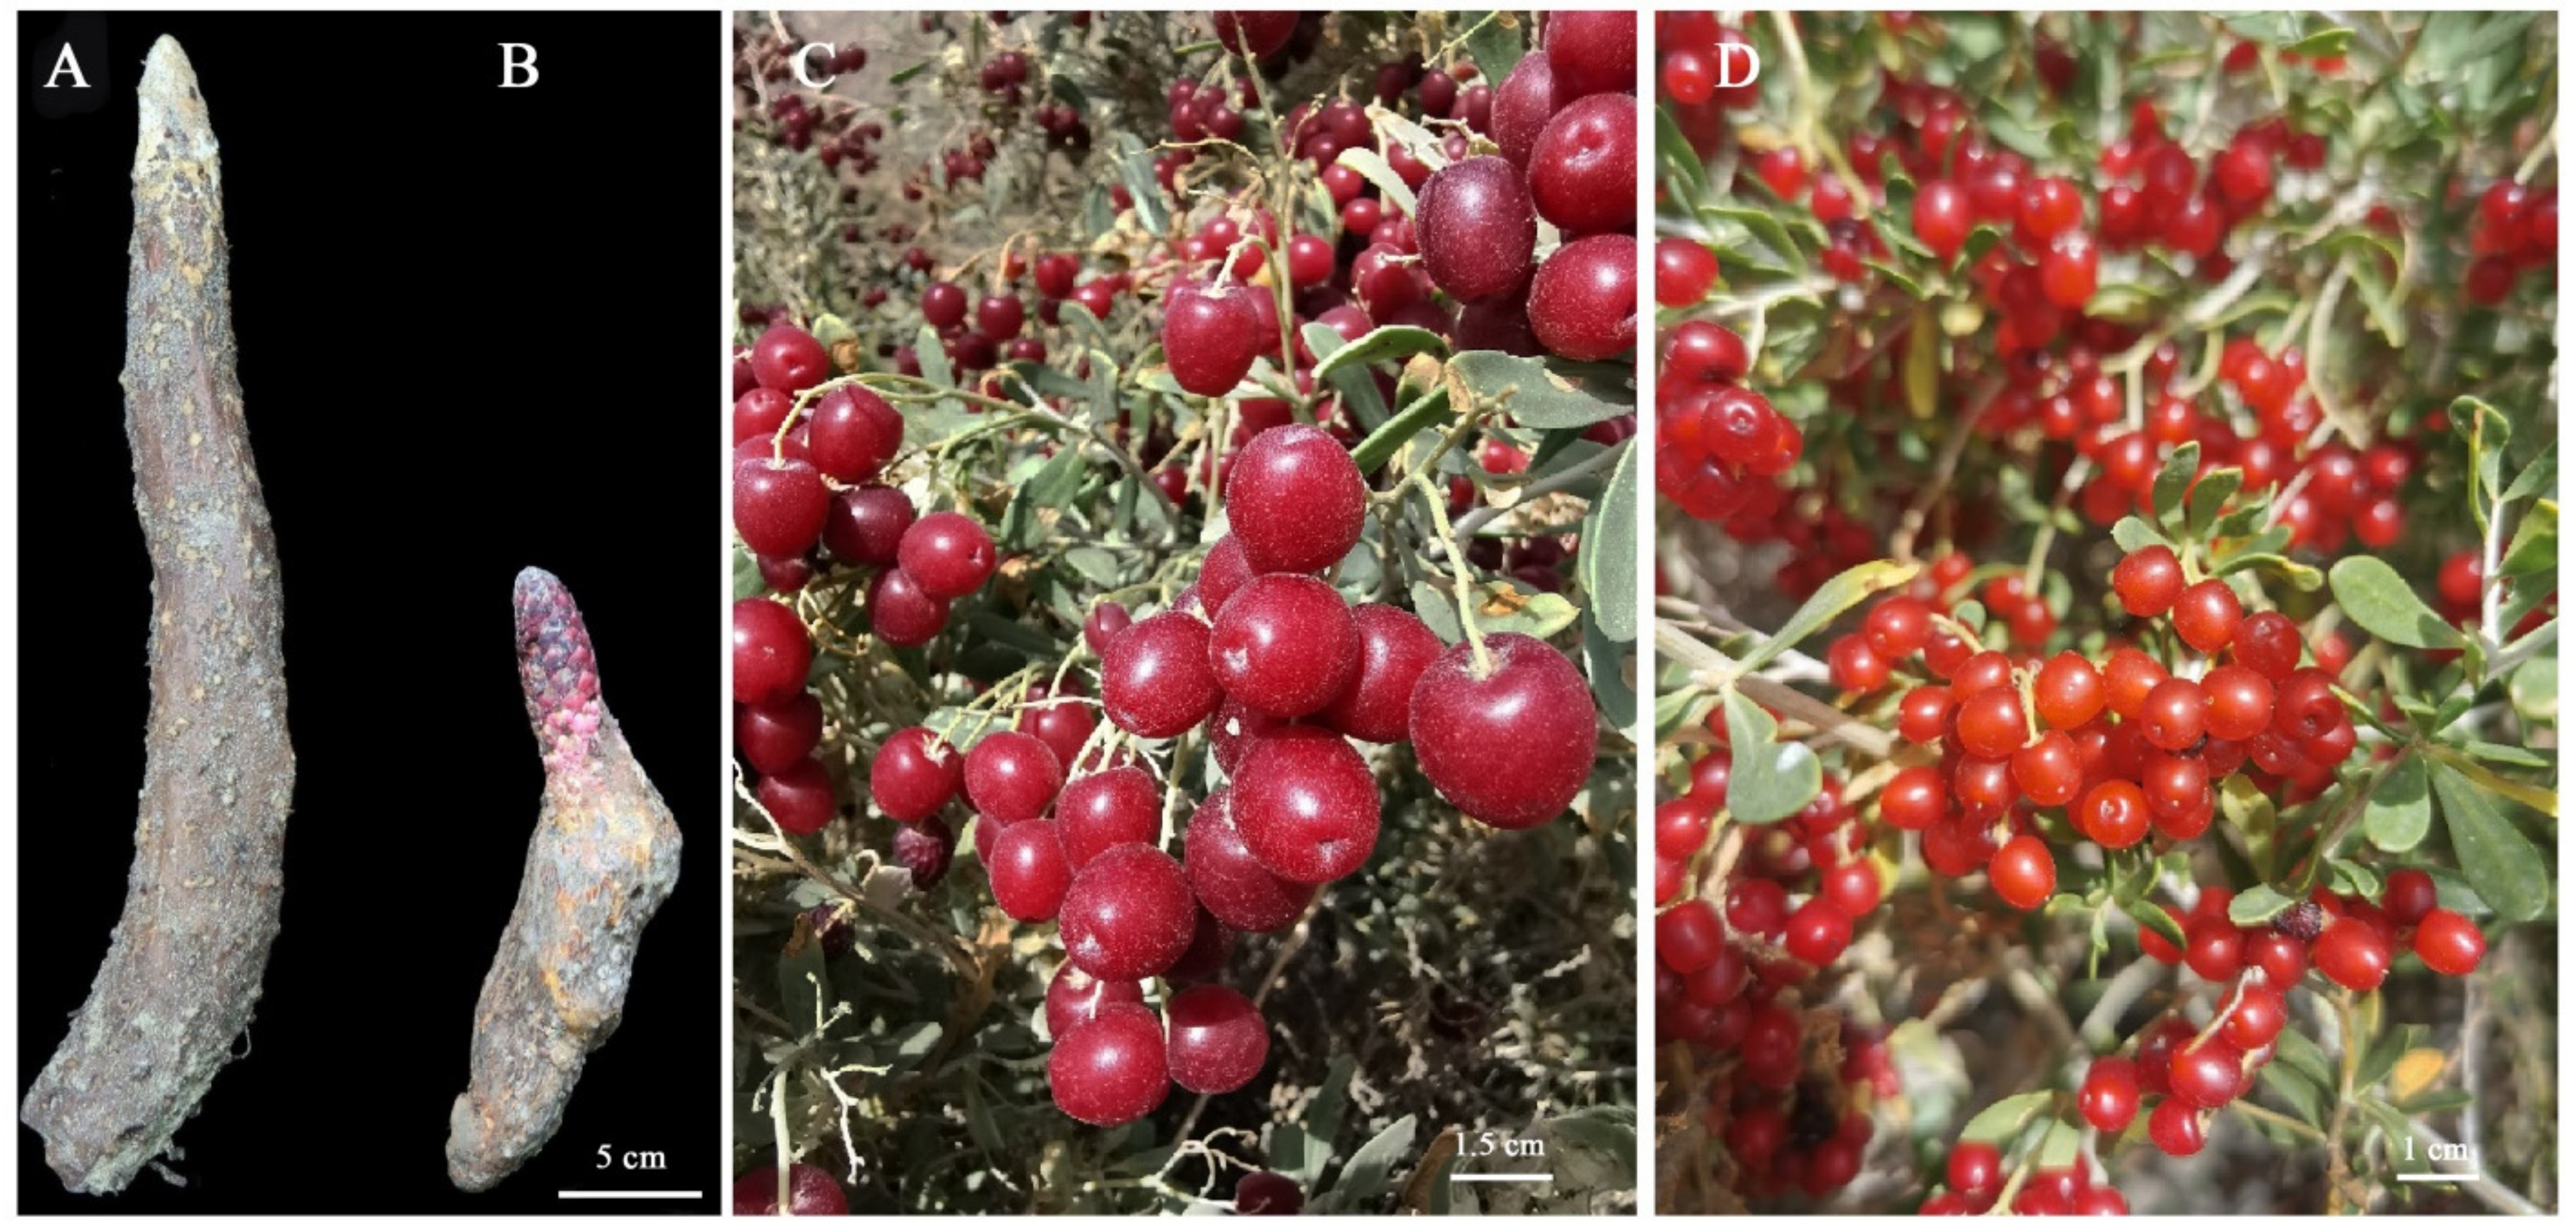
2.1. Comparison of Growth Characteristics between CR and CS
2.2. Comparison of Soluble Sugar Content and Antioxidant Capacity between CR and CS
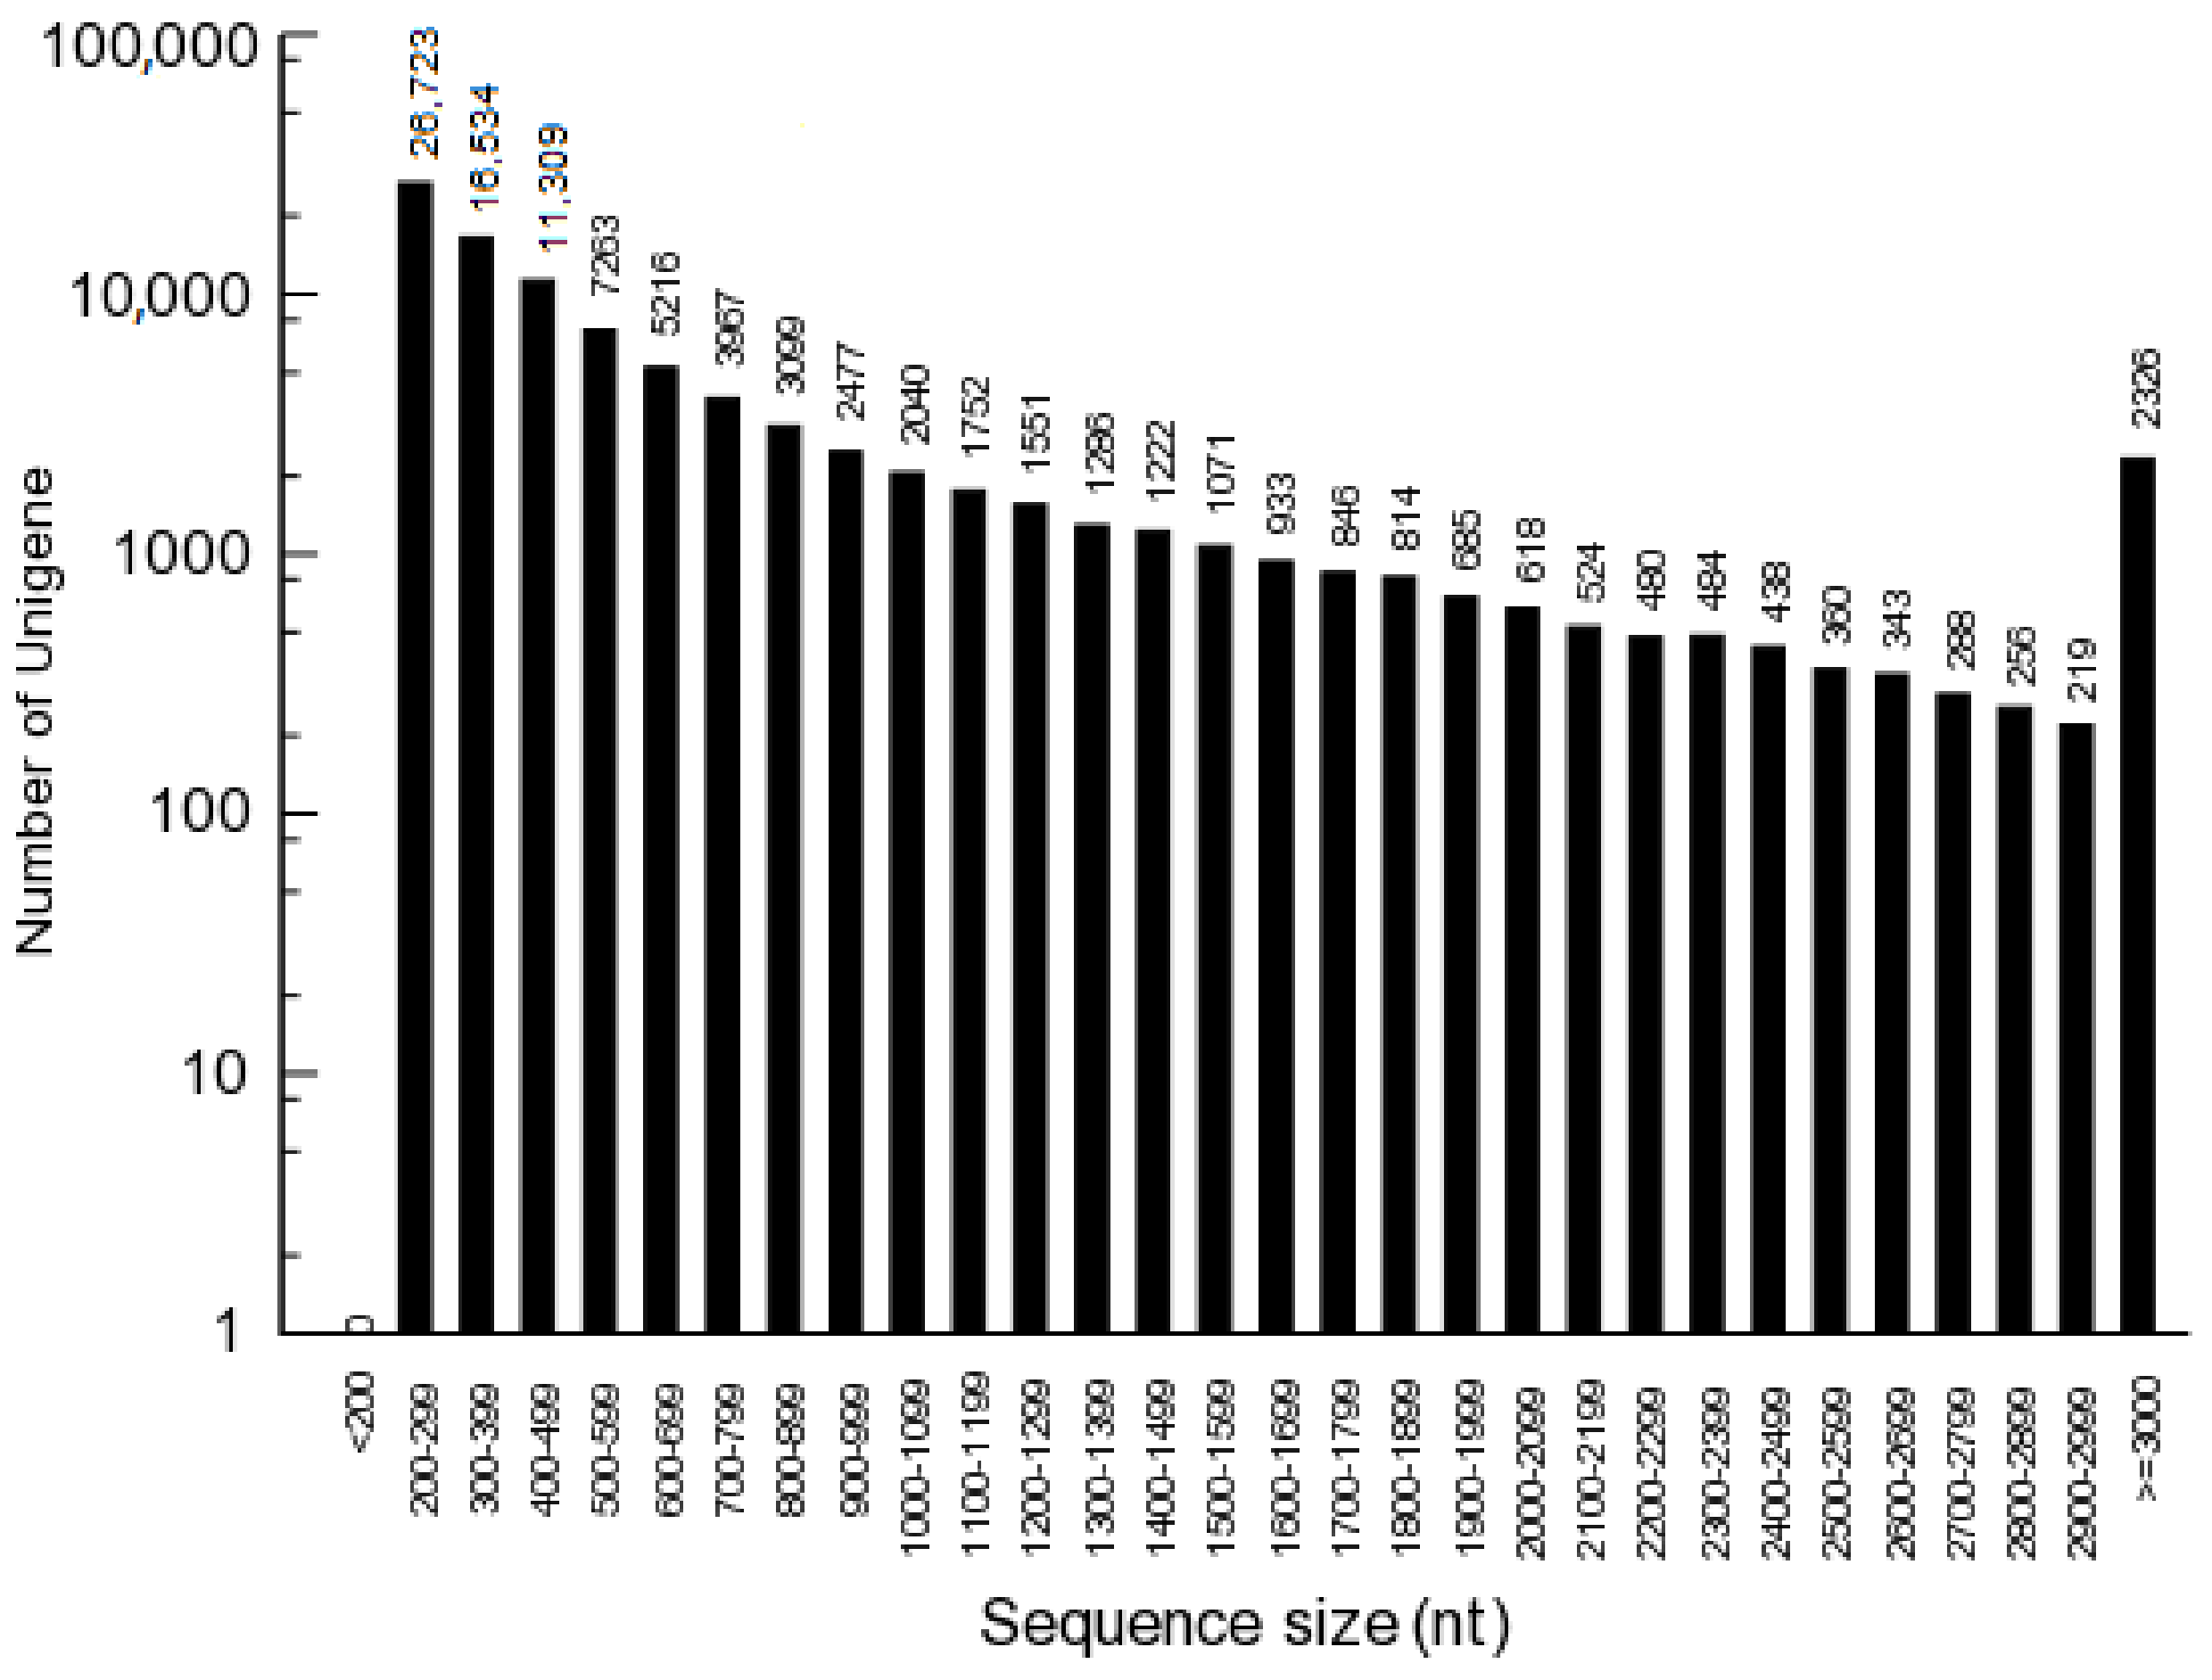
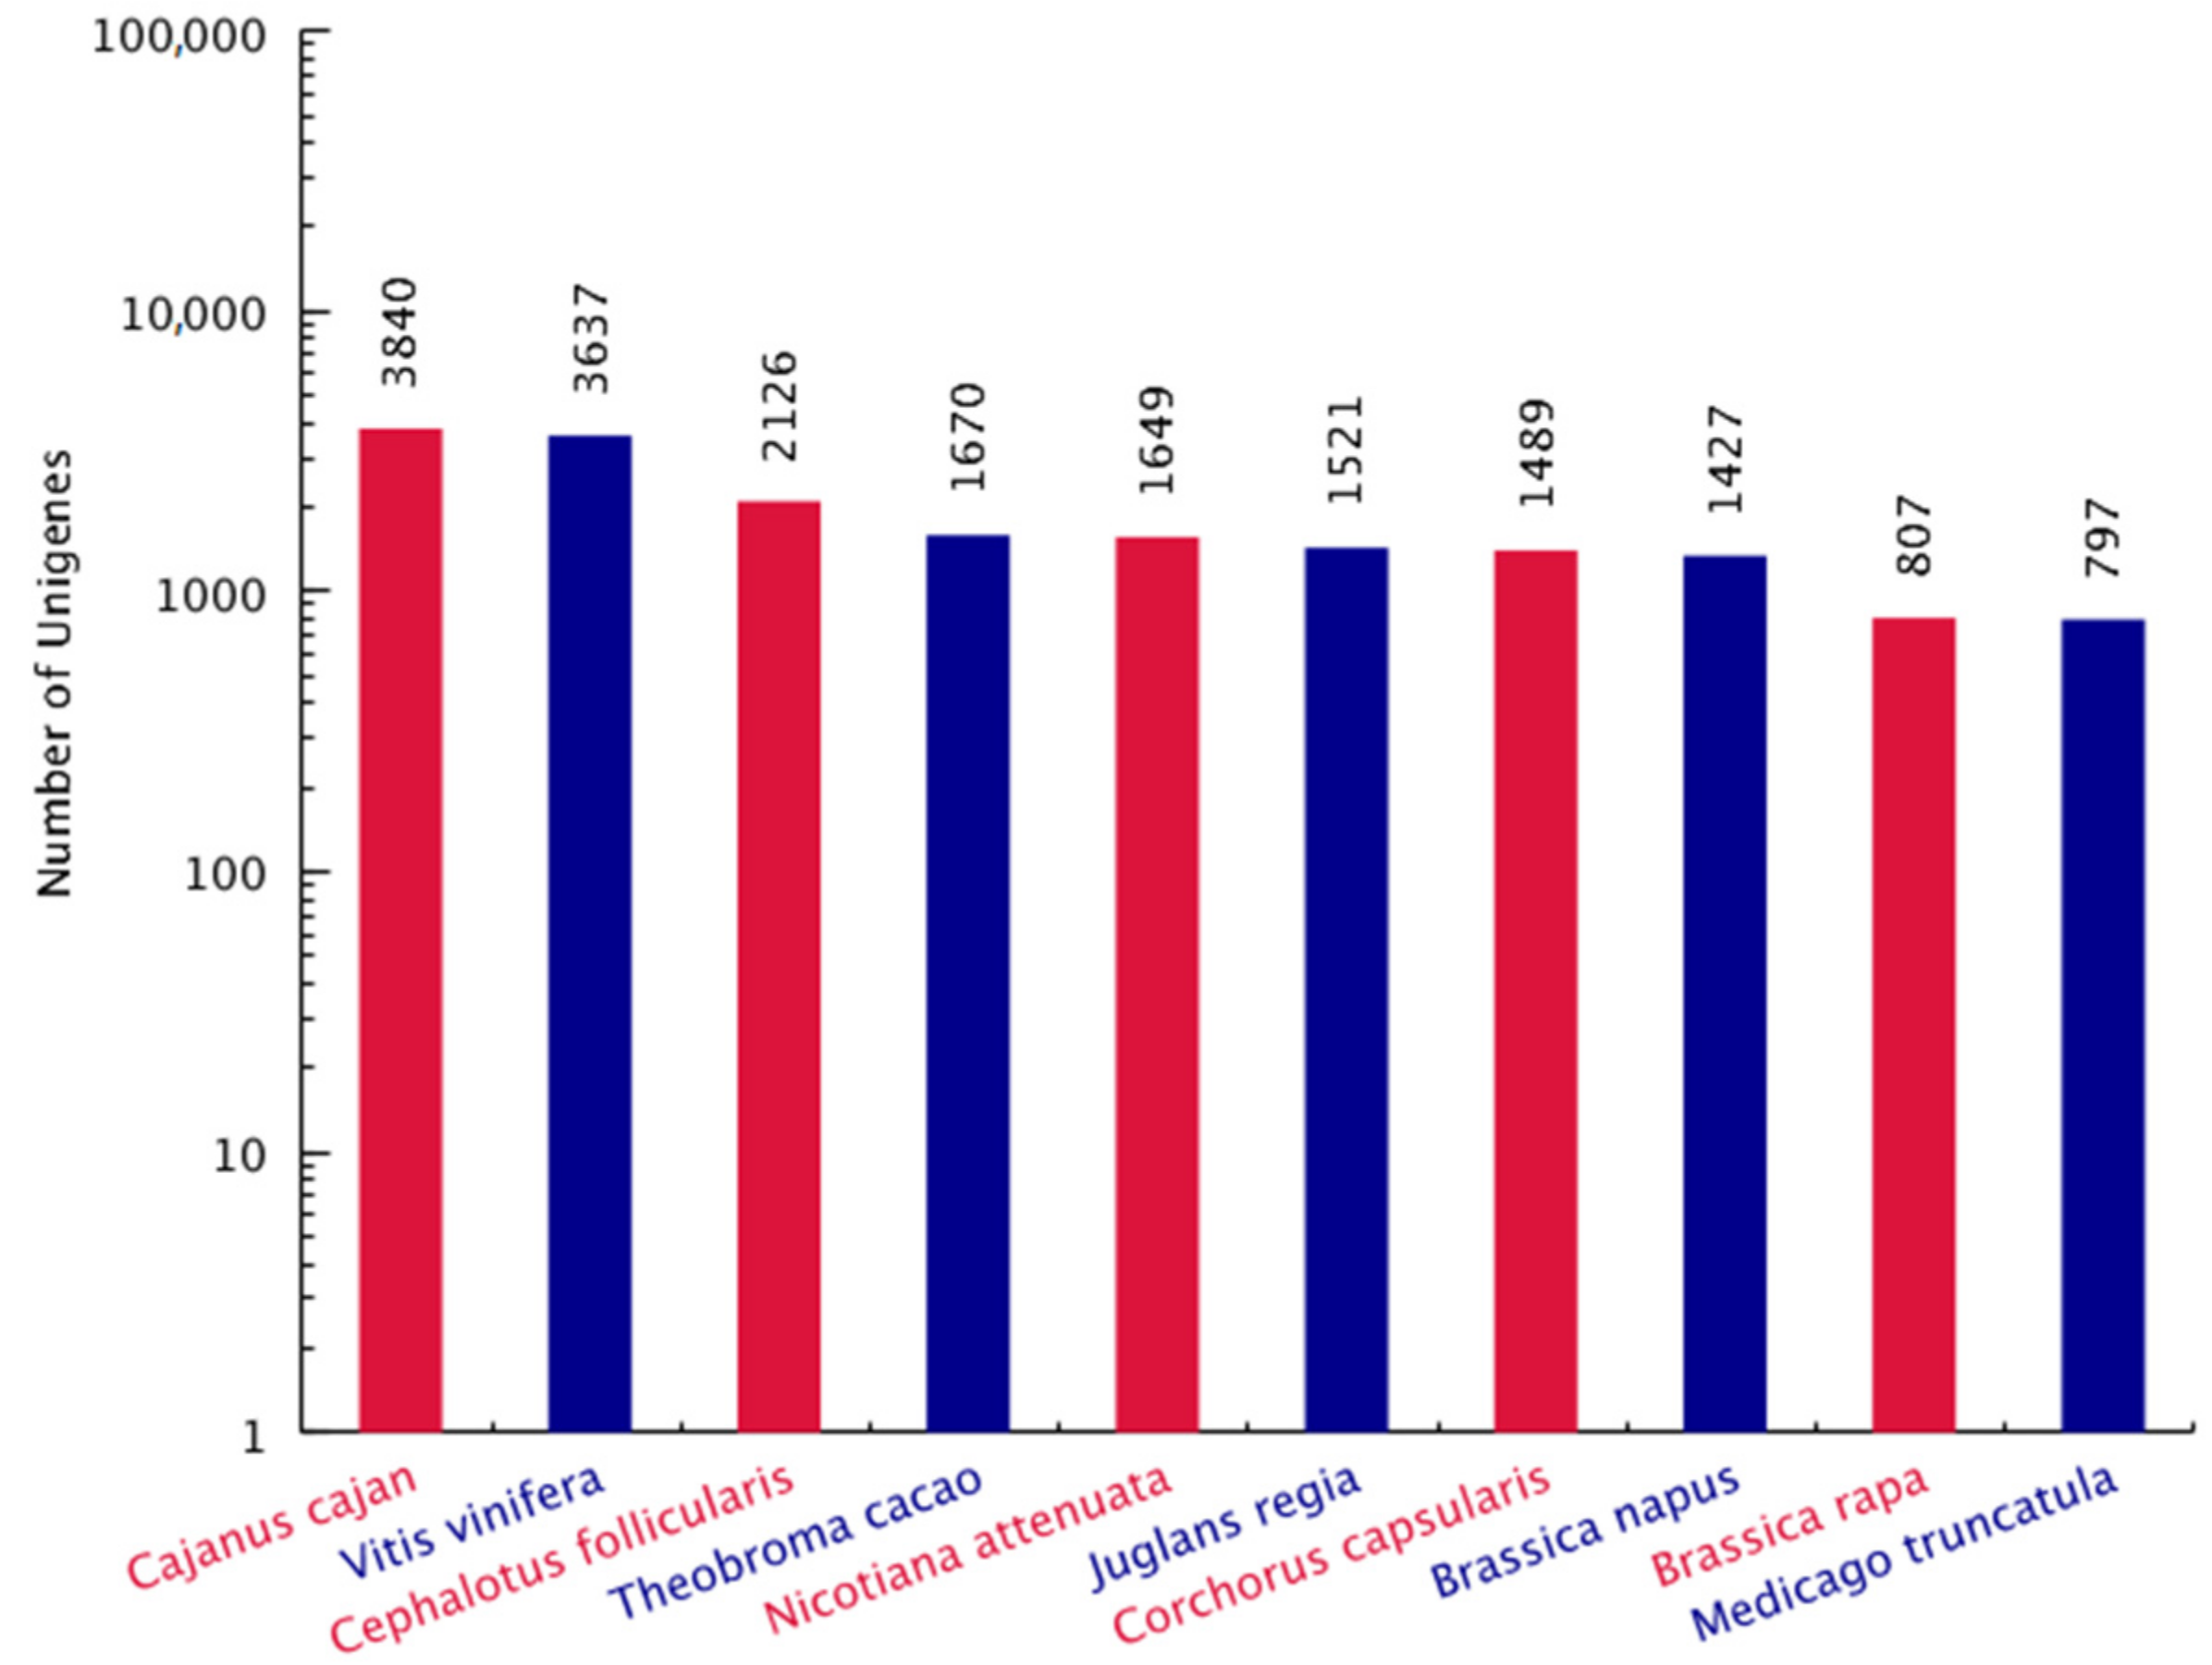
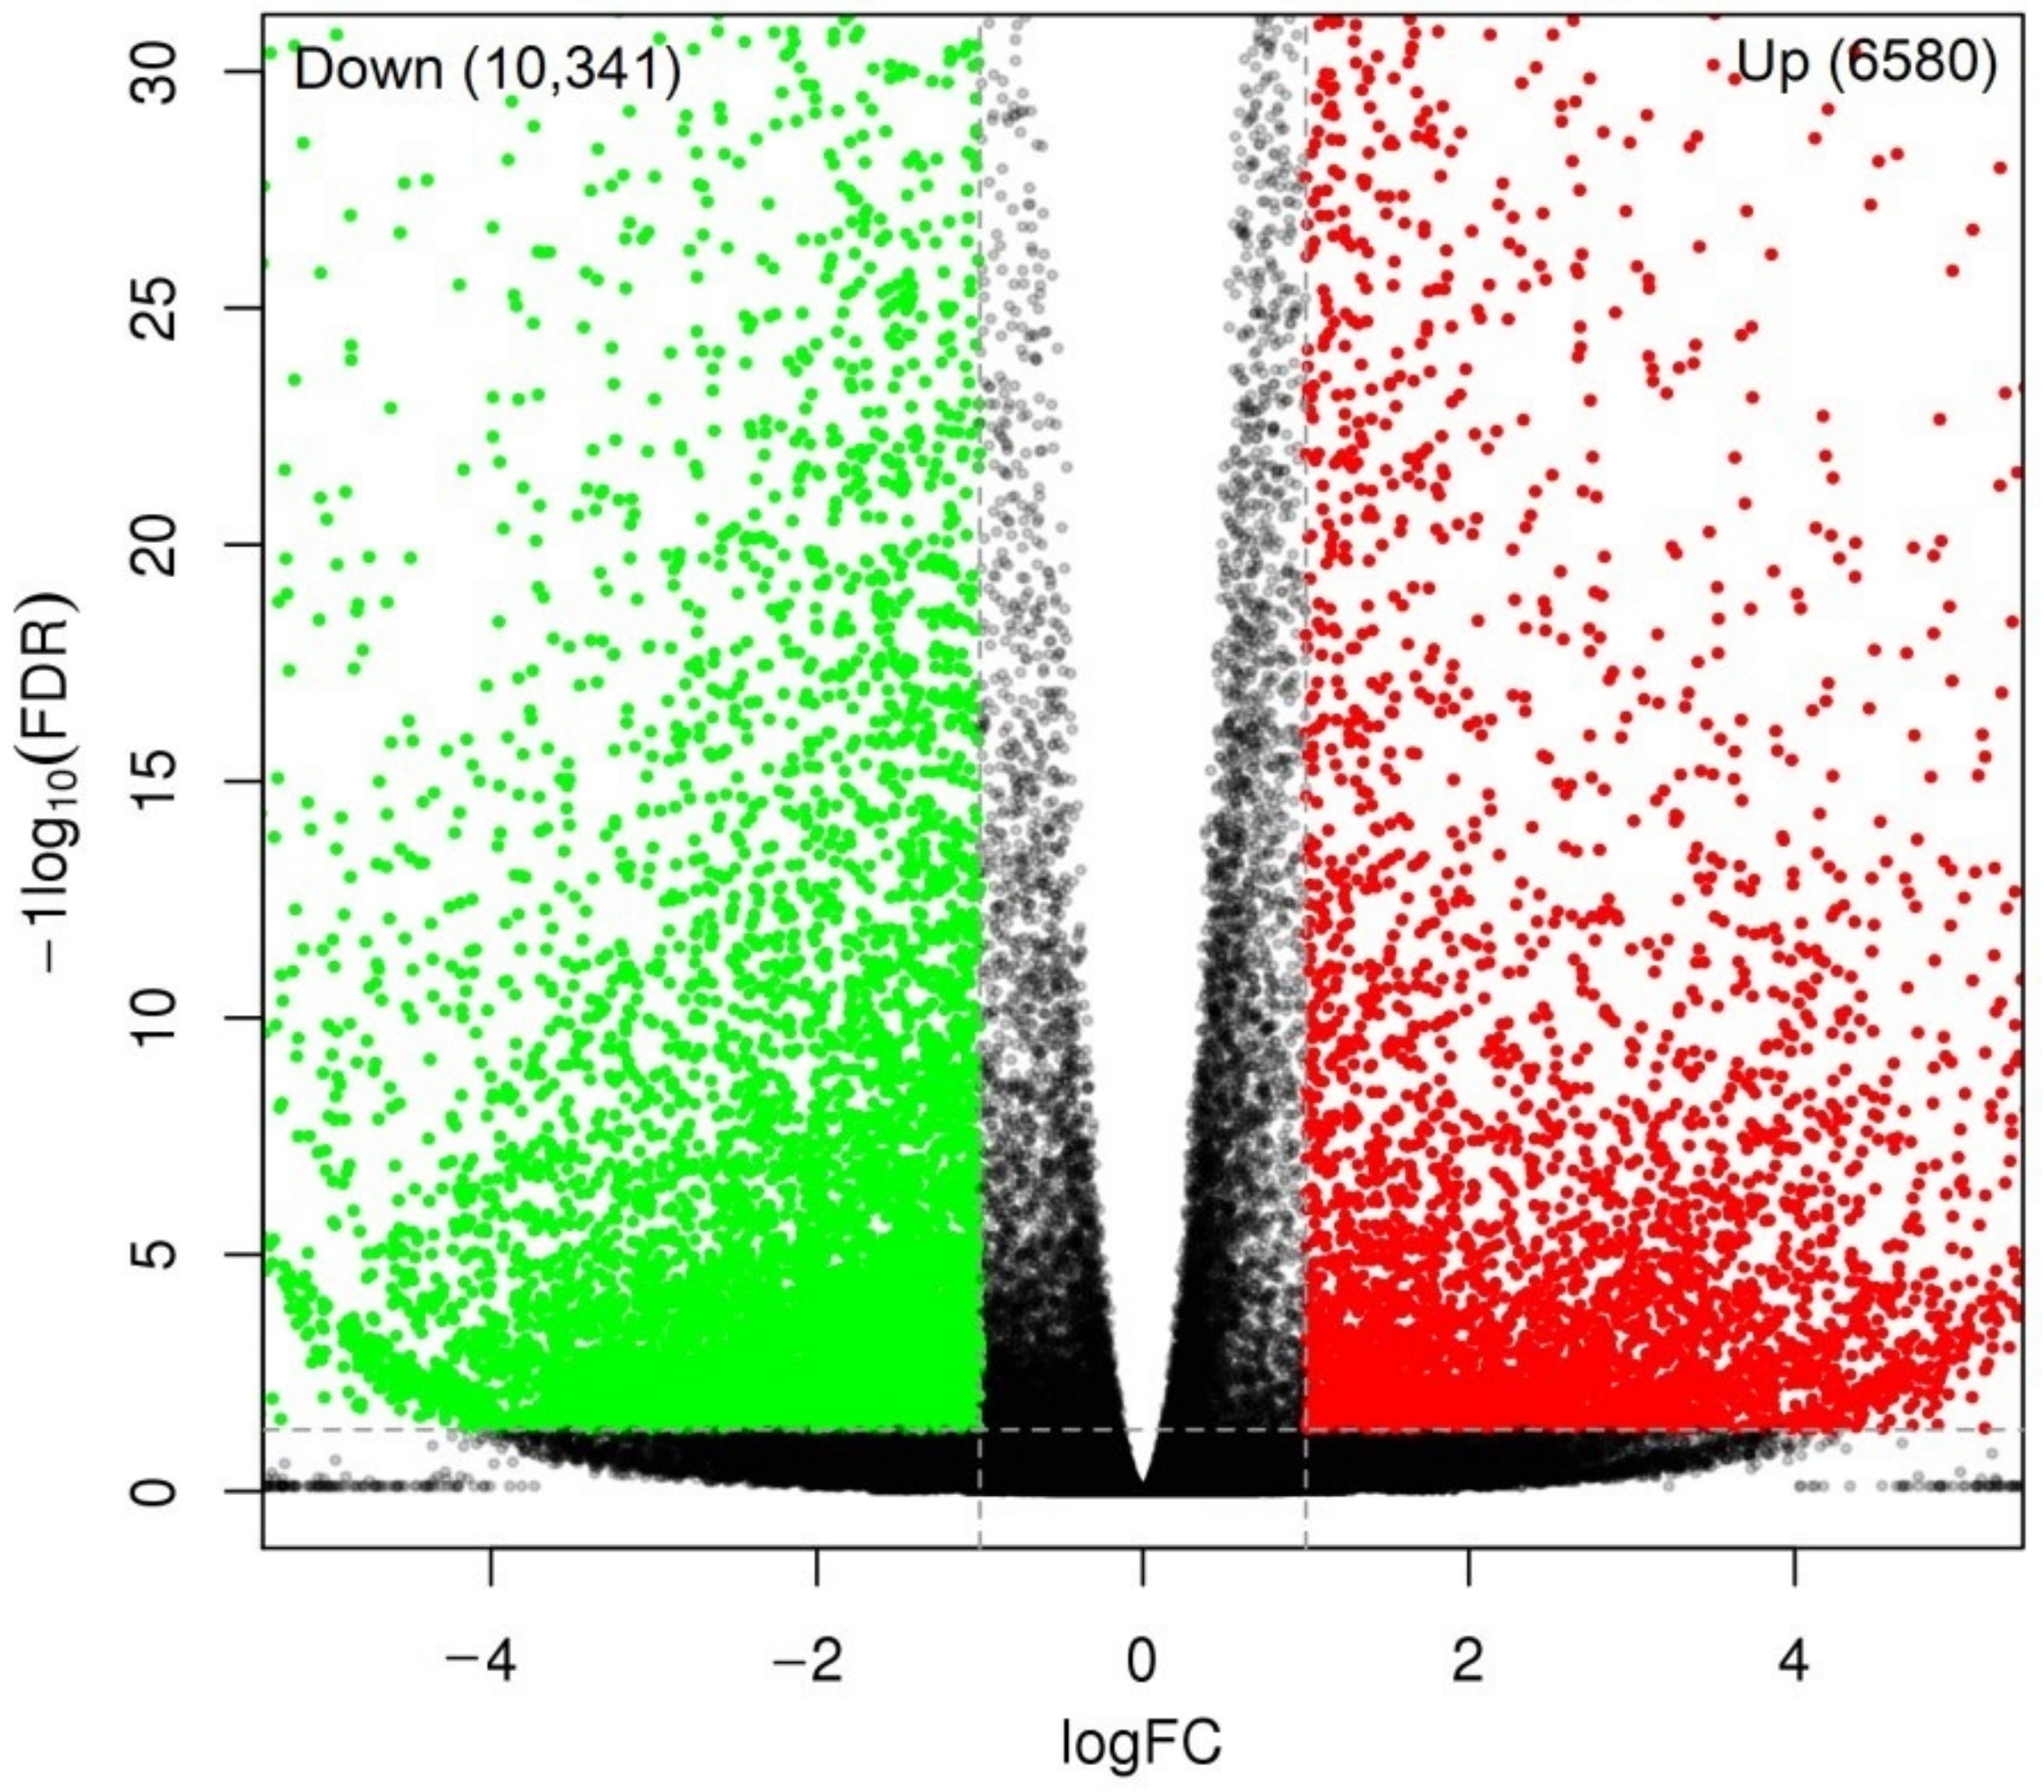
2.3. Global Gene Analysis
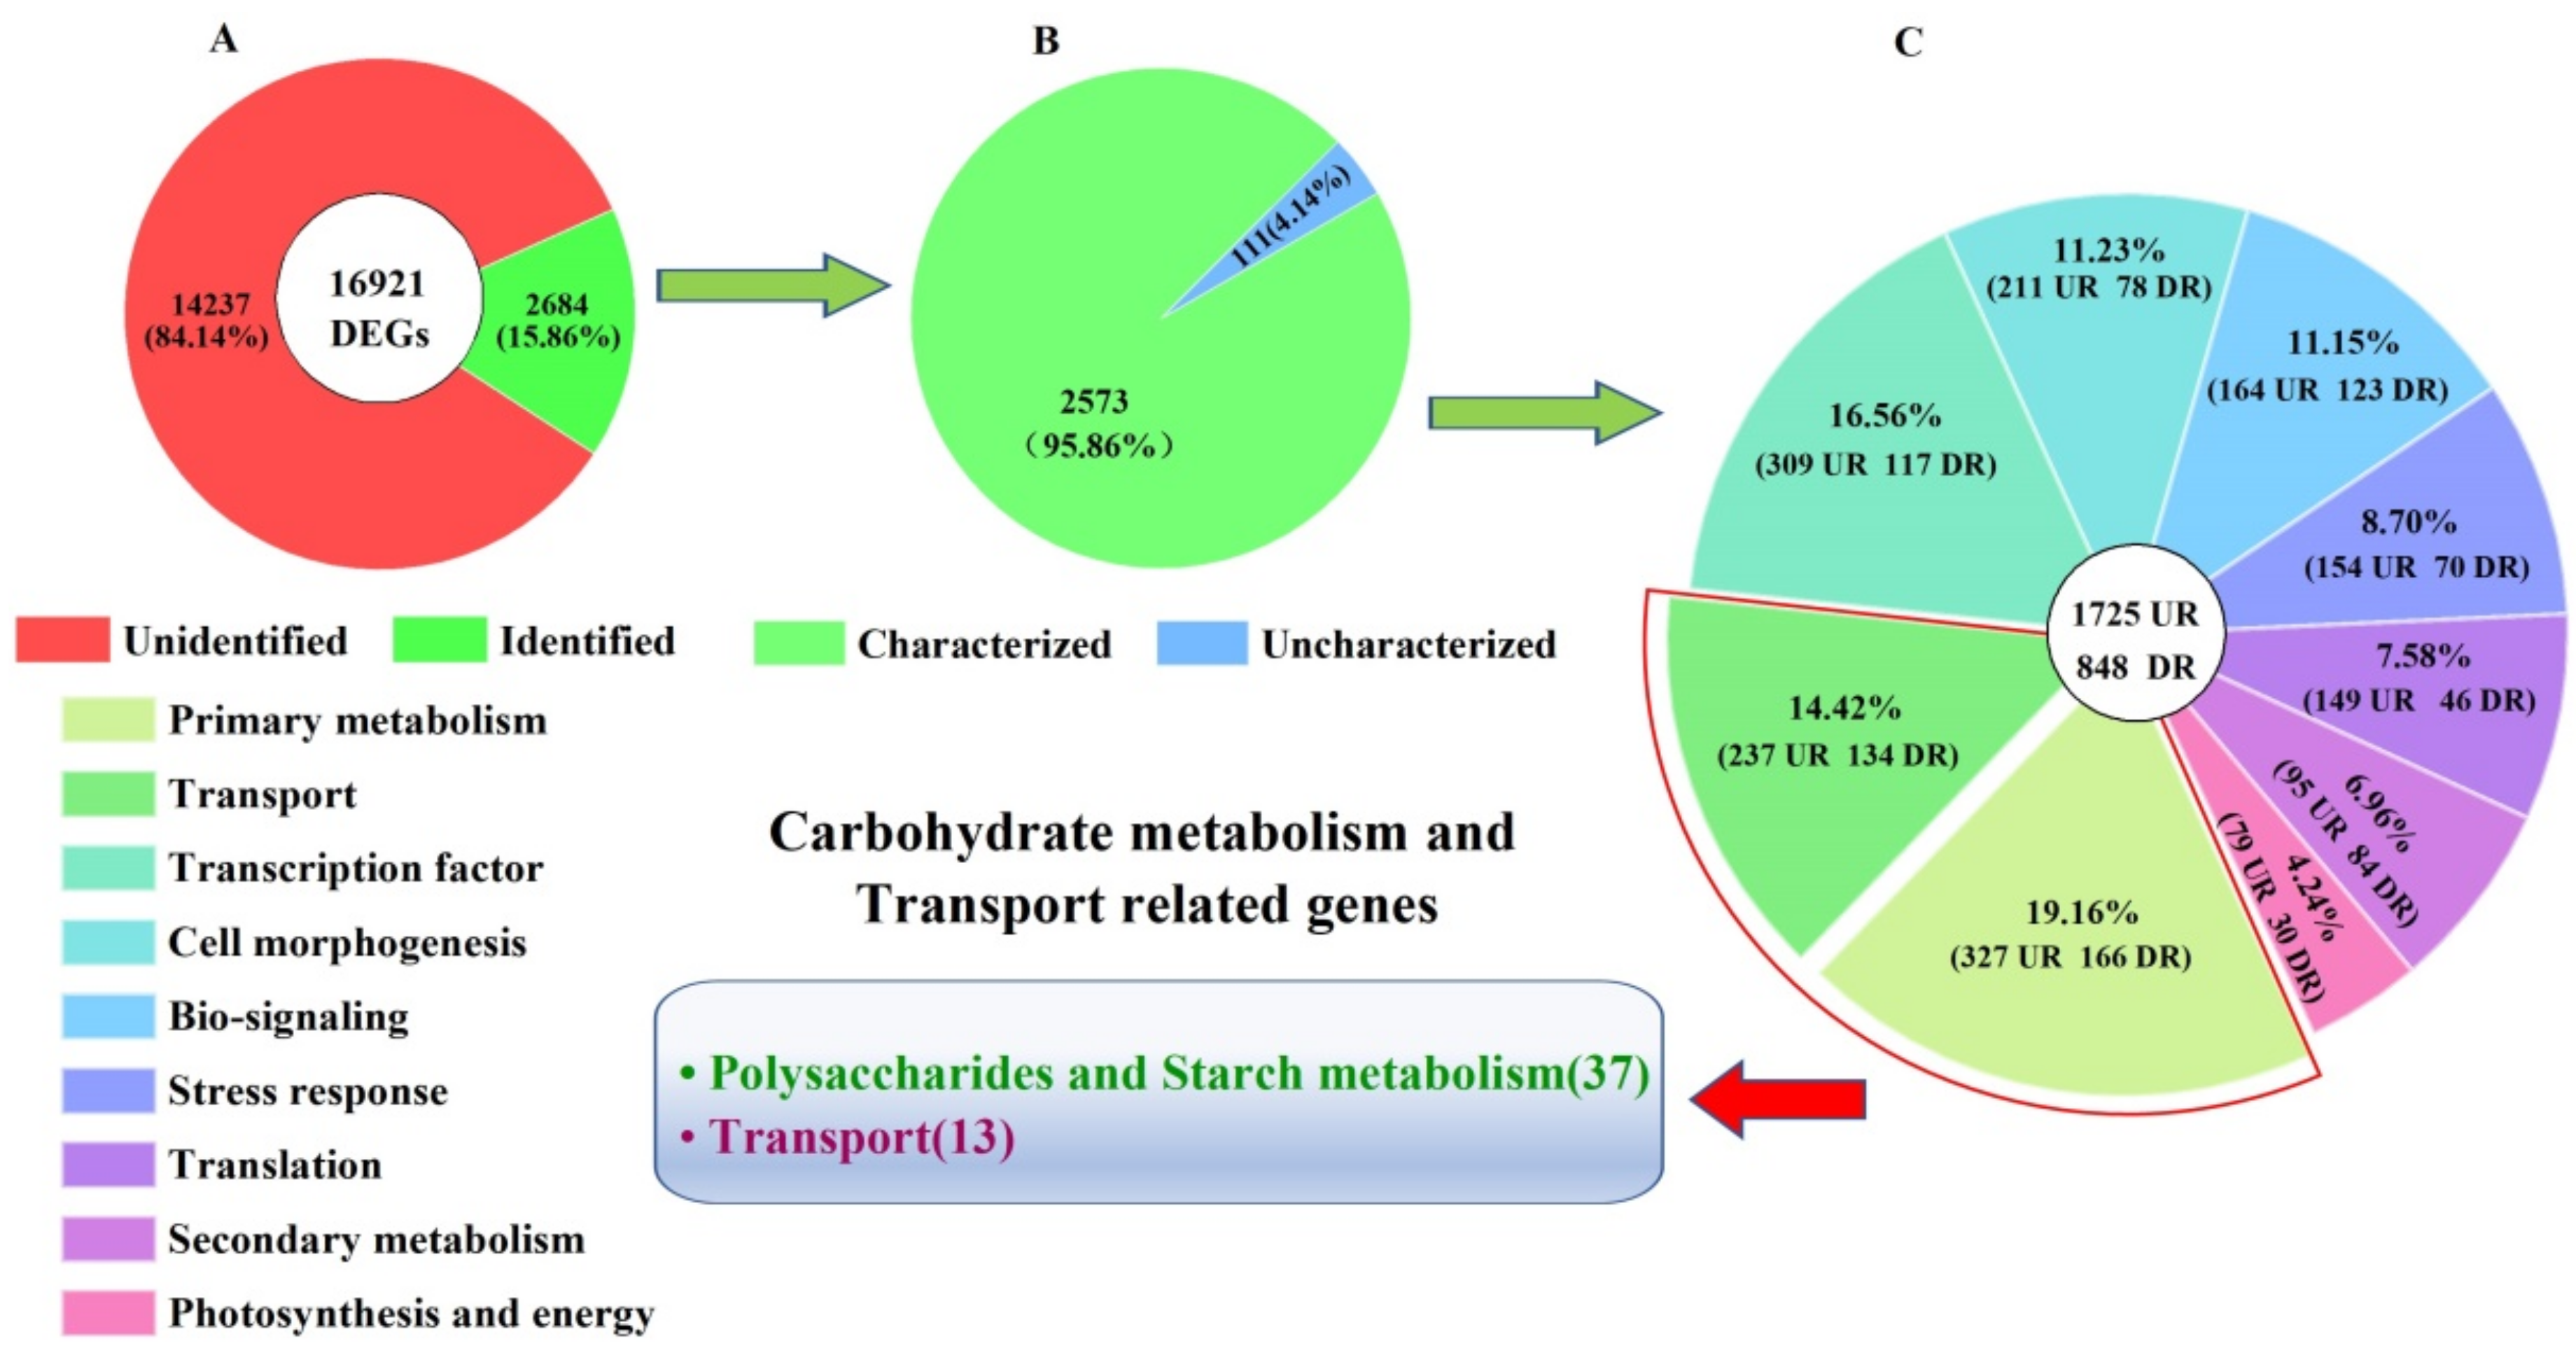
2.4. Biological Category of DEGs
2.5. DEGs Involved in Carbohydrate Metabolism and Transport
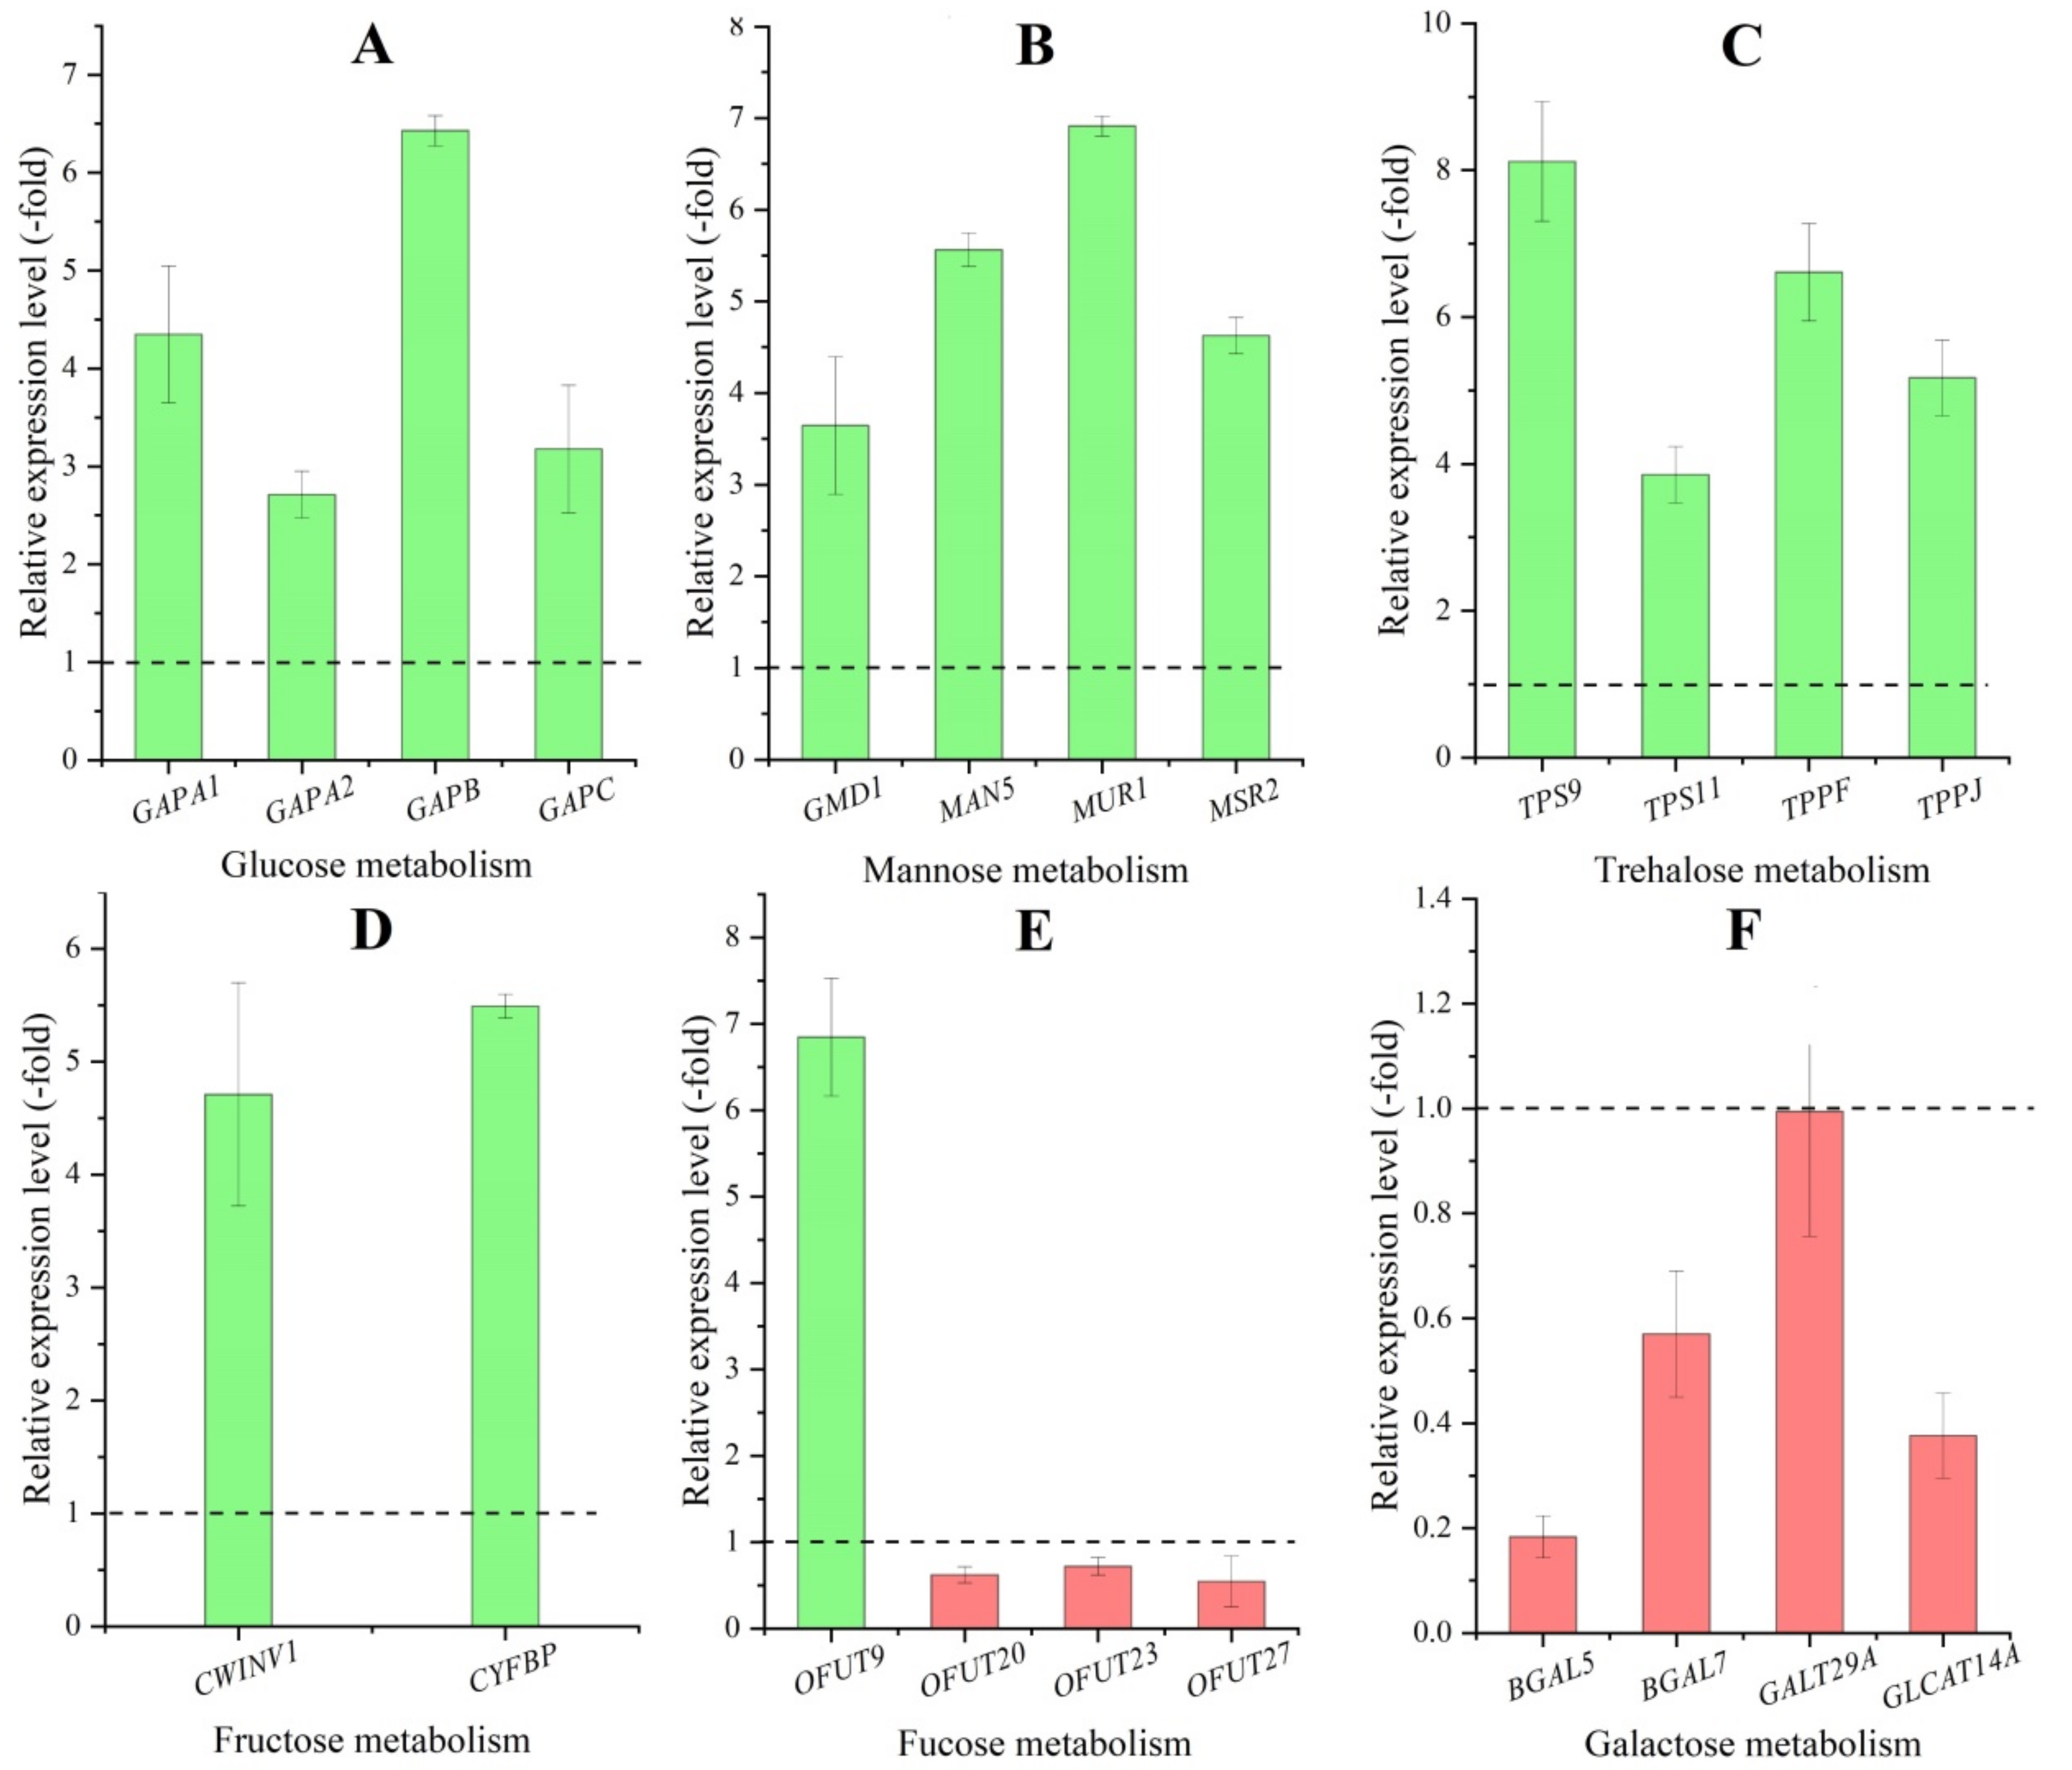
2.5.1. DEGs Involved in Polysaccharides Metabolism
2.5.2. DEGs Involved in Starch Metabolism
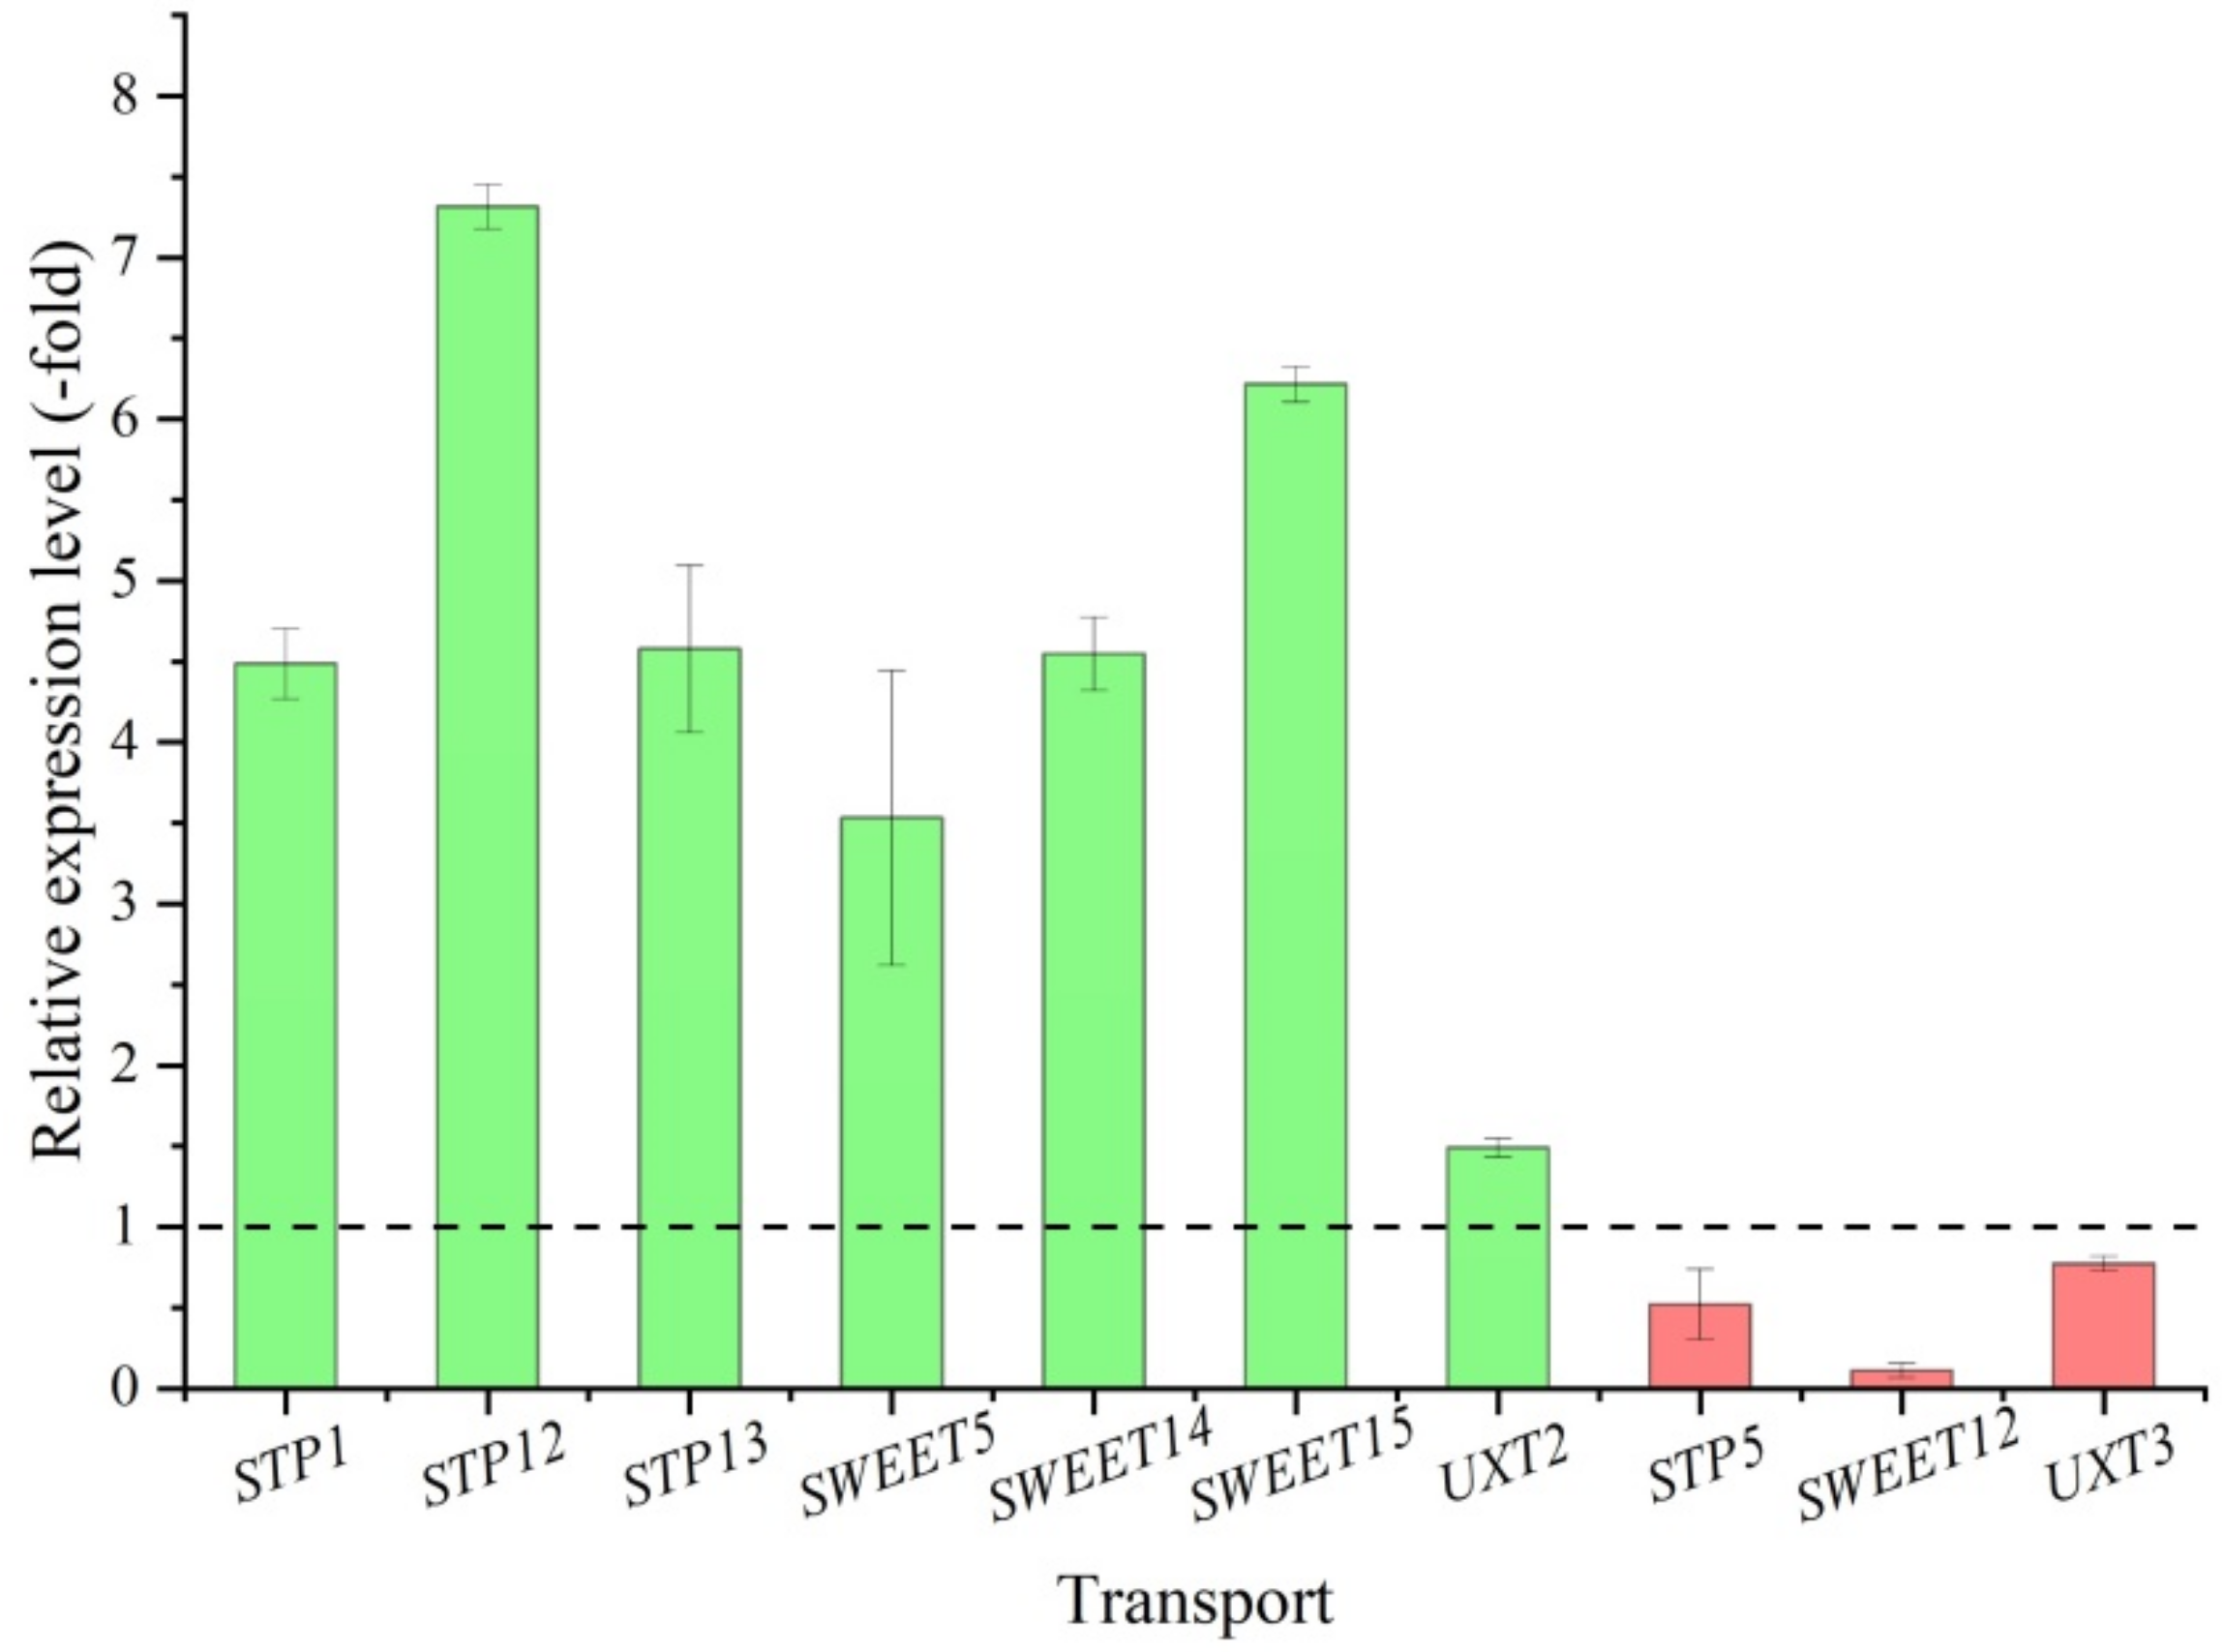
2.5.3. DEGs Involved in Carbohydrate Transport
3. Discussion
4. Materials and Methods
4.1. Plant Materials
4.2. Measurement of Growth Characteristics
4.3. Determination of Soluble Sugar Content and Antioxidant Capacity
4.3.1. Extracts Preparation
4.3.2. Determination of Soluble Sugar Content
4.3.3. Determination of Antioxidant Capacity
4.4. Total RNA Extraction, Illumina Sequencing, Sequence Filtration, Assembly, Unigene Expression Analysis and Basic Annotation
4.5. qRT-PCR Validation
4.6. Statistical Analysis
5. Conclusions
Supplementary Materials
Author Contributions
Funding
Institutional Review Board Statement
Informed Consent Statement
Data Availability Statement
Conflicts of Interest
Sample Availability
Abbreviations
| CR | Cynomoriumsongaricum host in Nitraria roborowskii Kom. |
| CS | Cynomoriumsongaricum host in Nitraria sibirica Pall. |
| DEGs | differentially expressed genes |
| DPPH | 1,1-diphenyl-1-picrylhydrazyl |
| DR | down regulation |
| FRAP | ferric reducing antioxidant power |
| GO | gene ontology |
| KEGG | Kyoto Encyclopedia of Genes and Genomes |
| KOG | euKaryotic orthologous groups of proteins |
| NCBI | National Center for Biotechnology Information |
| NR | non-redundant protein |
| REL | relative expression level |
| RPKM | Reads Per kb per Million |
| UR | up regulation |
References
- Chinese Academy of Sciences; China Flora Editorial Committee. Flora Reipublicae Popularis Sinicae; Science Press: Beijing, China, 2000; Volume 53, pp. 152–154. [Google Scholar]
- Cui, J.L.; Gong, Y.i.; Vijayakumar, V.; Zhang, G.; Wang, M.L.; Wang, J.H.; Xue, X.Z. Correlation in chemical metabolome and endophytic mycobiome in Cynomorium songaricum from different desert locations in china. J. Agric. Food Chem. 2019, 67, 3554–3564. [Google Scholar] [CrossRef]
- Liu, H.P.; Chang, R.F.; Wu, Y.S.; Lin, W.Y.; Tisai, F.J. The Yang-Tonifying Herbal Medicine Cynomorium songaricum Extends Lifespan and Delays Aging in Drosophila. J. Evid. Based Complement. Altern. Med. 2012, 10, 735481. [Google Scholar]
- Committee for the Pharmacopoeia of PR China. Pharmacopoeia of PR China; Chinese Medical Science and Technology Press: Beijing, China, 2020; Volume 1, p. 346. [Google Scholar]
- Ma, C.M.; Wei, Y.; Wang, Z.G.; Hattori, M. Triterpenes from Cynomorium songaricium—Analysis of HCV protease inhibitory activity, quantification, and content change under the influence of heating. J. Nat. Med. 2009, 63, 9–14. [Google Scholar] [CrossRef]
- Ma, C.M.; Sato, N.; Li, X.Y.; Nakamura, N.; Hattori, M. Flavan-3-ol contents, anti-oxidative and α-glucosidase inhibitory activities of Cynomorium songaricum. Food Chem. 2010, 118, 116–119. [Google Scholar] [CrossRef]
- Chen, J.H.; Wong, H.S.; Leung, H.Y.; Leong, P.K.; Chan, W.M.; Ko, K.M. An ursolic acid-enriched Cynomorium songarium extract attenuates high fat diet-induced obesity in mice possibly through mitochondrial uncoupling. J. Funct. Foods 2014, 9, 211–224. [Google Scholar] [CrossRef]
- Jin, S.W.; Chen, G.L.; Du, J.J.M.; Wang, L.H.; Ren, X.; An, T.Y. Antioxidant properties and principal phenolic compositions of Cynomorium songaricum Rupr. Int. J. Food Prop. 2014, 17, 13–25. [Google Scholar] [CrossRef] [Green Version]
- Cheng, D.; Su, L.; Wang, X.; Li, X.J.; Li, L.L.; Hu, M.Y.; Lu, Y. Extract of Cynomorium songaricum ameliorates mitochondrial ultrastructure impairments and dysfunction in two different in vitro models of Alzheimer’s disease. BMC Complement. Med. Ther. 2021, 21, 206. [Google Scholar] [CrossRef]
- Shi, Z.Q.; Wang, L.Y.; Zheng, J.Y.; Xin, G.Z.; Chen, L. Lipidomics characterization of the mechanism of Cynomorium songaricum polysaccharide on treating type-2 diabetes. J. Chromatogr. B 2021, 1176, 122737. [Google Scholar] [CrossRef]
- Zhou, Y.B.; Ye, R.R.; Lu, X.F.; Lin, P.C.; Yang, S.B.; Yue, P.P.; Zhang, C.X.; Peng, M. GC-MS analysis of liposoluble constituents from the stems of Cynomorium songaricum. J. Pharm. Biomed. Anal. 2009, 49, 1097–1100. [Google Scholar] [CrossRef]
- Luan, N.; Chang, P.; Zhuang, L.Y.; Shang, X.Y. Isolation and determination of catechin from Cynomorium songaricum Rupr. Med. Plant 2010, 8, 87–91. [Google Scholar]
- Jin, S.W.; Doi, A.; Kuroda, T.; Zhang, G.X.; Hatano, T.; Chen, G.L. Polyphenolic constituents of Cynomorium songaricum Rupr. and antibacterial effect of polymeric proanthocyanidin on methicillin-resistant staphylococcus aureus. J. Agric. Food Chem. 2012, 60, 7297–7305. [Google Scholar] [CrossRef]
- Wang, F.X.; Wang, W.; Huang, Y.L.; Liu, Z.W.; Zhang, J. Characterization of a novel polysaccharide purified from a herb of Cynomorium songaricum Rupr. Food Hydrocoll. 2015, 47, 79–86. [Google Scholar] [CrossRef]
- Tuvaanjav, S.; Han, S.Q.; Komata, M.; Ma, C.J.; Kanamoto, T.; Nakashima, H.; Yoshida, T. Isolation and antiviral activity of water-soluble Cynomorium songaricum Rupr. polysaccharides. J. Asian Nat. Prod. Res. 2016, 18, 159–171. [Google Scholar] [CrossRef]
- Wang, F.X.; Liu, Q.; Wang, W.; Li, X.B.; Zhang, J. A polysaccharide isolated from Cynomorium songaricum Rupr. protects pc12 cells against H2O2-induced injury. Int. J. Biomacro. 2016, 87, 222–228. [Google Scholar] [CrossRef]
- Dong, Q.; Hu, H.; Suo, Y.R.; Chi, X.F.; Wang, H.L. The complete chloroplast genome sequences of two species from Nitraria. Mitochondrial DNA B 2019, 4, 1229–1230. [Google Scholar] [CrossRef] [Green Version]
- Chinese Academy of Sciences, China Flora Editorial Committee. Flora Reipublicae Popularis Sinicae; Science Press: Beijing, China, 1998; Volume 43, pp. 117–118. [Google Scholar]
- Guo, Y.H.; Lin, H.M.; Lin, Z.J. Study on Identification Characteristics of Cynomorium of the Nitraia Siberian. Gansu Agric. Sci. Technol. 2010, 3, 15–17. [Google Scholar]
- Chen, Y.; Han, D.H.; Gao, H.; Luo, G.H.; Wang, J. Distribution and Utilization on Germplasm Resources of Host Plants of Cynomorium songaricum. Chin. Wild Plant Resour. 2013, 32, 45–47. [Google Scholar]
- Chinese Academy of Sciences; China Flora Editorial Committee. Flora Qinghaiica; Qinghai People’s Publishing House: Xinning, China, 1999; Volume 2, pp. 289–290. [Google Scholar]
- Pan, X.Y.; Cao, Q.D.; Wei, Q.S.; Wang, G.X. Progress of researches on systematic and biodiversity in the genus Nitraria L. Chin. Acad. Med. Organ. 2002, 4, 1–6. [Google Scholar]
- Chun, L.; Zhao, S.Z.; Hao, Y.Z.; Hu, Z.M.; Ma, Y.H. The resources and applications of Nitraria L. Chin. Wild Plant Resour. 2016, 35, 58–60. [Google Scholar]
- Ren, J.; Tao, L. Numerical analysis on the growth benefits of the genus Nitraria. J. Gansu Agric. Univ. 2001, 36, 130–134. [Google Scholar]
- Wu, C.R.; Li, Y.; Zhang, X.Q.; Xiao, B. Study on adaptability of Nitraria seedlings to salt stress. Gansu Sci. Technol. 2009, 25, 154–155. [Google Scholar]
- Li, T.C.; Suo, Y.R. Characteristic of Trace Elements in Plant Nitraria Leaf from Qinghai Chaidamu Region. Guangdong Trace Elements Sci. 2002, 9, 66–68. [Google Scholar]
- Liu, L.P. Analysis and appraisal on nutritional components of the four plants of Nitraria in Inner Mongolia. Master’s Thesis, Inner Mongolia Agricultural University, Inner Mongolia, China, May 2009. [Google Scholar]
- Liu, L.P.; Si, Q.B.L.G.; Xu, Z.M.; He, Z. Nutritional Components of Fruits of Nitraria L. and Its Utilization in Alashan Desert Area. J. Inner Mongolia Forestry Sci Tech. 2016, 42, 29–31. [Google Scholar]
- Wang, S.X.; Li, Q.H.; Xu, J.; Gao, T.T.; Xin, Z.M. Experimental research on the pollination characteristics of 4 plant species of genus Nitraria L. J. Biol. 2012, 29, 49–51. [Google Scholar]
- Zhou, L.B. Factor Analysis and Cluster Analysis on Trace Elements in Nitraria Leaf in Qinghai Area. J. Anhui Agric. Sci. 2010, 38, 10360–10361. [Google Scholar]
- Cui, J.Y.; Vijayakumar, V.; Zhang, G. Partitioning of Fungal Endophyte Assemblages in Root-Parasitic Plant Cynomorium songaricum and Its Host Nitraria tangutorum. Front. Microbiol. 2018, 9, 666. [Google Scholar] [CrossRef] [PubMed]
- Smeekens, S.; Ma, J.K.; Hanson, J.; Hanson, J.; Rolland, F. Sugar signals and molecular networks controlling plant growth. Curr. Opin. Plant Biol. 2010, 13, 274–279. [Google Scholar] [CrossRef]
- Pan, L.; Cai, C.; Liu, C.J.; Liu, D.; Li, G.Y.; Linhardt, R.J.; Yu, G.L. Recent progress and advanced technology in carbohydrate-based drug development. Curr. Opin. Biotechnol. 2021, 69, 191–198. [Google Scholar] [CrossRef]
- Gaudet, P.; Livstone, M.S.; Lewis, S.E.; Thomas, P.D. Phylogenetic-based propagation of functional annotations within the Gene Ontology consortium. Brief. Bioinform. 2011, 12, 449–462. [Google Scholar] [CrossRef] [PubMed] [Green Version]
- Harrison, C.J.; Mould, R.M.; Leech, M.J.; Johnson, S.A.; Turner, L.; Schreck, S.L.; Baird, K.M.; Jack, P.L.; Rawsthorne, S.; Hedley, C.L.; et al. The rug3 locus of pea encodes plastidial phosphoglucomutase. Plant Physiol. 2000, 122, 1187–1192. [Google Scholar] [CrossRef] [PubMed] [Green Version]
- Meng, M.; Geisler, M.; Johansson, H.; Harholt, J.; Scheller, H.V.; Mellerowicz, E.J.; Kleczkowski, L.A. UDP-glucose pyrophosphorylase is not rate limiting, but is essential in Arabidopsis. Plant Cell Physiol. 2009, 50, 998–1011. [Google Scholar] [CrossRef] [Green Version]
- Park, J.I.; Ishimizu, T.; Suwabe, K.; Sudo, K.; Masuko, H.; Hakozaki, H.; Nou, I.S.; Suzuki, G.; Watanabe, M. UDP-glucose pyrophosphorylase is rate limiting in vegetative and reproductive phases in Arabidopsis thaliana. Plant Cell Physiol. 2010, 51, 981–996. [Google Scholar] [CrossRef]
- Dilokpimol, A.; Poulsen, C.P.; Vereb, G.; Kaneko, S.; Schulz, A.; Geshi, N. Galactosyltransferases from Arabidopsis thaliana in the biosynthesis of type II arabinogalactan: Molecular interaction enhances enzyme activity. BMC Plant Biol. 2014, 14, 90. [Google Scholar] [CrossRef] [Green Version]
- Knoch, E.; Dilokpimol, A.; Tryfona, T.; Poulsen, C.P.; Xiong, G.; Harholt, J.; Petersen, B.L.; Ulvskov, P.; Hadi, M.Z.; Kotake, T.; et al. A beta-glucuronosyltransferase from Arabidopsis thaliana involved in biosynthesis of type II arabinogalactan has a role in cell elongation during seedling growth. Plant J. 2013, 76, 1016–1029. [Google Scholar] [CrossRef] [PubMed]
- Qin, C.; Qian, W.Q.; Wang, W.F.; Wu, Y.; Yu, C.M.; Jiang, X.H.; Wang, D.W.; Wu, P. GDP-mannose pyrophosphorylase is a genetic determinant of ammonium sensitivity in Arabidopsis thaliana. Proc. Natl. Acad. Sci. USA 2008, 105, 18308–18313. [Google Scholar] [CrossRef] [PubMed] [Green Version]
- Bonin, C.P.; Freshour, G.; Hahn, M.G.; Vanzin, G.F.; Reiter, W.D. The GMD1 and GMD2 genes of Arabidopsis encode isoforms of GDP-D-mannose 4,6-dehydratase with cell type-specific expression patterns. Plant Physiol. 2003, 132, 883–892. [Google Scholar] [CrossRef] [PubMed] [Green Version]
- Filichkin, S.A.; Leonard, J.M.; Monteros, A.; Liu, P.P.; Nonogaki, H. A novel endo-beta-mannanase gene in tomato LeMAN5 is associated with anther and pollen development. Plant Physiol. 2004, 134, 1080–1087. [Google Scholar] [CrossRef] [PubMed] [Green Version]
- Wang, Y.; Mortimer, J.C.; Davis, J.; Dupree, P.; Keegstra, K. Identification of an additional protein involved in mannan biosynthesis. Plant J. 2013, 73, 105–117. [Google Scholar] [CrossRef]
- Maruta, T.; Yonemitsu, M.; Yabuta, Y.; Tamoi, M.; Ishikawa, T.; Shigeoka, S. Arabidopsis phosphomannose isomerase 1, but not phosphomannose isomerase 2, is essential for ascorbic acid biosynthesis. J. Biol. Chem. 2008, 283, 28842–28851. [Google Scholar] [CrossRef] [PubMed] [Green Version]
- Halliday, J. Molecular analysis and functional elucidation of a novel plant O-fucosyltransferase in Arabidopsis thaliana and Brassica napus. Ph.D. Thesis, The University of Guelph, Ontario, Canada, June 2016. [Google Scholar]
- Vogel, G.; Fiehn, O.; Jean-Richard-dit-Bressel, L.; Boller, T.; Wiemken, A.; Aeschbacher, R.A.; Wingler, A. Trehalose metabolism in Arabidopsis: Occurrence of trehalose and molecular cloning and characterization of trehalose-6-phosphate synthase homologues. J. Exp. Bot. 2001, 52, 1817–1826. [Google Scholar] [CrossRef] [Green Version]
- De Coninck, B.; Le Roy, K.; Francis, I.; Clerens, S.; Vergauwen, R.; Halliday, A.M.; Smith, S.M.; Van Laere, A.; Van Den Ende, W. Arabidopsis AtcwINV3 and 6 are not invertases but are fructan exohydrolases (FEHs) with different substrate specificities. Plant Cell Environ. 2005, 28, 432–443. [Google Scholar] [CrossRef]
- Le Roy, K.; Lammens, W.; Verhaest, M.; De Coninck, B.; Rabijns, A.; Van Laere, A.; Van den Ende, W. Unraveling the difference between invertases and fructan exohydrolases: A single amino acid (Asp-239) substitution transforms Arabidopsis cell wall invertase1 into a fructan 1-exohydrolase. Plant Physiol. 2007, 145, 616–625. [Google Scholar] [CrossRef]
- Cho, Y.H.; Yoo, S.D. Signaling role of fructose mediated by FINS1/FBP in Arabidopsis thaliana. PLos Genet. 2011, 7, e1001263. [Google Scholar] [CrossRef] [Green Version]
- Berrocal-Lobo, M.; Ibanez, C.; Acebo, P.; Ramos, A.; Perez-Solis, E.; Collada, C.; Casado, R.; Aragoncillo, C.; Allona, I. Identification of a homolog of Arabidopsis DSP4 (SEX4) in chestnut: Its induction and accumulation in stem amyloplasts during winter or in response to the cold. Plant Cell Environ. 2011, 34, 1693–1704. [Google Scholar] [CrossRef] [Green Version]
- Paparelli, E.; Gonzali, S.; Parlanti, S.; Novi, G.; Giorgi, F.M.; Licausi, F.; Kosmacz, M.; Feil, R.; Lunn, J.E.; Brust, H.; et al. Misexpression of a chloroplast aspartyl protease leads to severe growth defects and alters carbohydrate metabolism in Arabidopsis. Plant Physiol. 2012, 160, 1237–1250. [Google Scholar] [CrossRef] [Green Version]
- Dumez, S.; Wattebled, F.; Dauvillee, D.; Delvalle, D.; Planchot, V.; Ball, S.G.; D’Hulst, C. Mutants of Arabidopsis lacking starch branching enzyme II substitute plastidial starch synthesis by cytoplasmic maltose accumulation. Plant Cell 2006, 18, 2694–2709. [Google Scholar] [CrossRef] [PubMed] [Green Version]
- Kossmann, J.; Abel, G.J.W.; Springer, F.; Lloyd, J.R.; Willmitzer, L. Cloning and functional analysis of a cDNA encoding a starch synthase from potato (Solanum tuberosum L.) that is predominantly expressed in leaf tissue. Planta 1999, 208, 503–511. [Google Scholar] [CrossRef]
- Arms, K.; Camp, P.S. Biology, 4th ed.; Saunders College publishing: Philadelphia, PA, USA, 2010; pp. 929–946. [Google Scholar]
- Johnson, D.A.; Hill, J.P.; Thomas, M.A. The monosaccharide transporter gene family in land plants is ancient and shows differential subfamily expression and expansion across lineages. BMC Evol. Biol. 2006, 6, 64. [Google Scholar]
- Kiyosue, T.; Abe, H.; Yamaguchi-Shinozaki, K.; Shinozaki, K. ERD6, a cDNA clone for an early dehydration-induced gene of Arabidopsis, encodes a putative sugar transporter. Biochim. Biophys. Acta. 1998, 1370, 187–191. [Google Scholar] [CrossRef] [Green Version]
- Toyofuku, K.; Kasahara, M.; Yamaguchi, J. Characterization and expression of monosaccharide transporters (osMSTs) in rice. Plant Cell Physiol. 2000, 41, 940–947. [Google Scholar] [CrossRef] [Green Version]
- Sherson, S.M.; Hemmann, G.; Wallace, G.; Forbes, S.; Germain, V.; Stadler, R.; Bechtold, N.; Sauer, N.; Smith, S.M. Monosaccharide/proton symporter AtSTP1 plays a major role in uptake and response of Arabidopsis seeds and seedlings to sugars. Plant J. 2000, 24, 849–857. [Google Scholar] [CrossRef] [PubMed]
- Eom, J.S.; Chen, L.Q.; Sosso, D.; Julius, B.T.; Lin, I.W.; Qu, X.Q.; Braun, D.M.; Frommer, W.B. SWEETs, transporters for intracellular and intercellular sugar translocation. Curr. Opin. Plant Biol. 2015, 25, 53–62. [Google Scholar] [CrossRef] [Green Version]
- Chen, L.Q.; Qu, X.Q.; Hou, B.H.; Sosso, D.; Osorio, S.; Fernie, A.R.; Frommer, W.B. Sucrose efflux mediated by SWEET proteins as a key step for phloem transport. Science 2012, 335, 207–211. [Google Scholar] [CrossRef]
- Ebert, B.; Rautengarten, C.; Guo, X.Y.; Xiong, G.Y.; Stonebloom, S.; Smith-Moritz, A.M.; Herter, T.; Chan, L.J.G.; Adams, P.D.; Petzold, C.J.; et al. Identification and characterization of a Golgi-localized UDP-xylose transporter family from Arabidopsis. Plant Cell 2015, 27, 1218–1227. [Google Scholar] [CrossRef] [Green Version]
- Dubois, M.; Gilles, K.A.; Hamilton, J.K.; Rebers, P.A.; Smith, F. Colorimetric method for determination of sugars and related substances. Anal. Chem. 1956, 28, 350–356. [Google Scholar] [CrossRef]
- Li, M.F.; Liu, X.Z.; Wei, J.H.; Zhang, Z.; Chen, S.J.; Liu, Z.H.; Xing, H. Selection of high altitude planting area of Angelica sinensis based on biomass, bioactive compounds accumulation and antioxidant capacity. Chin. Tradit. Herb. Drugs 2020, 51, 474–481. [Google Scholar]
- Arnao, M.B. Some methodological problems in the determination of antioxidant activity using chromogen radicals: A practical case. Trends Food Sci. Technol. 2000, 11, 419–421. [Google Scholar] [CrossRef]
- Li, M.F.; Pare, P.W.; Zhang, J.L.; Kang, T.L.; Zhang, Z.; Yang, D.L.; Wang, K.P.; Xing, H. Antioxidant capacity connection with phenolic and flavonoid content in Chinese medicinal herbs. Rec. Nat. Prod. 2018, 3, 239–250. [Google Scholar] [CrossRef]
- Nencini, C.; Menchiari, A.; Franchi, G.G.; Micheli, L. In vitro antioxidant activity of aged extracts of some Italian Allium species. Plant Foods Hum. Nutr. 2011, 66, 11–16. [Google Scholar] [CrossRef]
- Benzie, I.F.F.; Strain, J.J. The ferric reducing ability of plasma (FRAP) as a measure of antioxidant power: The FRAP assay. Anal. Biochem. 1996, 239, 70–76. [Google Scholar] [CrossRef] [PubMed] [Green Version]
- Li, M.F.; Sun, P.; Kang, T.L.; Xing, H.; Yang, D.L.; Zhang, J.L.; Paré, P.W. Mapping podophyllotoxin biosynthesis and growth-related transcripts with high elevation in Sinopodophyllum hexandrum. Ind. Crop 2018, 124, 510–518. [Google Scholar] [CrossRef]
- Grabherr, M.G.; Haas, B.J.; Yassour, M.; Levin, J.Z.; Thompson, D.A.; Amit, I.; Adiconis, X.; Fan, L.; Raychowdhury, R.; Zeng, Q.D.; et al. Full-length transcriptome assembly from RNA-Seq data without a reference genome. Nat. Biotechnol. 2011, 29, 644–652. [Google Scholar] [CrossRef] [PubMed] [Green Version]
- Mortazavi, A.; Williams, B.A.; McCue, K.; Schaeffer, L.; Wold, B. Mapping and quantifying mammalian transcriptomes by RNA-Seq. Nat. Methods 2008, 5, 621–628. [Google Scholar] [CrossRef] [PubMed]
- Love, M.I.; Huber, W.; Anders, S. Moderated estimation of fold change and dispersion for RNAseq data with DESeq2. Genome Biol. 2014, 15, 550. [Google Scholar] [CrossRef] [PubMed] [Green Version]
- Robinson, M.D.; McCarthy, D.J.; Smyth, G.K. EdgeR: A Bioconductor package for differential expression analysis of digital gene expression data. Brief Bioinform. 2010, 26, 139–140. [Google Scholar] [CrossRef] [Green Version]
- Conesa, A.; Götz, S.; García-Gómez, J.M.; Terol, J.; Talón, M.; Robles, M. Blast2GO: A universal tool for annotation, visualization and analysis in functional genomics research. Brief Bioinform. 2005, 21, 3674–3676. [Google Scholar] [CrossRef] [PubMed] [Green Version]
- Willems, E.; Leyns, L.; Vandesompele, J. Standardization of real-time PCR gene expression data from independent biological replicates. Anal. Biochem. 2008, 379, 127–129. [Google Scholar] [CrossRef]


| Gene Name | Swissprot-ID | Protein Name | RPKM (CR/CS) | |
|---|---|---|---|---|
| Polysaccharides Metabolism (32) | ||||
| Glucose (7) | ||||
| GapA | sp|Q8VXQ9|G3PA_COEVA | Glyceraldehyde-3-phosphate dehydrogenase A | 8.83 | |
| GAPA1 | sp|P25856|G3PA1_ARATH | Glyceraldehyde-3-phosphate dehydrogenase GAPA1 | 5.47 | |
| GAPA2 | sp|Q9LPW0|G3PA2_ARATH | Glyceraldehyde-3-phosphate dehydrogenase GAPA2 | 4.37 | |
| GAPB | sp|P25857|G3PB_ARATH | Glyceraldehyde-3-phosphate dehydrogenase GAPB | 7.25 | |
| GAPC | sp|P04796|G3PC_SINAL | Glyceraldehyde-3-phosphate dehydrogenase | 3.25 | |
| PGMP | sp|Q9SM59|PGMP_PEA | Phosphoglucomutase | −1.70 | |
| UGP1 | sp|P57751|UGPA1_ARATH | UTP-glucose-1-phosphate uridylyltransferase 1 | 2.80 | |
| Galactose (7) | ||||
| BGAL | sp|P48981|BGAL_MALDO | Beta-galactosidase | −1.00 | |
| BGAL5 | sp|Q9MAJ7|BGAL5_ARATH | Beta-galactosidase 5 | −1.32 | |
| BGAL7 | sp|Q9SCV5|BGAL7_ARATH | Beta-galactosidase 7 | −3.29 | |
| GALM | sp|Q5EA79|GALM_BOVIN | Aldose 1-epimerase | 1.34 | |
| GALT29A | sp|Q9SGD2|GT29A_ARATH | Beta-1,6-galactosyltransferase GALT29A | −3.71 | |
| GLCAT14A | sp|Q9FLD7|GT14A_ARATH | Beta-glucuronosyltransferase GlcAT14A | −1.10 | |
| GOLS2 | sp|C7G304|GOLS2_SOLLC | Galactinol synthase 2 | −1.23 | |
| Mannose (6) | ||||
| CYT1 | sp|O22287|GMPP1_ARATH | Mannose-1-phosphate guanylyltransferase 1 | 3.29 | |
| GMD1 | sp|Q9SNY3|GMD1_ARATH | GDP-mannose 4,6 dehydratase 1 | 2.98 | |
| MAN5 | sp|P93031|GMD2_ARATH | Mannan endo-1,4-beta-mannosidase 5 | 3.21 | |
| MSR2 | sp|Q6YM50|MAN5_SOLLC | Protein MANNAN SYNTHESIS-RELATED 2 | 1.72 | |
| MUR1 | sp|Q0WPA5|MSR2_ARATH | GDP-mannose 4,6 dehydratase 2 | 1.24 | |
| PMI2 | sp|Q9FZH5|MPI2_ARATH | Mannose-6-phosphate isomerase 2 | 1.61 | |
| Fucose (5) | ||||
| OFUT9 | sp|Q8H1E6|OFUT9_ARATH | O-fucosyltransferase 9 | 1.16 | |
| OFUT20 | sp|O64884|OFT20_ARATH | O-fucosyltransferase 20 | −2.52 | |
| OFUT23 | sp|Q9MA87|OFT23_ARATH | O-fucosyltransferase 23 | −1.86 | |
| OFUT27 | sp|Q8GZ81|OFT27_ARATH | O-fucosyltransferase 27 | −1.19 | |
| OFUT35 | sp|Q94BY4|OFT35_ARATH | O-fucosyltransferase 35 | 1.14 | |
| Trehalose (5) | ||||
| TPS7 | sp|Q9LMI0|TPS7_ARATH | Probable alpha,alpha-trehalose-phosphate synthase | −1.40 | |
| TPS9 | sp|Q9LRA7|TPS9_ARATH | Probable alpha,alpha-trehalose-phosphate synthase | 8.76 | |
| TPS11 | sp|Q9ZV48|TPS11_ARATH | Probable alpha,alpha-trehalose-phosphate synthase | 3.34 | |
| TPPF | sp|Q9SU39|TPPF_ARATH | Probable trehalose-phosphate phosphatase F | 2.27 | |
| TPPJ | sp|Q5HZ05|TPPJ_ARATH | Probable trehalose-phosphate phosphatase J | 2.48 | |
| Fructose (2) | ||||
| CWINV1 | sp|Q43866|INV1_ARATH | Beta-fructofuranosidase, insoluble isoenzyme CWINV1 | 1.40 | |
| CYFBP | sp|Q9MA79|F16P2_ARATH | Fructose-1,6-bisphosphatase | 2.29 | |
| Starch Metabolism (5) | ||||
| At2g31390 | sp|Q9SID0|SCRK1_ARATH | Probable fructokinase-1 | 2.93 | |
| DSP4 | sp|G4LTX4|DSP4_CASSA | Phosphoglucan phosphatase DSP4, amyloplastic | −1.95 | |
| NANA | sp|Q9LTW4|NANA_ARATH | Aspartic proteinase NANA | −3.64 | |
| SBE2.2 | sp|Q9LZS3|GLGB2_ARATH | 1,4-alpha-glucan-branching enzyme 2-2 | −1.79 | |
| SS2 | sp|Q43847|SSY2_SOLTU | Granule-bound starch synthase 2 | 4.05 | |
| Carbohydrate Transport (13) | ||||
| At1g67300 | sp|Q9FYG3|PLST2_ARATH | Probable plastidic glucose transporter 2 | 1.12 | |
| ERD6 | sp|O04036|ERD6_ARATH | Sugar transporter ERD6 | 2.47 | |
| MST1 | sp|Q0JCR9|MST1_ORYSJ | Sugar transport protein MST1 | −1.09 | |
| STP1 | sp|P23586|STP1_ARATH | Sugar transport protein 1 | 8.84 | |
| STP5 | sp|Q93Y91|STP5_ARATH | Sugar transport protein 5 | −1.29 | |
| STP12 | sp|O65413|STP12_ARATH | Sugar transport protein 12 | 5.61 | |
| STP13 | sp|Q94AZ2|STP13_ARATH | Sugar transport protein 13 | 3.28 | |
| SWEET5 | sp|Q9FM10|SWET5_ARATH | Bidirectional sugar transporter SWEET5 | 2.05 | |
| SWEET12 | sp|O82587|SWT12_ARATH | Bidirectional sugar transporter SWEET12 | −2.05 | |
| SWEET14 | sp|Q2R3P9|SWT14_ORYSJ | Bidirectional sugar transporter SWEET14 | 1.57 | |
| SWEET15 | sp|P0DKJ5|SWT15_VITVI | Bidirectional sugar transporter SWEET15 | 9.57 | |
| UXT2 | sp|Q8GUJ1|UXT2_ARATH | UDP-xylose transporter 2 | 1.71 | |
| UXT3 | sp|Q8RXL8|UXT3_ARATH | UDP-xylose transporter 3 | −1.81 | |
| Genes | Sequences (5′ to 3′) | Amplicon Size (bp) |
|---|---|---|
| ACT | Forward: CTAAACCGCTTGTTGCTGGC | 104 |
| Reverse: GGGGAGCTCACACGAAAGAT | ||
| Polysaccharides Metabolism (22) | ||
| GAPA1 | Forward: TCGTTTTCATGCTTGTAACTTGT | 112 |
| Reverse: CTTACGCCTCATTTCGCCTC | ||
| GAPA2 | Forward: GAAAGCGTCCTGAGCAAAGT | 172 |
| Reverse: GCCCAGGACATACCCAAAAG | ||
| GAPB | Forward: GGCAAGATGGAACTTCATGCG | 106 |
| Reverse: ATGTGAAGTCGGGCCAAAAC | ||
| GAPC | Forward: TTTTGGTCTGAGCCAGAGAGG | 106 |
| Reverse: TGTTACCGCCTGAAAATACCT | ||
| BGAL5 | Forward: AGGCTCTGCTACGTTTGCTT | 169 |
| Reverse: TCTCACGTTTCGGCTTTCGT | ||
| BGAL7 | Forward: AGTCTCATTGCCATTCCCCG | 104 |
| Reverse: TGGGCGATGAATTTGGTGGA | ||
| GALT29A | Forward: AGCTCTGAACGGAAAGCTCAT | 186 |
| Reverse: GCTTGCTCACGAATACCCCA | ||
| GLCAT14A | Forward:TGGTGTGACGAGGTTCAAGAGA | 148 |
| Reverse: CAGATTCGCTGGTAACTGCCT | ||
| GMD1 | Forward: ATTGCTCTTGCACATCACACAC | 101 |
| Reverse: GGCTTATAGCGGTCAACAAAAT | ||
| MUR1 | Forward: AGGCAAACGATTGTTGCGAG | 180 |
| Reverse: GGATTTGTCAGCCCTTGCTT | ||
| MAN5 | Forward: AGCCAAGAAAATGGCGGAAT | 198 |
| Reverse: GCGTGGATGGAATGGTGAAG | ||
| MSR2 | Forward: ACGAGCTTTCTCAAACAGGCA | 153 |
| Reverse: TCGCAAGGGCTTCTAAAATGG | ||
| OFUT9 | Forward: GGGTTGTCCTTTGGTCTTGT | 110 |
| Reverse: AGTTTGCGCTTGTTGTCTACC | ||
| OFUT20 | Forward: TTCAGGACATAGAGGAGCAGC | 159 |
| Reverse: GTCCCCCTCCATAAAAGGCG | ||
| OFUT23 | Forward: GCGACTTCTTACCGGCATCT | 191 |
| Reverse: GCCTGTCCCAAACTCTGACA | ||
| OFUT27 | Forward: GTTCACCGTTGCAAGACCAC | 132 |
| Reverse: CCTTGGCTGGTGGAATGGAT | ||
| TPS9 | Forward:TGAGTAAGGAACAAGCCCCATC | 164 |
| Reverse: CCTTTCCAGGCCGAGACATAA | ||
| TPS11 | Forward: TCCGGTCGGTGAAAGGTATG | 131 |
| Reverse: ATCCCATCAACCACAGCCTC | ||
| TPPF | Forward: TCGGGAAAACCAATGGGTGA | 128 |
| Reverse: AGACGGCTGAACTTGAGGTG | ||
| TPPJ | Forward: TACCAACTGTGCTAAGCCCT | 104 |
| Reverse:CTGTATATTGGGTTTTGGAAGGC | ||
| CWINV1 | Forward: GTGACGTGTGTTTCCAGTGTG | 109 |
| Reverse: TCAGTGTCAGCCATAAGTTGGT | ||
| CYFBP | Forward: TAGTGGGCAGGGTTTAGGCA | 109 |
| Reverse: TCGTGCGGTTAGTGTTTTACCT | ||
| Starch (5) | ||
| At2g31390 | Forward:TGTCCGCAAACAGAAAACGTC | 120 |
| Reverse: TGGACGCCAAAGAGGGAATG | ||
| DSP4 | Forward: CCCGTGTTTATCCTCGTTGGT | 157 |
| Reverse: AAGGTGGTGGTTGACGGTG | ||
| NANA | Forward: ATGCCGATCCCCAAACACA | 102 |
| Reverse:CGAAGGTAATGCCAAATTGAGA | ||
| SBE2.2 | Forward:TGTCCGCAAACAGAAAACGTC | 120 |
| Reverse: TGGACGCCAAAGAGGGAATG | ||
| SS2 | Forward: CGGCACAAAATCAACATGGG | 104 |
| Reverse: CCAGGCATTCAGTTGCGAAG | ||
| Transport (10) | ||
| STP1 | Forward: GCACTTAGCTTTGATATGCCCC | 112 |
| Reverse: TTTAAGACCCATCGCCGTCC | ||
| STP5 | Forward: TCTGAGACAAACAGCCTTCC | 110 |
| Reverse: TCCCGTGTATAAGTGCTCTACC | ||
| STP12 | Forward: ACGAGCTCTGCAAAGGGTTC | 179 |
| Reverse: CTCCATCTGGTTCAACGCAC | ||
| STP13 | Forward: AGTGTTCGACGGGGACTCTT | 146 |
| Reverse: ACCCCCTCTTGAGTCTTGTC | ||
| SWEET5 | Forward: GGGTTAGGTTGTCGTGGACT | 100 |
| Reverse: GCTTTGTCAAGTGTGGTGCT | ||
| SWEET12 | Forward: TCTGACAACTACCCGCAAGC | 190 |
| Reverse: AGGCACAGATAGTTGCCGAA | ||
| SWEET14 | Forward: AGCTGCCGAAAGTACCCTAC | 130 |
| Reverse: TCGCATGTTTCTCCTTCGCT | ||
| SWEET15 | Forward: TGTCGCCGTTGCATTTTTGT | 137 |
| Reverse: CTCAACTGGGTGGCCTTCAA | ||
| UXT2 | Forward: AGGCCTGATTGCAAGAGCTTA | 148 |
| Reverse: CACGGGTACGTCACTCAGAT | ||
| UXT3 | Forward: TGCGGTTAACCTGGAAGAGG | 189 |
| Reverse: TGTTTAGGACATCCTCCCATGC | ||
Publisher’s Note: MDPI stays neutral with regard to jurisdictional claims in published maps and institutional affiliations. |
© 2021 by the authors. Licensee MDPI, Basel, Switzerland. This article is an open access article distributed under the terms and conditions of the Creative Commons Attribution (CC BY) license (https://creativecommons.org/licenses/by/4.0/).
Share and Cite
Wang, J.; Su, H.; Han, H.; Wang, W.; Li, M.; Zhou, Y.; Li, Y.; Li, M. Transcriptomics Reveals Host-Dependent Differences of Polysaccharides Biosynthesis in Cynomorium songaricum. Molecules 2022, 27, 44. https://doi.org/10.3390/molecules27010044
Wang J, Su H, Han H, Wang W, Li M, Zhou Y, Li Y, Li M. Transcriptomics Reveals Host-Dependent Differences of Polysaccharides Biosynthesis in Cynomorium songaricum. Molecules. 2022; 27(1):44. https://doi.org/10.3390/molecules27010044
Chicago/Turabian StyleWang, Jie, Hongyan Su, Hongping Han, Wenshu Wang, Mingcong Li, Yubi Zhou, Yi Li, and Mengfei Li. 2022. "Transcriptomics Reveals Host-Dependent Differences of Polysaccharides Biosynthesis in Cynomorium songaricum" Molecules 27, no. 1: 44. https://doi.org/10.3390/molecules27010044
APA StyleWang, J., Su, H., Han, H., Wang, W., Li, M., Zhou, Y., Li, Y., & Li, M. (2022). Transcriptomics Reveals Host-Dependent Differences of Polysaccharides Biosynthesis in Cynomorium songaricum. Molecules, 27(1), 44. https://doi.org/10.3390/molecules27010044