Abstract
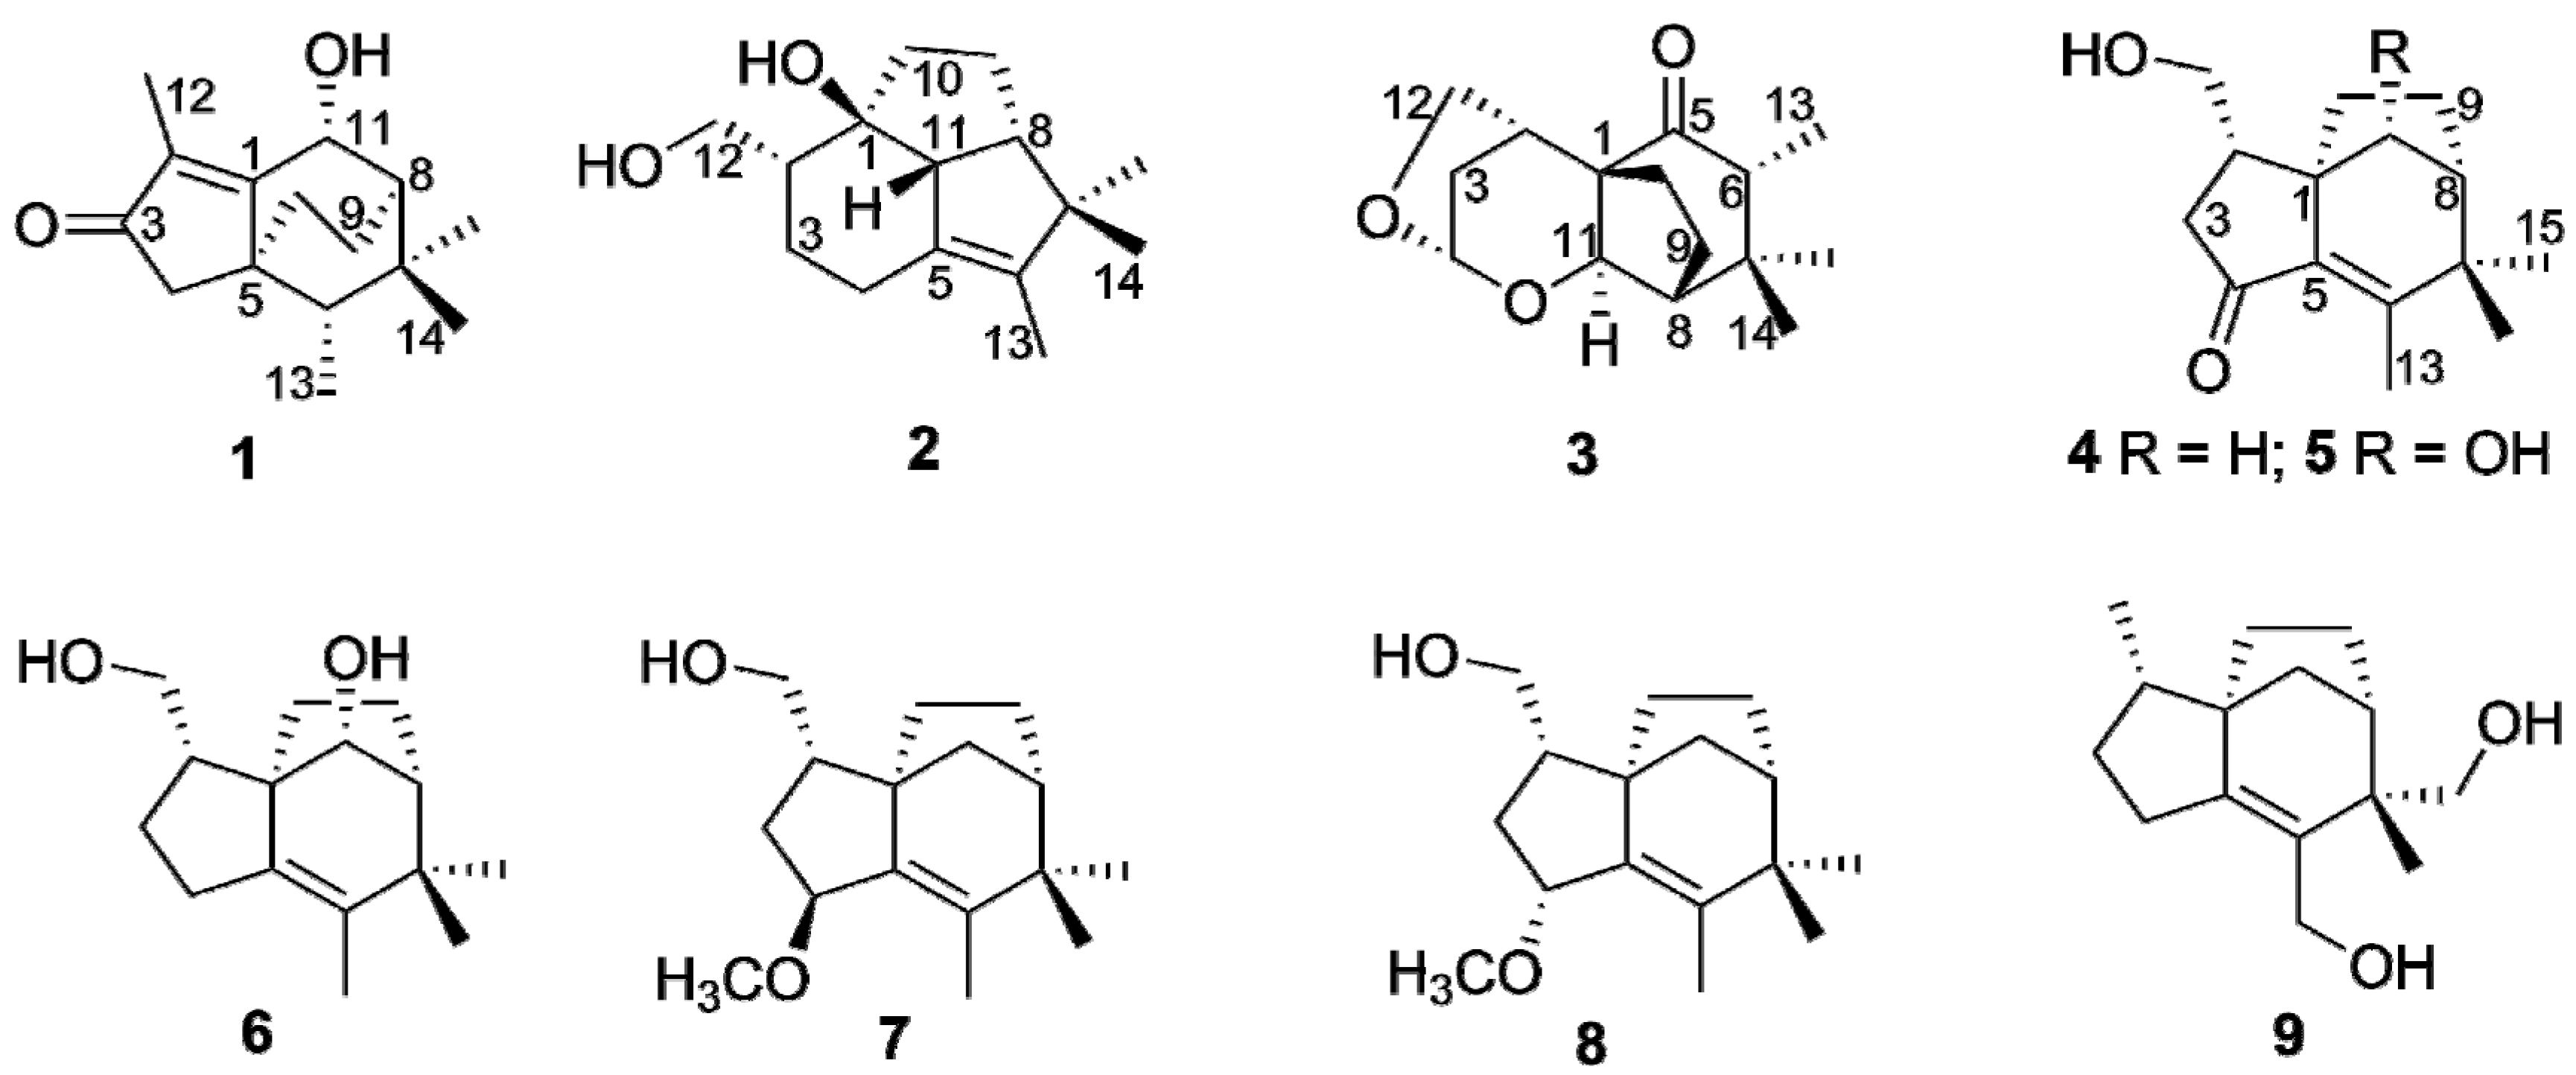
Nine new sesquiterpenoids (1–9) were isolated from ethyl ether extract of agarwood originated from Aquilaria sp., including three novel sesquiterpenoids (1–3) derived from zizaane, together with six zizaane-type sesquiterpenoids (4–9). All structures were unambiguously elucidated based on 1D and 2D NMR spectra as well as by HRESIMS data. The absolute configuration of sesquiterpenoids was determined by comparison of the experimental and computed ECD spectra. In vitro anti-inflammatory assessment showed that compound 9 exhibited inhibition of NO production in LPS-stimulated RAW264.7 cells with an IC50 value of 62.22 ± 1.27 μM.
1. Introduction
Agarwood is produced inside Aquilaria and Gyrinops trees as a self-treatment mechanism to suppress various forms of injury, such as chopping, holing, nailing, microbial infection, etc. [1]. Chemical studies revealed that sesquiterpenes and 2-(2-phenethyl)chromones are two main types of components [2]. As major volatile constituents, the sesquiterpenes from agarwood exhibit various types, including agarofurans, agarospiranes, guaianes, eudesmanes, eremophilanes, cadinanes, prezizaanes, zizaanes, acoranes, etc., which contribute to the smell and pharmacological properties of agarwood [1]. In our previous studies, plenty of tricyclic prezizaanes, three zizaanes and several sesquiterpenes bearing 11-methyl ester groups were identified from agarwood originated from Aquilaria sp. [3,4,5]. Some of them exhibit potent α-glucosidase and acetylcholinesterase inhibition activities. In continuation of identifying bioactive constituents from the agarwood originating from Aquilaria sp., nine previous unreported sesquiterpenoids (1–9) were identified, including three novel sesquiterpenoids (1–3) derived from zizaanes (Figure 1). All structures were elucidated on the basis of HRESIMS, 1D and 2D NMR spectroscopic analyses. Their absolute configuration was determined by comparison of the experimental and computed ECD spectra. Herein, this paper describes the isolation, structural elucidation as well as bioactivities of nine sesquiterpenoids.
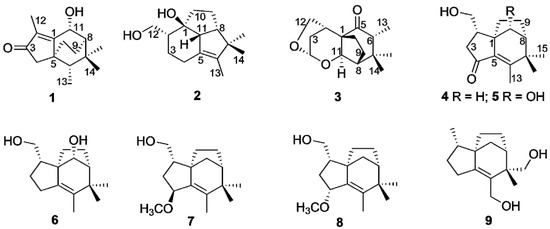
Figure 1.
Structures of sesquiterpenoinds 1–9 from agarwood.
2. Results and Discussion
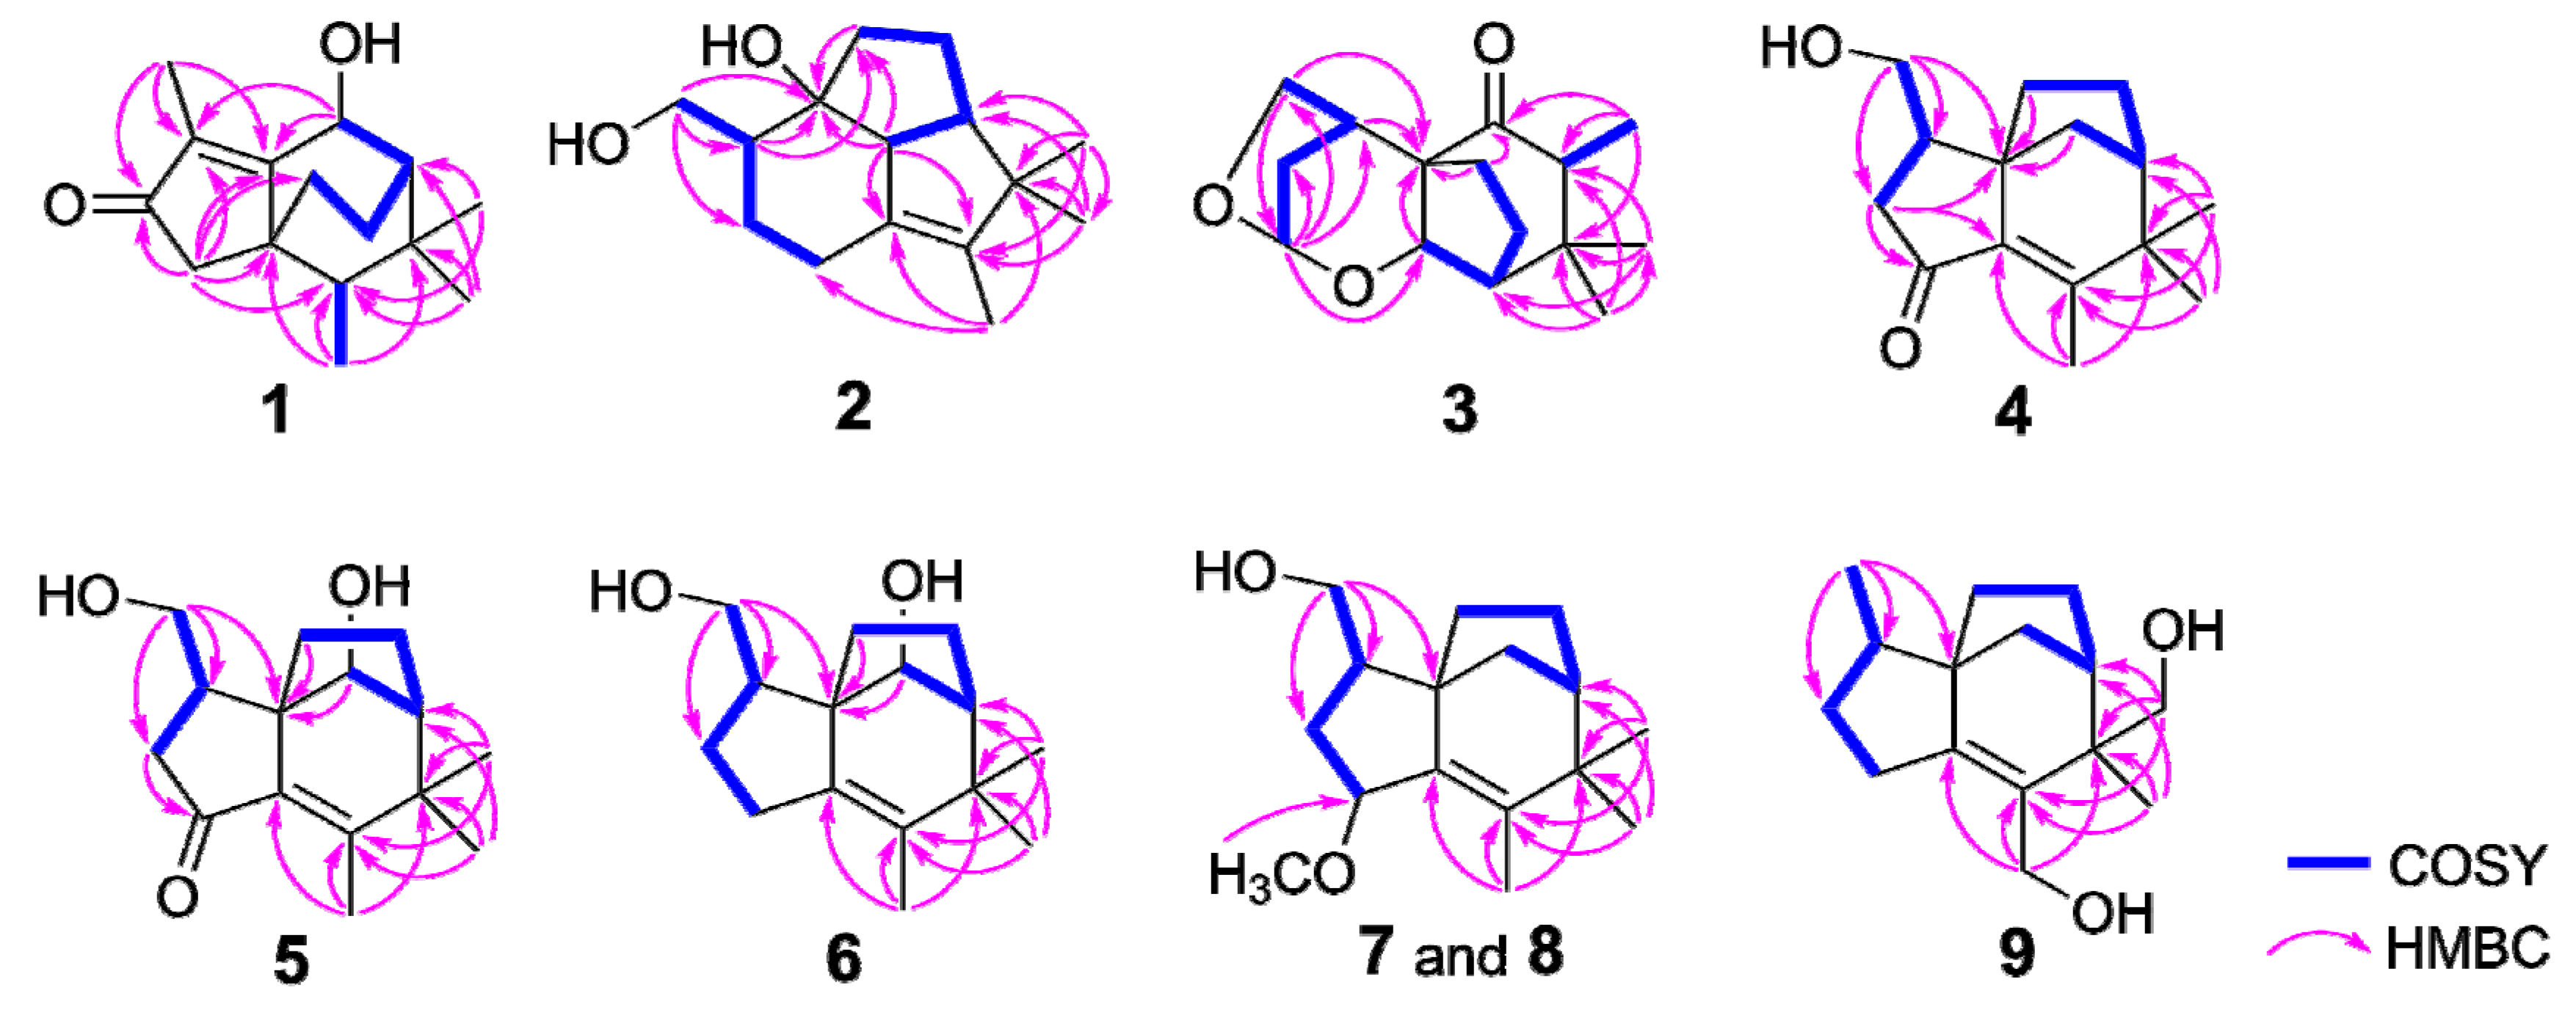
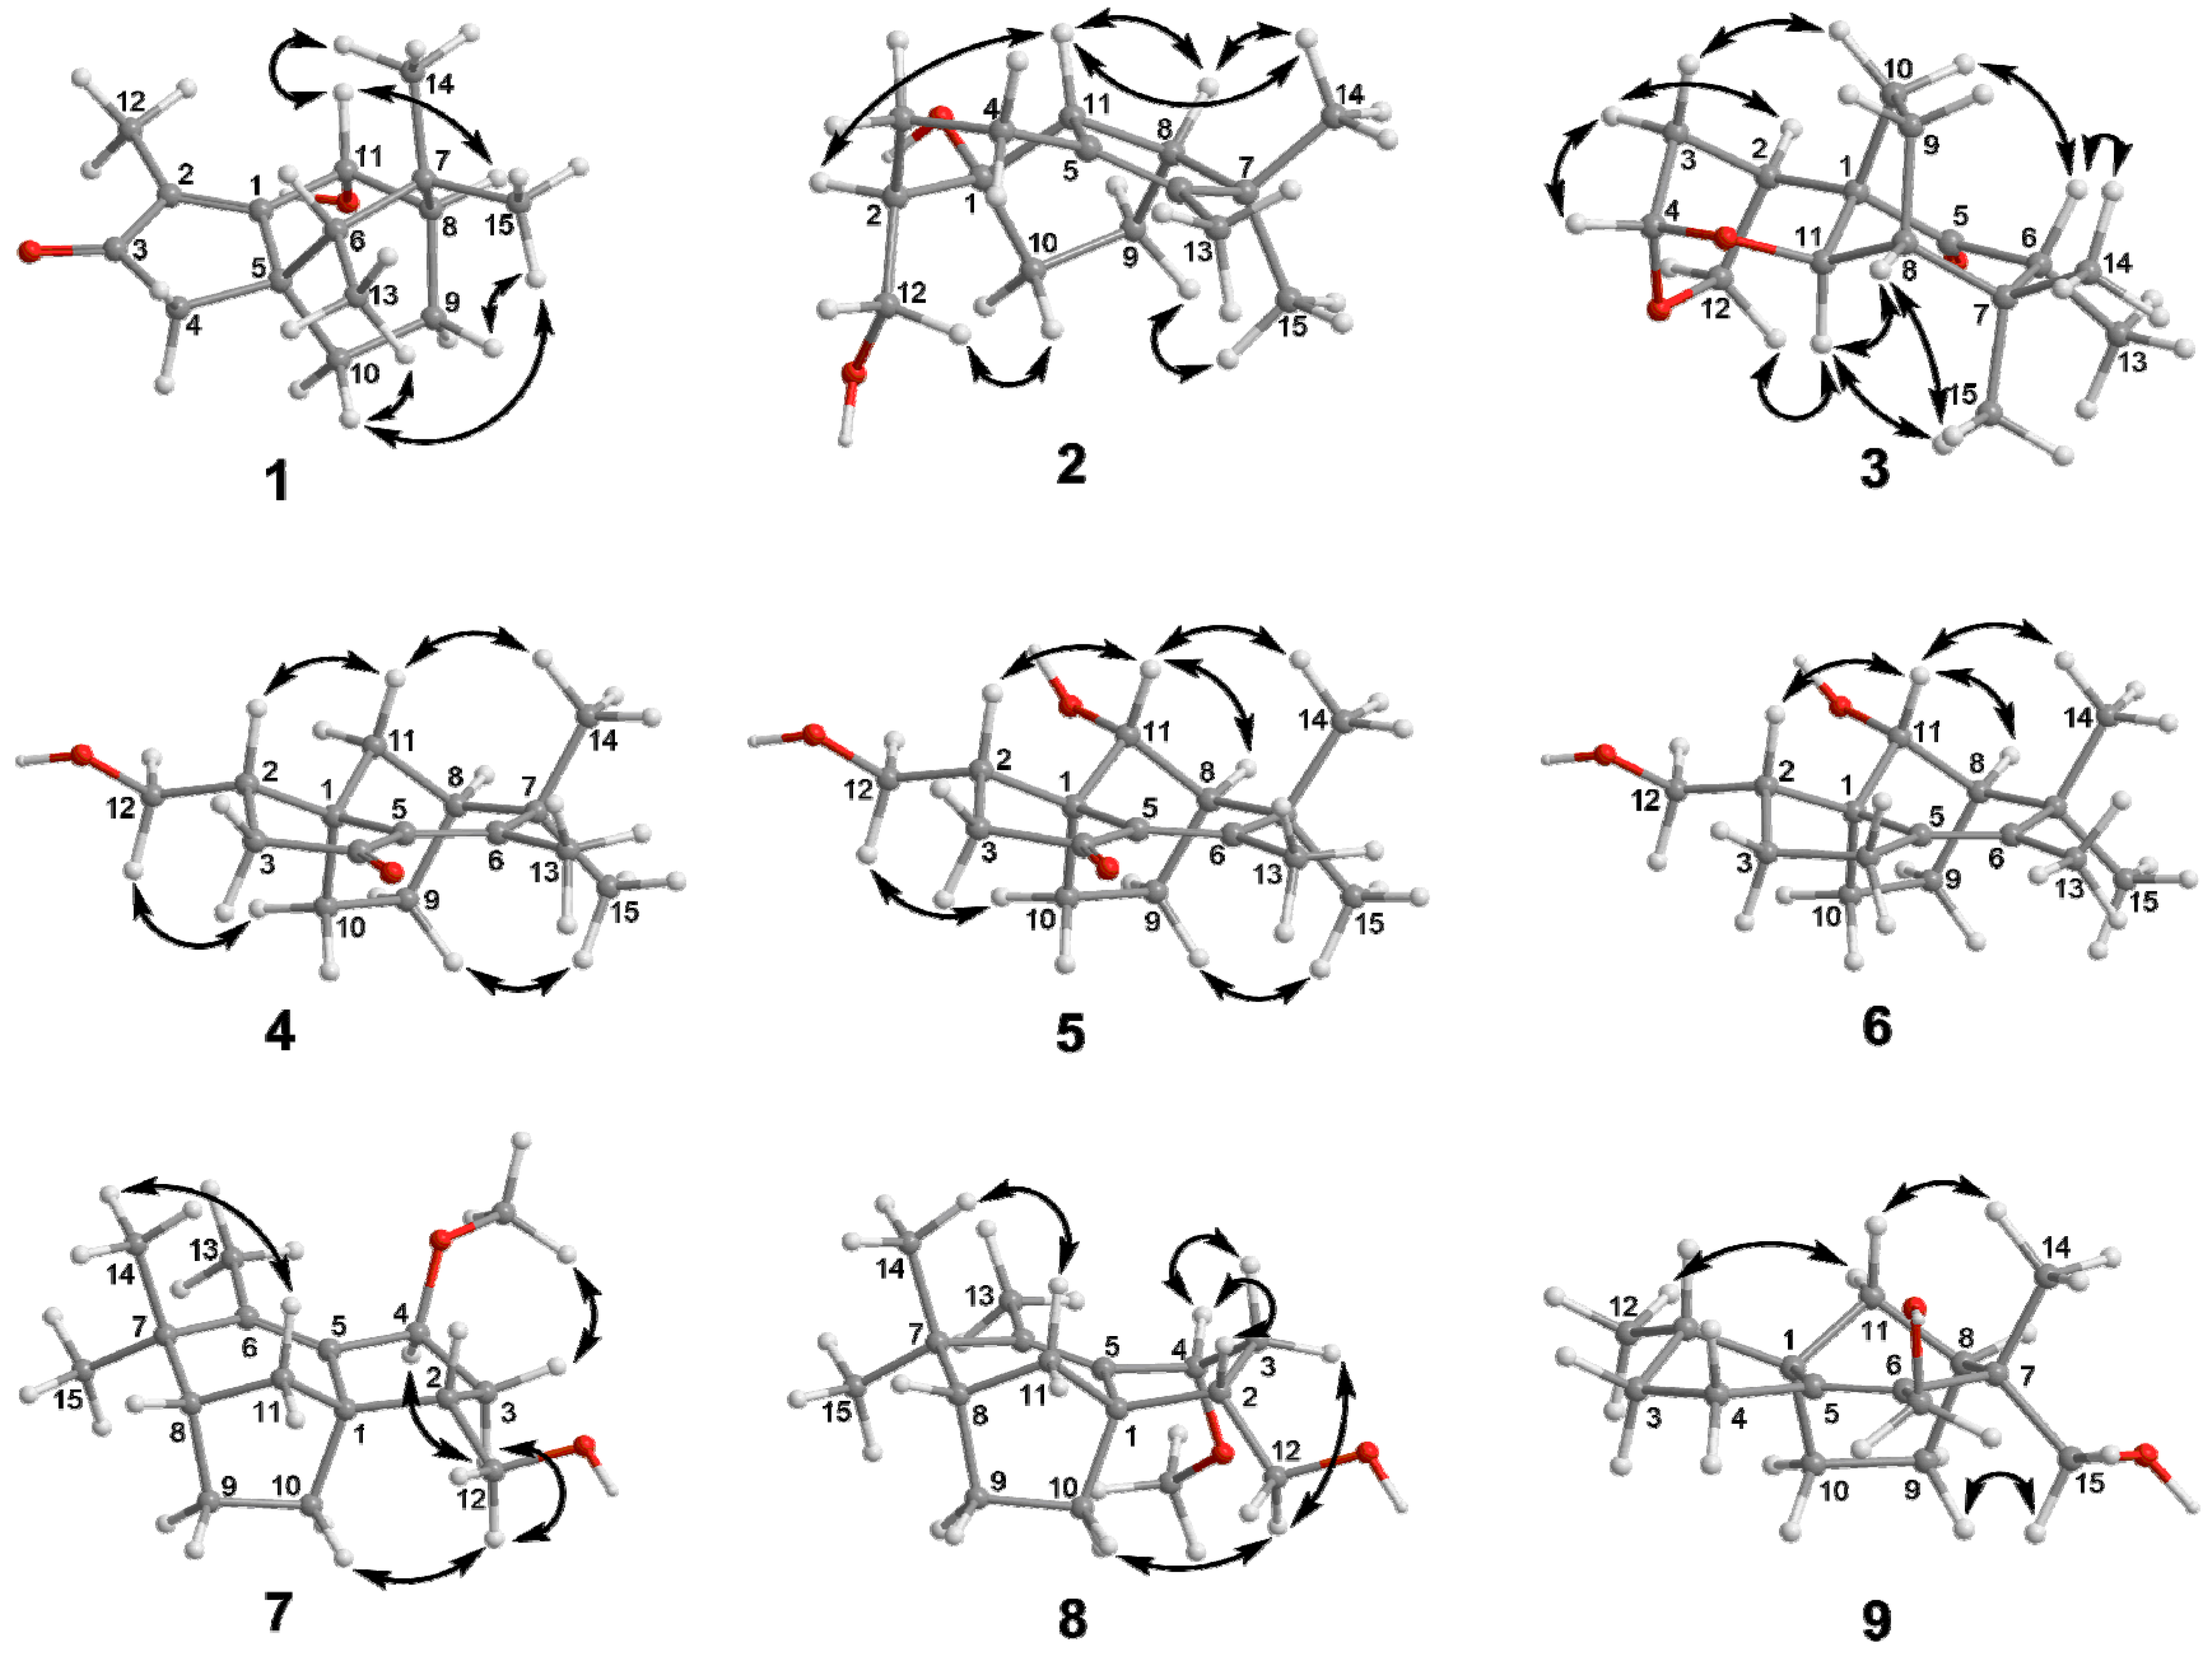
Compound 1 was obtained as a colorless bulk crystal. The molecular formula of 1 was deduced to be C15H22O2 by HRESIMS analysis, requiring five degrees of unsaturation. The 1H NMR spectrum (Table 1) exhibited four methyl groups at δH 1.84 (Me-12), 1.01 (Me-15), 0.99 (Me-14) and 0.92 (Me-13) and an oxygenated methine at δH 4.99 (H-11). Its 13C NMR (Table 2) showed 15 carbon resonances including five quaternary carbons (one carbonyl carbon at δC 209.4 (C-3) and two olefinic carbons at δC 179.3 (C-1) and 134.4 (C-2)), three methines (including an oxygenated methine at δC 66.5 (C-11)), three methylene and four methyl groups as deduced by the DEPT and HSQC experiments. The presence of tricyclic structure in 1 was deduced by the remaining three degrees of unsaturation. The 1H-1H COSY correlations (Figure 2) between H-11/H-8 (δH 1.51)/H2-9 (δH 1.80 and 1.75)/H2-10 (δH 1.98 and 1.13), Me-13/H-6 (δH 1.22) suggested the existence of two sequences to be C-11/C-8 (δC 46.4)/C-9 (δC 39.0)/C-10 (δC 25.0) and C-13 (δC 11.5)/C-6 (δC 43.9). The connection of the above two sequences was determined by HMBC correlations from both Me-14 and Me-15 to C-6, C-7 (δC 34.1) and C-8. Furthermore, HMBC correlations (Figure 2) from Me-12 to C-1 (δC 179.3), C-2 (δC 134.4) and C-3 (δC 209.4), and from H2-4 (δH 2.14 and 2.02) to C-1, C-2, C-3, C-5 (δC 44.7), C-6 and C-10 indicated the occurrence of a 5-membered ring from C-1 to C-5 with a methyl at C-2, and the connection sequence of C-10/C-5/C-6. The planar structure of 1 was finally elucidated by HMBC correlations from H-11 to C-1 and C-2 as shown. The relative configuration of 1 was determined by NOE correlations between Me-15/H-9a (δH 1.80), Me-15/H-10a (δH 1.98), H-10a/Me-13, Me-14/H-11 and H-11/H-8 in the ROESY spectrum, which suggested that H-6, H-11, H-8 and Me-14 occurred on the same side of the ring, while Me-13, Me-15, H2-9 and H2-10 were oriented to the opposite face (Figure 3). The absolute structure of 1 was determined by comparison of the experimental and simulated electronic circular dichroism (ECD) spectra (vide infra).

Table 1.
1H NMR spectroscopic data of compounds 1–3 (500 MHz, δ in ppm).
Table 2.
13C NMR spectroscopic data of compounds 1–3 (125 MHz, δ in ppm).
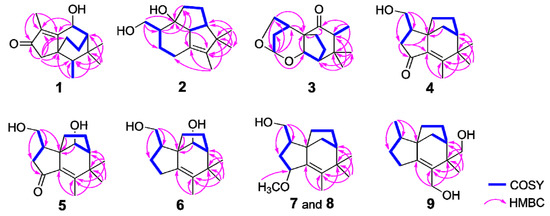
Figure 2.
Key COSY and HMBC correlations for compounds 1–9.
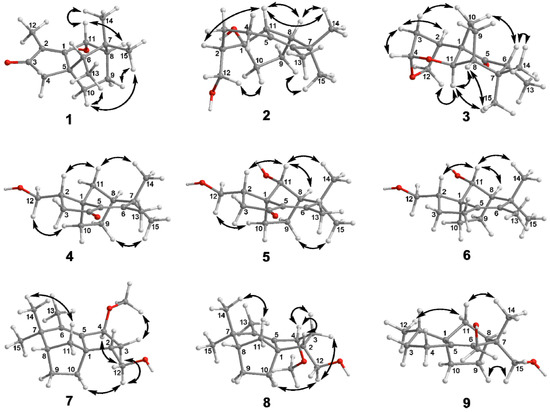
Figure 3.
Key NOE correlations of compounds 1–9.
Compound 2 was gained as a colorless bulk crystal. It possessed a molecular formula of C15H24O2 with four degrees of unsaturation as established by HRESIMS. The 1H and 13C NMR data (Table 1 and Table 2), together with DEPT and HSQC spectra of 2 displayed the presence of four quaternary carbons including one double bond, three methines, five methylenes (one oxygenated) and three methyl groups, indicated three-ringed structure in 2 for the remaining three degrees of unsaturation. 1H-1H COSY cross-peaks between H2-12 (δH 3.82 and 3.40)/H-2 (δH 1.98)/H2-3 (δH 1.88 and 0.90)/H2-4 (δH 2.43 and 1.74), H-11 (δH 2.70)/H-8 (δH 2.37)/H2-9 (δH 1.86 and 1.75)/H2-10 (δH 1.46 and 1.27) revealed that 2 possessed two spin coupling systems as C-12 (δC 65.2)/C-2 (δC 48.3)/C-3 (δC 27.9)/C-4 (δC 26.1) and C-11 (δC 62.5)/C-8 (δC 51.4)/C-9 (δC 26.0)/C-10 (δC 31.4) (Figure 2). The HMBC correlations from H2-12 to C-1 (δC 85.4), C-2 and C-3, and from both H-2 and H-11 to C-1 and C-10 revealed that the linkage of the two sequences was formed from C-10, C-11 and C-2 to C-1. The planar structure of 2 was established by HMBC correlations from H-11 to C-5 (δC 133.7) and C-6 (δC 138.5), from Me-13 (δH 1.47) to C-5, C-6 and C-7 (δC 49.5), from both Me-14 (δH 0.96) and Me-15 (δH 1.01) to C-6, C-7 and C-8, and from H2-4 to C-5 and C-6. The NOE relationships between Me-14/H-11, Me-14/H-8, H-8/H-11 and H-11/H-2 of 2 indicated that those protons were oriented on the same face, whereas the NOEs between Me-15/H-9a (δH 1.86) and H2-10/H2-12 suggested that these latter protons were oriented towards the opposite side (Figure 3).
Compound 3 was gained as a colorless oil. It possessed the molecular C15H22O3 with five degrees of unsaturation as established by HRESIMS. The 1H NMR spectrum of 3 (Table 1) exhibited three methyls at δH 0.85 (Me-15), 0.92 (Me-13) and 1.13 (Me-14), an oxygenated methylene (δH 4.02 and 3.90, H2-12), and five methines at δH 5.30 (H-4), 4.08 (H-11), 2.68 (H-2), 2.51 (H-6) and 1.94 (H-8). The 13C NMR spectra of 3 (Table 2) displayed the presence of three quaternary carbons including one carbonyl carbon, five methines, four methylenes (one oxygenated) and three methyl groups as edited by the DEPT and HSQC experiments. The sequences of C-12 (δC 73.8)/C-2 (δC 35.9)/C-3 (δC 34.7)/C-4 (δC 101.0), C-11 (δC 78.7)/C-8 (δC 54.5)/C-9 (δC 25.9)/C-10 (δC 30.6) and C-6 (δC 48.9)/C-13 (δC 8.7) were assigned by COSY correlations between H2-12/H-2/H2-3 (δH 2.25 and 1.59)/H-4, H-11/H-8/H2-9 (δH 2.21 and 2.16)/H2-10 (δH 2.14 and 1.63) and H-6/Me-13 respectively (Figure 2). HMBC correlations from Me-13 to C-5 (δC 214.6), C-6 and C-7 (δC 39.0), from both Me-15 and Me-14 to C-6, C-7 and C-8, from H-2, H-11 and H2-10 to C-1 (δC 60.2), from H-4 to C-11, C-2, and C-12, and from H-10b (δH 1.63) to C-5 established the planar structure of 3 with bicyclo [3.2.1]octane core and acetal group at C-4. The relative configuration of 3 was deduced by NOEs between H-11/Me-15, H-11/H-12a (δH 4.02), H-11/H-8, H-6/H-10b (δH 1.63), H-6/Me-14, H-2/H-3b (δH 1.59), H-4/H-3b, and H-3a (δH 2.25)/H-10a (δH 2.14) as shown (Figure 3).
Compound 4 was isolated as a colorless bulk crystal. The molecular formula of compound 4 was determined as C15H26O3 by HRESIMS. The NMR data of 4 (Table 3 and Table 4) were similar to those of albaflavenone, except for the presence of oxygenated methylene (δH 3.75, 3.63 and δC 63.9, CH2-12).6 The existence of 12-OH was confirmed by COSY correlations between H2-12/H-2 (δH 2.32)/H2-3 (δH 2.40 and 2.10) together with HMBC correlations from H2-12 to C-1 (δC 52.0), C-2 (δC 42.1) and C-3 (δC 43.8) (Figure 2). The remaining substructures and the relative configuration of 4 were shown to be identical to those of albaflavenone by detailed analysis of the 2D NMR spectra (Figure 2 and Figure 3).
Table 3.
1H NMR spectroscopic data of compounds 4–9 (500 MHz, δ in ppm).
Table 4.
13C NMR spectroscopic data of compounds 4–9 (125 MHz, δ in ppm).
Compound 5 had the molecular formula C15H22O3 according to HRESIMS, indicating that the addition of one further oxygen compared to 4. The NMR data of 5 (Table 3 and Table 4) were identical to those of 4, except for the presence of oxygenated methine (δH 3.89 and δC 79.1, CH-11). The attachment of hydroxy group at C-11 was elucidated by key HMBC correlations from H-11 to C-9 (δC 23.1) and C-10 (δC 27.7). The NOE cross-peaks from H-11 to H-2 (δH 2.44), H-8 (δH 1.83) and Me-14 (δH 1.23) indicated a cis relationship between H-8 and H-11. The remaining structure of 5 was shown to be identical to that of 4 by 2D NMR analysis.
Compound 6 was isolated as a white amorphous powder. The molecular formula of C15H24O2 was deduced from its HRESIMS, differing from 5 by the loss of one oxygen and the addition of two extra protons. Comparison of its 1H and 13C NMR data (Table 3 and Table 4) with those of compound 5 showed an additional methylene group (δH 2.31, 2.16 and δC 28.2, CH2-4) and the disappearance of keto group in 5, which was confirmed by COSY correlations between H2-12 (δH 3.63 and 3.45)/H-2 (δH 2.12)/H2-3 (δH 1.75 and 1.30)/H2-4. The remaining structure of 6 was shown to be identical to that of 5 by detailed analysis of the 2D NMR spectra of 6.
Compound 7 was obtained as a colorless oil. It possessed the molecular formula C16H26O2 as determined by HRESIMS. Its 1H and 13C NMR spectra were similar to those of 4. The appearance of a methoxy group (δH 3.30 and δC 56.3, 4-OCH3) in 7 and the absence of keto group at C-4 in 4 suggested the methoxy group located at C-4, which was confirmed by COSY correlations between H2-12 (δH 3.76 and 3.62)/H-2 (δH 2.25)/H2-3 (δH 2.09 and 1.34)/H-4 (δH 4.12) together with the HMBC correlations from the methoxy singlet to C-4 (δC 79.7). Detailed analysis of the 2D NMR spectra of 7 determined the compound to be identical to 4 except for the methoxy group at C-4. The coupling constant of H-4 (δH 4.12, d, J = 5.7 Hz) was comparable to that of (4S)-albaflavenol (δH 4.56, d, J = 5.4 Hz), but differed from that in (4R)-albaflavenol (δH 4.61, t, J = 7.8 Hz), suggesting the trans configuration between H-2 and H-4 [6]. In the ROESY spectrum of 7, the observed NOE correlations between H2-12/H-3α (δH 1.34), H-4/H-3α and 4-OCH3/H-3β (δH 2.09) confirmed this assumption.
Compound 8 shared the same planar structure as that of 7 by detailed analysis of its HRESIMS and 2D NMR spectrum. The coupling constant of H-4 (δH 4.24, t, J = 6.4 Hz) was comparable to that of (4R)-albaflavenol (δH 4.61, t, J = 7.8 Hz), suggesting the cis configuration between H-2 (δH 2.02) and H-4 [6]. Meanwhile, the key NOE correlation between H-2 and H-4 in the ROESY spectrum suggested that 7 and 8 are 4-epimers.
Compound 9 was gained as a colorless oil. It possessed the molecular formula C15H24O2 with four degrees of unsaturation as indicated by HRESIMS. The NMR data of compound 9 resembled those of 4 showed the presence of two oxygenated methylene groups (δH 3.66, 3.62 and δC 69.0, CH2-15; δH 4.01, 3.95 and δC 59.4, CH2-13) and a doublet methyl signal (δH 0.97 and δC 14.2, Me-12). HMBC correlations from both H2-15 and Me-14 (δH 1.08) to C-6 (δC 130.2), C-7 (δC 46.4) and C-8 (δC 44.6), and from H2-13 to C-5 (δC 153.9), C-6 and C-7, together with NOE correlation between H2-15/H-9a (δH 1.99) indicated that two hydroxy groups located at C-13 and C-15, respectively.
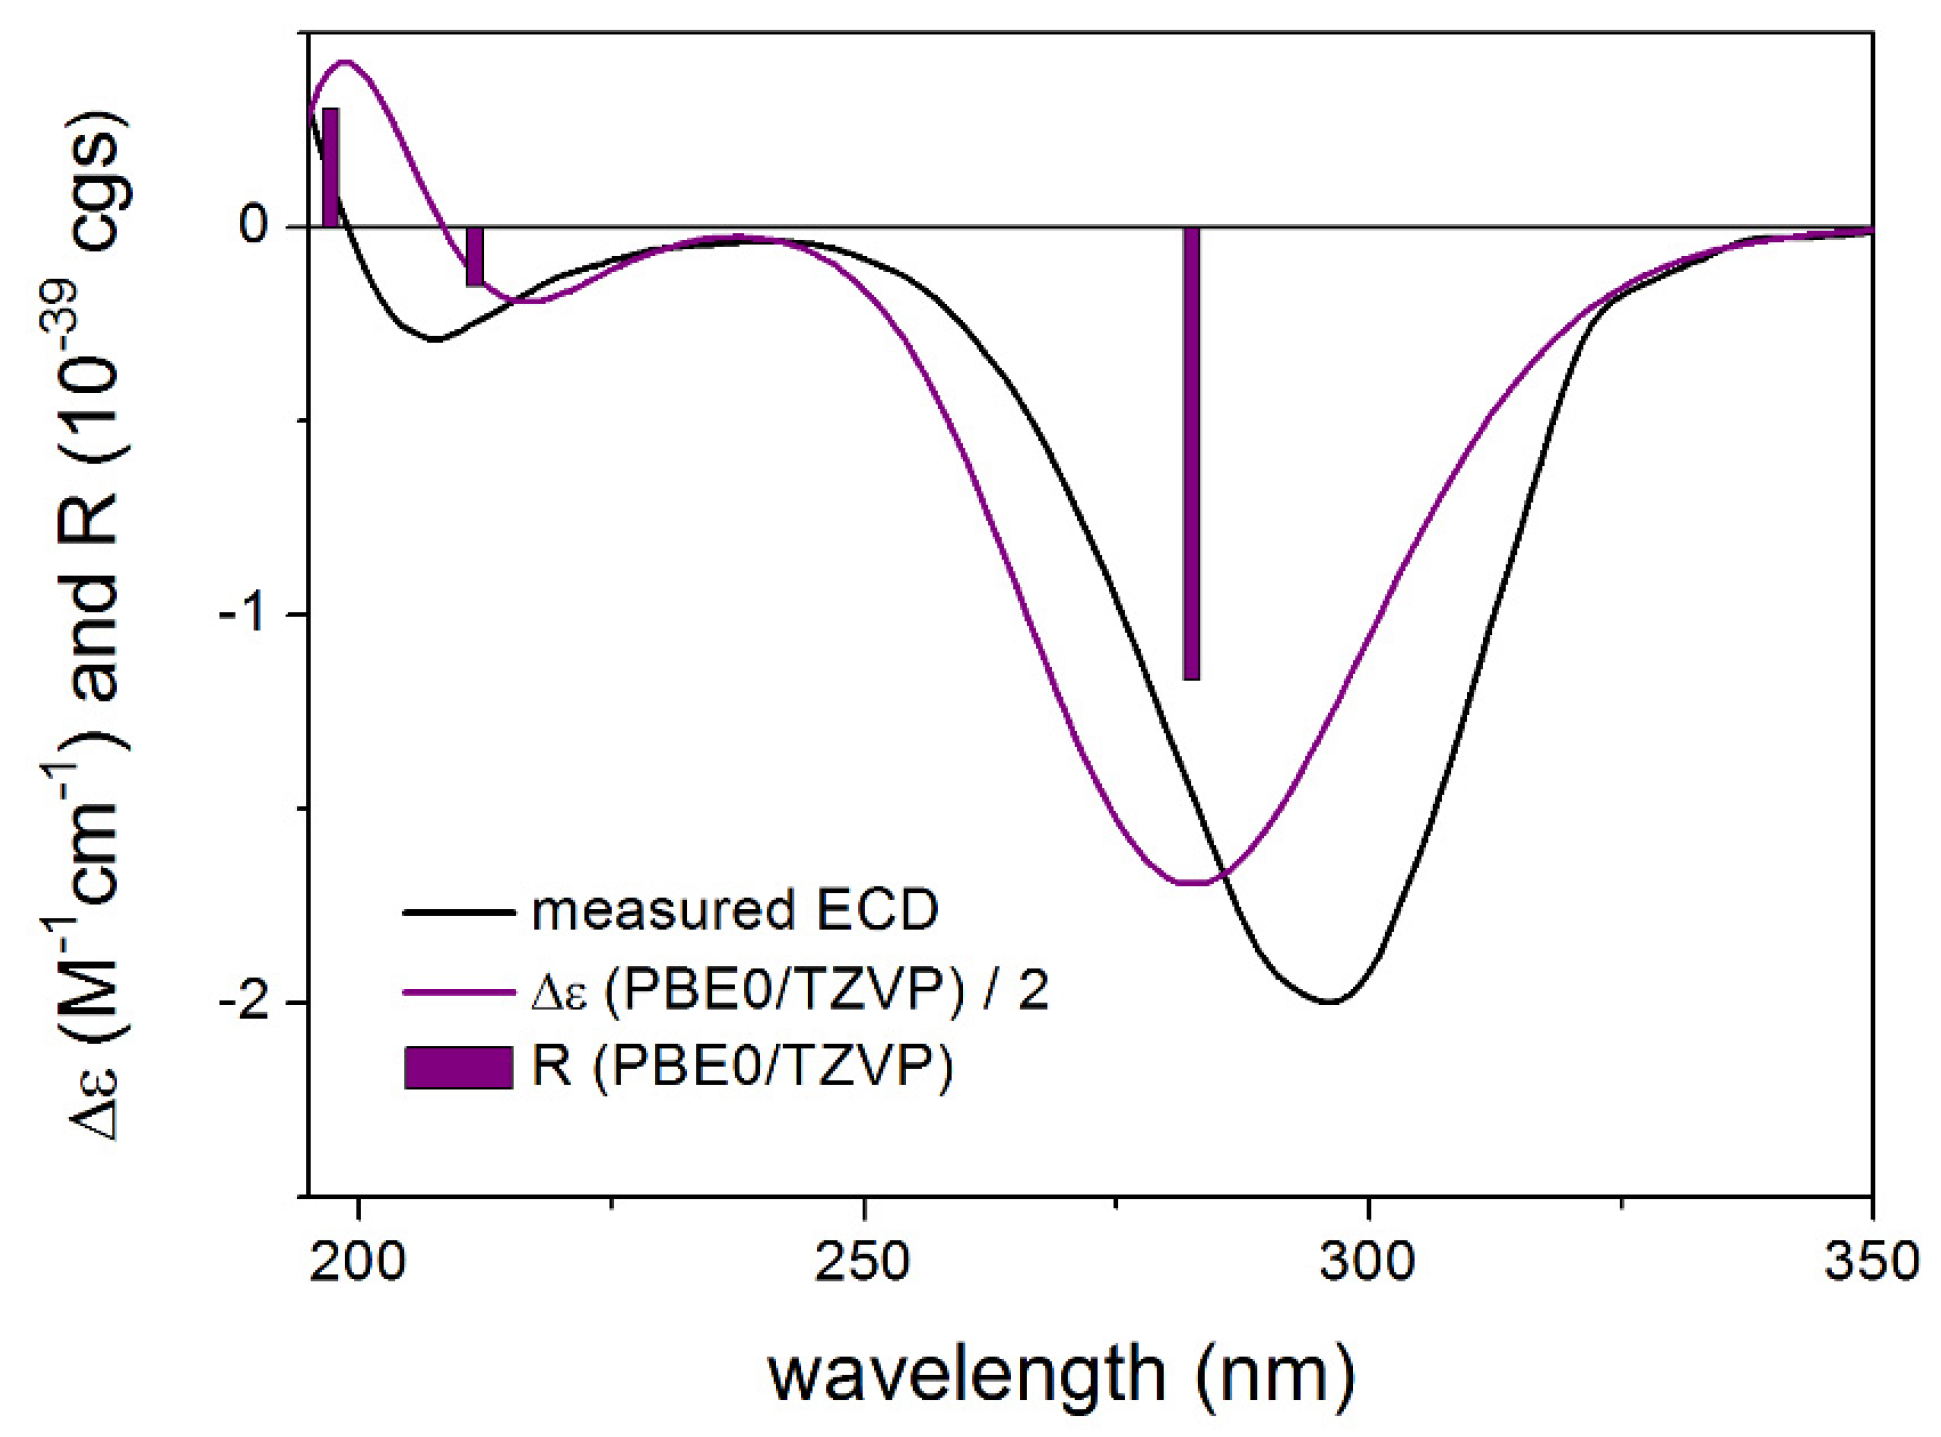
To elucidate the absolute configuration of 1, 3 and 4, the solution TDDFT-ECD method was applied [7,8]. The initial Merck Molecular Force Field (MMFF) conformers were reoptimized at the B3LYP/6-31+G(d,p) in vacuo and the CAM-B3LYP/TZVP PCM/MeOH levels, separately, and ECD spectra were computed with four different functionals for the low-energy conformers. In the case of proposed (1S,2S,4S,6R,8R,11R)-3, a single conformer (Supplementary Materials) was found for which all combinations of levels gave moderate to good agreement with the experimental spectrum based on which the absolute configuration could be unambiguously elucidated as (1S,2S,4S,6R,8R,11R) (Figure 4). It is interesting to note that the B3LYP and PBE0 functionals performed better for the minor transitions in the low-wavelength region then the CAM-B3LYP and BH&HLYP ones.
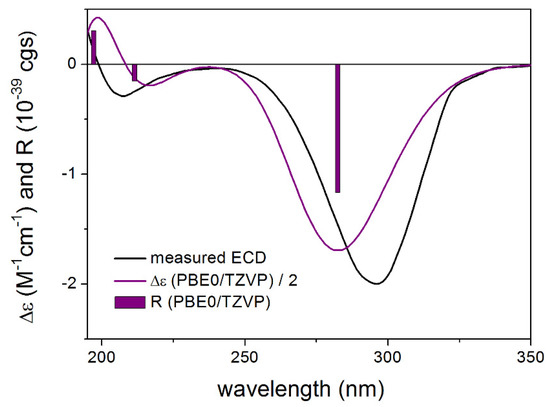
Figure 4.
Experimental ECD spectrum of 3 in MeOH compared with the PBE0/TZVP PCM/MeOH ECD spectrum of the single low-energy CAM-B3LYP/TZVP PCM/MeOH conformer of proposed (1S,2S,4S,6R,8R,11R)-3. Bars represent the rotational strength values.
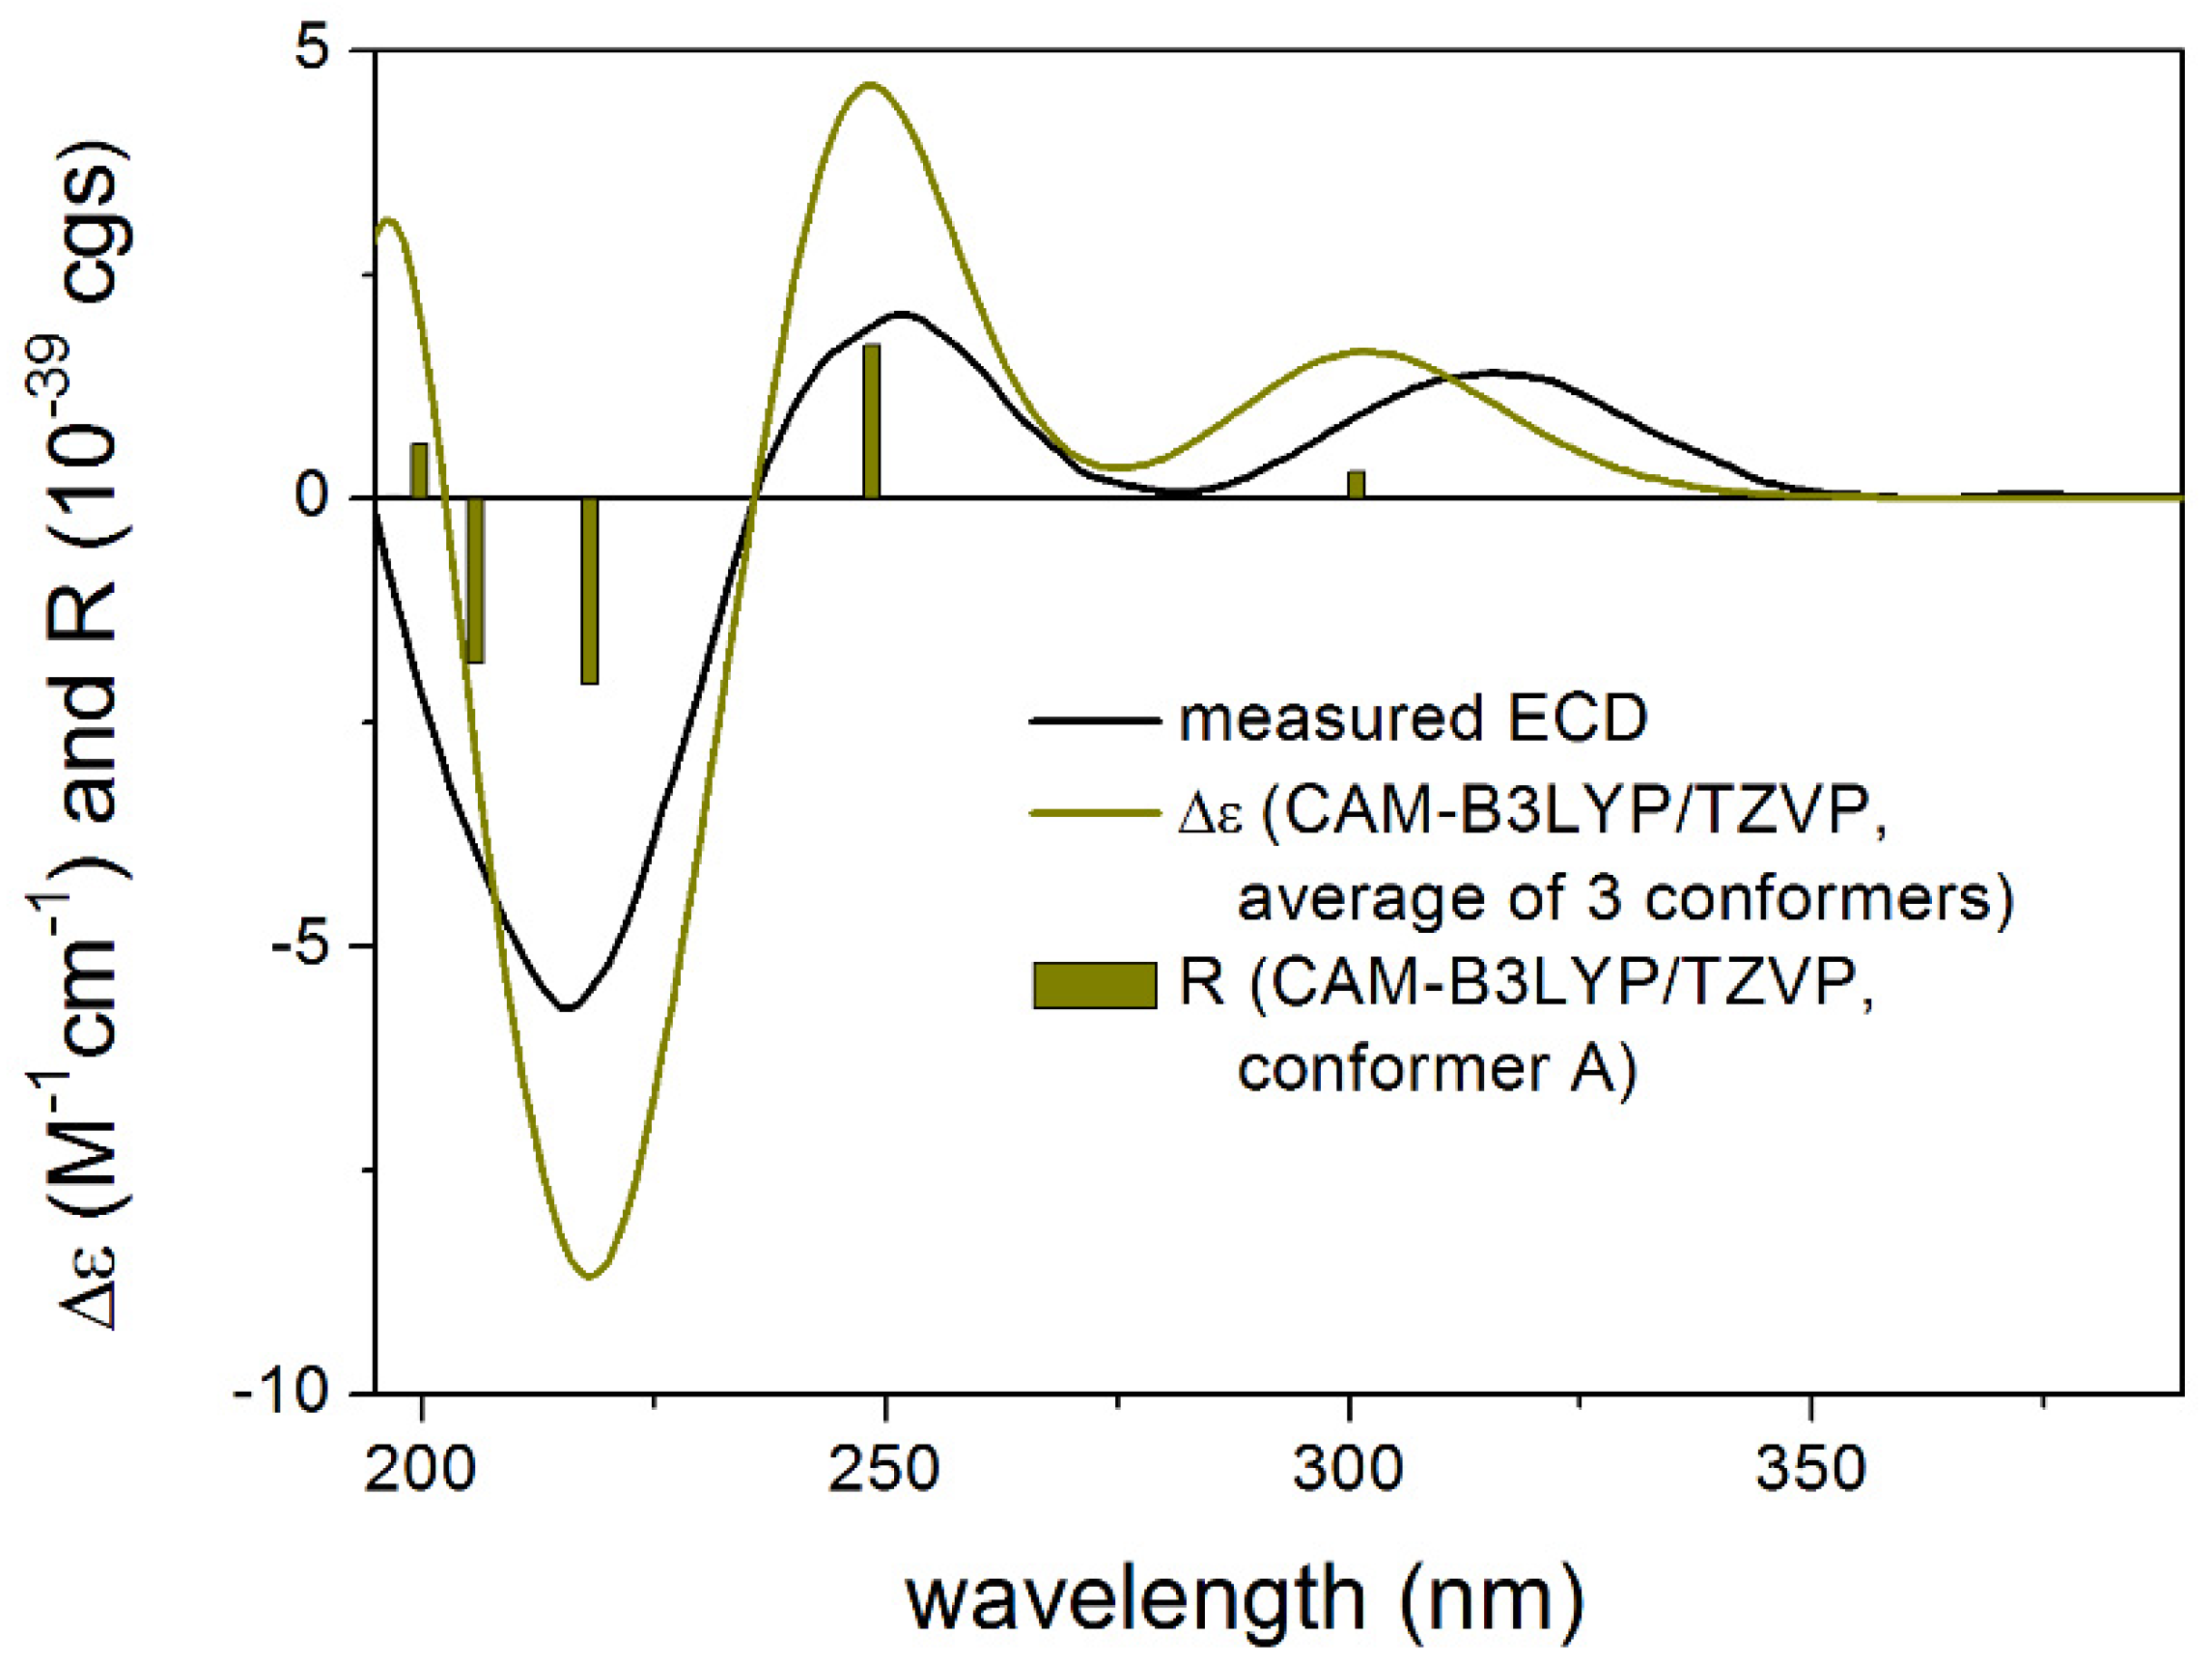
In the case of 1, the B3LYP and PBE0 functionals which performed better for 3 gave a mismatch in all applied combinations for the proposed (5R,6S,8R,11R) enantiomer while the BH&HLYP and CAM-B3LYP functionals reproduced all experimental transitions well (Figure 5). Analysis of the distinct conformers indicated that a different Boltzmann-weight can reproduce the experimental spectrum also in the case of the B3LYP and PBE0 functionals which can derive from a moderate error in estimating the relative energies by the applied levels of theories [9,10]. Therefore the initial 3 MMFF conformers were also reoptimized at the SOGGA11-X/TZVP [11]. SMD/MeOH level. The SOGGA11-X functional was found one of the best in a recent DFT benchmark study [12]. Indeed, by computing ECD for the SOGGA11-X conformers (Supplementary Materials), all four applied TDDFT functionals gave good agreement with the experimental spectrum in line with the biosynthetic considerations allowing elucidation of the absolute configuration as (5R,6S,8R,11R)-1. The relative intensities of the transitions were reproduced better by the BH&HLYP and CAM-B3LYP functionals than by the other two.
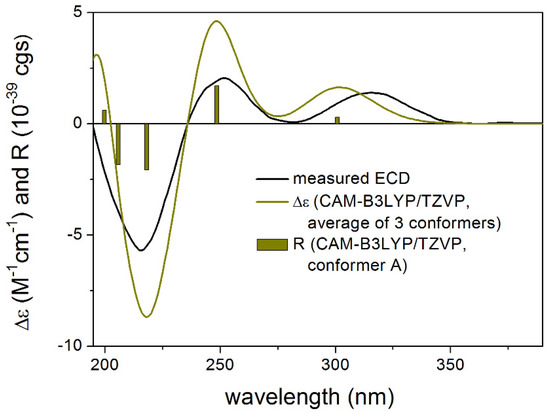
Figure 5.
Experimental ECD spectrum of 1 in MeOH compared with the Boltzmann-weighted CAM-B3LYP/TZVP SMD/MeOH ECD spectrum of proposed (5R,6S,8R,11R)-1 computed for the SOGGA11-X/TZVP SMD/MeOH conformers. Bars represent the rotational strength values of conformer A.
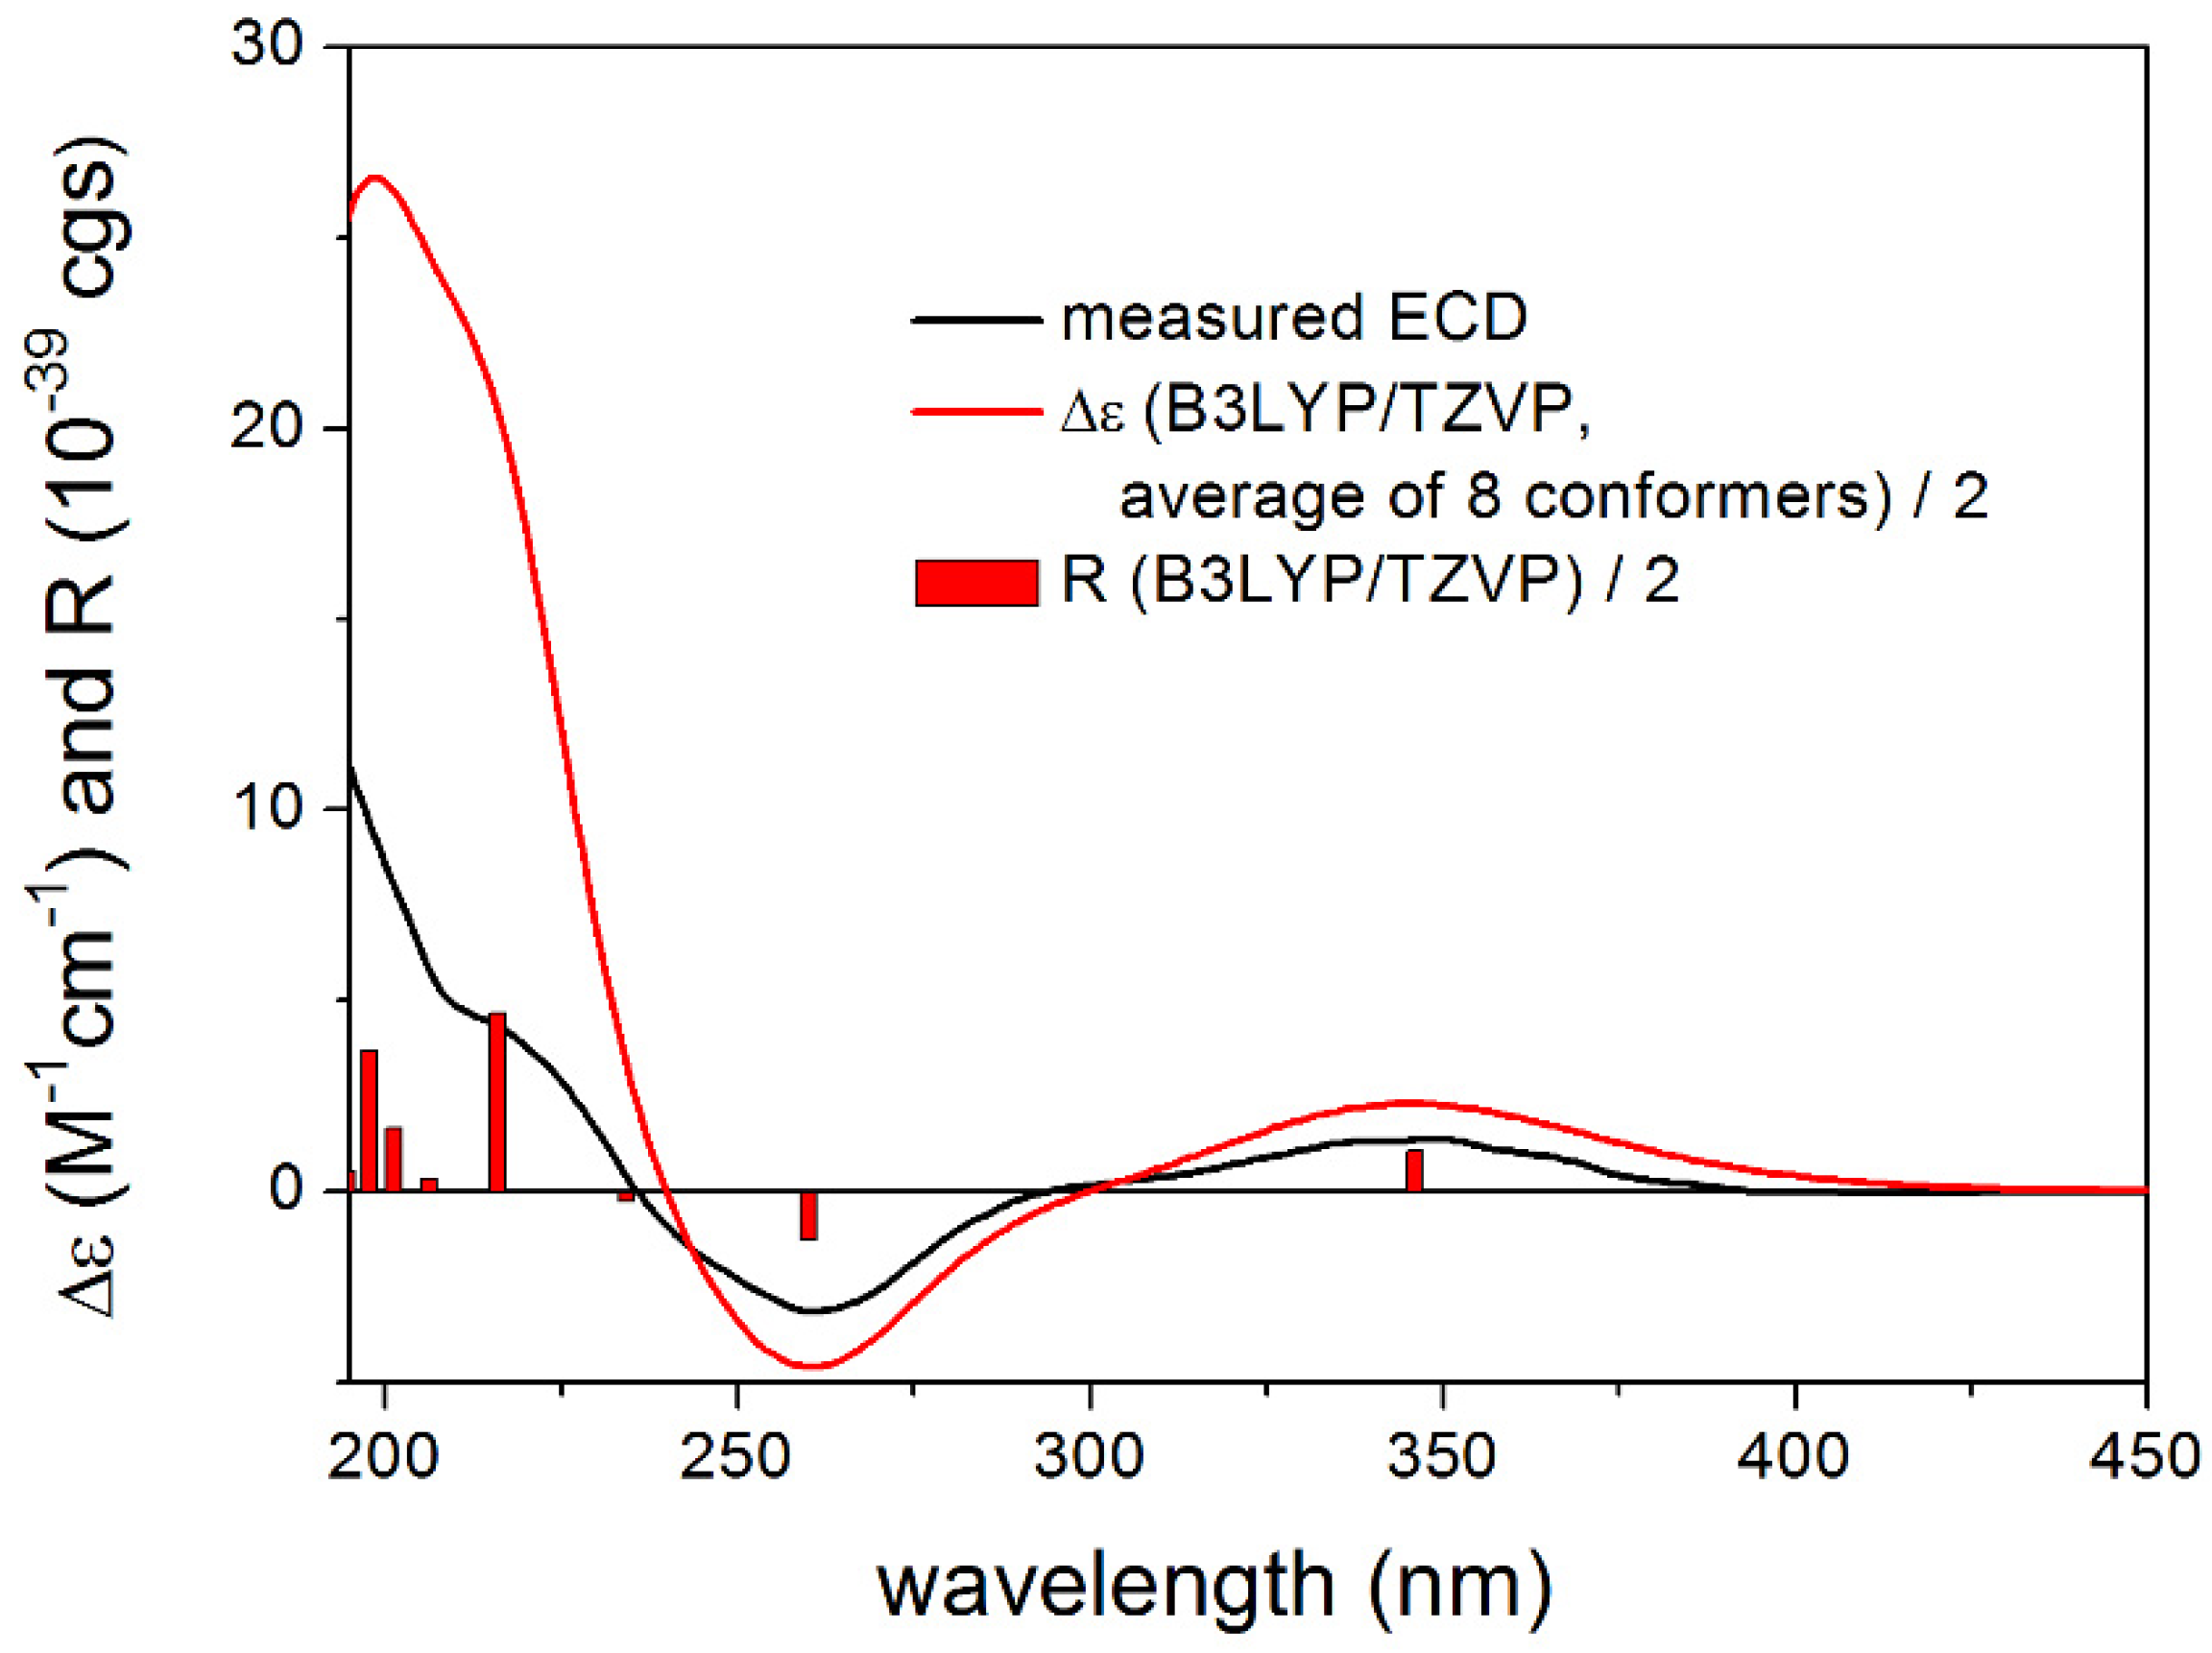
For proposed (1R,2S,8S)-4, both the gas-phase and the solvent model calculations gave acceptable to good agreements with the experimental ECD spectrum (Figure 6). Similarly to 1, ECD spectra computed with the B3LYP and PBE0 functional reproduced all transitions well, while the CAM-B3LYP and especially the BH&HLYP functionals had problems with the reproduction of the negative ECD transition at 260 nm. Reproduction of the other two transitions and nice agreement with the B3LYP and PBE0 functionals, however, allowed elucidation of the absolute configuration as (1R,2S,8S), which is also in line with the biosynthetic considerations. To improve the agreement, DFT optimizations were also performed at the SOGGA11-X/TZVP SMD/MeOH level but very similar results were found to those of the gas-phase and PCM calculations. The ECD calculations of these compounds emphasize further that it is always advisable to apply more than one DFT functional both for the DFT optimization and the TDDFT calculation steps [7,8,9]. The similar ECD spectra of 4 and 5 (the latter was noisy in the low-wavelength region) allow elucidation of the AC of 5 as (1R,2S,8R,11R). The absolute stereochemistry of the further compounds 6–9 was determined based on biosynthetic considerations.
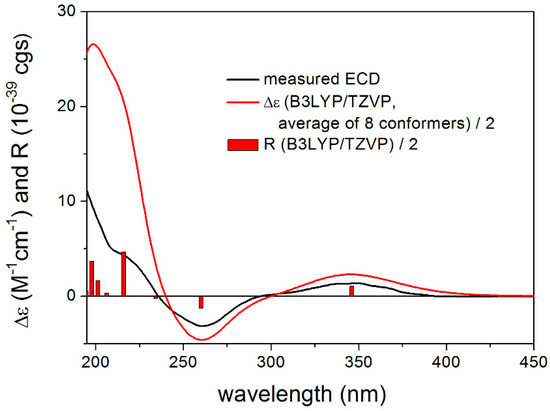
Figure 6.
Experimental ECD spectrum of 4 in MeOH compared with the Boltzmann-weighted B3LYP/TZVP PCM/MeOH ECD spectrum of proposed (1R,2S,8S)-4 computed for the CAM-B3LYP/TZVP PCM/MeOH conformers. Bars represent the rotational strength values of conformer A.
To our knowledge, this is the first time that so many ziaane-type sesquiterpenes were identified from agarwood, which may be the characteristic chemicals of this agarwood. A plausible biosynthetic pathway of sesquiterpenoids from agarwood is proposed to start from a liner precursor farnesyl pyrophosphate (FPP) modified after literature (Figure 7) [13,14]. The FPP undergoes ionization, cyclization, hydride shift, spirocyclization, cyclization and syn-1,2-methyl migration to generate the intermediate cation A. The formation of zizaanes 4–9 has been proposed to involve A, syn-deprotonation and oxidations of intermediated cation C. In addition, intermediated cation A undergoes rearrangement reactions a or b leading to cations B or C, which were catalyzed to form novel compounds 1 or 2, respectively. A biosynthetic pathway for 3 is proposed from 5 through 4,5-Bayer-Villiger oxidation, 4,5-hydrolysis and 5,6-enol-keto-tautomerization, 4,11-esterification and 4,12-condensation.
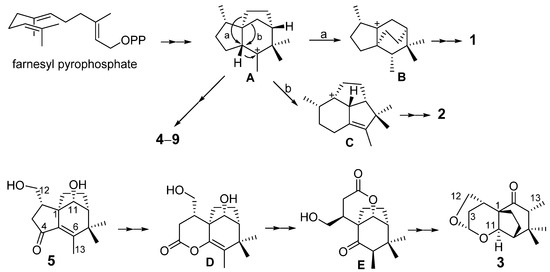
Figure 7.
Plausible biosynthesis of sesquiterpenoids from agarwood.
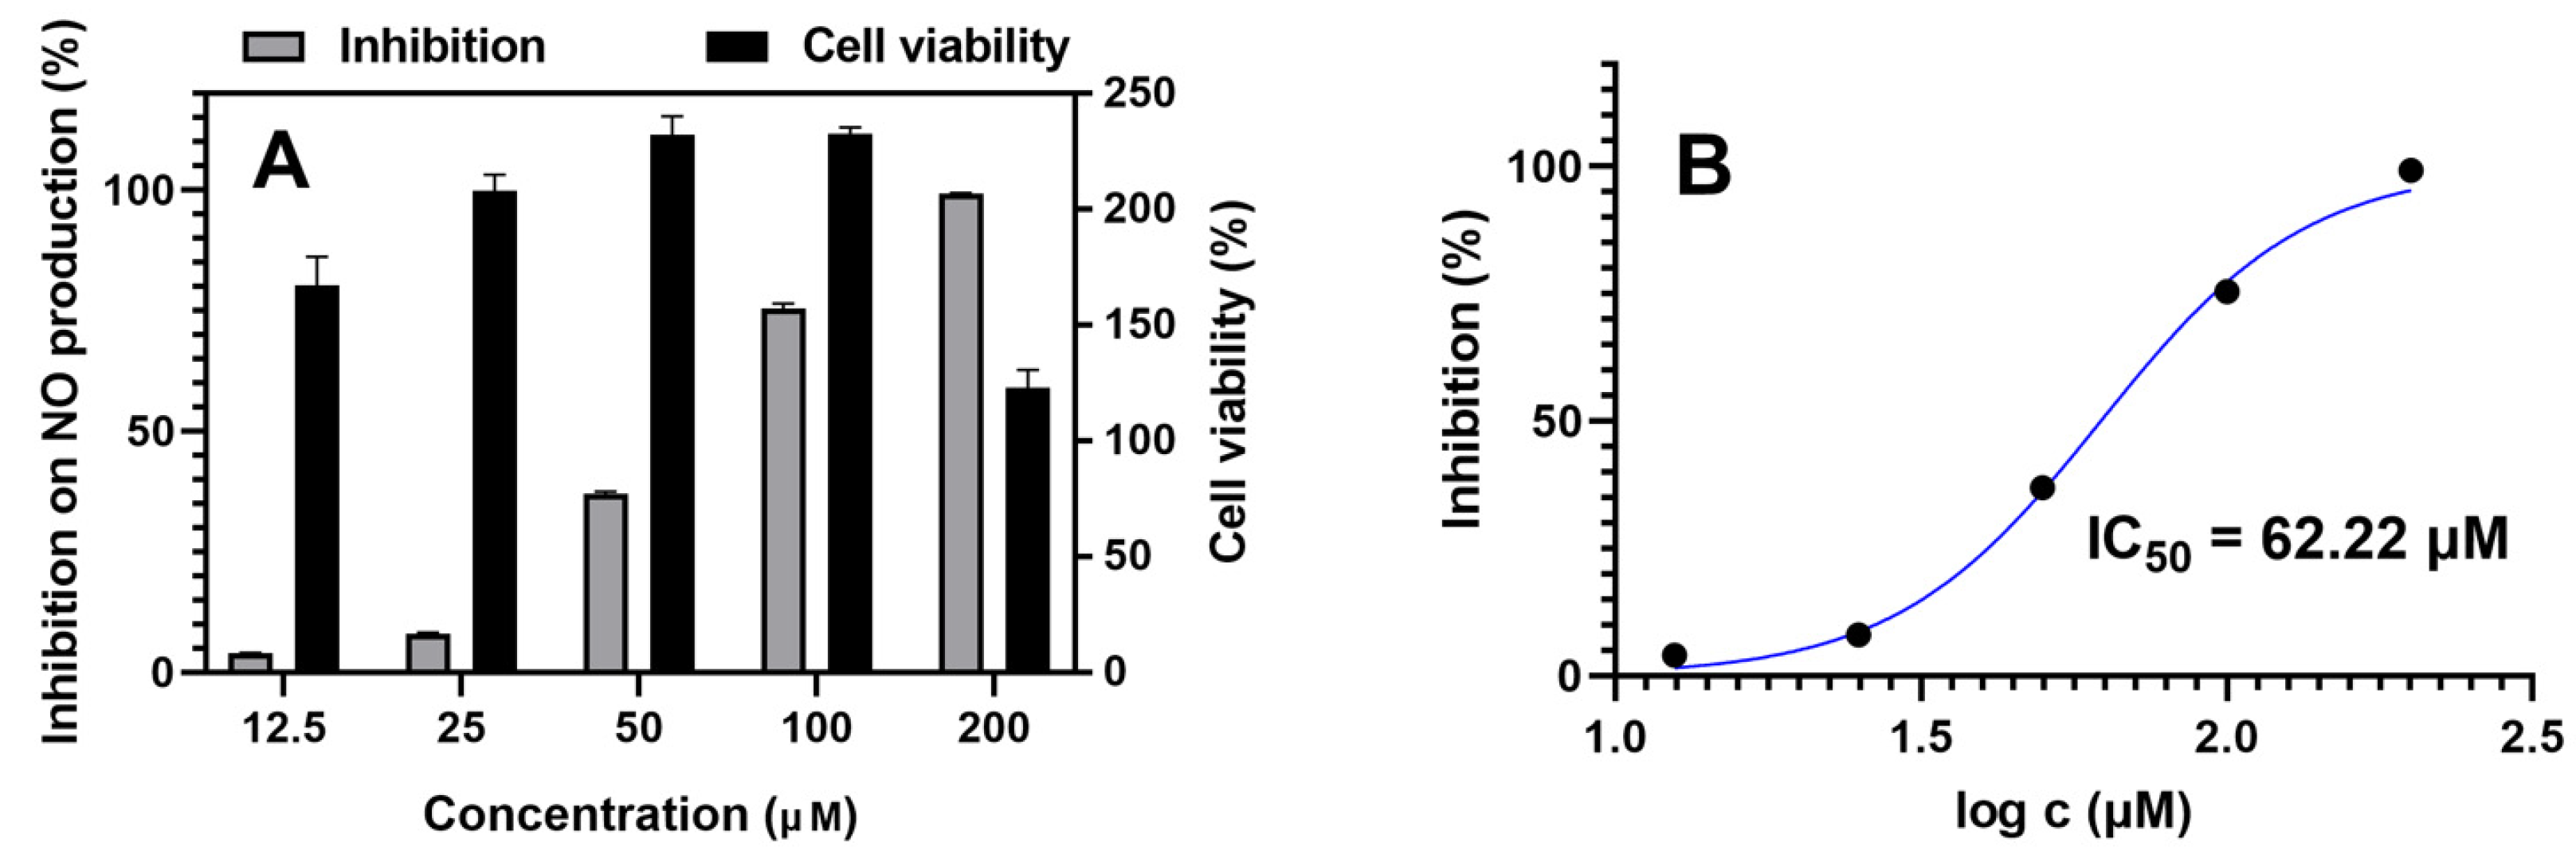
All isolated sesquiterpenes (1–9) were tested for α-glucosidase inhibition and anti-inflammatory activities in vitro. Acarbose was used as a positive control for α-glucosidase inhibition with an IC50 value of 743.4 ± 3.3 μM. Quercetin and indomethacin were used as positive controls for anti-inflammatory activity with IC50 values of 8.22 ± 0.80 μM and 35.40 ± 1.77 μM, respectively. However, none of them exhibited α-glucosidase inhibition activity. Only compound 9 exhibited weak inhibition of NO production in LPS-stimulated RAW264.7 cells with an IC50 value of 62.22 ± 1.27 μM (Figure 8). The two hydroxy groups located at C-13 and C-15 effectively enhanced its anti-inflammatory activity. Although the anti-inflammatory activity of compound 9 is weaker than in the positive controls, this is the first report about the anti-inflammatory activity of ziaane-type sesquiterpenes. Further research is needed to confirm the activity and to uncover its exact mechanisms. In order to investigate whether the inhibitory activities of isolated sesquiterpenes were due to the decrease of cell numbers (cytotoxicity), their effects on cell viability also had been measured using the MTT method. None of them (up to 100 μM) showed cytotoxicity with LPS treatment.
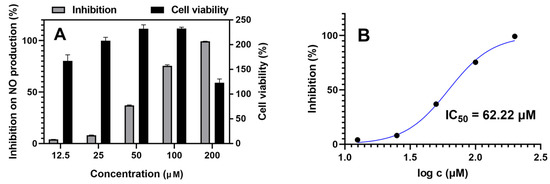
Figure 8.
Anti-inflammatory activity assay using LPS-induced RAW264.7 cells. (A) Concentration effects of compound 9 on NO formation of LPS-induced RAW264.7 cells and on the viability of RAW264.7 cells, n = 3. (B) IC50 of compound 9 on inhibition of NO production in LPS-stimulated RAW264.7 cells, concentrations were transferred to Log(c).
3. Materials and Methods
3.1. General Procedures
Optical rotations were measured with a Rudolph Autopol I polarimeter (Rudolph, Hackettstown, NJ, USA). UV spectra were recorded on a Shimadzu UV-2550 spectrometer (Beckman, Kyoto, Japan). ECD spectra were measured on a JASCO J-715 spectrophotometer (JASCO, Tokyo, Japan). IR absorptions were obtained on a Nicolet 380 FT-IR instrument (Thermo, Pittsburgh, PA, USA) using KBr pellets. HRESIMS were determined by an API QSTAR Pulsar mass spectrometer (Bruker, Bremen, Germany) or 6200 series TOF/6500 series (Agilent, Palo Alto, CA, USA). The NMR spectra were recorded on Bruker Avance 500 NMR spectrometers (Bruker, Bremen, Germany), using TMS as an internal standard. HPLC purifications were performed on an analytical reversed-phase column (YMC-packed C18, 250 mm × 10 mm, 5 µm) (YMC, Tokyo, Japan) using a G1311C 1260 Quat Pump VL and detected with a G1315D 1260 DAD VL detector (190–500 nm) (Agilent Technologies 1260 infinity, Palo Alto, CA, USA). Column chromatography was performed with silica gel (60–80, 200–300 mesh, Qingdao Haiyang Chemical Co., Ltd., Qingdao, China), ODS gel (20–45 µm, Fuji Silysia Chemical Co., Ltd., Durham, NC, USA), and Sephadex LH-20 (Merck, Darmstadt, Germany). TLC was carried out on NUSCRIPT silica gel GF254 (Qingdao Haiyang Chemical Co., Ltd., China), and peaks were detected by spraying with 5% H2SO4 in EtOH followed by heating.
3.2. Plant Material
The plant material was collected in NANA International Agarwood Market of Thailand, in August of 2014, and identified as agarwood originated from Aquilaria sp. by Dr. Jun Wang (Institute of Tropical Bioscience and Biotechnology, Chinese Academy of Tropical Agricultural Sciences & Hainan engineering research center of agarwood). A voucher specimen (201408SLLK) has been deposited at the Institute of Tropical Bioscience and Biotechnology, Chinese Academy of Tropical Agricultural Sciences.
3.3. Extraction and Isolation
Air-dried of agarwood (384.0 g) was extracted with ethyl ether (1.5 L × 3). The extract was filtered and concentrated to get the ethyl ether extract (27.6 g). The ethyl ether extract (23.4 g) was applied to ODS gel CC eluting with MeOH–H2O (v/v, 2:3, to 1:0, 2 L of each) to provide 16 fractions (Fr.1–Fr.16). Fr.6 (0.6 g) was subjected to Sephadex LH-20 gel CC eluded with petroleum ether–CHCl3–MeOH (v/v/v, 2:1:1) to give six fractions (Fr.6-1–Fr.6-7). Fr.6-3 (140.4 mg) was separated on silica gel CC with petroleum ether–acetone (v/v, 150:1 to 0:1), then purified by silica gel CC using CHCl3–MeOH (v/v, 150:1) to afford compound 5 (2.3 mg). Fr.7 (1.3 g) was separated to Sephadex LH-20 gel CC eluded with CHCl3–MeOH (v/v, 1:1) and then fractionated by silica gel CC eluted with petroleum ether–EtOAc (v/v, 500:1 to 1:1, 1.0 L of each) to yield 13 fractions (Fr.7-1–Fr.7-13). Fr.7-7 and Fr.7-8 were merged together (547.7 mg) to be subjected on silica gel CC with petroleum ether–EtOAc–MeOH (v/v/v, 20:1:0.1 to 0:0:1) and silica gel CC using CHCl3–MeOH (v/v, 200:1), then purified by semi-preparative HPLC (C18 column; MeOH–H2O v/v, 55:45; flow rate 4.0 mL/min; UV detection at 200, 210 nm) to afford compounds 2 (32.2 mg) and 1 (1.2 mg). Fr.8 (799.1 g) was subjected to silica gel CC eluted with petroleum ether–EtOAc (v/v, 500:1 to 1:1, 1.0 L of each) to give 12 fractions (Fr.8-1–Fr.8-12). Fr.8-6 (36.8 mg) was separated on silica gel CC with petroleum ether–CHCl3–MeOH (v/v/v, 2:1:1), then purified by semi-preparative HPLC (C18 column; MeOH–H2O v/v, 65:35; flow rate 4.0 mL/min; UV detection at 200, 220 nm) to afford compound 8 (4.4 mg). Fr.8-11 (48.0 mg) was applied to silica gel CC with petroleum ether–EtOAc (v/v, 30:1), then purified by semi-preparative HPLC (C18 column; MeOH–H2O v/v, 65:35; flow rate 4.0 mL/min; UV detection at 200, 220 nm) to afford compound 7 (8.3 mg). Fr.9 (1.8 g) was divided to Sephadex LH-20 gel CC eluting with petroleum ether–CHCl3–MeOH (v/v/v, 2:1:1) to obtain 11 fractions (Fr.9-1–Fr.9-11). Fr.9-3 (472.4 mg) was separated on silica gel CC with petroleum ether–EtOAc (v/v, 500:1 to 1:1, 1.0 L of each) and recrystallization to get compound 4 (30.5 mg). Fr.10 (2.0 g) was chromatographed on Sephadex LH-20 gel CC eluting with petroleum ether–CHCl3–MeOH (v/v/v, 2:1:1) to yield Fr.10-1–Fr.10-5. Fr.10-2 (944.8 mg) was subjected to silica gel CC with CHCl3–MeOH (v/v, 300:1 to 0:1, 1.0 L of each) and silica gel CC with petroleum ether–EtOAc (v/v, 25:1 to 1:1), then further purified by HPLC (C18 column, MeOH–H2O v/v, 70:30; flow rate 4.0 mL/min; UV detection at 200, 240 nm) to get compound 6 (15.0 mg), 9 (12.0 mg), 3 (36.4 mg).
(5R,6S,8R,11R)-10(1→5)abeo-11-hydroxy-ziza-1(2)-en-3-one (1): colorless bulk crystals (MeOH); +98 (c 0.11, MeOH); UV (MeOH) λmax: 246 nm; ECD (6.65 × 10⁻⁴ M, MeOH) λmax (Δε): 315 (+1.39), 251 (+2.05), 216 (−5.69) nm; IR (KBr) νmax: 3441, 2964, 2914, 2875, 1682, 1650, 1442, 1406, 1287, 1093, 1050, 961 cm−1; 1H and 13C NMR data see Table 1 and Table 2; HRESIMS m/z 257.1513 [M + Na]+ (calcd. for C15H22NaO2 257.1512).
(1S*,2R*,8S*,11R*)-11(1→5)abeo-ziza-5(6)-en-1,12-diol (2): colorless bulk crystals (MeOH); +35 (c 0.12, MeOH); UV (MeOH) λmax: 216 nm. IR (KBr) νmax: 3425, 2956, 1617, 1450, 1397, 1090, 1024, 803 cm−1; 1H and 13C NMR data see Table 1 and Table 2; HRESIMS m/z: 259.1672 [M + Na]+ (calcd. for C15H24NaO2, 259.1669).
(1S,2S,4S,6R,8R,11R)-agarozizone (3): colorless oil; +24 (c 0.05, CH3OH); UV (MeOH) λmax: 204 nm. ECD (7.99 × 10⁻⁴ M, MeOH) λmax (Δε): 296 (−2.00), 207 (−0.29) nm; IR (KBr) νmax: 2954, 2924, 1701, 1635, 1399, 1185, 1104, 1027, 799 cm−1; 1H and 13C NMR data see Table 1 and Table 2; HRESIMS m/z: 273.1471 [M + Na]+ (calcd. for C15H22NaO3, 273.1461).
(1R,2S,8S)-12-hydroxy-ziza-5(6)-en-4-one (4): colorless bulk crystals (MeOH); +101 (c 0.16, CH3OH); UV (MeOH) λmax: 261 nm; ECD (8.53 × 10⁻⁴ M, MeOH) λmax (Δε): 348 (+1.37), 260 (−3.15), 214sh (+4.51) nm; IR (KBr) νmax: 3423, 2960, 1701, 1615, 1406, 1202, 1030, 794 cm−1; 1H and 13C NMR data see Table 3 and Table 4; HRESIMS m/z 257.1512 [M + Na]+ (calcd. for C15H22NaO2 257.1512).
(1R,2S,8R,11R)-11,12-dihydroxy-ziza-5(6)-en-4-one (5): colorless oil; +83 (c 0.04, CH3OH). UV (MeOH) λmax: 259 nm; ECD (7.99 × 10⁻⁴ M, MeOH) λmax (Δε): 349 (+1.67), 234 (−0.66) nm; IR (KBr) νmax: 3414, 3210, 2957, 1626, 1398, 1099, 1029, 800 cm−1; 1H and 13C NMR data see Table 3 and Table 4; HRESIMS m/z 273.1459 [M + Na]+ (calcd. for C15H22NaO3 273.1461).
(1R,2S,8R,11R)-ziza-5(6)-en-11,12-diol (6): white amorphous powder; –12 (c 0.27, CH3OH); UV (MeOH) λmax: 205 nm; IR (KBr) νmax: 3203, 2938, 1638, 1400, 1033, 794 cm−1; 1H and 13C NMR data see Table 3 and Table 4; HRESIMS m/z 259.1674 [M + Na]+ (calcd. for C15H24NaO2 259.1669).
(1R,2S,4S,8S)-4-methoxy-ziza-5(6)-en-12-ol (7): colorless oil; +40 (c 0.18, CH3OH); UV (MeOH) λmax: 210, 260 nm; IR (KBr) νmax: 3421, 2957, 1702, 1617, 1453, 1373, 1200, 1071, 1028, 805 cm−1; 1H and 13C NMR data see Table 3 and Table 4; HRESIMS m/z 273.1817 [M+Na]+ (calcd. for C16H26NaO2 273.1825).
3.4. Computational Methods
Mixed torsional/low-mode conformational searches were carried out by means of the Macromodel 10.8.011 software using the MMFF with an implicit solvent model for CHCl3 applying a 21 kJ/mol energy window [15]. Geometry reoptimizations of the resultant conformers [B3LYP/6-31+G(d,p) level in vacuo, CAM-B3LYP/TZVP with PCM solvent model for MeOH and SOGGA11-X/TZVP SMD/MeOH] and TDDFT ECD calculations were performed with Gaussian 09 using various functionals (B3LYP, BH&HLYP, CAM-B3LYP, PBE0) and the TZVP basis set with the same or no solvent model as in the preceding DFT optimization step [16]. ECD spectra were generated as the sum of Gaussians with 2400 and 3000 cm−1 half-height widths, using dipole-velocity-computed rotational strengths [17]. Boltzmann distributions were estimated from the B3LYP, CAM-B3LYP and SOGGA11-X energies. The MOLEKEL program was used for visualization of the results [18].
3.5. Bioactivity Assays
3.5.1. α-Glucosidase Inhibitory Activity Assay
The α-glucosidase inhibitory activity of all isolated compounds was evaluated by the PNPG method in vitro as described previously [3,4]. Acarbose was used as a positive control with an IC50 value of 743.4 ± 3.3 μM.
3.5.2. Anti-Inflammatory Assay
All compounds were evaluated for their inhibitory effects on NO production in LPS-stimulated mouse mononuclear macrophages (RAW264.7) macrophages using the Griess assay as described before [19]. The RAW264.7 cells were purchased from the Stem Cell Bank of the Chinese Academy of Sciences. Each compound was diluted in half by concentration gradients (200 µM, 100 µM, 50 µM, 25 µM, 12.5 µM). Quercetin and indomethacin were used as positive controls with IC50 values of 8.22 ± 0.80 μM and 35.40 ± 1.77 μM, respectively. The effects on cell viability of isolated sesquiterpenes also had been measured using the MTT method.
4. Conclusions
Three novel zizaane derivatives (1–3), together with six zizaane-type sesquiterpenoids (4–9) were identified from ethyl ether extract of agarwood originated from Aquilaria sp., which could be the characteristic chemicals of this kind of agarwood. Their structures were unambiguously elucidated on the basis of HRESIMS data, 1D and 2D NMR and comparison of the experimental and computed ECD spectra. In vitro anti-inflammatory assessment showed that only compound 9 exhibited weak anti-inflammatory activity with an IC50 value of 62.22 ± 1.27 μM.
Supplementary Materials
The following supporting information can be downloaded. HRESIMS and NMR spectra for compounds 1–9, and low-energy conformers of compounds 1, 3 and 4 are available online.
Author Contributions
J.-Z.Y., H.W., Y.-L.Y. and W.L. performed the isolation and structure elucidation of the compounds. J.-Z.Y., L.Y., A.M. and T.K. contributed to the interpretation of the spectra and also part of the preparation of the manuscript. H.-F.D., C.-H.C. and H.-Q.C. partially contributed the structure elucidation, analyzed the data and together with W.-H.D. prepared the manuscript. W.-L.M. planned, designed and organized the whole research of this study. All authors have read and agreed to the published version of the manuscript.
Funding
This research was financially supported by the Key Research and Development Project of Hainan Province (ZDYF2020160), China Agriculture Research System (CARS-21), the Key Research and Development Project of China (2018YFC1706404). T.K. was supported by the National Research, Development and Innovation Office (K120181) and A.M. by the János Bolyai Research Scholarship of the Hungarian Academy of Sciences. The Governmental Information-Technology Development Agency (KIFU) is acknowledged for CPU time.
Conflicts of Interest
The authors declare no conflict of interest.
Sample Availability
Not available.
References
- Li, W.; Chen, H.Q.; Wang, H.; Mei, W.L.; Dai, H.F. Natural products in agarwood and Aquilaria plants: Chemistry, biological activities and biosynthesis. Nat. Prod. Rep. 2021, 38, 528–565. [Google Scholar] [CrossRef]
- Naef, R. The volatile and semi-volatile constituents of agarwood, the infected heartwood of Aquilaria species: A review. Flavour. Fragr. J. 2011, 26, 73–87. [Google Scholar] [CrossRef]
- Yang, Y.L.; Li, W.; Wang, H.; Yang, L.; Yuan, J.Z.; Cai, C.H.; Chen, H.Q.; Dong, W.H.; Ding, X.P.; Jiang, B.; et al. New tricyclic prezizaane sesquiterpenoids from agarwood. Fitoterapia 2019, 138, 104301. [Google Scholar] [CrossRef] [PubMed]
- Yang, L.; Yang, Y.L.; Dong, W.H.; Li, W.; Wang, P.; Cao, X.; Yuan, J.Z.; Chen, H.Q.; Mei, W.L.; Dai, H.F. Sesquiterpenoids and 2-(2-phenylethyl) chromones respectively acting as α-glucosidase and tyrosinase inhibitors from agarwood of an Aquilaria plant. J. Enzyme Inhib. Med. Chem. 2019, 34, 853–862. [Google Scholar] [CrossRef] [PubMed] [Green Version]
- Li, W.; Yang, Y.L.; Yang, L.; Wang, H.; Dong, W.H.; Cai, C.H.; Yuan, J.Z.; Jiang, B.; Mei, W.L.; Dai, H.F. New sesquiterpenoids bearing 11-methyl ester group of agarwood. Fitoterapia 2020, 143, 104557. [Google Scholar] [CrossRef]
- Zhao, B.; Lin, X.; Lei, L.; Lamb, D.C.; Kelly, S.L.; Waterman, M.R.; Cane, D.E. Biosynthesis of the sesquiterpene antibiotic albaflavenone in Streptomyces coelicolor A3 (2). J. Biol. Chem. 2008, 283, 8183–8189. [Google Scholar] [CrossRef] [Green Version]
- Pescitelli, G.; Bruhn, T. Good computational practice in the assignment of absolute configurations by TDDFT calculations of ECD spectra. Chirality 2016, 28, 466–474. [Google Scholar] [CrossRef] [PubMed] [Green Version]
- Mándi, A.; Kurtán, T. Applications of OR/ECD/VCD to the structure elucidation of natural products. Nat. Prod. Rep. 2019, 36, 889–918. [Google Scholar] [CrossRef] [PubMed]
- Sun, P.; Xu, D.X.; Mándi, A.; Kurtán, T.; Li, T.J.; Schulz, B.; Zhang, W. Structure, absolute configuration, and conformational study of 12-membered macrolides from the fungus Dendrodochium sp. associated with the sea cucumber Holothuria nobilis Selenka. J. Org. Chem. 2013, 78, 7030–7047. [Google Scholar] [CrossRef] [PubMed]
- Zhou, Y.; Mándi, A.; Debbab, A.; Wray, V.; Schulz, B.; Müller, W.E.G.; Lin, W.H.; Proksch, P.; Kurtán, T.; Aly, A.H. New austalides from the sponge-associated fungus Aspergillus sp. Eur. J. Org. Chem. 2011, 2011, 6009–6019. [Google Scholar] [CrossRef] [Green Version]
- Peverati, R.; Truhlar, D.G.J. Communication: A global hybrid generalized gradient approximation to the exchange-correlation functional that satisfies the second-order density-gradient constraint and has broad applicability in chemistry. J. Chem. Phys. 2011, 135, 191102. [Google Scholar] [CrossRef] [PubMed]
- Savarese, M.É.; Su, N.Q.; Pérez-Jiménez, Á.J.; Xu, X.; Sancho-García, J.C.; Adamo, C. Benchmarking density functionals on structural parameters of small-/medium-sized organic molecules. J. Chem. Theory Comput. 2016, 12, 459–465. [Google Scholar]
- Lin, X.; Cane, D.E. Biosynthesis of the sesquiterpene antibiotic albaflavenone in Streptomyces coelicolor. Mechanism and stereochemistry of the enzymatic formation of epi-isozizaene. J. Am. Chem. Soc. 2009, 131, 6332–6333. [Google Scholar] [CrossRef] [PubMed] [Green Version]
- Lin, X.; Hopson, R.; Cane, D.E. Genome mining in Streptomyces coelicolor: Molecular cloning and characterization of a new sesquiterpene synthase. J. Am. Chem. Soc. 2006, 128, 6022–6023. [Google Scholar] [CrossRef] [PubMed] [Green Version]
- MacroModel, Schrödinger, LLC. 2015. Available online: http://www.schrodinger.com/MacroModel (accessed on 3 March 2020).
- Frisch, M.J.; Trucks, G.W.; Schlegel, H.B.; Scuseria, G.E.; Robb, M.A.; Cheeseman, J.R.; Scalmani, G.; Barone, V.; Mennucci, B.; Petersson, G.A. Gaussian 09, Revision E.01; Gaussian, Inc.: Wallingford, CT, USA, 2013. [Google Scholar]
- Stephens, P.J.; Harada, N. ECD cotton effect approximated by the Gaussian curve and other methods. Chirality 2010, 22, 229–233. [Google Scholar] [CrossRef] [PubMed]
- Varetto, U. MOLEKEL 5.4; Swiss National Supercomputing Centre: Manno, Switzerland, 2009. [Google Scholar]
- Liu, F.Z.; Wang, H.; Li, W.; Yang, L.; Yang, J.L.; Yuan, J.Z.; Wei, Y.M.; Jiang, B.; Mei, W.L.; Dai, H.F. Filarones A and B, new anti-inflammatory dimeric 2-(2-phenethyl) chromones from agarwood of Aquilaria filaria. Phytochem. Lett. 2021, 46, 11–14. [Google Scholar] [CrossRef]

Publisher’s Note: MDPI stays neutral with regard to jurisdictional claims in published maps and institutional affiliations. |
© 2021 by the authors. Licensee MDPI, Basel, Switzerland. This article is an open access article distributed under the terms and conditions of the Creative Commons Attribution (CC BY) license (https://creativecommons.org/licenses/by/4.0/).