
Depolarization Ratio of the ν1 Raman Band of Pure CH4 and Perturbed by N2 and CO2


Abstract
:1. Introduction
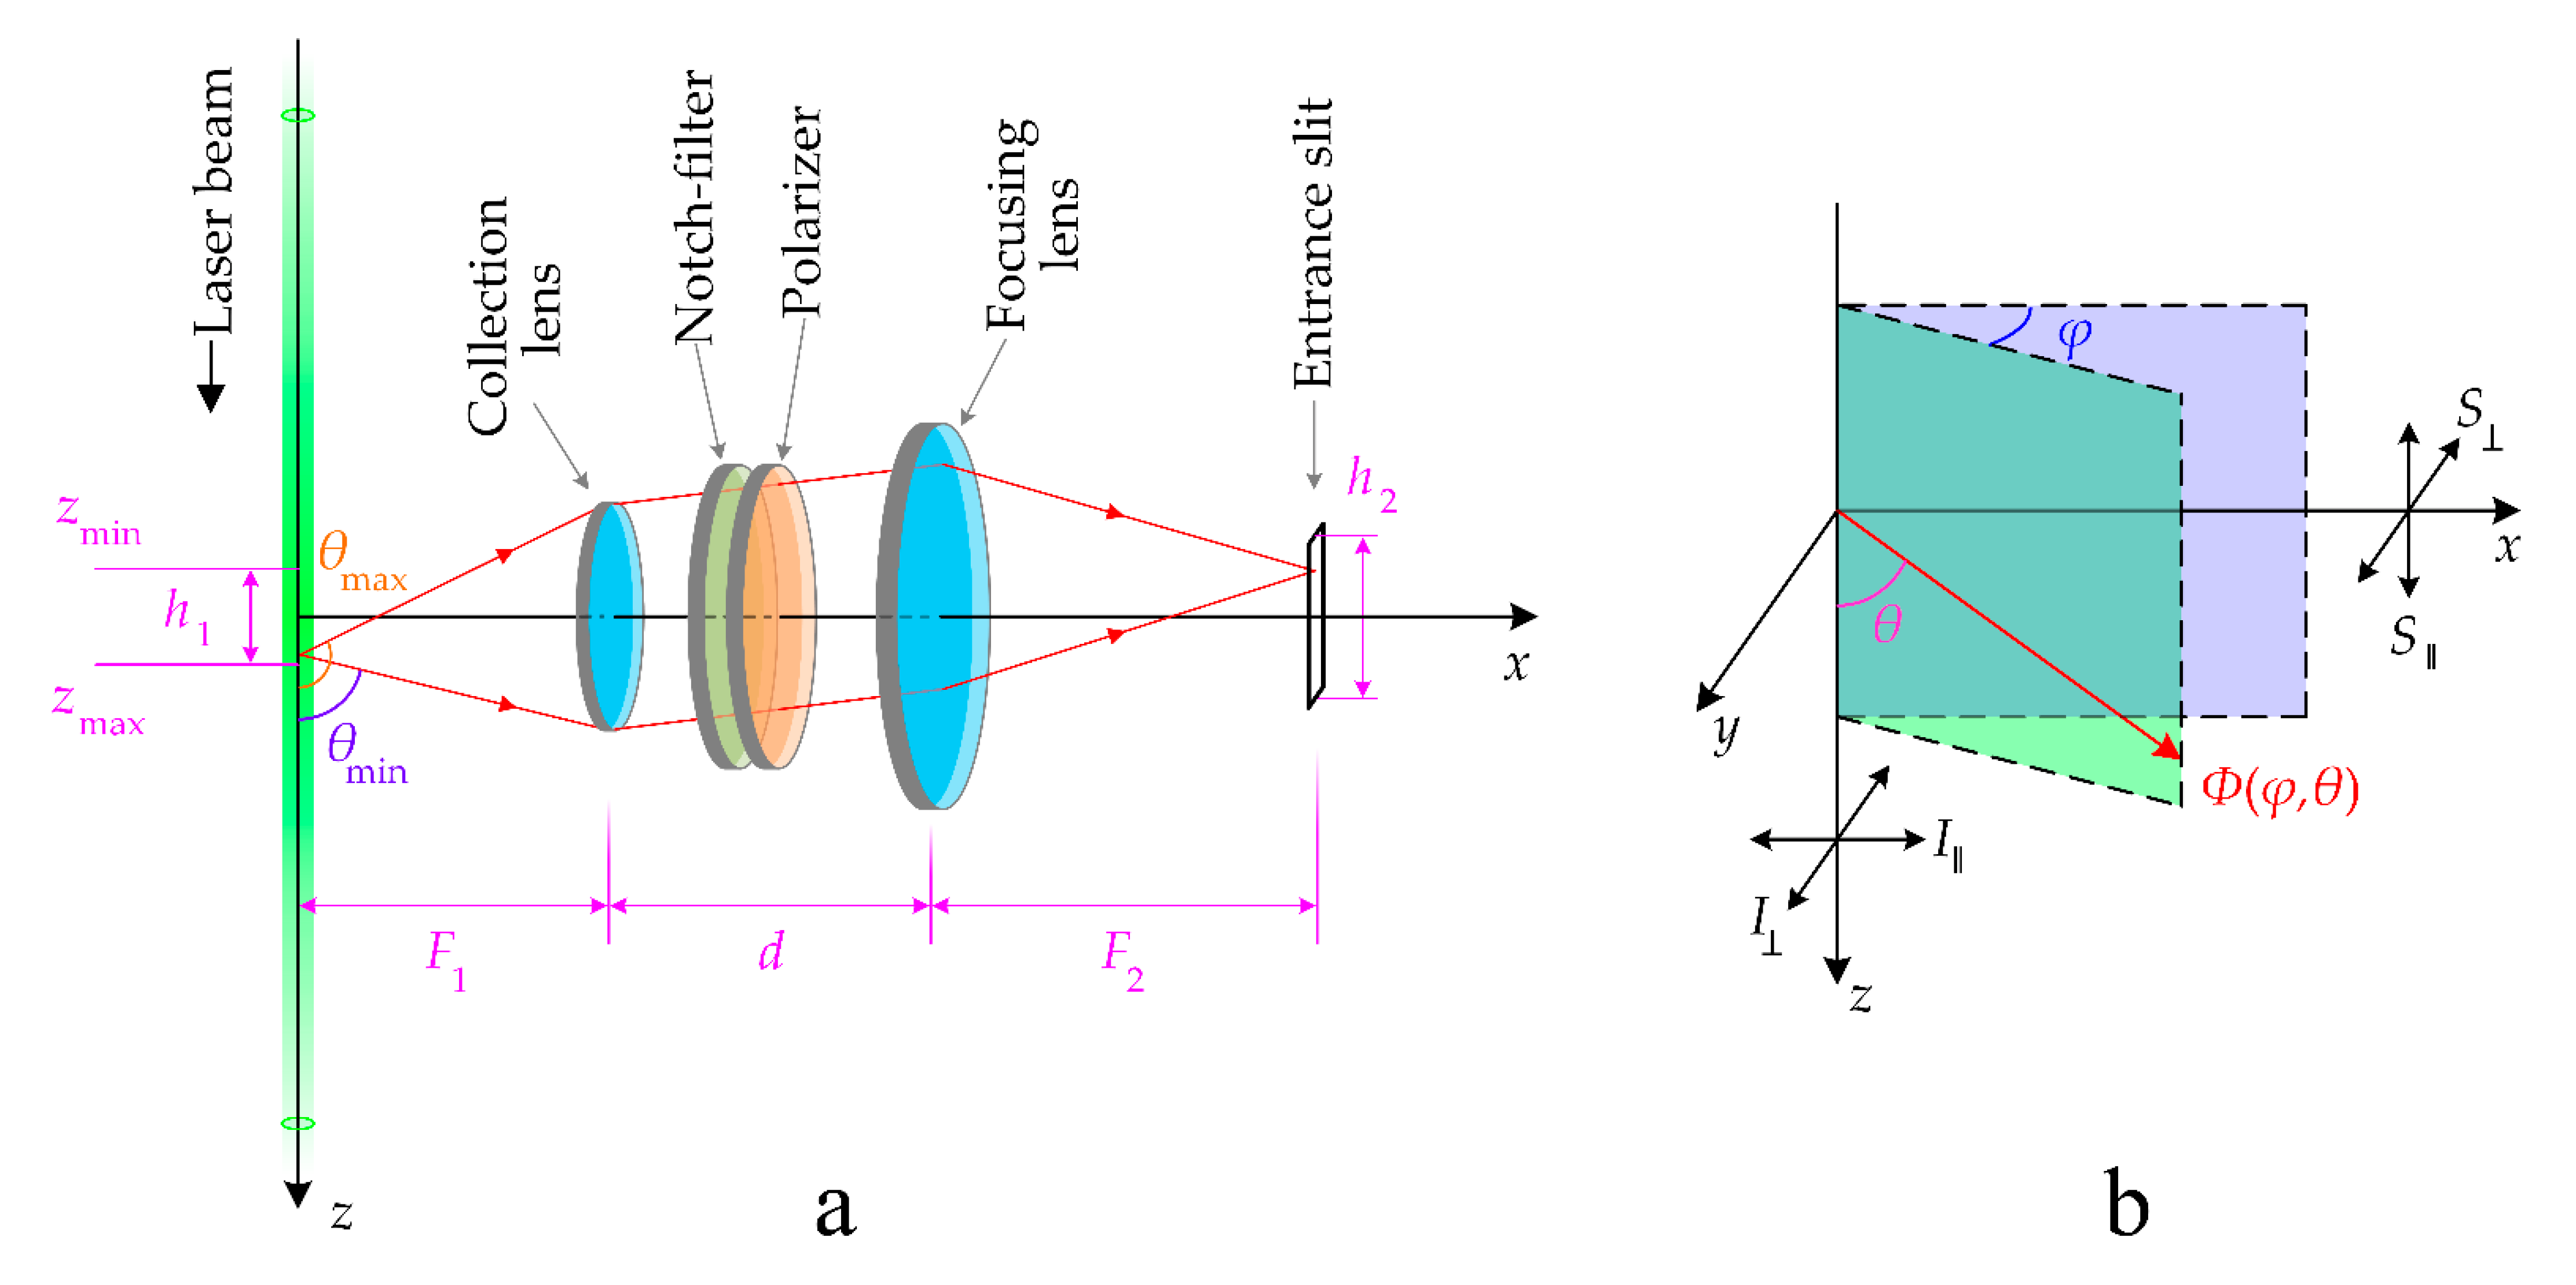
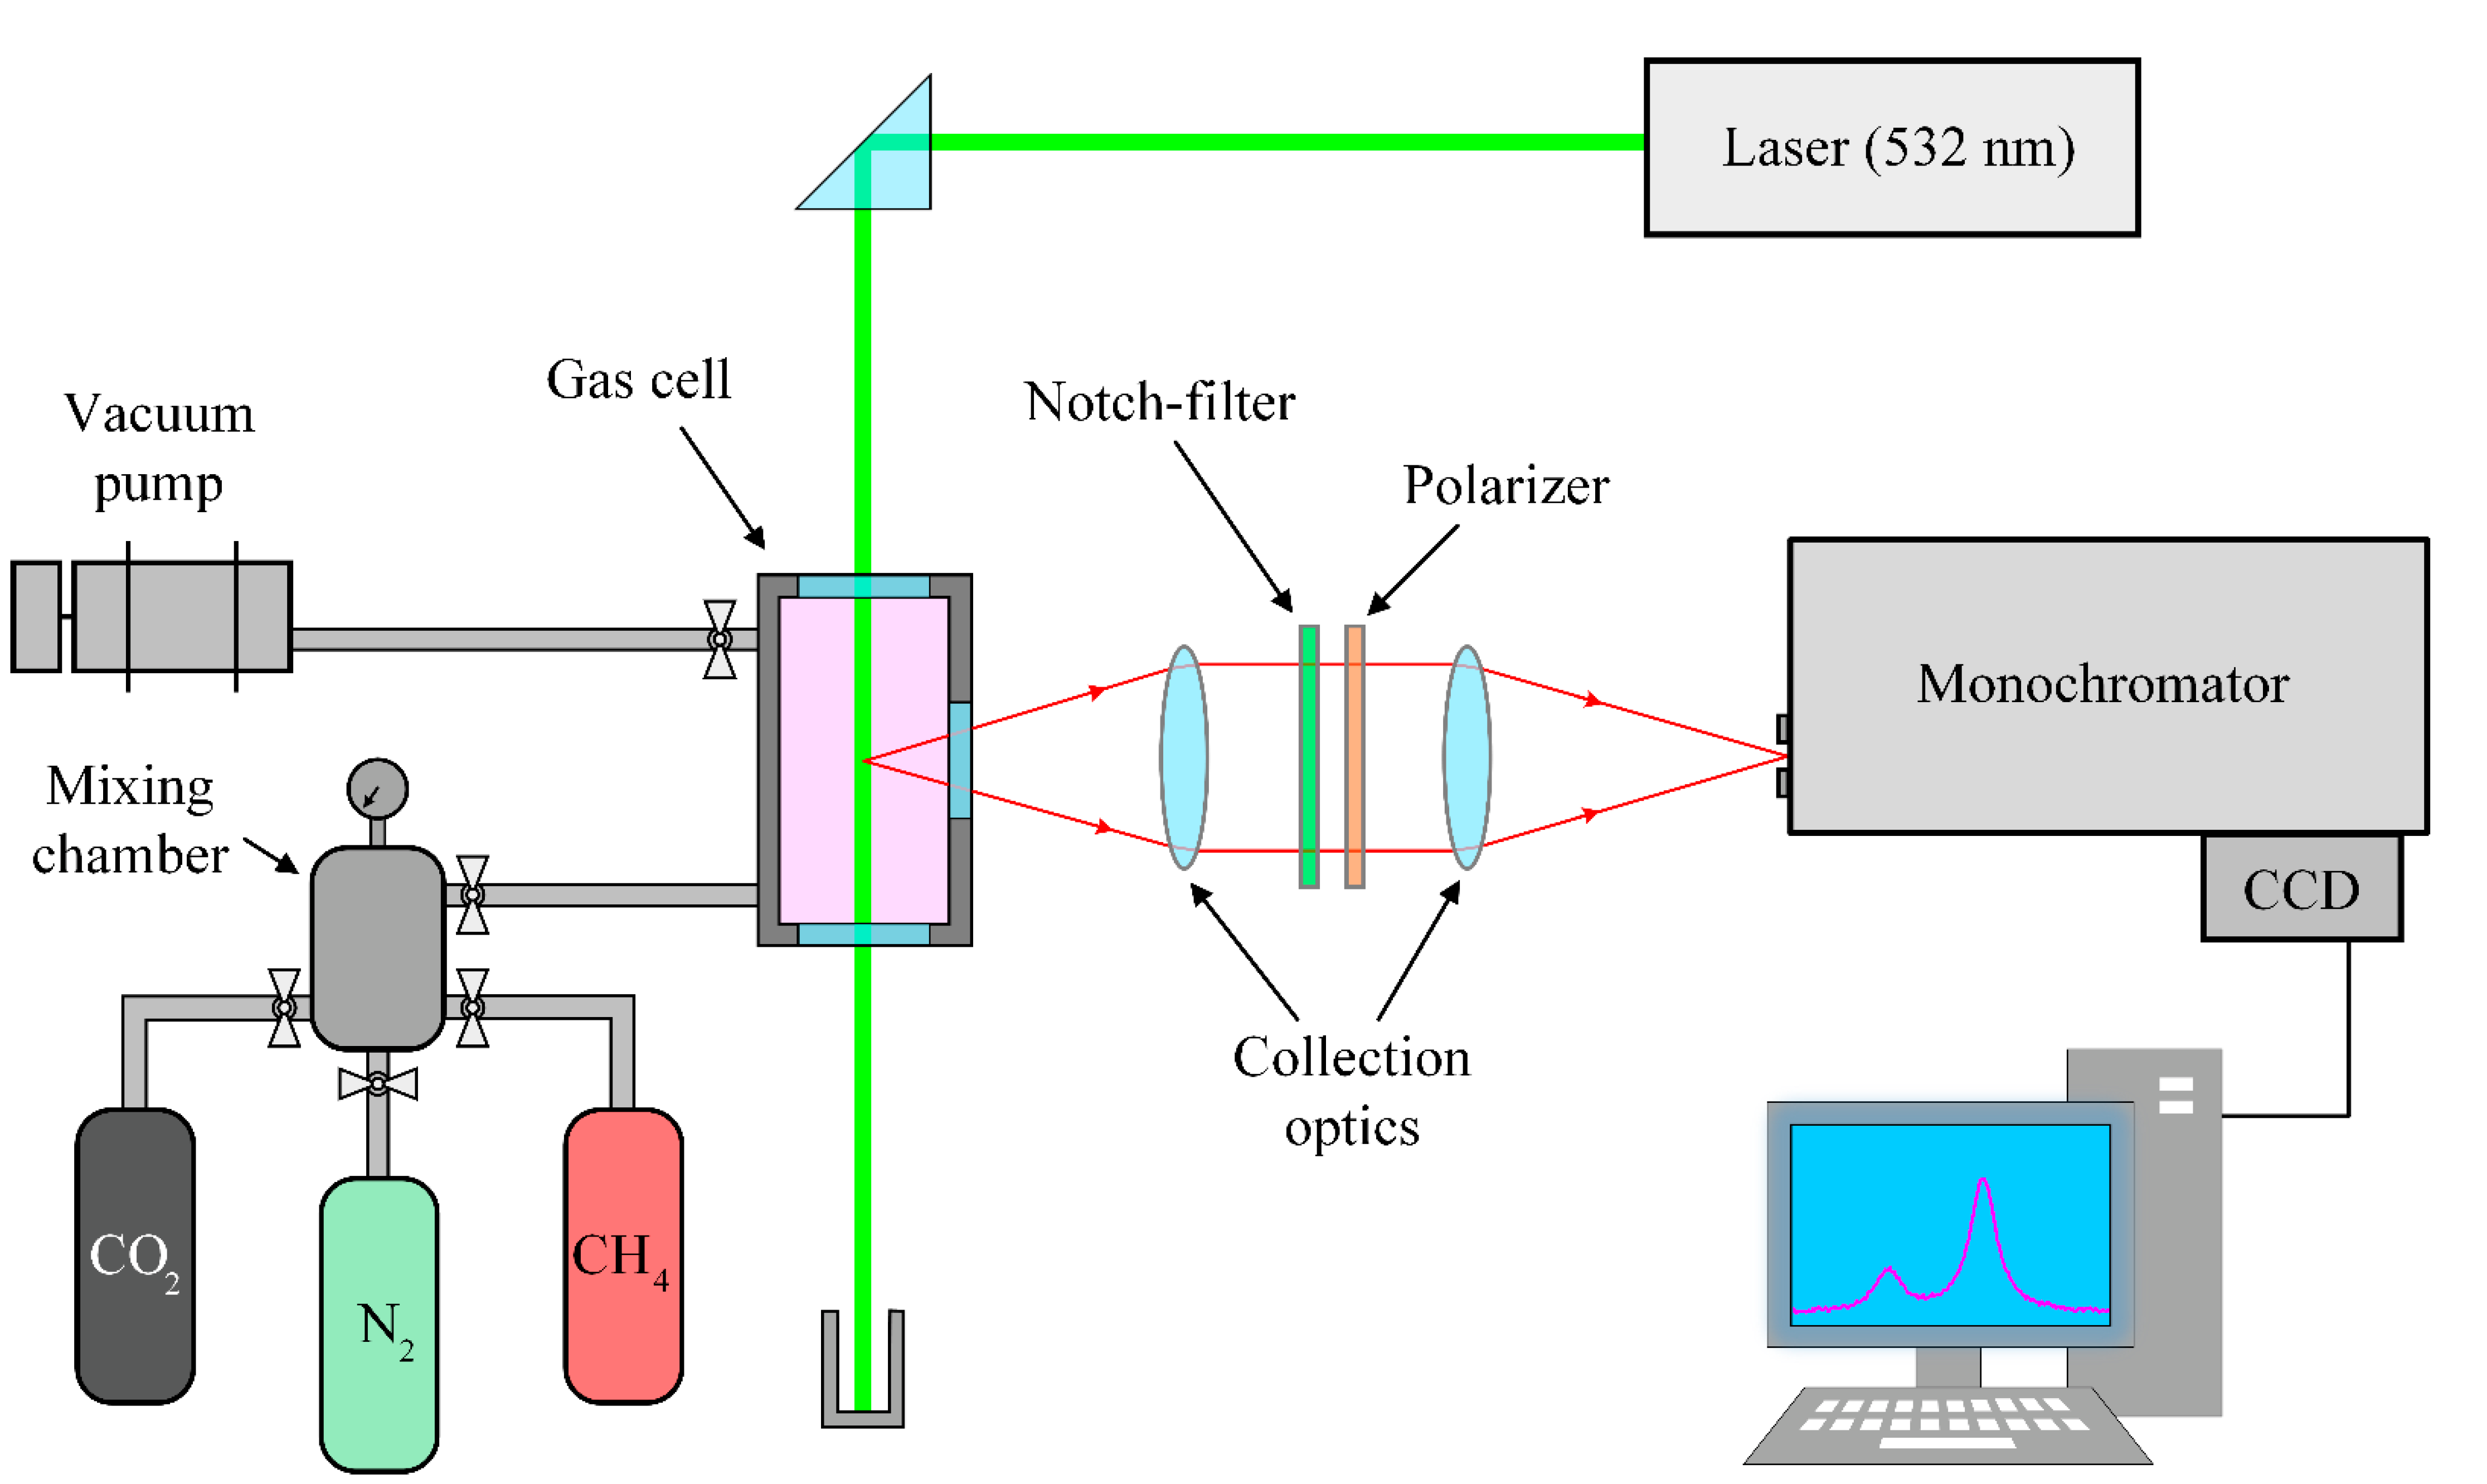
2. Methods
3. Results and Discussion
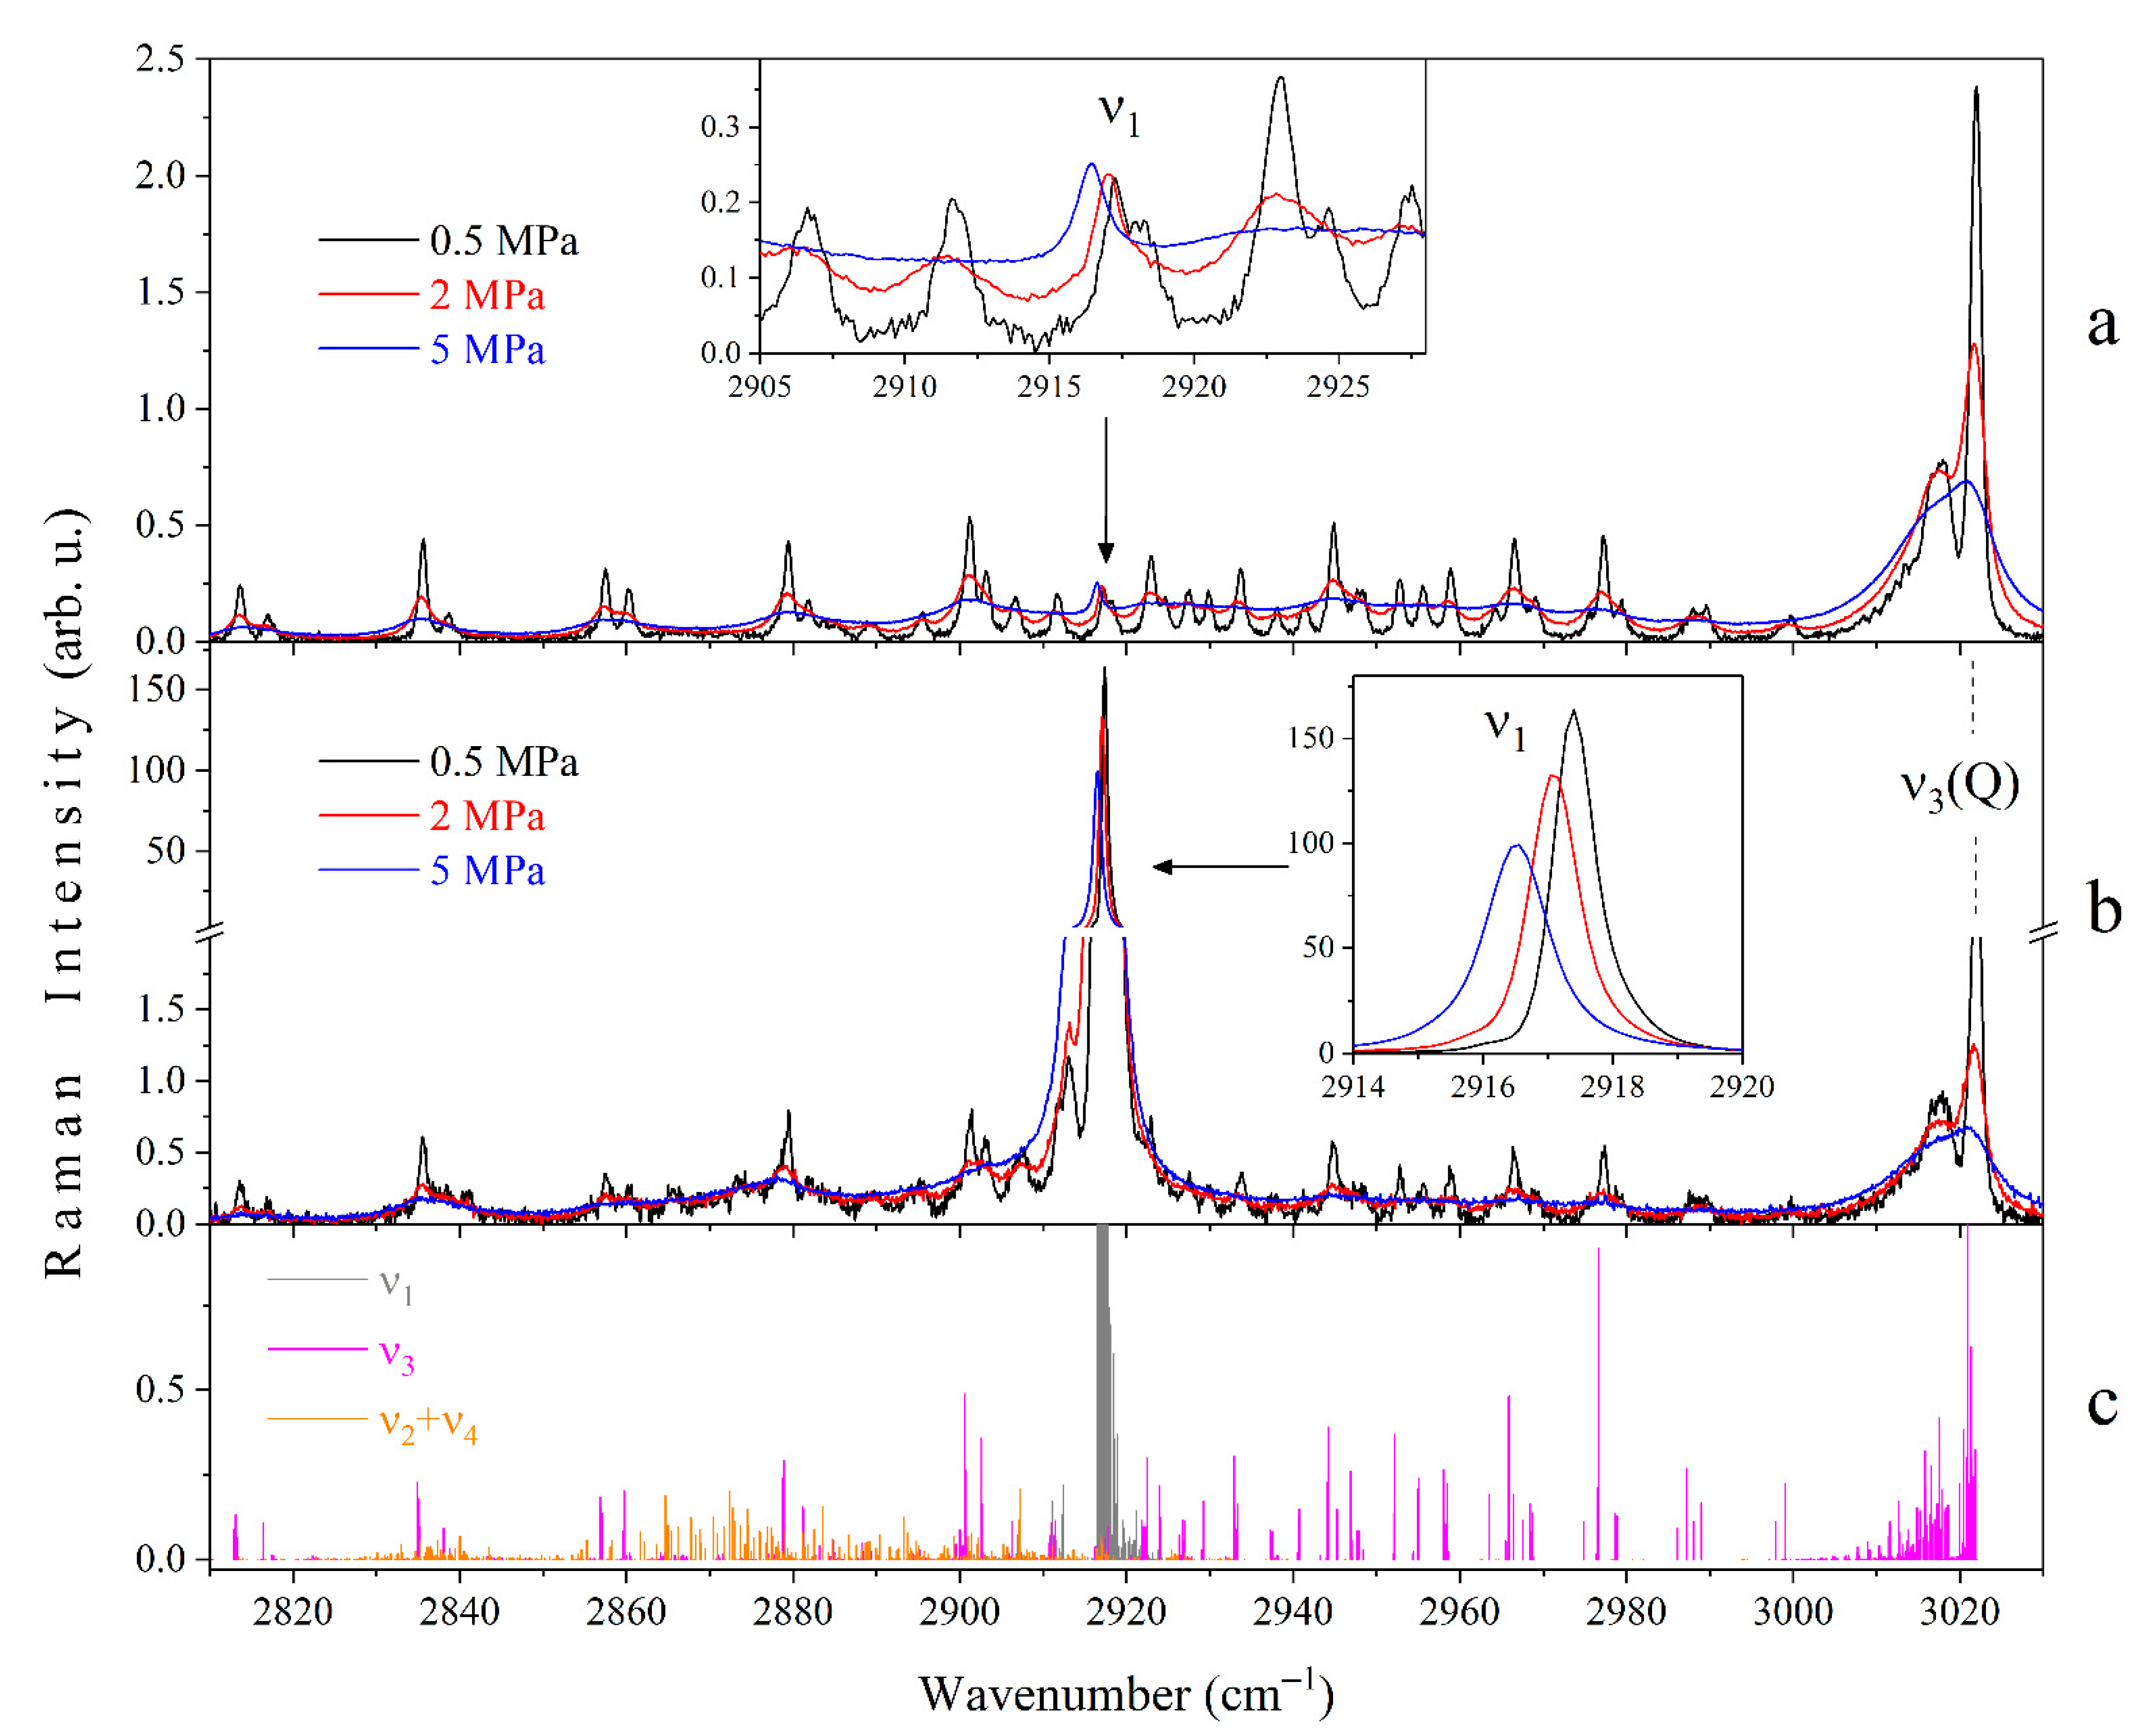
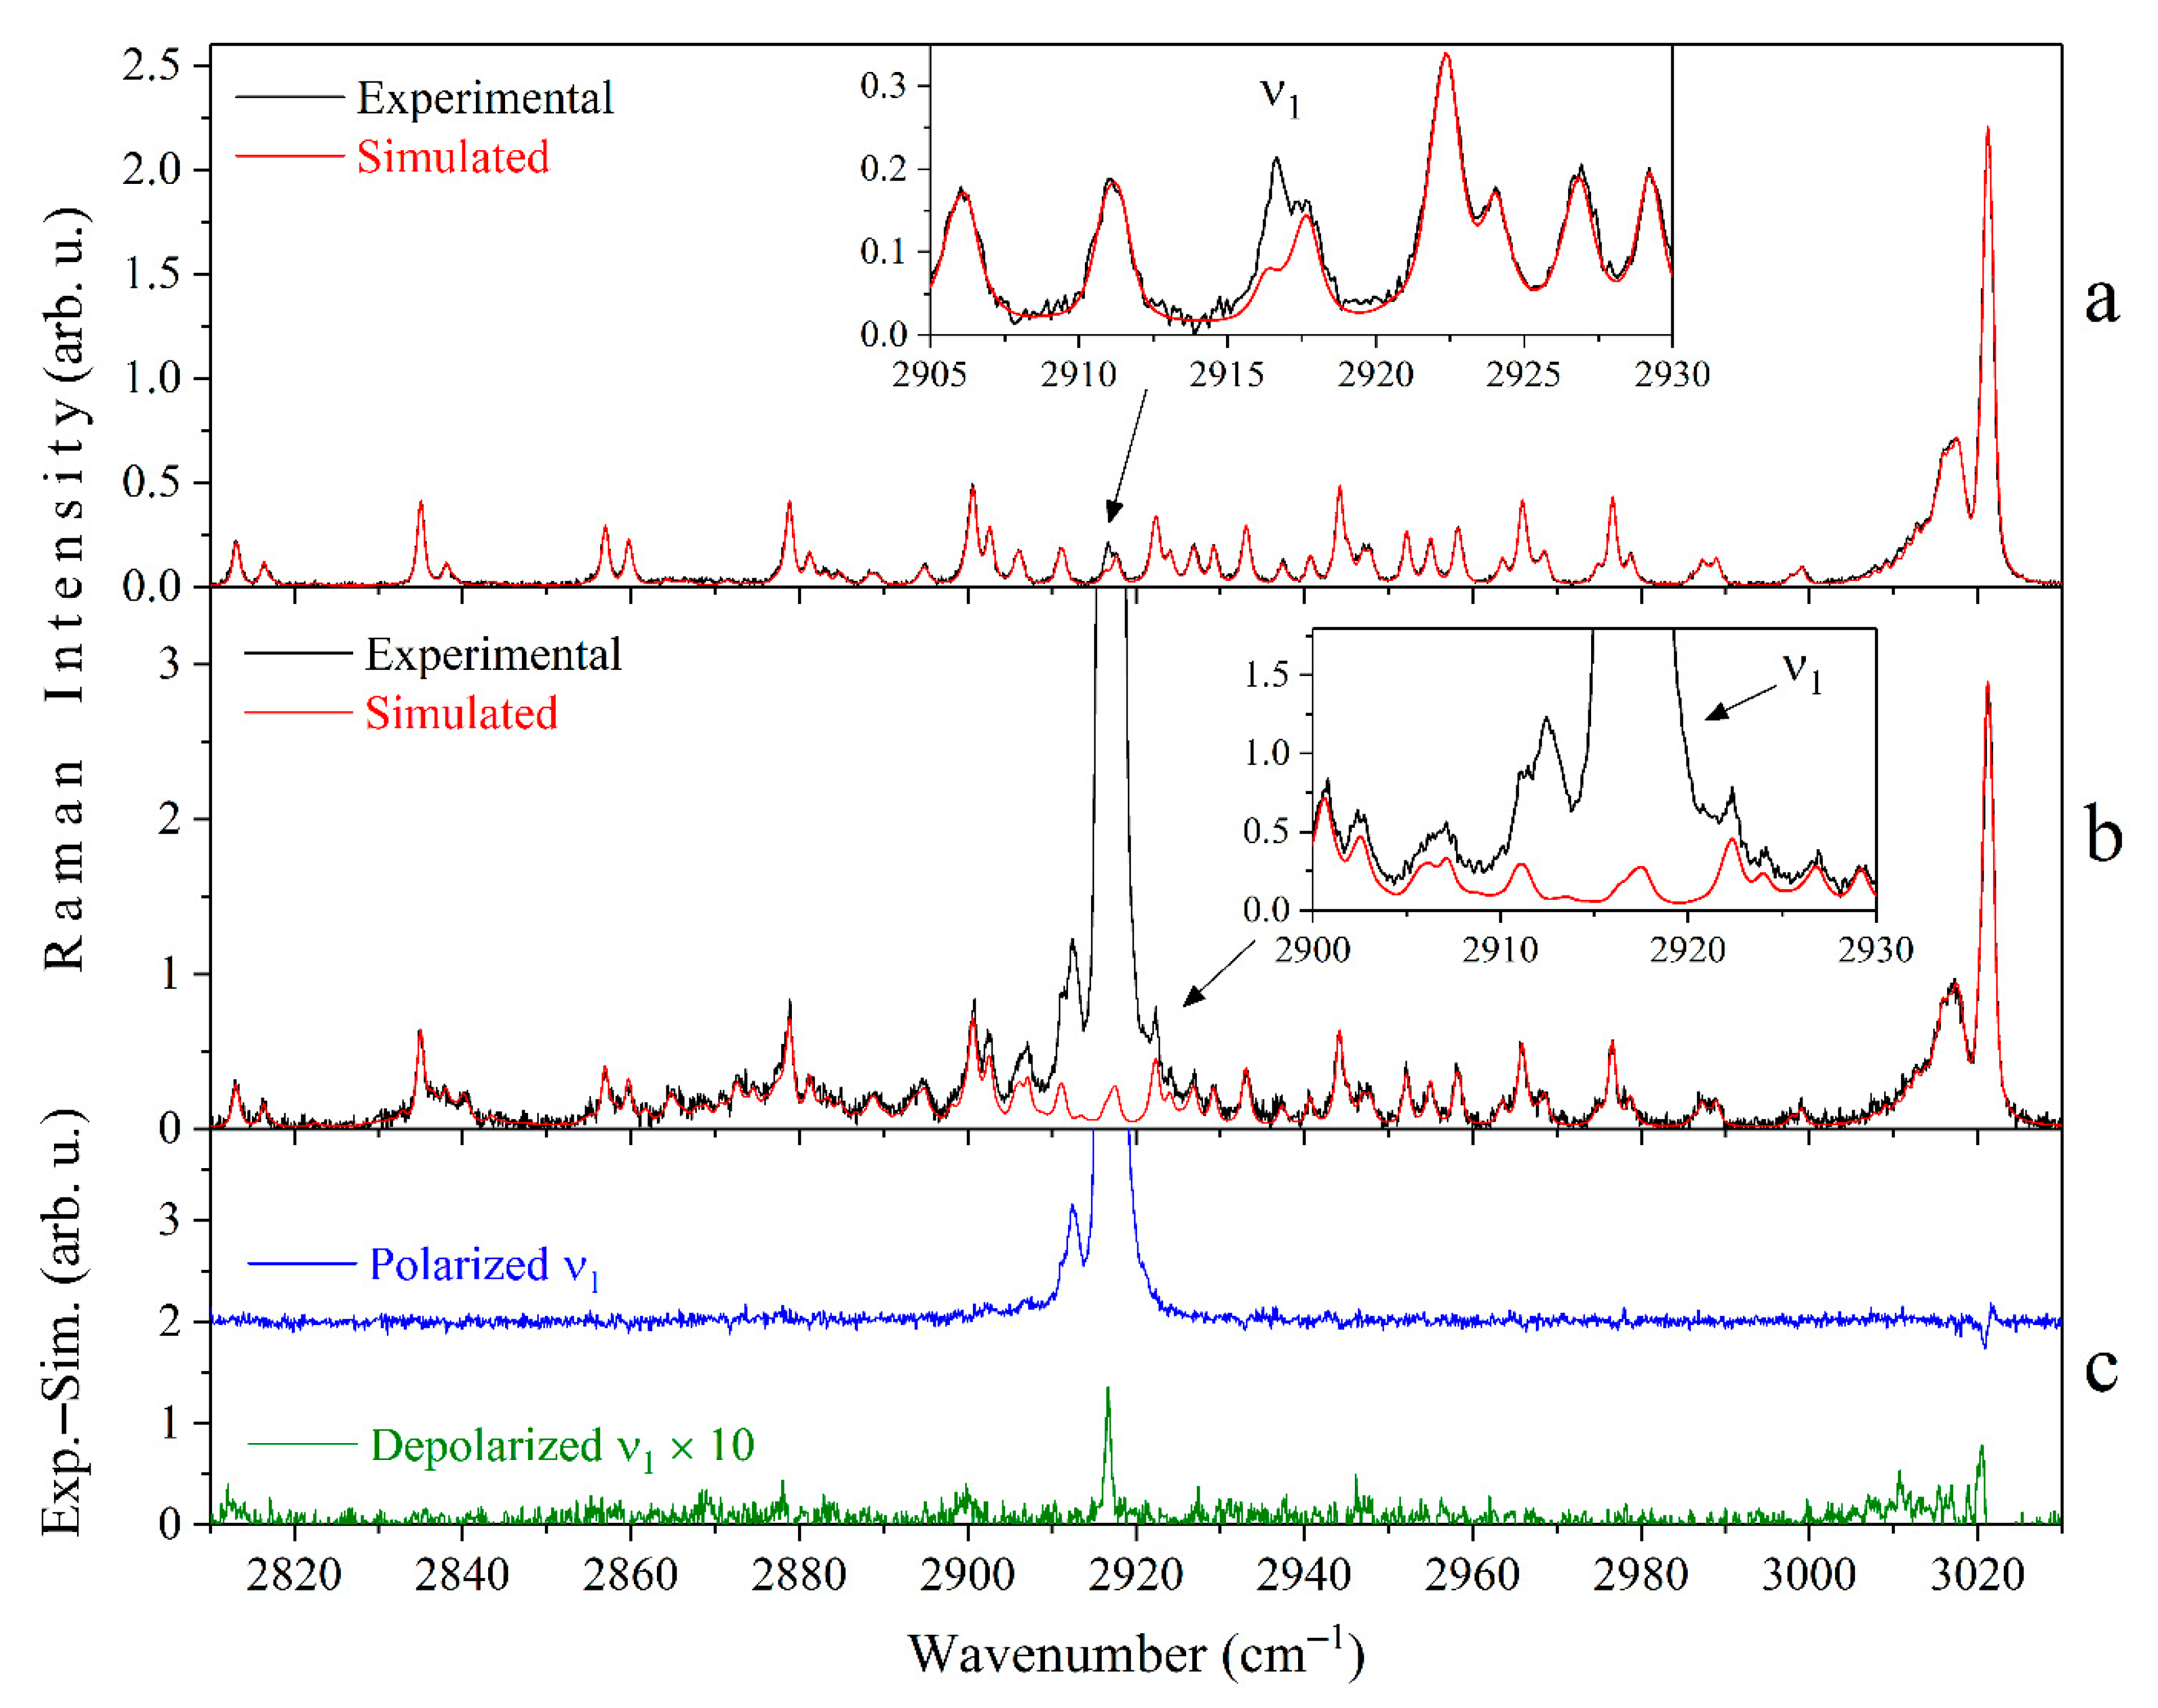
3.1. Raman Spectra of Methane
3.2. Measurement Procedure
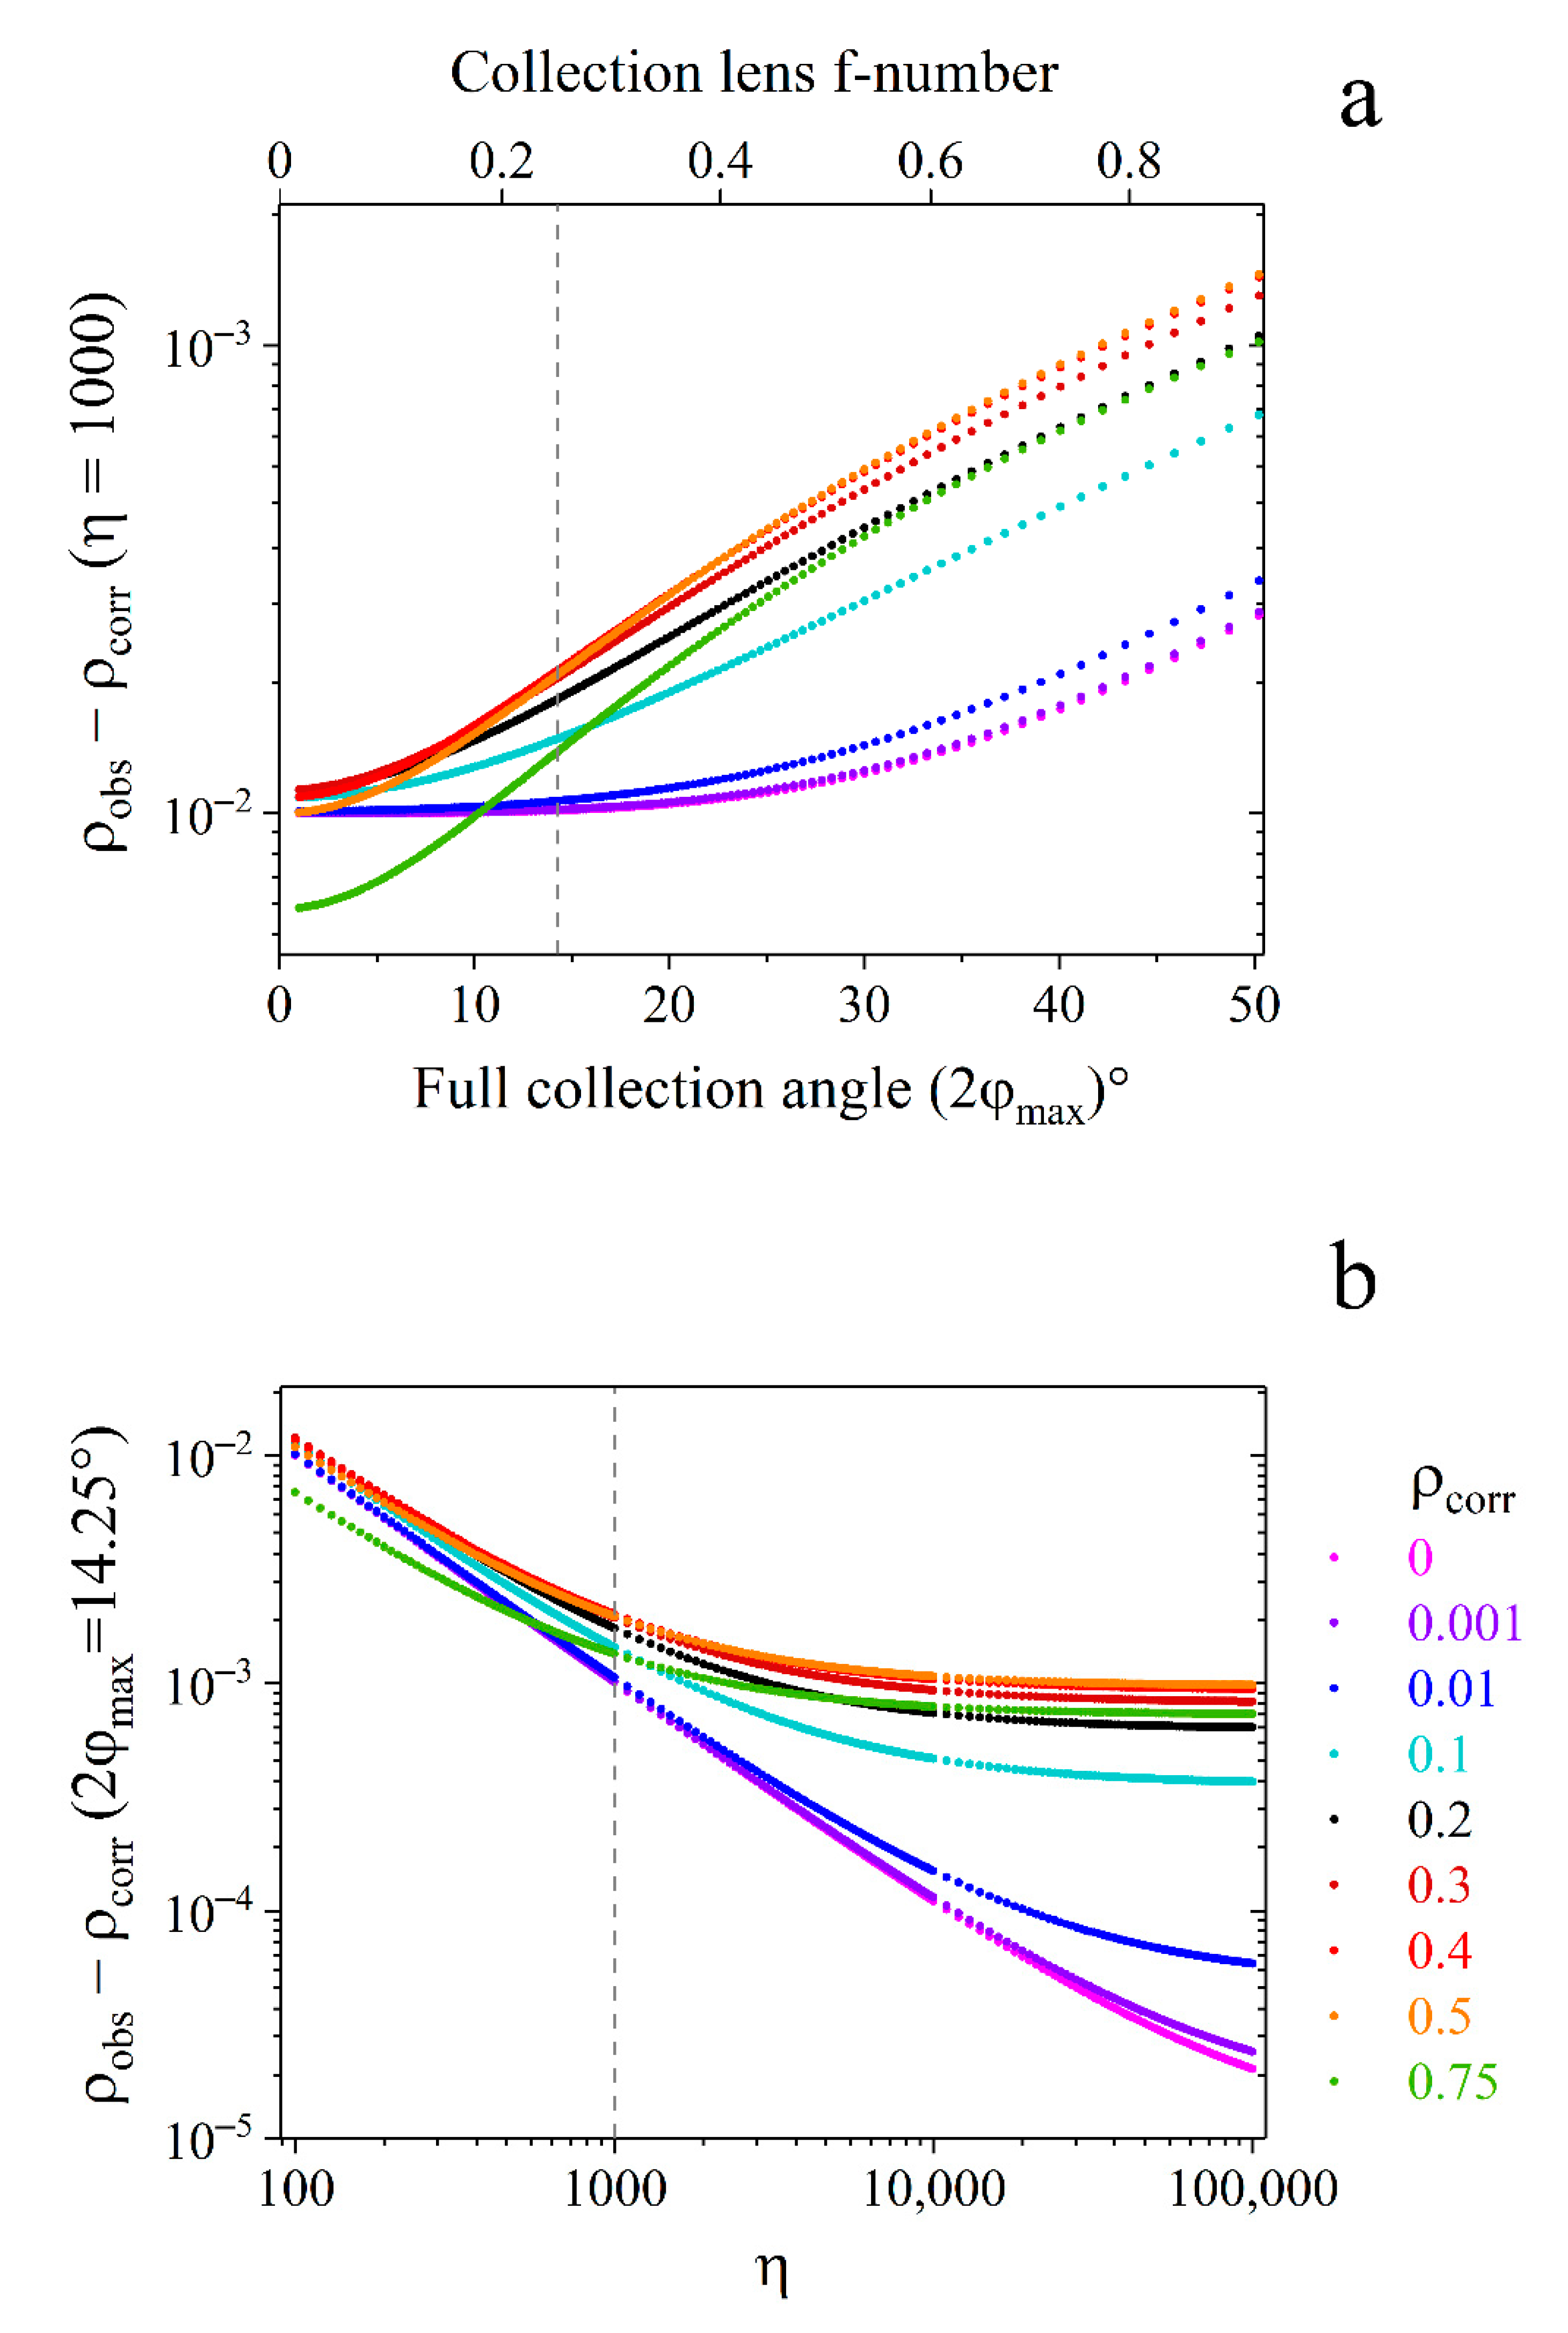
3.3. Uncertainty Evaluation
4. Conclusions
Author Contributions
Funding
Institutional Review Board Statement
Informed Consent Statement
Data Availability Statement
Conflicts of Interest
Sample Availability
Appendix A
References
- Petrov, D.V. Multipass optical system for a Raman gas spectrometer. Appl. Opt. 2016, 55, 9521–9525. [Google Scholar] [CrossRef]
- Yang, D.; Guo, J.; Liu, Q.; Luo, Z.; Yan, J.; Zheng, R. Highly sensitive Raman system for dissolved gas analysis in water. Appl. Opt. 2016, 55, 7744–7748. [Google Scholar] [CrossRef] [PubMed]
- Wen, C.; Huang, X.; Shen, C. Multiple-pass enhanced Raman spectroscopy for fast industrial trace gas detection and process control. J. Raman Spectrosc. 2020, 51, 781–787. [Google Scholar] [CrossRef]
- Guo, J.; Luo, Z.; Liu, Q.; Yang, D.; Dong, H.; Huang, S.; Kong, A.; Wu, L. High-Sensitivity Raman Gas Probe for In Situ Multi-component Gas Detection. Sensors 2021, 21, 3539. [Google Scholar] [CrossRef]
- Hanf, S.; Keiner, R.; Yan, D.; Popp, J.; Frosch, T. Fiber-Enhanced Raman Multigas Spectroscopy: A Versatile Tool for Environmental Gas Sensing and Breath Analysis. Anal. Chem. 2014, 86, 5278–5285. [Google Scholar] [CrossRef]
- Knebl, A.; Yan, D.; Popp, J.; Frosch, T. Fiber enhanced Raman gas spectroscopy. Trends Anal. Chem. 2018, 103, 230–238. [Google Scholar] [CrossRef]
- Sieburg, A.; Knebl, A.; Jacob, J.M.; Frosch, T. Characterization of fuel gases with fiber-enhanced Raman spectroscopy. Anal. Bioanal. Chem. 2019, 411, 7399–7408. [Google Scholar] [CrossRef]
- Knebl, A.; Domes, R.; Yan, D.; Popp, J.; Trumbore, S.; Frosch, T. Fiber-Enhanced Raman Gas Spectroscopy for 18O–13C-Labeling Experiments. Anal. Chem. 2019, 91, 7562–7569. [Google Scholar] [CrossRef]
- Buldakov, M.A.; Matrosov, I.I.; Petrov, D.V.; Tikhomirov, A.A. Raman gas-analyzer for analyzing environmental and technogenic gas media. Atmos. Ocean. Opt. 2012, 25, 298–303. [Google Scholar] [CrossRef]
- Petrov, D.V.; Matrosov, I.I.; Zaripov, A.R. Determination of atmospheric carbon dioxide concentration using Raman spectroscopy. J. Mol. Spectrosc. 2018, 348, 137–141. [Google Scholar] [CrossRef]
- Petrov, D.V.; Matrosov, I.I.; Tikhomirov, A.A. High-Sensitivity Spontaneous Raman Spectrometer for Gaseous Media. J. Appl. Spectrosc. 2015, 82, 120–124. [Google Scholar] [CrossRef]
- Petrov, D.V.; Matrosov, I.I.; Kostenko, M.A. Possibilities of measuring the exhaled air composition using Raman spectroscopy. Quantum Electron. 2021, 51, 389–392. [Google Scholar] [CrossRef]
- Chow, K.K.; Short, M.; Lam, S.; McWilliams, A.; Zeng, H. A Raman cell based on hollow core photonic crystal fiber for human breath analysis. Med. Phys. 2014, 41, 1–9. [Google Scholar] [CrossRef] [PubMed]
- Keiner, R.; Frosch, T.; Massad, T.; Trumbore, S.; Popp, J. Enhanced Raman multigas sensing—A novel tool for control and analysis of 13CO2 labeling experiments in environmental research. Analyst 2014, 139, 3879–3884. [Google Scholar] [CrossRef] [PubMed] [Green Version]
- Velez, J.G.; Muller, A. Trace gas sensing using diode-pumped collinearly detected spontaneous Raman scattering enhanced by a multipass cell. Opt. Lett. 2020, 45, 133–136. [Google Scholar] [CrossRef]
- Velez, J.S.G.; Muller, A. Spontaneous Raman scattering at trace gas concentrations with a pressurized external multipass cavity. Meas. Sci. Technol. 2021, 32, 1–7. [Google Scholar] [CrossRef]
- Yakovlev, S.; Sadovnikov, S.; Kharchenko, O.; Kravtsova, N. Remote Sensing of Atmospheric Methane with IR OPO Lidar System. Atmosphere 2020, 11, 70. [Google Scholar] [CrossRef] [Green Version]
- Buszewski, B.; Kęsy, M.; Ligor, T.; Amann, A. Human exhaled air analytics: Biomarkers of diseases. Biomed. Chromatogr. 2007, 21, 553–566. [Google Scholar] [CrossRef]
- Mazzatenta, A.; Di Giulio, C.; Pokorski, M. Pathologies currently identified by exhaled biomarkers. Respir. Physiol. Neurobiol. 2013, 187, 128–134. [Google Scholar] [CrossRef]
- Schrötter, H.W.; Klöckner, H.W. Raman Scattering Cross Sections in Gases and Liquids. In Raman Spectroscopy of Gases and Liquids, 1st ed.; Weber, A., Ed.; Springer: Berlin/Heidelberg, Germany, 1979; Volume 11, pp. 123–164. [Google Scholar] [CrossRef]
- Stephenson, D.A. Raman cross sections of selected hydrocarbons and freons. J. Quant. Spectrosc. Radiat. Transf. 1974, 14, 1291–1301. [Google Scholar] [CrossRef]
- Le, V.H.; Tarantola, A.; Caumon, M.C. Interpretation of the pressure-induced Raman frequency shift of the ν1 stretching bands of CH4 and N2 within CH4-CO2, N2-CO2 and CH4-N2 binary mixtures. Phys. Chem. Chem. Phys. 2021, 23, 8767–8777. [Google Scholar] [CrossRef]
- Ridder, M.; Suvernev, A.A.; Dreier, T. Collision effects in nitrogen and methane coherent anti-Stokes Raman isotropic Q-branch spectra at high densities. J. Chem. Phys. 1996, 105, 3376–3386. [Google Scholar] [CrossRef]
- Seitz, J.C.; Pasteris, J.D.; Chou, I.-M. Raman spectroscopic characterization of gas mixtures. I. Quantitative composition and pressure determination of CH4, N2 and their mixtures. Am. J. Sci. 1993, 293, 297–321. [Google Scholar] [CrossRef]
- Seitz, J.C.; Pasteris, J.D.; Chou, I.-M. Raman spectroscopic characterization of gas mixtures. II. Quantitative composition and pressure determination of the CO2-CH4 system. Am. J. Sci. 1996, 296, 577–600. [Google Scholar] [CrossRef]
- Pieroni, D.; Hartmann, J.-M.; Chaussard, F.; Michaut, X.; Gabard, T.; Saint-Loup, R.; Berger, H.; Champion, J.-P. Experimental and theoretical study of line mixing in methane spectra. III. The Q branch of the Raman ν1 band. J. Chem. Phys. 2000, 112, 1335–1343. [Google Scholar] [CrossRef]
- Sublett, D.M.; Sendula, E.; Lamadrid, H.M.; Steele-MacInnis, M.; Spiekermann, G.; Bodnar, R.J. Raman spectral behavior of N2, CO2, and CH4 in N2–CO2–CH4 gas mixtures from 22 °C to 200 °C and 10 to 500 bars, with application to other gas mixtures. J. Raman Spectrosc. 2021, 52, 750–769. [Google Scholar] [CrossRef]
- Sublett, D.M.; Sendula, E.; Lamadrid, H.; Steele-MacInnis, M.; Spiekermann, G.; Burruss, R.C.; Bodnar, R.J. Shift in the Raman symmetric stretching band of N2, CO2, and CH4 as a function of temperature, pressure, and density. J. Raman Spectrosc. 2020, 51, 555–568. [Google Scholar] [CrossRef]
- Petrov, D.V. Pressure dependence of peak positions, half widths, and peak intensities of methane Raman bands (ν2, 2ν4, ν1, ν3, and 2ν2). J. Raman Spectrosc. 2017, 48, 1426–1430. [Google Scholar] [CrossRef]
- Petrov, D.V. Raman spectrum of methane in nitrogen, carbon dioxide, hydrogen, ethane, and propane environments. Spectrochim. Acta—Part A Mol. Biomol. Spectrosc. 2018, 191, 573–578. [Google Scholar] [CrossRef]
- Jourdanneau, E.; Chaussard, F.; Saint-Loup, R.; Gabard, T.; Berger, H. The methane Raman spectrum from 1200 to 5500 cm−1: A first step toward temperature diagnostic using methane as a probe molecule in combustion systems. J. Mol. Spectrosc. 2005, 233, 219–230. [Google Scholar] [CrossRef]
- Jourdanneau, E.; Gabard, T.; Chaussard, F.; Saint-Loup, R.; Berger, H.; Bertseva, E.; Grisch, F. CARS methane spectra: Experiments and simulations for temperature diagnostic purposes. J. Mol. Spectrosc. 2007, 246, 167–179. [Google Scholar] [CrossRef]
- Tanichev, A.S.; Petrov, D.V. Simulation of ν2 Raman band of methane as a function of pressure. J. Raman Spectrosc. 2022, in press. [Google Scholar] [CrossRef]
- Boudon, V.; Champion, J.-P.; Gabard, T.; Loëte, M.; Rotger, M.; Wenger, C. Spherical Top Theory and Molecular Spectra. In Handbook of High-Resolution Spectroscopy, 1st ed.; Quack, M., Merkt, F., Eds.; Wiley: Chichester, UK, 2011; Volume 3, pp. 1437–1460. [Google Scholar] [CrossRef]
- Abbate, S.; Gussoni, M.; Zerbi, G. Raman intensities of methanes from electrooptical parameters. J. Mol. Spectrosc. 1978, 73, 415–429. [Google Scholar] [CrossRef]
- Hyodo, S. Fluctuation of Local Field and Depolarization Ratio of the ν1 Raman Line of Carbon Tetrachloride in Carbon Disulfide Solution. Bull. Chem. Soc. Jpn. 1991, 64, 498–504. [Google Scholar] [CrossRef] [Green Version]
- Buldakov, M.A.; Cherepanov, V.N.; Korolev, B.V.; Matrosov, I.I. Role of intramolecular interactions in Raman spectra of N2 and O2 molecules. J. Mol. Spectrosc. 2003, 217, 1–8. [Google Scholar] [CrossRef]
- Wang, P.G.; Ziegler, L.D. Polarization analysis of the 266-nm excited resonance Raman spectrum of methyl iodide. J. Phys. Chem. 1993, 97, 3139–3145. [Google Scholar] [CrossRef]
- Yu, Y.; Lin, K.; Zhou, X.; Wang, H.; Liu, S.; Ma, X. Precise measurement of the depolarization ratio from photoacoustic Raman spectroscopy. J. Raman Spectrosc. 2007, 38, 1206–1211. [Google Scholar] [CrossRef]
- Rose, E.J.; Whitewolf, E.; Baglin, F.G. Isothermal density tuning of the depolarization ratios from the ν1 mode of methane. J. Chem. Phys. 1992, 97, 4596–4604. [Google Scholar] [CrossRef]
- Wright, M.; Murphy, T.; Baglin, F.G. Isosteric and isothermal studies of the Raman depolarization ratios in an argon-methane mixture at 298 K and 323 K. Mol. Phys. 1994, 82, 277–282. [Google Scholar] [CrossRef]
- Petrov, D. Depolarization Ratios of Methane Raman Bands as a Function of Pressure. Molecules 2020, 25, 1951. [Google Scholar] [CrossRef] [Green Version]
- Rose, E.J.; Baglin, F.G. Depolarization-density tuning in supracritical solutions of methane-carbon dioxide. Mol. Phys. 1994, 81, 1049–1058. [Google Scholar] [CrossRef]
- Rose, E.J.; Baglin, F.G. Isothermal Raman depolarization ratios of supracritical carbon monoxide at pressures between 20 and 2400 bar. J. Raman Spectrosc. 1994, 25, 791–793. [Google Scholar] [CrossRef]
- Baglin, F.G.; Sweitzer, S.; Stanbery, W. Raman light scattering from supracritical binary fluid mixtures: CH4/CF4. J. Chem. Phys. 1996, 105, 7285–7293. [Google Scholar] [CrossRef]
- Lemmon, E.W.; McLinden, M.O.; Friend, D.G. Thermophysical Properties of Fluid Systems. In NIST Chemistry WebBook, NIST Standard Reference Database Number 69; Linstrom, P.J., Mallard, W.G., Eds.; National Institute of Standards and Technology: Gaithersburg, MD, USA, 2021. [Google Scholar] [CrossRef]
- Brunsgaard Hansen, S.; Berg, R.W.; Stenby, E.H. Upgrade of a Raman spectrometer. Appl. Spectrosc. Rev. 2004, 39, 385–397. [Google Scholar] [CrossRef]
- Berger, H. Raman spectrum of 12CH4 between 2850 and 3100 cm−1. J. Mol. Spectrosc. 1977, 66, 55–61. [Google Scholar] [CrossRef]
- Qiu, Y.; Wang, X.-L.; Liu, X.; Cao, J.; Liu, Y.-F.; Xi, B.-B.; Gao, W.-L. In situ Raman spectroscopic quantification of CH4–CO2 mixture: Application to fluid inclusions hosted in quartz veins from the Longmaxi Formation shales in Sichuan Basin, southwestern China. Pet. Sci. 2020, 17, 23–35. [Google Scholar] [CrossRef] [Green Version]
- Fang, J.; Chou, I.-M.; Chen, Y. Quantitative Raman spectroscopic study of the H2–CH4 gaseous system. J. Raman Spectrosc. 2018, 49, 710–720. [Google Scholar] [CrossRef]
- Lamadrid, H.M.; Steele-MacInnis, M.; Bodnar, R.J. Relationship between Raman spectral features and fugacity in mixtures of gases. J. Raman Spectrosc. 2018, 49, 581–593. [Google Scholar] [CrossRef]
- Ba, Y.A.; Wenger, C.; Surleau, R.; Boudon, V.; Rotger, M.; Daumont, L.; Bonhommeau, D.A.; Tyuterev, V.G.; Dubernet, M.-L. MeCaSDa and ECaSDa: Methane and ethene calculated spectroscopic databases for the virtual atomic and molecular data centre. J. Quant. Spectrosc. Radiat. Transf. 2013, 130, 62–68. [Google Scholar] [CrossRef]
- Montero, S.; Bermejo, D. Electro-optical parameters and Raman intensities of CH4, CH3D, CH2D2, CHD3 and CD4. Mol. Phys. 1976, 32, 1229–1232. [Google Scholar] [CrossRef]
- Applequist, J.; Quicksall, C.O. Calculation of Raman scattering parameters for methane and halomethanes from an atom dipole interaction model. J. Chem. Phys. 1977, 66, 3455–3459. [Google Scholar] [CrossRef]
- Cantor, D.M.; Schroeder, J.; Jonas, J. Polarization Scrambling by Optical Windows Used for Light Scattering Experiments at High Pressures. Appl. Spectrosc. 1975, 29, 393–396. [Google Scholar] [CrossRef]
- Perry, S.; Sharko, P.T.; Jonas, J. Technique for Measuring the Amount of Pressure-Induced Polarization Scrambling by Optical Windows in High Pressure Light Scattering Cells. Appl. Spectrosc. 1983, 37, 340–342. [Google Scholar] [CrossRef]
- Schlösser, M.; James, T.M.; Fischer, S.; Lewis, R.J.; Bornschein, B.; Telle, H.H. Evaluation method for Raman depolarization measurements including geometrical effects and polarization aberrations. J. Raman Spectrosc. 2013, 44, 453–462. [Google Scholar] [CrossRef]
- James, T.M.; Schlösser, M.; Fischer, S.; Sturm, M.; Bornschein, B.; Lewis, R.J.; Telle, H.H. Accurate depolarization ratio measurements for all diatomic hydrogen isotopologues. J. Raman Spectrosc. 2013, 44, 857–865. [Google Scholar] [CrossRef]
- Teboul, V.; Godet, J.L.; Le Duff, Y. Collection Angle Dependence of the Depolarization Ratio in Light-Scattering Experiments. Appl. Spectrosc. 1992, 46, 476–478. [Google Scholar] [CrossRef]
- Long, D.A. The Raman Effect: A Unified Treatment of the Theory of Raman Scattering by Molecules; Wiley: Chichester, UK, 2002; pp. 153–216. [Google Scholar] [CrossRef]


| Parameter | Unit | Quantity |
|---|---|---|
| Laser output power | W | 5 |
| Laser wavelength | nm | 532.094 |
| Polarization ratio | unitless | >100:1 |
| Collection lens diameter (D1)/focal length (F1) | mm | 26.3/105 |
| Focusing lens diameter (D2)/focal length (F2) | mm | 46.7/210 |
| Distance between lenses (d) | mm | 250 |
| Spectrometer f-number | unitless | f/8 |
| Size of CCD chip | pixel | 2048 × 512 |
| Diffraction grating | line/mm | 2400 |
| Entrance slit height (h2)/width | mm | 4/0.03 |
| Half-width of instrument response function | cm−1 | 0.5 (at 2917 cm−1) |
| Spectral dispersion | cm−1/pixel | 0.12 |
Publisher’s Note: MDPI stays neutral with regard to jurisdictional claims in published maps and institutional affiliations. |
© 2021 by the authors. Licensee MDPI, Basel, Switzerland. This article is an open access article distributed under the terms and conditions of the Creative Commons Attribution (CC BY) license (https://creativecommons.org/licenses/by/4.0/).
Share and Cite
Tanichev, A.S.; Petrov, D.V. Depolarization Ratio of the ν1 Raman Band of Pure CH4 and Perturbed by N2 and CO2. Molecules 2022, 27, 144. https://doi.org/10.3390/molecules27010144
Tanichev AS, Petrov DV. Depolarization Ratio of the ν1 Raman Band of Pure CH4 and Perturbed by N2 and CO2. Molecules. 2022; 27(1):144. https://doi.org/10.3390/molecules27010144
Chicago/Turabian StyleTanichev, Aleksandr S., and Dmitry V. Petrov. 2022. "Depolarization Ratio of the ν1 Raman Band of Pure CH4 and Perturbed by N2 and CO2" Molecules 27, no. 1: 144. https://doi.org/10.3390/molecules27010144
APA StyleTanichev, A. S., & Petrov, D. V. (2022). Depolarization Ratio of the ν1 Raman Band of Pure CH4 and Perturbed by N2 and CO2. Molecules, 27(1), 144. https://doi.org/10.3390/molecules27010144